Influence of groundwater level changes on the seismic response of geosynthetic-reinforced soil retaining walls
2022-11-30FeifanRENQiangqiangHUANGXueyuGENGGuanWANG
Fei-fan REN ,Qiang-qiang HUANG ,Xue-yu GENG ,Guan WANG
1Key Laboratory of Geotechnical and Underground Engineering of Ministry of Education,Department of Geotechnical Engineering,Tongji University,Shanghai 200092,China
2School of Engineering,University of Warwick,Coventry CV4 7AL,UK
3School of Environment and Architecture,University of Shanghai for Science and Technology,Shanghai 200093,China
Abstract: Geosynthetic-reinforced soil retaining walls(GSRWs)have been widely used in civil engineering projects.However,as the climate changes,extreme weather conditions and natural hazards are likely to become more frequent or intense,posing a huge threat to the stability of GSRWs.In this paper,the effect of groundwater level fluctuations on the seismic response of GSRWs is investigated.First,a dynamic numerical model was established and validated through centrifugal shaking-table test results.Using the established numerical model,the seismic response of GSRWs under four different groundwater level conditions was then investigated,i.e.,an earthquake occurring at a low groundwater level (Case LW),an earthquake occurring when the groundwater level rises (Case RW),an earthquake occurring at a high groundwater level (Case HW),and an earthquake occurring when the groundwater level drops(Case DW).The results show that the GSRW in Case DW has the worst seismic stability because of the drag forces generated by the water flowing to the outside of the GSRW.For Case RW,deformation of the GSRW under earthquake forces was prevented by the drag forces generated by the water flowing to the inside of the GSRW and the water pressure acting on the outside of the facing,giving the GSRW the best seismic stability in this case.Compared with Case LW,the seismic stability of a GSRW in Case HW is worse,because the high groundwater level will generate excess pore-water pressure during an earthquake.On this basis,we provide engineering design suggestions to be considered by practitioners.
Key words: Geosynthetic-reinforced soil retaining walls(GSRWs);Groundwater level;Earthquake;Stability analysis
1 Introduction
As a robust retaining structure,geosyntheticreinforced soil retaining walls (GSRWs) have been increasingly used in civil infrastructure earthworks because of their economic benefits,high stability,ecological friendliness,and aesthetic appearance (Chen et al.,2016;Karpurapu,2017;Zhang et al.,2019).Within the designed service life,changes in the external conditions,especially with more severe weather and natural hazards such as rainstorms,freeze-thaw cycles,earthquakes,and rockfall,may all impact GSRWs’ultimate limit state(ULS)and service limit state(SLS),leading to the possibility of catastrophic failures (Qiu et al.,2022,Zhao et al.,2022).Of the above-mentioned undesirable conditions,rainfall and earthquakes are the two most common natural disasters that adversely affect geotechnical engineering (Ren et al.,2020).Large amounts of rain can easily induce enormous rises in groundwater levels during intense rainstorms,as shown in Fig.1,posing a serious threat to the stability of GSRWs.As explained by Alamanis et al.(2021),moisture content has a key impact on the geotechnical behavior of soils.One of the worst cases is the tsunami,which is commonly induced by earthquakes and floods a large amount of water in a short period of time,causing rapid changes in the groundwater level.Therefore,the seismic stability of GSRWs under the impact of changing groundwater levels is critical.
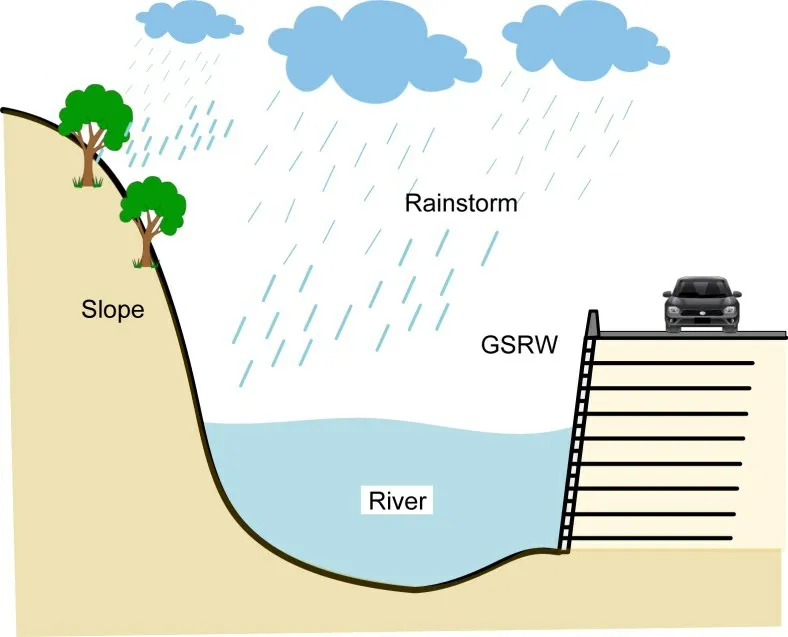
Fig.1 Groundwater level changed by a rainstorm
In recent years,earthquake disasters have occurred more frequently,resulting in massive economic losses,destruction of numerous infrastructures,and casualties.In comparison to traditional concrete structures,GSRWs often perform much better during earthquakes because of their structural flexibility.For example,the 2011 Tohoku earthquake off the Pacific coast of Japan triggered a tremendous tsunami and caused extensive damage to various structures.Kuwano et al.(2014)carried out a post-disaster investigation of more than 1600 GSRWs and found that they had good dynamic stability.Not only were less than 1%of them seriously damaged,but also more than 90%showed no sign of any damage at all.Moreover,even though some GSRWs were completely submerged by the tsunami,they were still able to maintain their stability.Extensive data have been gathered on the dynamic characteristics of GSRWs through post-disaster surveys (Huang,2000;Ling et al.,2001;Koerner and Koerner,2013),model tests(Ling et al.,2005b;Xu C et al.,2020;Xu P et al.,2020),and numerical simulations (Ren et al.,2016,2018;Bathurst and Hatami,1999;Lai et al.,2020).However,there are few studies that consider the influence of groundwater level changes,which commonly occur,especially during earthquakes,and even fewer that consider the combined effect of groundwater level changes and earthquake impacts.To investigate the seismic stability of GSRWs with different soil water contents,Izawa and Kuwano (2008) conducted centrifuge shaking table tests on walls in saturated and unsaturated states by adjusting the height of the waterline.They found that the residual deformation of unsaturated GSRWs was much smaller than that of saturated walls.Vali et al.(2018) studied the influence of groundwater level changes on the stability of geogrid-reinforced marine slope using the finite element method.The results showed that the groundwater level had a significant effect on the behavior of the embankment.As the groundwater level declined,the safety factor of the geogrid-reinforced marine slope increased,and the safety of the retaining wall could be improved by increasing the length,layer number,and tensile strength of the geogrid.Ghiasi and Farzan (2019) also reported their research on the behavior of GSRWs under different groundwater conditions,in which the overall stability of GSRW decreased with the rise of groundwater level.The effect of groundwater on the wall’s behavior was significant at a distance between 0 to 1 m below the wall.However,in this study,the surface of the groundwater was below the GSRW,and the situation of groundwater rising above the ground was not considered.For the purpose of evaluating seismic behaviors of an unsaturated soil slope at various groundwater levels,Huang et al.(2021) proposed a simple approach for calculating the excess porewater pressure induced by the earthquake.By means of its custom interface,this approach is importable to numerical simulation software.Based on this,the seismic performance of the unsaturated soil slope was studied.It was observed that the seismic performance of slopes varied greatly with different groundwater levels;the slope deformation was greatly increased with high groundwater levels,while groundwater reduced slope vibration.Bian et al.(2021) studied the response of pile groups in silty soils subjected to repeated declining of groundwater level through a centrifugal test and numerical analyses.The results showed that the declining of groundwater level significantly increased the down-drag and axial force of the pile,causing significant settlement.To investigate how groundwater levels and their fluctuations in the slope would affect the serviceability and ULS criteria,Gashaw and Murali Krishna(2022)performed some research using a finite element modeling program called ‘RS2-Rocscience’.The results of numerical modeling showed that increases in the groundwater level decreased the critical factor of safety and increased horizontal deformation and peak axial force on the nails.In addition,in the case of unsaturated soils,the nails at the top were in a compressed state due to the presence of groundwater and the increase in stability was provided only by the lower nails.Ren et al.(2022) conducted three centrifuge shaking table tests at 30g(gdenotes the acceleration of gravity)to investigate the performance of GSRWs subjected to the combined effect of earthquake and rainfall.The results showed that unsaturated walls had the best dynamic stability and that the deformation and failure modes of unsaturated and saturated GSRWs were completely different in terms of seismic load.
In conclusion,most existing studies only investigated the single factor of groundwater level changes on the stability of various structures and rarely considered the multiple factors of earthquakes and groundwater level changes.Furthermore,the effects of different groundwater level change processes on the seismic stability of GSRWs have not been reported.Therefore,to investigate the influence of groundwater level changes on seismic response of GSRWs,in this study we established a dynamic finite element model (FEM) using Plaxis 2D (Brinkgreve et al.,2016),and validated it with a centrifuge shaking table test on a saturated GSRW.We considered a continuous change process with four different groundwater level conditions,namely low water level,rising of water level,high water level,and declining water level,denoted as Cases LW,RW,HW,and DW,respectively.The Kobe earthquake wave with a peak acceleration of 0.4gwas used as the input wave.Finally,we conducted a systematic analysis of the deformation of GSRWs,porewater pressure,acceleration response,and tensile forces of reinforcements in order to evaluate the mechanical properties of GSRWs.Suggestions are provided to improve the stability of GSRWs under the combined effects of groundwater level changes and earthquake conditions.
2 Brief description of centrifuge model tests
Three centrifugal shaking table tests were conducted on GSRWs at 30gby Ren et al.(2022)to investigate the combined effects of earthquakes and rainfall on the stability of GSRWs.The height of the wall and foundation of the centrifuge model were 200 mm and 50 mm,respectively.A natural dry quartz sand was selected as the backfill and foundation soil;this is a clean sand with a value ofD50(median particle size) to be 0.04 mm,a maximum dry densityρmaxof 1.768 g/cm3,and a minimum dry densityρminof 1.206 g/cm3.The permeability coefficientKis 5.5×10⁻⁵m/s,and the sand was compacted in layers to reach 85% and 90%of the relative compaction for the backfill and foundation,respectively.Based on the similarity criterion,an acrylic plastic panel was used to model the facing panel,which was 25 mm in height and 10 mm in width.A type of white polyamide netting fabric with an aperture size of 1 mm×1 mm was used as the geogrid reinforcement,with a length of 150 mm and a vertical spacing of 25 mm between two layers.To reduce the influence of reflected waves during shaking on the experimental results,two expanded polystyrene boards(EPSs)of 2-mm thickness were placed on the left and right sides of the model box.
There were two stages in the centrifuge model test design,and three different conditions were simulated in the first stage,namely post-rainfall earthquake,rainfall and earthquake occurring simultaneously,and post-earthquake rainfall,denoted as Test-1,Test-2,and Test-3,respectively.Since no significant deformation of the retaining wall occurred in the first stage,the second stage was mainly to investigate the damage mode of the GSRW under different water content conditions by applying continuous earthquakes.In the second stage of Test-3,the failure model under the saturated state was investigated under continuous rainfall until the wall was completely saturated,and then the seismic load was applied repeatedly until the wall failed.Hence,this case will be employed for validation in this study.The saturated wall in the centrifuge shaking table test is shown in Fig.2.In addition,a Kobe wave with a peak acceleration of 9gwas used as an input wave in the centrifugal tests;this is equivalent to a 0.3gseismic wave under real conditions.A detailed description of the centrifuge test and the analysis of the results can be found in(Ren et al.,2022).

Fig.2 Saturated wall in the centrifuge shaking table test
3 Description and validation of finite element model
3.1 Description of finite element model
A 2D dynamic FEM was established with Plaxis 2D to simulate the aforementioned centrifuge shaking table test.In the numerical model,we built a GSRW model with a height of 6.0 m and foundation thickness of 1.5 m,which was consistent with the prototype.The length of the geogrid reinforcement was 4.5 m,with a vertical spacing of 0.75 m between layers.Two expanded polystyrene boards were placed at the front and back ends of the GSRW to absorb incident waves reflected from the model box.For the model boundary conditions,the two sides were assumed to be fixed in the horizontal dimension and the bottom was assumed to be completely fixed.The water-level line was set at the top of the wall to simulate full saturation of the retaining wall.Detailed information for the GSRW and FEM mesh is shown in Fig.3.We used the Mohr-Coulomb model to describe the behavior of the backfill soil and foundation soil.The facing panels and EPS boards were modeled using a linear elastic model and the reinforcements were modeled with geogrid elements that only bear tensile force.The specific parameter values of these materials obtained from the experimental results are listed in Table 1.In addition,to simulate the interface between two structures,interface elements were used.The degree of interaction is controlled by the strength reduction factorRinter.Referring to empirical values of reinforced soil structure interfaces (Gogoi and Bhattacharjee,2022),we set theRintervalues for the interfaces between facing panel-facing panel and soil-geogrid to be 0.65 and 0.60,respectively.All interface elements allowed water to flow freely.
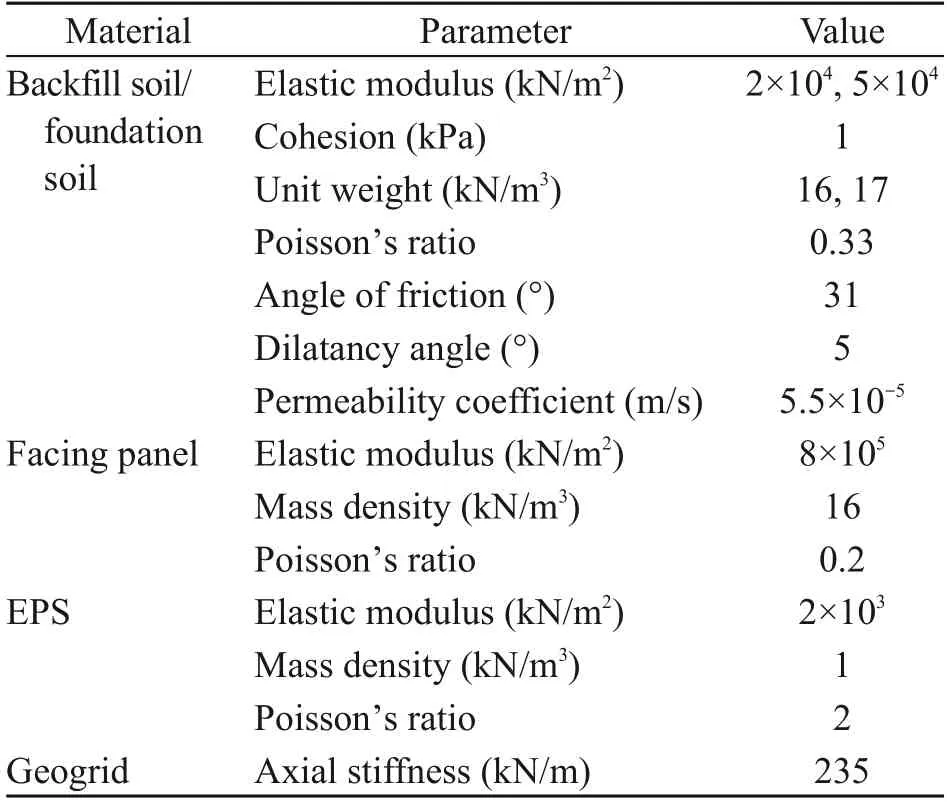
Table 1 Material properties of the finite element method
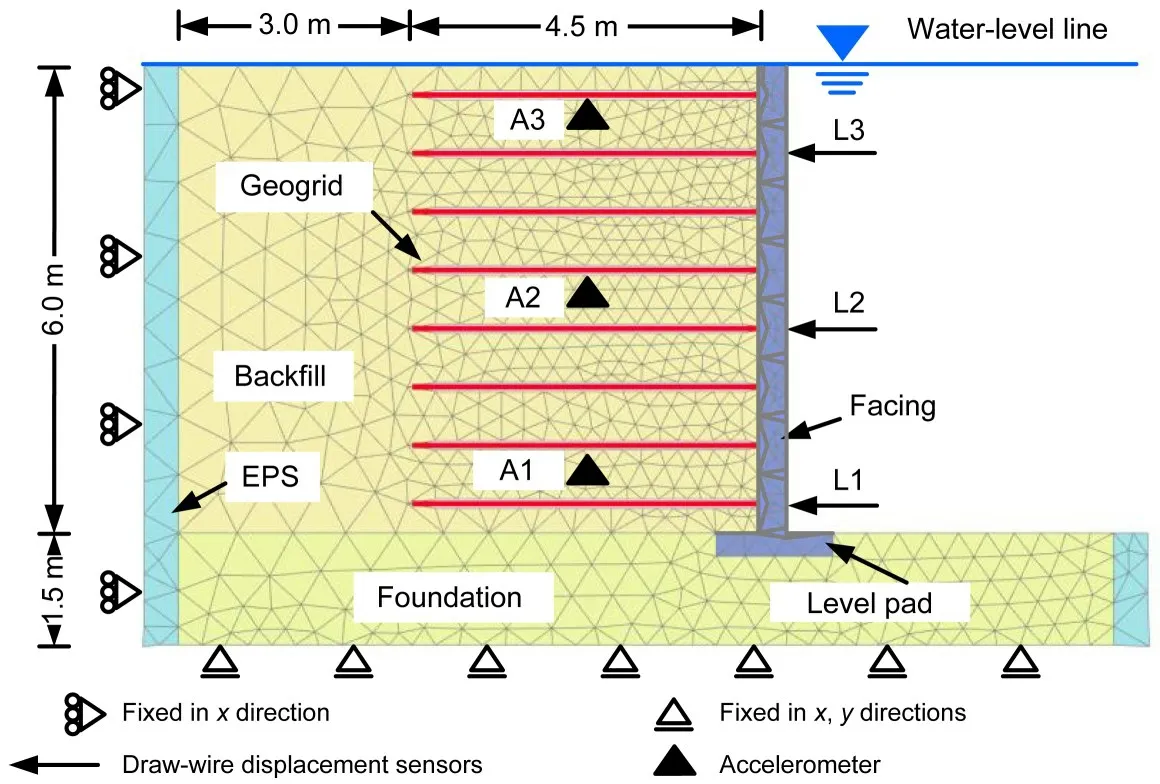
Fig.3 FEM mesh used in the simulation centrifuge shaking table test
3.2 Horizontal displacement along the facing wall
Horizontal displacement is a very important index for assessing a GSRW’s seismic performance.Fig.4 shows the distribution of residual horizontal displacement along the facing wall at the end of the first shaking.It can be seen that the maximum horizontal displacement of the GSRW occurred at the middle of the wall both in the experimental test and the numerical simulation,and that the numerical analysis agreed with the experimental test results.Although the experimental test results were slightly smaller than those from numerical analysis,this error is tolerable.The frictional force on both sides of the model box in the experimental test,which was absent in the numerical simulation,could be the cause of this error.
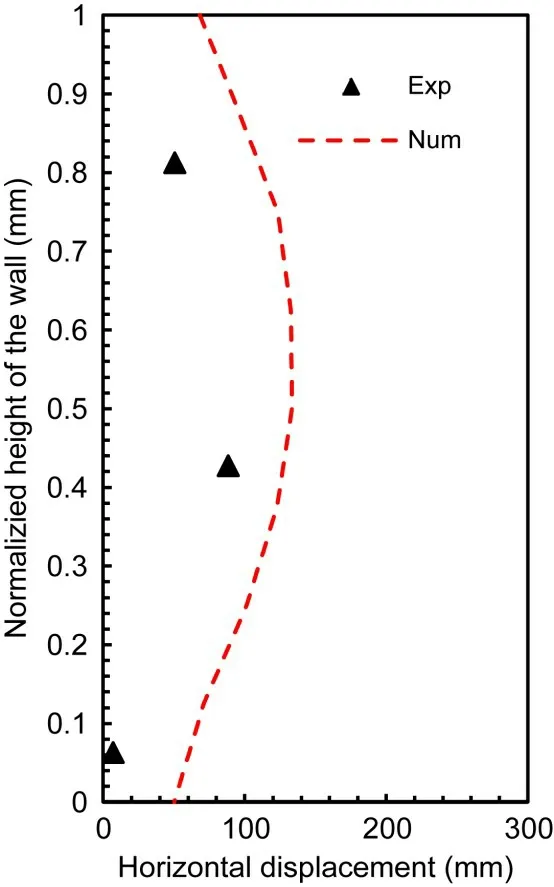
Fig.4 Distribution of residual horizontal displacement along the facing wall
3.3 Top surface settlement of the wall
Fig.5 shows a comparison of the wall-top surface settlement between the experiment and numerical analysis.The experimental results were obtained based on the digital imagine correlation(DIC)method.Although the experimental settlement was slightly smaller than that in the numerical analysis due to the boundary effects,the numerical analysis results are still acceptable.This is similar to the findings for horizontal displacement.
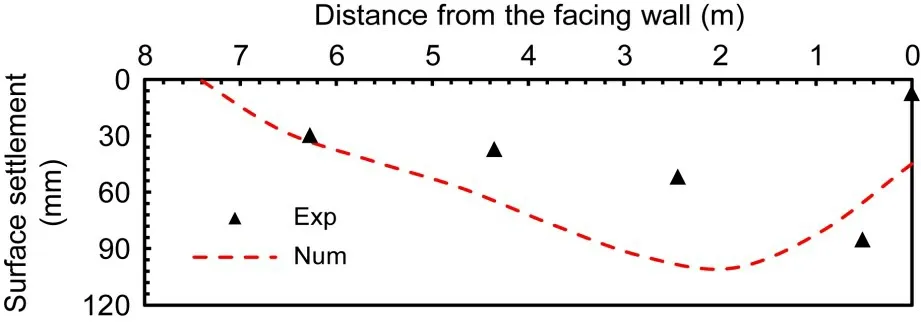
Fig.5 Top surface settlement of the wall
3.4 Responding accelerations
Fig.6 shows a comparison of the response accelerations at points A1,A2,and A3 with various elevations in the reinforced soil region,the locations of which can be found in Fig.3.The accelerations obtained from the experimental test and numerical simulation coincide well with each other.Therefore,the accuracy of the dynamic FEM analysis performed in this study can be determined to be relatively high.
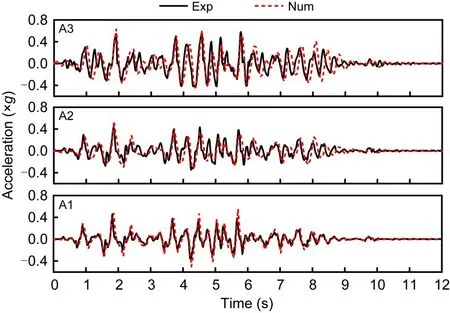
Fig.6 Acceleration responses in reinforced soil area
4 Numerical models for realistic conditions
In numerical simulation,the boundary condition is a crucial component that has a significant impact on the accuracy of numerical results.Many numerical models that simulate model tests in a rigid model box use a typical boundary condition,as shown in Fig.3,with both sides fixed in the horizontal direction and the bottom completely fixed.However,this typical boundary condition hardly ever exists in reality.To better simulate the seismic characteristics of GSRWs under realistic conditions,we considered free-field and compliant base boundary conditions in this study.Freefield and compliant base boundaries are composed of free-field and compliant base elements,which belong to interface elements and were set on both sides of the model and the bottom of the foundation.These interface elements were connected with the soil through the damper,and their mechanical properties were the same as those of the adjacent soil.They were able to transfer far-field motion to the soil in the form of equivalent normal stress and shear stress in the near field.The normal stress and shear stress of the free-field boundary are given by Eqs.(1)and(2),respectively.whereρis the density of the soil,C1andC2are the normal and tangential relaxation coefficients,VpandVnare compressional and shear-wave velocities related to material density and elastic constants,andandare the relative velocities of nodes in the model boundary and the free-field elements in thexandydirections,respectively.

The compliant base boundary is based on the freefield boundary,taking into consideration the effect of earthquakes (which can only be used at the bottom boundary of the model).Its normal stress and shear stress are expressed in Eqs.(3) and (4).The parameters ofandhere are the velocities in thexandydirections propagating downward and upward on the boundary,respectively.

In addition,in order to minimize the influence of boundary effects,two layered fields of 26 m and 20 m were added to the left and right sides of the analytical domain,respectively,and the height of the foundation was 10 m.Since the size of the entire model was too large,only the results from the area in the dashed box shown in Fig.7 were selected for analysis.All the material parameters for the backfilled soil,reinforcement,and interfaces were set to be the same as the analyses in Section 3,as shown in Table 1.The detailed FEM of the GSRW is shown in Fig.7.
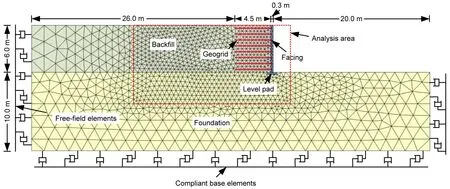
Fig.7 FEM mesh used in numerical simulation analysis
To explore the influence of groundwater level change on the seismic response of GSRWs,we investigated four different groundwater level conditions,as indicated in Table 2.These various groundwater level changes are continuous processes (Fig.8) which represent the change of groundwater level inside the GSRWs before and after the external level rises and falls.For Case LW,the groundwater level was at a low level of 0 m.When the external water level started to rise,and rapidly rose by 5 m in 1 d,but the groundwater level within the soil away from the wall facing remained at 0 m,this was another case called Case RW.When the external water table remained at a high level,the groundwater level inside the GSRW eventually reached a high level of 5 m and remained in line with the water level outside the wall,this was called Case HW.When the external water table started to fall and dropped to 0 m within 1 d,while the groundwater level within the soil away from the wall facing remained at a high level,this was named Case DW.It should be noted that in all cases,only one earthquake was applied and it occurred after groundwater level changes had stopped.That is to say,although the groundwater level changes were a continuous process,the earthquakes were independent of each other,and the deformation of the GSRW was reset to 0 mm before each earthquake,while the stress state did not change.
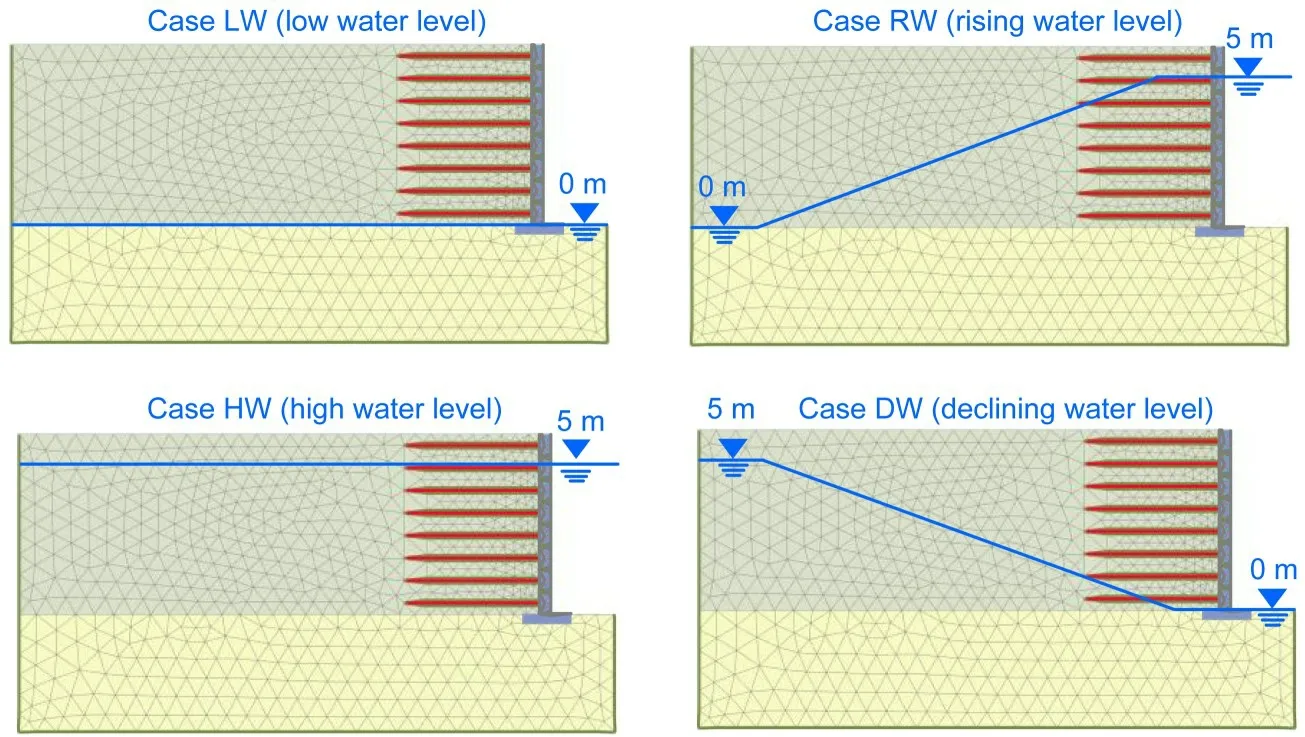
Fig.8 Processes of groundwater level changes

Table 2 Four different groundwater level conditions
5 Analysis of results
5.1 Deformation caused by groundwater level change
The deformation of GSRWs in this study was caused by two factors: one was groundwater level change and the other was earthquake.As mentioned in Section 4,groundwater level changes only occurred in Cases RW and DW,so the deformation of GSRWs due to groundwater level changes in these two conditions was considered.Fig.9 shows the deformation mesh at the end of different groundwater level changes.For Case RW,the maximum deformation of the GSRW was 7.4 mm from the low water level to the rising water level,and the resulting deformation mesh is shown in Fig.9a.It can be clearly seen that the wall facing bends inward,which is caused by the water pressure generated by the rise of the external water level and the drag forces of groundwater flowing from the outside to the inside of the GSRW.Fig.9b shows the deformation mesh for Case DW,in which the groundwater changed from a high level to a decline.The maximum deformation is 256 mm,much larger than that in Fig.9a.This is because as the external water table drops,the groundwater inside the wall seeps outwards,and the drag force from the flowing water will further exacerbate the GSRW’s deformation.

Fig.9 Deformation mesh at the end of different groundwater level changes:(a)enlarged 100 times;(b)enlarged 5 times.Dashed and solid lines represent the initial and final groundwater levels,respectively,and the duration of all groundwater level changes is one day
5.2 Deformation caused by the earthquake
Fig.10 shows the deformation nephograms for the four different groundwater level conditions at the end of the earthquake.As mentioned in Section 4,the GSRW deformation was reset to 0 mm before each earthquake,meaning that the deformation was only caused by the earthquake.It can be seen that the deformation was large in Cases HW and DW,but not obvious in Case RW.The largest deformation of Case HW was located in the upper part of the GSRW,while almost the entire wall had large deformation in Case DW.This indicates that local failure may occur in GSRWs in Case HW and overall slide failure may occur in Case DW in the limit state.In Case RW,since the water pressure induced by rising water levels prevented the deformation of the wall facing,the overall stability of the GSRW was greatly improved.
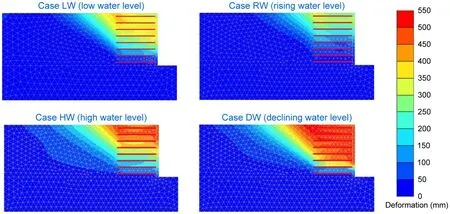
Fig.10 Deformation nephograms at the end of the earthquake
5.3 Total horizontal displacement and top surface settlement
The total displacement and settlement are caused by the combined action of groundwater level changes and earthquake.The distribution of horizontal displacement along the facing under four different groundwater level conditions is shown in Fig.11.The horizontal displacement in Case DW was by far the largest,reaching 694 mm.Therefore,it is evident that GSRWs in Case DW have the worst seismic stability.In contrast,the GSRW in Case RW has the best seismic stability,with a maximum horizontal displacement of 303 mm,less than half of that of Case DW.As expected,the horizontal displacement of Case LW was smaller than that of Case HW,because a high groundwater level brings greater pore-water pressure,which reduces soil strength.Moreover,it should be noted that the horizontal displacement of the toe of the GSRW in Case DW was 166 mm,indicating that the wall had an overall sliding motion;this is consistent with the analysis in Section 5.2.The horizontal displacement increments were mainly located at the lower part of the facing.For Cases LW,RW,and HW,the horizontal displacement of the toe of the GSRW was almost zero,indicating that no overall sliding of the GSRW occurred in these cases.
The top-surface settlement distribution of the GSRW under different groundwater level conditions is shown in Fig.12.There was a large settlement in Case DW and a small one in Case RW.The settlement in Case LW was slightly smaller than that in Case HW.The law of top-surface settlement deformation is consistent with the horizontal deformation shown in Fig.11.It is worth noting that the maximum topsurface settlement was located at the end of reinforcement in all cases due to the stiffness difference between the reinforced and unreinforced soil zones.Some previous studies have also noted this phenomenon (Ling et al.,2005a;Ren et al.,2022).
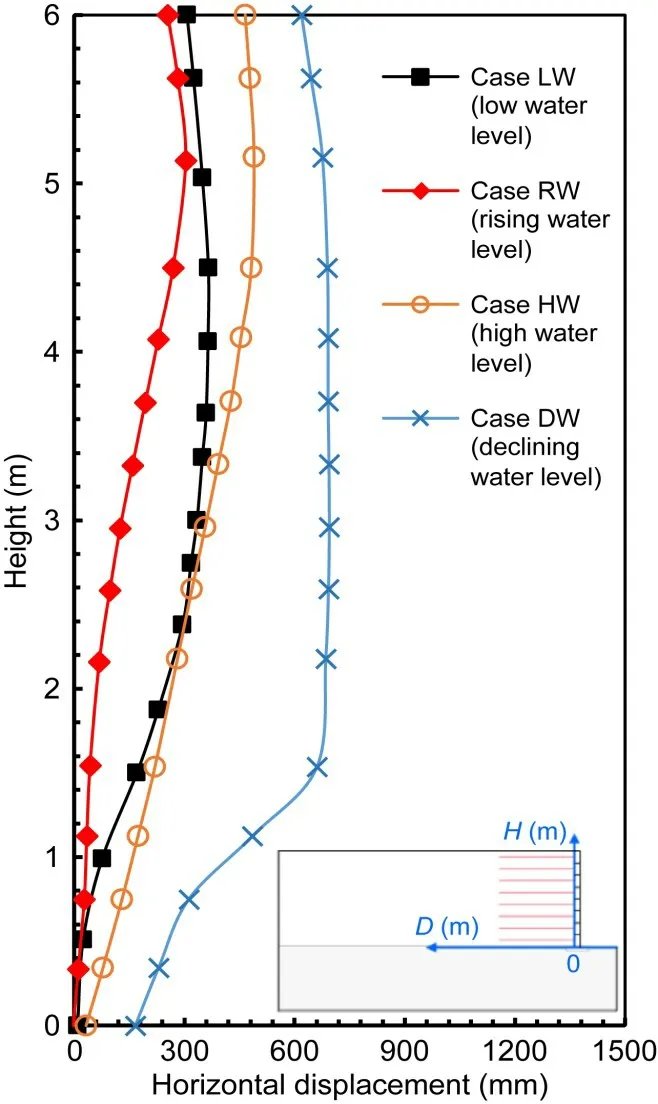
Fig.11 Distribution of the total horizontal displacement(D)along the facing
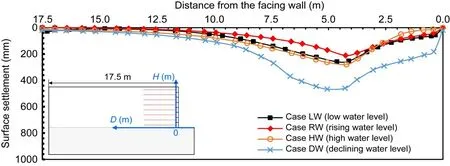
Fig.12 Distribution of top-surface settlement
5.4 Pore-water pressure
Pore-water pressure has a great influence on soil strength.Fig.13 shows the distribution of pore-water pressure under four different groundwater level conditions before the earthquake.It is well known that porewater pressure is related to the height of the groundwater level,so the pore-water pressure was smaller in Case LW and larger in Case HW.This is one of the reasons why the deformation in Case HW was larger than that in Case LW.Although the groundwater level in front of the facing in Case RW reached 5 m,only the part below the foot of the wall had high pore-water pressure,while the pore-water pressure inside the GSRW was still zero.The inward drag forces due to flowing water from the outside of the GSRW,and the water pressure acting on the facing,prevented deformation of the GSRW under the earthquake,which explains the minimum deformation in Case RW.The pore-water pressure at the lower part of the GSRW and the drag forces due to water flowing from the inside to the outside of the GSRW caused the maximum deformation in Case DW.
According to the effective stress principle,the excess pore-water pressure generated during earthquake will further weaken the soil.We analyzed the excess pore-water pressure at pointDbetween the first and second layers of reinforcement,as shown in Fig.14.However,the pore-water pressure at pointDin Cases LW,RW,and DW was zero or very low,as shown in Fig.13,so the excess pore-water pressure during the earthquake was almost zero.Only the time history of excess pore-water pressure of Case HW at pointDis given here (Fig.14).We found that there was excessive pore-water pressure change during the earthquake,which further reduced the stability of the GSRW in Case HW.This is also an important cause of the large deformation of the GSRW in Case HW.
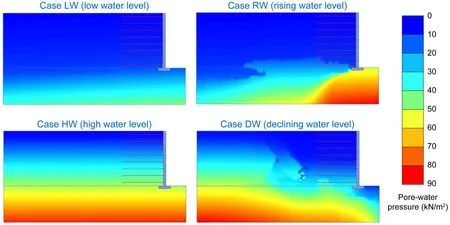
Fig.13 Distribution of pore-water pressure under four different groundwater level conditions
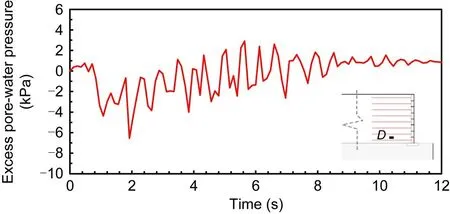
Fig.14 Time history of excess pore-water pressure at point D in Case HW
5.5 Suction force
The effect of suction force,which is related to soil water content,on GSRW stability cannot be ignored,because the most direct effect of groundwater level changes is to change the soil moisture content.Fig.15 shows the distribution of suction force under different groundwater level conditions before earthquake.It is not difficult to discern that the suction force in Cases LW and RW was much greater than that in Cases HW and DW;this corresponds to the deformation in Cases LW and RW being smaller than that in Cases HW and DW,as shown in Fig.10.Compared with Cases LW and HW,the groundwater level in front of the GSRW’s facing in Cases RW and DW rose and fell by 5 m in one day,respectively,but the suction force did not change significantly.This indicates that the soil moisture content did not change much within a short period of time after the change in the groundwater level.
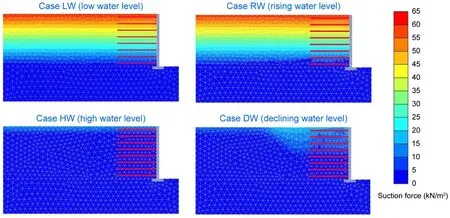
Fig.15 Distribution of suction force under four different groundwater level conditions
5.6 Response accelerations
The acceleration of the input wave and the response acceleration of pointA(Fig.16a) under the four different groundwater level conditions are shown in Figs.16b–16f.The acceleration amplified factor(AAF),which is the ratio of peak accelerations at pointAto the peak acceleration of input shaking motion,is an important index for evaluating seismic response.We found that the AAFs of Cases LW and HW were 1.04 and 1.00,while the AAFs of Cases RW and DW were 1.39 and 0.93,respectively.These results indicate that changes in soil moisture content have little effect on AAF,while the effect of groundwater level change on AAF is more obvious.The main reason may be that the drag forces due to flowing water from the outside to the inside of GSRW in Case RW and the water pressure acting on the outside of the facing are both squeezing the soil,so the GSRW is deformed inward,as shown in Fig.9a.This enhances the strength of the GSRW,thereby heightening its ability to transmit seismic energy.For Case DW,the drag forces due to water flowing from inside the GSRW to the outside damaged the structure of the wall and caused a larger outward deformation,as shown in Fig.9b;this reduced the ability of the GSRW to transmit seismic energy.
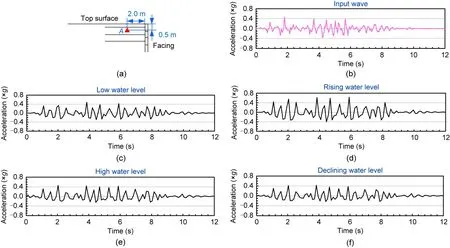
Fig.16 Response accelerations at point A of the GSRWs: (a) location of point A;(b) input wave;(c) Case LW;(d) Case RW;(e)Case HW;(f)Case DW
We also examined in detail Fourier spectra of the input wave and the response accelerations at pointAof the GSRWs under four different groundwater level conditions.Fig.17 shows the comparison of Fourier spectra of all response accelerations during earthquake.It can be seen that all cases displayed several different resonance frequencies and were consistent with the input wave,resulting in a large amplification of the response waves around these frequencies.
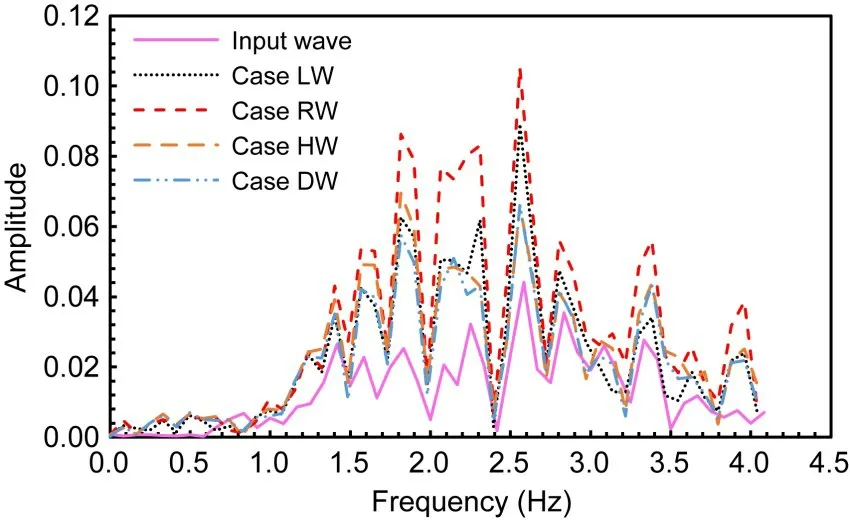
Fig.17 Fourier spectra of response accelerations at point A of the GSRWs
5.7 Reinforcement tensile force
To clarify the reinforcement effect,we plotted tensile forces along the geogrids at different heights at the end of earthquake in all cases(Fig.18).Compared to the other three cases,the tensile forces in Case DW were the largest,implying that the reinforcement effect was significantly mobilized.Because the reinforcement can only bear the tensile pressure,the drag forces of groundwater to the outside of the facing will tend to pull the reinforcements outward,thus increasing the tensile force of reinforcements that are required to maintain the stability of the GSRW.Meanwhile,the tensile force value is closely related to the wall deformation.Therefore,the maximum tensile force in Case DW was located at the lower part of the retaining wall,which corresponds to the location of the largest horizontal displacement increments along the facing,as shown in Fig.11.This is also why the tensile force of reinforcement in Case RW was so small,because the direction of drag forces due to flowing water is opposite to that in Case DW;the drag forces will squeeze the soil,thus weakening the tensile force of the reinforcements.The tensile force in Case HW was slightly larger than that in Case LW,especially in the upper part of the GSRW,which corresponds to the deformation(Fig.10).
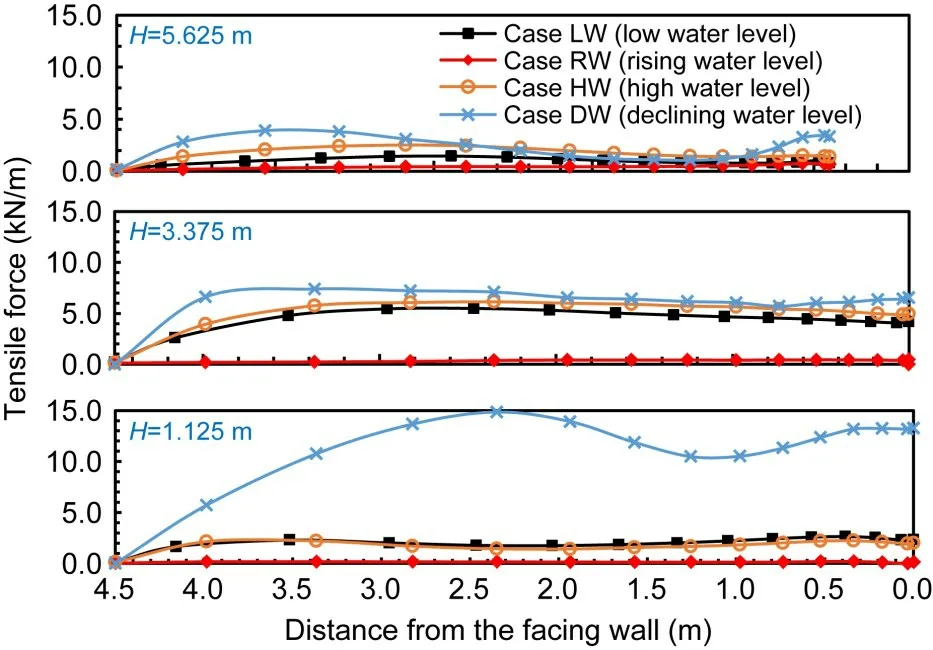
Fig.18 Distribution of geogrid tensile forces at different heights at the end of earthquake
6 Conclusions
In this study,we established a dynamic FEM and verified its validity with a centrifuge shaking table test on a saturated GSRW.On this basis,we were able to investigate the influence of groundwater level changes on the seismic response of GSRWs,looking specifically at four different groundwater level conditions as a continuous change process.Based on the obtained results,the following conclusions can be drawn:
1.The seismic stability of GSRWs is the worst when there is a rapid decline in groundwater level,because the drag forces generated by the water flowing from the inside to the outside of the GSRW damage the structure of the wall and cause a larger outward deformation.In addition,the moisture content of the soil remains high after the groundwater drops in a short period of time,resulting in small suction force in the GSRW.
2.GSRWs have the best seismic stability when the water table is rising,because the water pressure induced by the rising water level acts on the outside facing,preventing the retaining wall from deforming outwards.The drag forces generated by water flowing into the wall from the outside of the facing and the larger suction force in the GSRW further improve the seismic stability of this type of wall.
3.Compared with Case LW,the GSRW deformation in Case HW at the end of the earthquake is more significant,as the high groundwater level leads to excessive pore-water pressure during earthquakes,which weakens the soil strength.
4.The stability of a GSRW is seriously threatened when large amounts of water are present in the wall.Therefore,we recommend that coarse-grained soils with good drainage properties should be used as backfill for GSRWs,and that the drainage design of the structure be carefully considered.
Acknowledgments
This work is supported by the National Natural Science Foundation of China (No.41877224),the China Scholarship Council(No.202006265003),and the National Key Research and Development Program of China(No.2019YFC1509900).
Author contributions
Fei-fan REN designed the research,processed the corresponding data,and organized the manuscript.Qiang-qiang HUANG wrote the first draft of the manuscript.Xue-yu GENG revised and edited the final version.Guan WANG helped debug the cases in the research and provided the project administration.
Conflict of interest
Fei-fan REN,Qiang-qiang HUANG,Xue-yu GENG,and Guan WANG declare that they have no conflict of interest.
杂志排行
Journal of Zhejiang University-Science A(Applied Physics & Engineering)的其它文章
- Visualizing the dynamic progression of backward erosion piping in a Hele-Shaw cell
- Evaluation of heavy roller compaction on a large-thickness layer of subgrade with full-scale field experiments
- Frozen sand–concrete interface direct shear behavior under constant normal load and constant normal height boundary
- Shaking table tests on a cantilever retaining wall with reinforced and unreinforced backfill
- Model test of the mechanism underpinning water-and-mud inrush disasters during tunnel excavation in sandstone and slate interbedded Presinian strata
- Soil effect on the bearing capacity of a double-lining structure under internal water pressure
