Relationship between Vegetation Index and Forest Surface Fuel Load in UAV Multispectral Remote Sensing
2022-11-28YufeiZHOUZhenshiWANGYingxiaZHONGQiangLIShujingWEISishengLUOZepengWURuikunDAIXiaochuanLI
Yufei ZHOU, Zhenshi WANG, Yingxia ZHONG, Qiang LI, Shujing WEI, Sisheng LUO, Zepeng WU, Ruikun DAI, Xiaochuan LI
Guangdong Academy of Forestry, Guangdong Provincial Key Laboratory of Silviculture, Protection and Utilization, Guangzhou 510520, China
Abstract [Objectives]To explore the relationship between vegetation index and forest surface fuel load.[Methods]UAV multispectral remote sensing was used to obtain large-scale forest images and obtain structural data of forest surface fuel load.This experimental area was located in Gaoming District, Foshan City, Guangdong Province.The average surface fuel load of the experimental area was as high as 39.33 t/ha, and the forest surface fuel load of Pinus elliottii was the highest.[Results]The normalized difference vegetation index(NDVI)and enhanced vegetation index(EVI)had a moderately strong correlation with the forest surface fuel load.The regression model of NDVI(X)and forest surface fuel load(Y)was established: Y=-5.935 4X+8.466 3, and the regression model of EVI(X)and forest surface fuel load(Y)was established: Y=-5.848 5X+6.727 1.The study also found that the linear relationship between NDVI and surface fuel load was more significant.[Conclusions]Both NDVI and EVI have moderately strong correlations with forest surface fuel load.NDVI is moderately or strongly correlated with the surface fuel load of Pinus massoniana forest, shrub grassland, broad-leaf forest and bamboo forest, while EVI is only strongly correlated with surface fuel load of broad-leaf forest and bamboo forest.It is expected that the relationship between other vegetation indices and forest surface fuel load can be obtained by the method in this study, so as to find a more universal vegetation index for calculating surface fuel load.
Key words Unmanned aerial vehicle(UAV), Multispectral remote sensing, Vegetation index, Fuel load
1 Introduction
Forest fuel is the material basis for forest fires[1-2].When analyzing whether forests can be ignited and studying how forest fires spread and other forest fire behaviors, the fuel is a crucial factor[3-4].The size of the fuel load directly affects the forest fire behavior such as the burning intensity, flame height, and spreading speed[4-5].However, the survey of forest fuel load is highly specialized and is subject to the geographical environment, and the field collection workload is large.What’s more, work is difficult to implement when a forest fire occurs.
With the aid of satellite images, aerial photos and other multispectral remote sensing data, we can obtain large-scale forest images, to provide the possibility to reduce field survey[6].With the continuous improvement in the theory of remote sensing technology, the remote sensing data has become more accurate and clear, and using UAV to carry multispectral scanners to survey forest fuel has become a new method and trend[7-8].At present, researches using UAV multispectral remote sensing mainly focus on the classification of fuels[9-10], but there are relatively few studies on fuel load.UAV airborne Laser Radar(LiDar)can obtain the structure data of surface fuels[11-12], but its modeling operation is relatively complex, and it is difficult for 3D point clouds to have data in every grid like multispectral remote sensing.In this study, we explored the potential relationship between vegetation index and forest surface fuel load in UAV multispectral remote sensing to establish a model between vegetation index and forest surface fuel load.
2 Materials and methods
2.1 Overview of experimental areaThe experimental area is located in Kengbian Village, Hecheng Town, Gaoming District, Foshan City, Guangdong Province, between 22°57′23″-22°57′45″ N and 112°46′45″-112°47′10″ E, with an area of 40 ha.It is less than 500 m away from the burned area of the major forest fire in Lingyun Mountain, Gaoming District, Foshan City on December 5, 2019.The experimental area belongs to subtropical monsoon climate zone.The main vegetation includesPinusmassoniana,Pinuselliottii,Eucalyptusspp.,Cinnamomumcamphora,Schimasuperba,Erythrophleumfordii,Castanopsisfissa,Castanopsishystrix,Ficusmicrocarpa,Litseaglutinosa, various shrubs and bamboos, basically covering the main vegetation types in the Gaoming "12.5" major forest fire in Foshan City.
2.2 Arrangement of sample plots and collection of surface fuel loadThe fuel load is based on the dried fuel load.To verify the relationship between the vegetation index and the actual surface fuel load, we combined the grid sampling method and random sampling method, and set up 50 sample plots with size of 1 m×1 m each in the experimental area.Among them, 36 plots were set according to 100 m grid, and 14 random plots were set according to different stand types.We collected and bagged all the fuels in the 50 sample plots according to the live fuel and dead fuel.After drying, we measured the dried fuel load to establish the surface fuel load model of each stand.The distribution of experimental area and sample plots are shown in Fig.1.
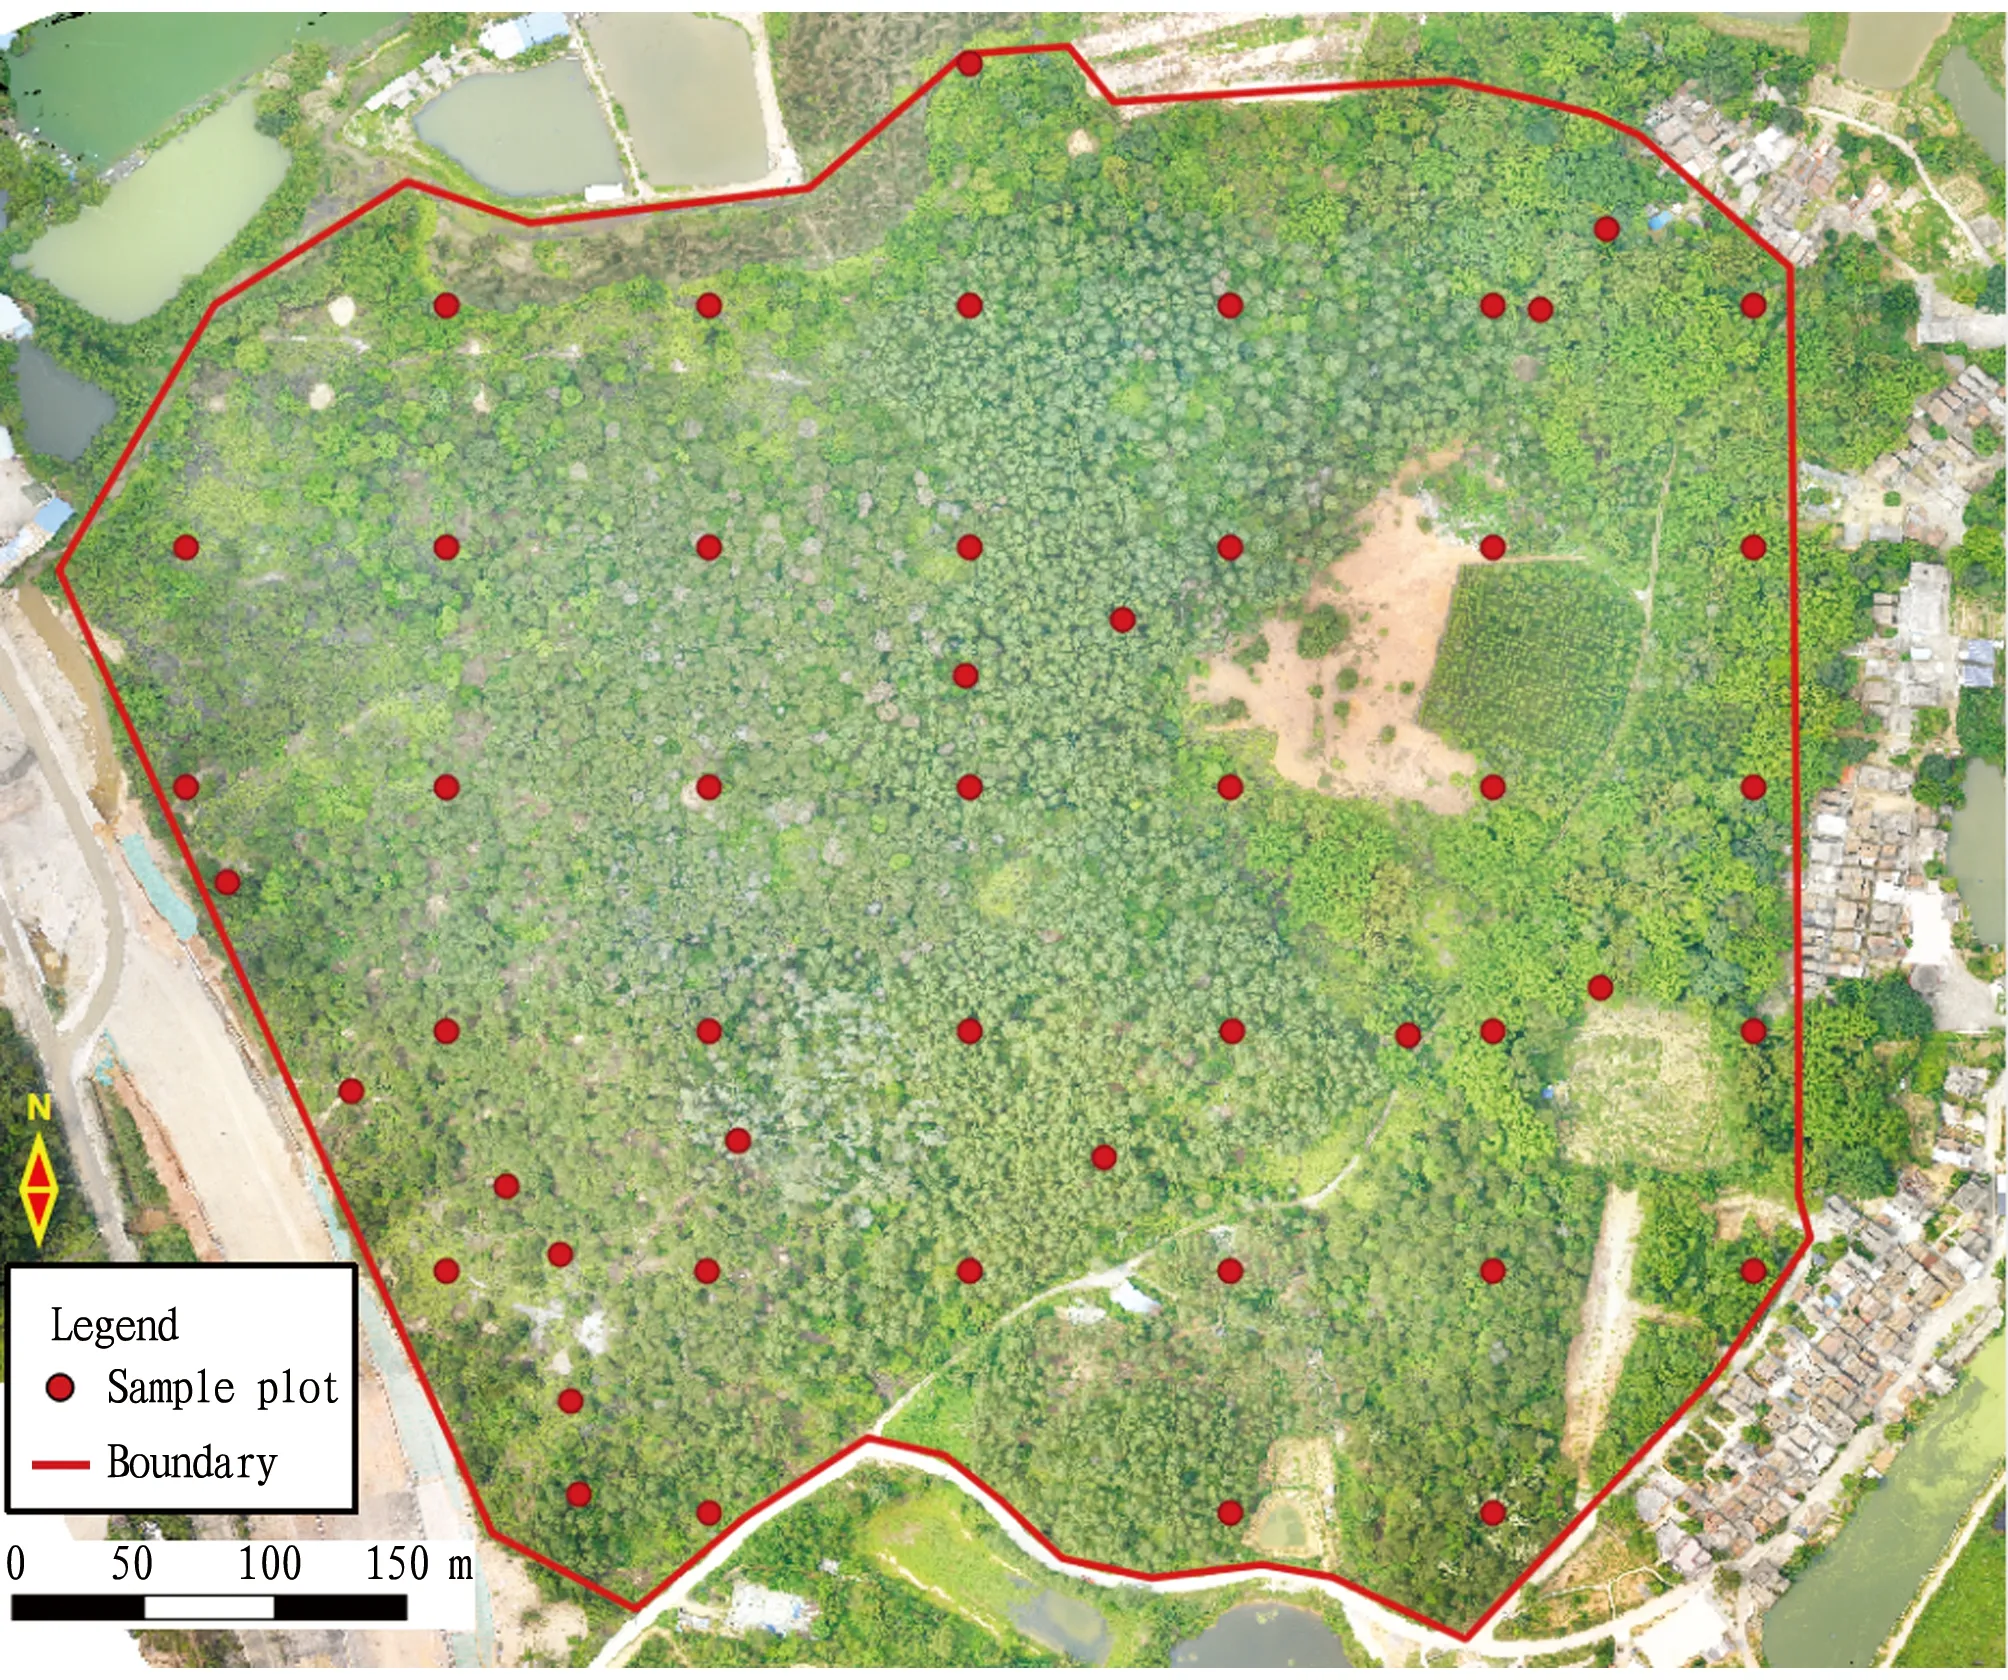
Fig.1 Distribution of experimental area and sample plots
2.3 UAV multispectral data collection and vegetation index acquisitionWe used the Matrice M300 UAV equipped with multispectral and high-definition lenses to collect image data in the experimental area by orthographic projection.The collected multispectral data were stitched using SpectrononPro software after radiometric calibration, reflection correction and geometric correction.Finally, with the aid of ENVI software, we obtained the normalized difference vegetation index(NDVI)(Fig.2)and enhanced vegetation index(EVI)(Fig.3)of the experimental area.
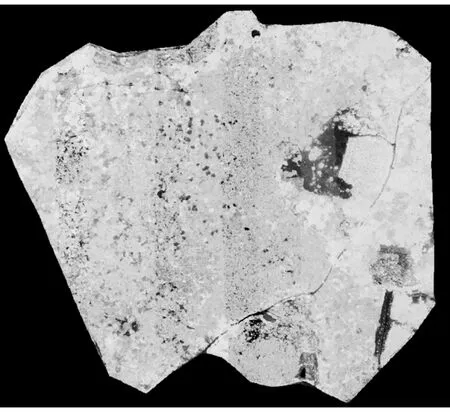
Fig.2 NDVI of the experimental area
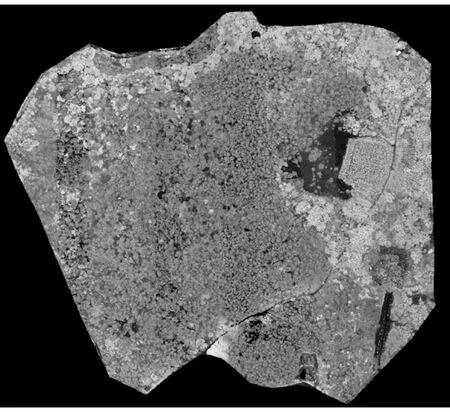
Fig.3 EVI of the experimental area
3 Results and analysis
3.1 ResultsAccording to the vegetation type, we divided the 50 sample plots intoP.elliottiiforest,P.massonianaforest, shrub grassland, broad-leaf forest, and bamboo forest types.The location, type, vegetation index, and load of each sample plot are listed in Table 1.The accuracy of orthophoto and plot measured coordinates after RTK correction is within 10 cm, which is enough to meet the requirements of precise correction.
Taking the vegetation index as the X-axis, and the surface fuel load as the Y-axis, we plotted the discrete graphs of NDVI and surface fuel load, EVI and surface fuel load, as shown in Fig.4.
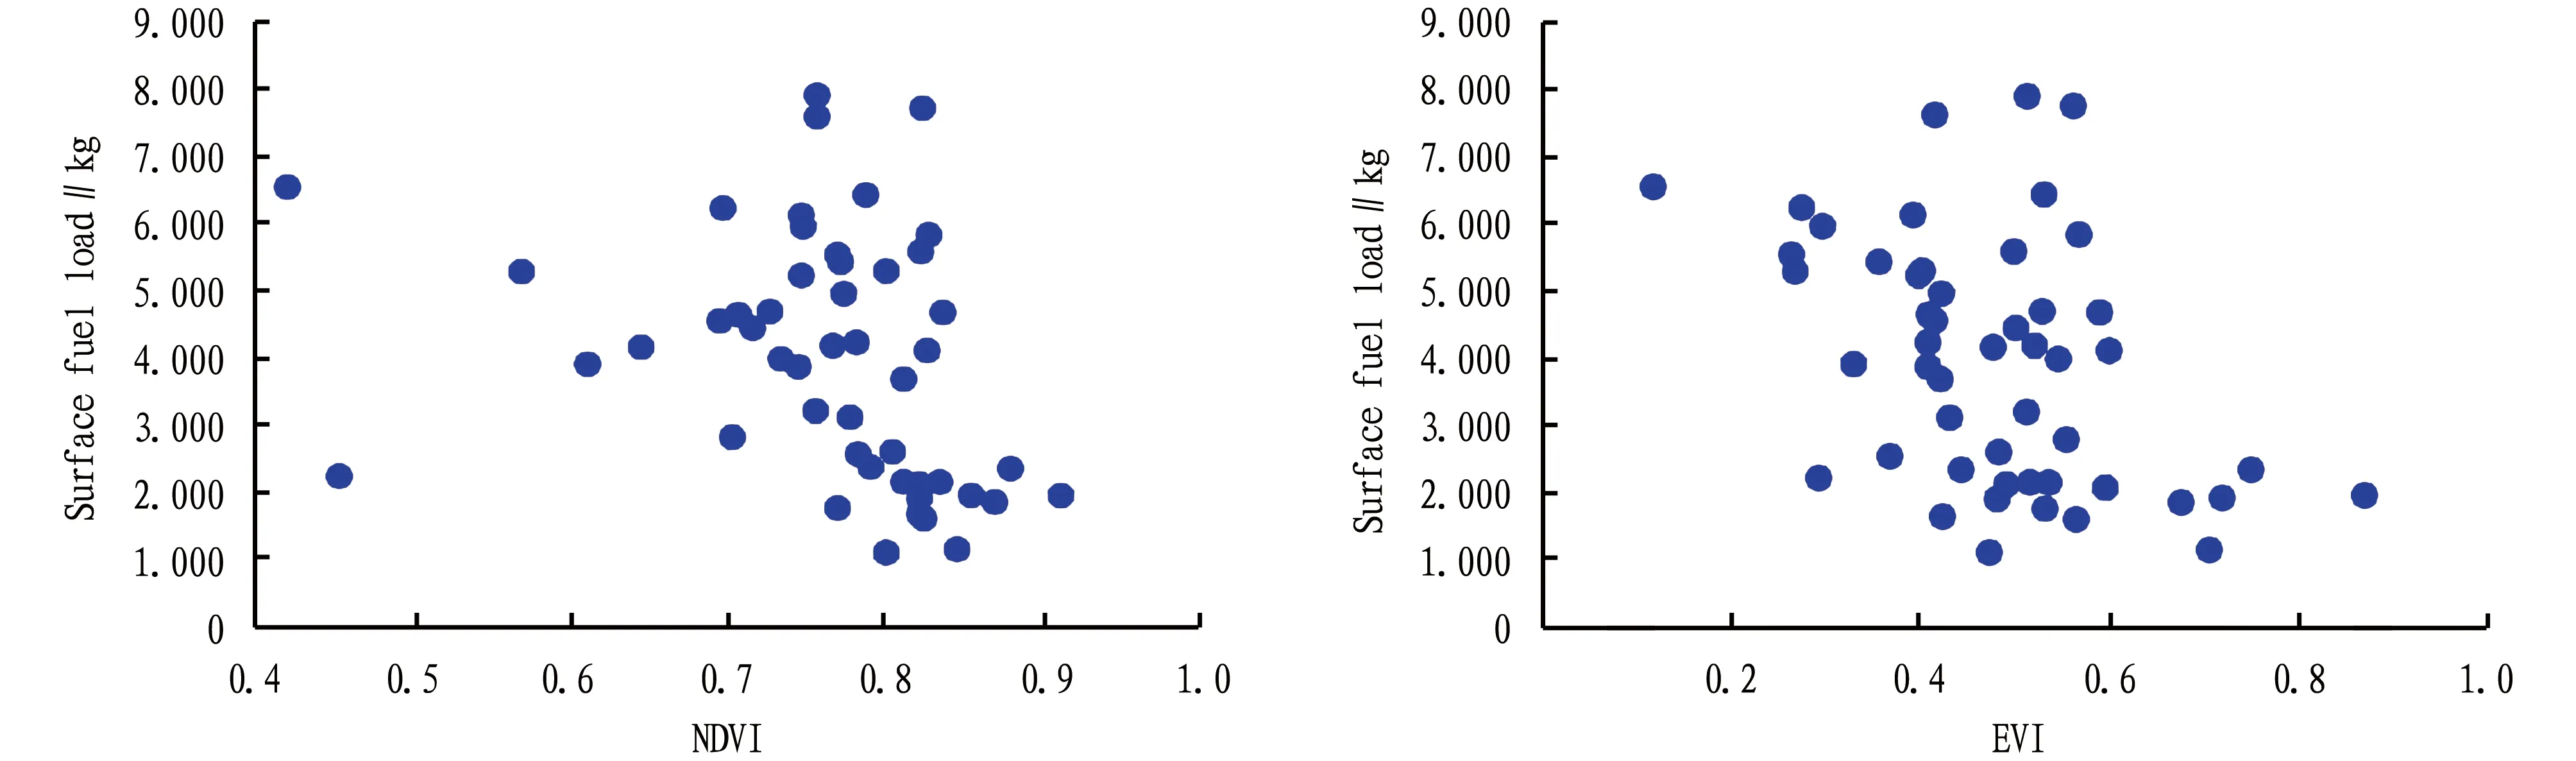
Fig.4 Discrete graphs of vegetation index and surface fuel load
3.2 Analysis of surface fuel loadUsing Excel software, we conducted a statistical analysis on the surface fuel load, and the statistical analysis results are shown in Table 2.The dried fuel load of the 50 sample plots was in the range of 1.085-7.893 kg, and the average load was 3.933 kg.From the perspective of surface fuel load of various vegetation types, the surface fuel load ofP.elliottiiforest was the highest, followed byP.massonianaforest and shrub grassland, and the surface fuel load of broad-leaf forest and bamboo forest was the lowest.
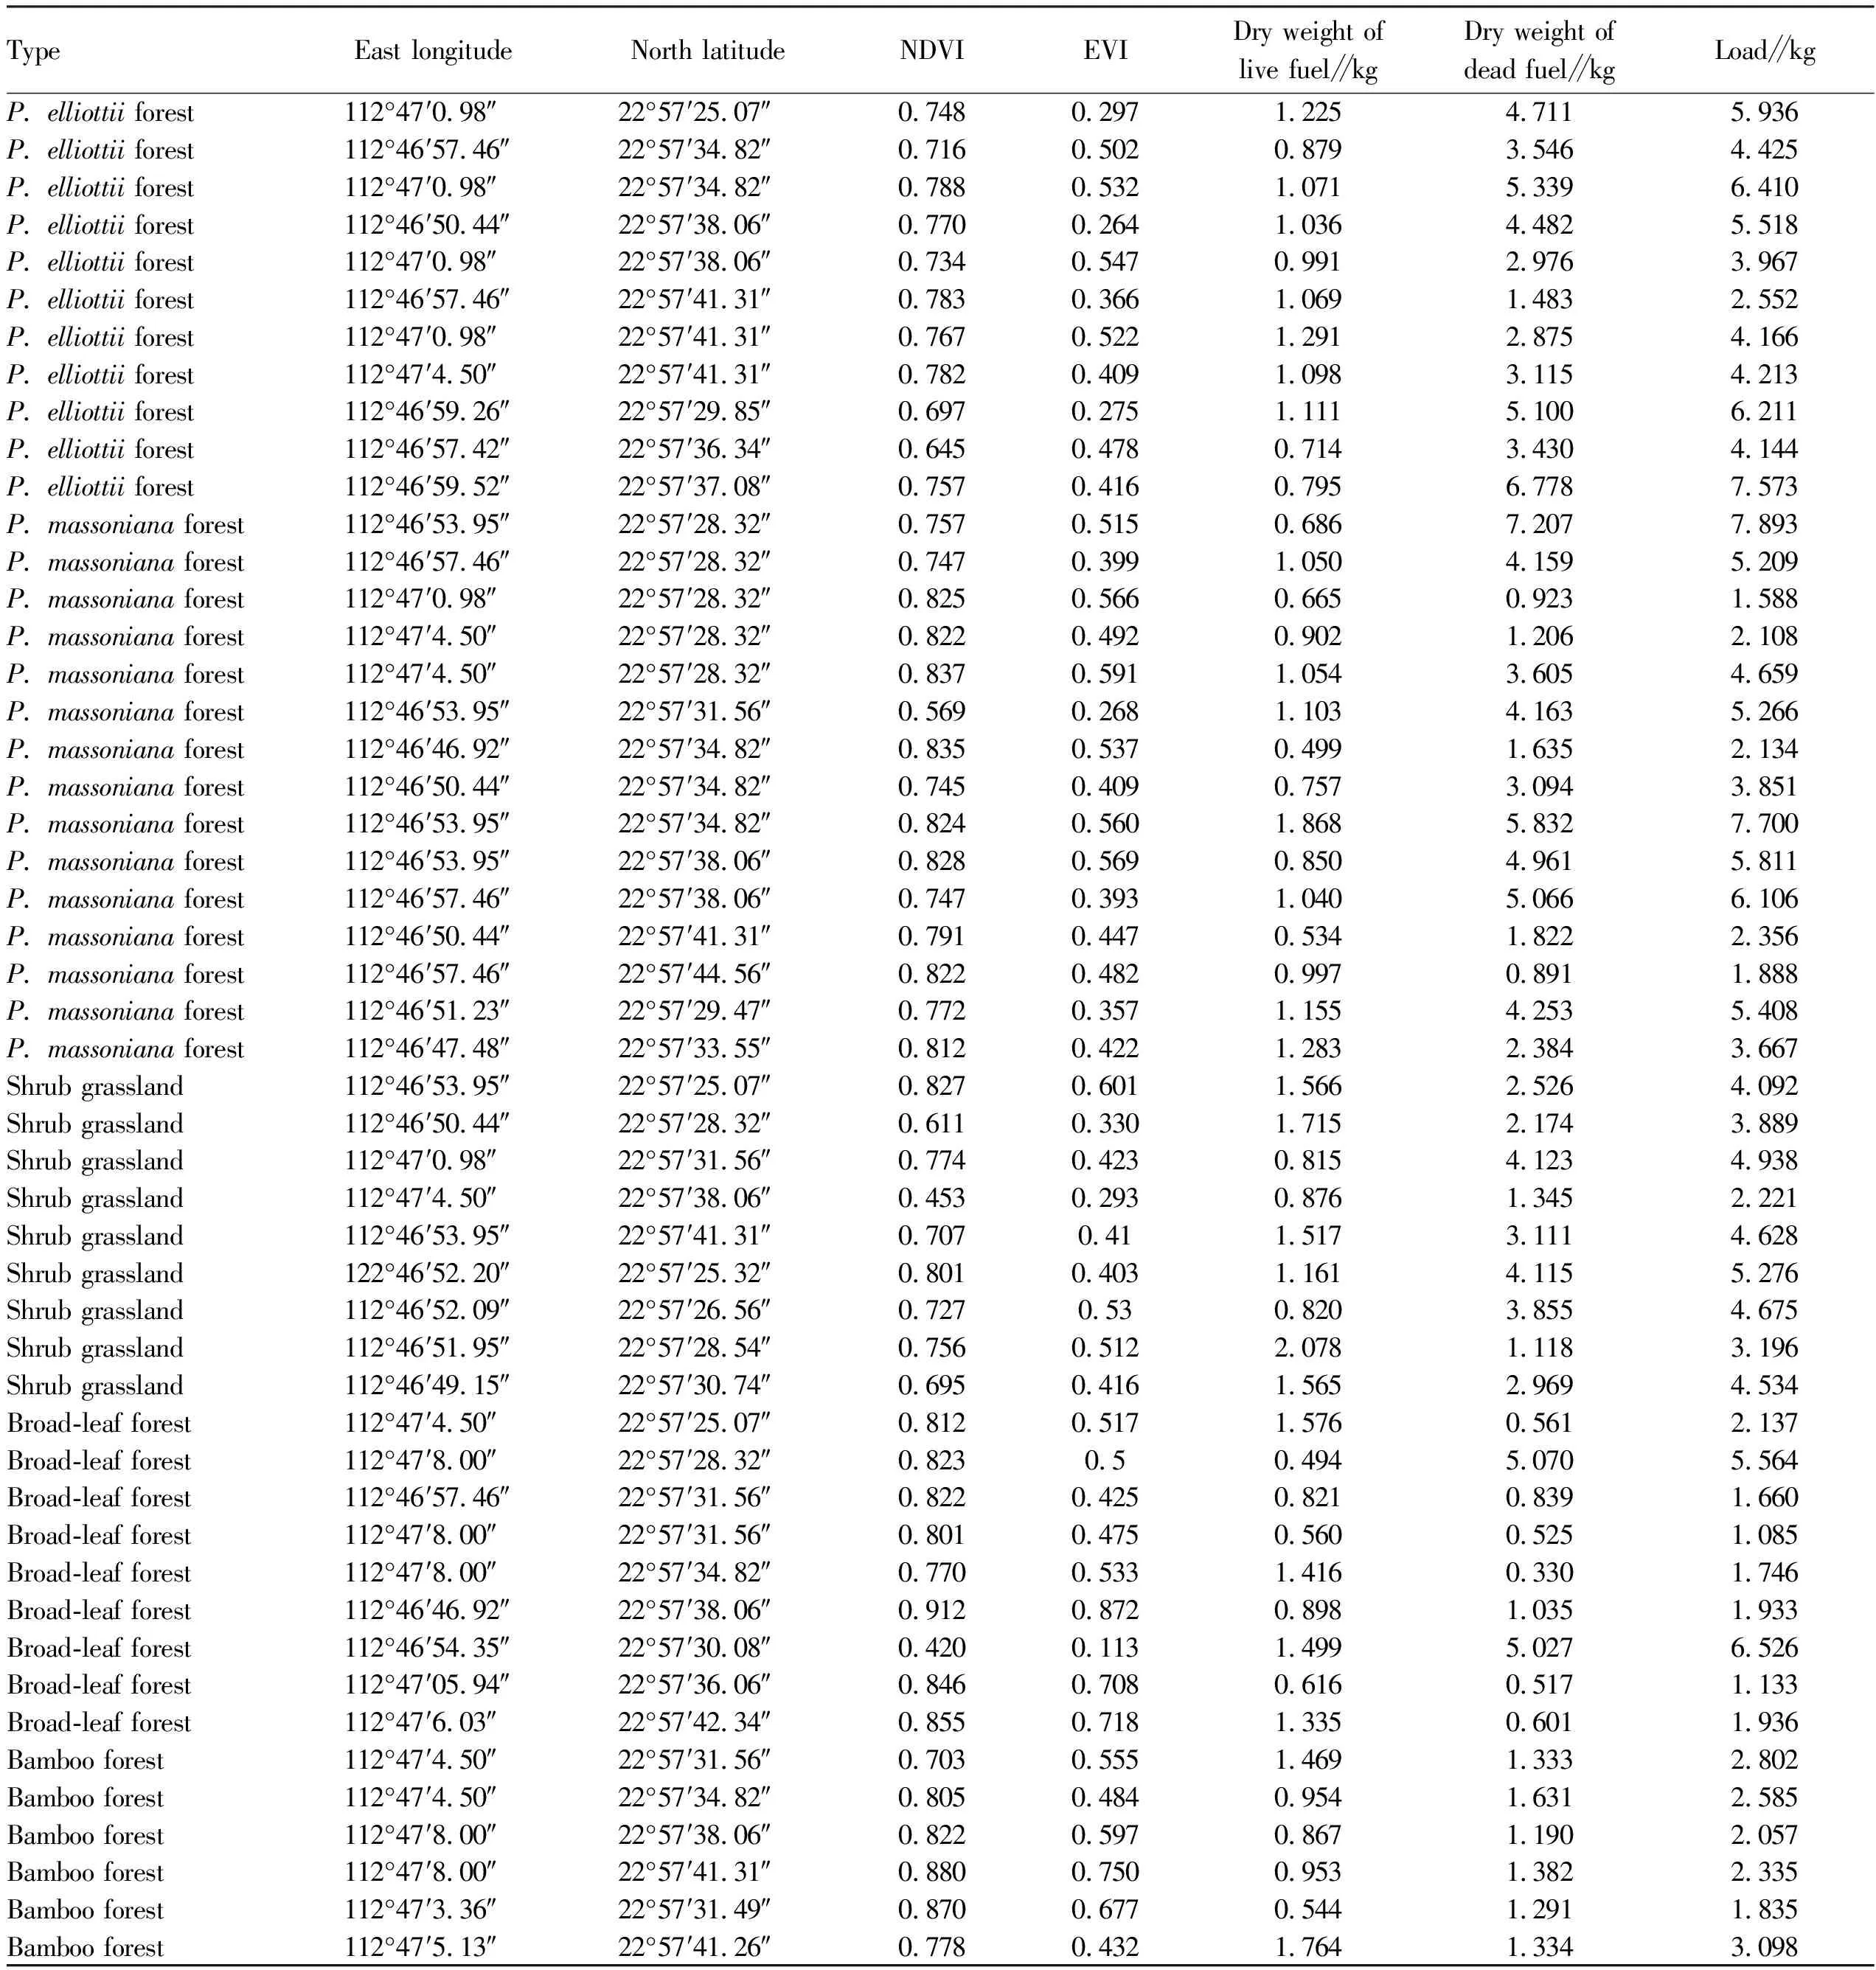
Table 1 Basic information of each sample plot
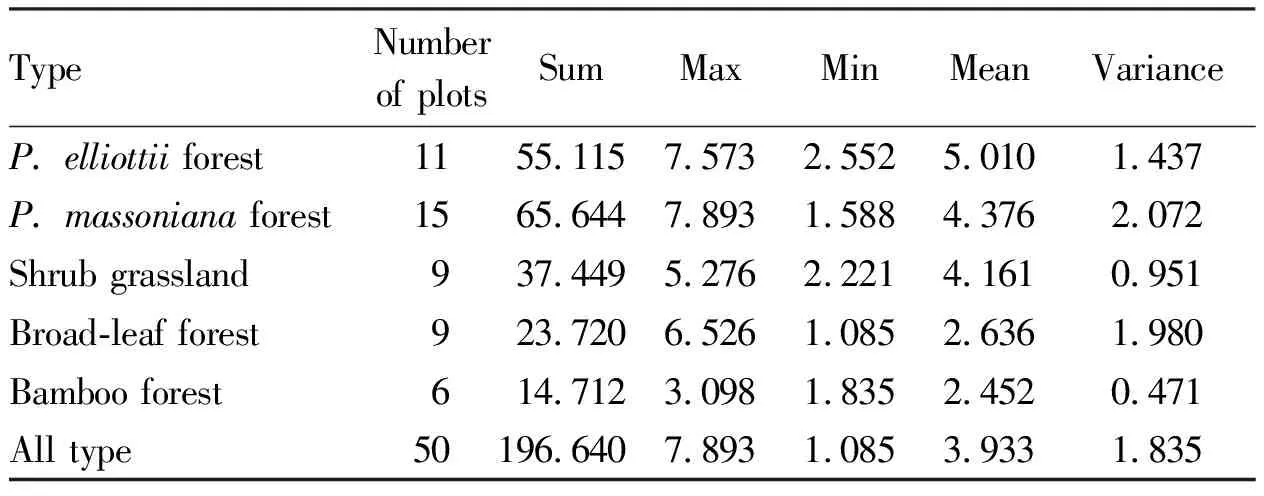
Table 2 Statistical analysis of surface fuel load
For the surface fuel load of each vegetation type and other vegetation types, we carried out the difference significance test, and mainly theTtest to calculate theP.The test results are shown in Table 3.In general, thePof theTtest can indicate whether there is a significant difference.In statistics, when thePis less than 0.05, the difference is significant; when thePis less than 0.01, the difference is extremely significant; when thePis greater than 0.05, the difference is not significant[13].From Table 3, it can be seen that the difference in surface fuel load between bamboo forest and other vegetation types was extremely significant; the difference betweenP.elliottiiforest and broad-leaf forest and other vegetation types was significant, the difference betweenP.massonianaforest and shrub grassland and other vegetation types was not significant, which is possibly because the species of surface vegetation inP.massonianaforest and shrub-grassland are more abundant, and the difference in species of surface vegetation is different, leading to large fluctuation of the fuel load.
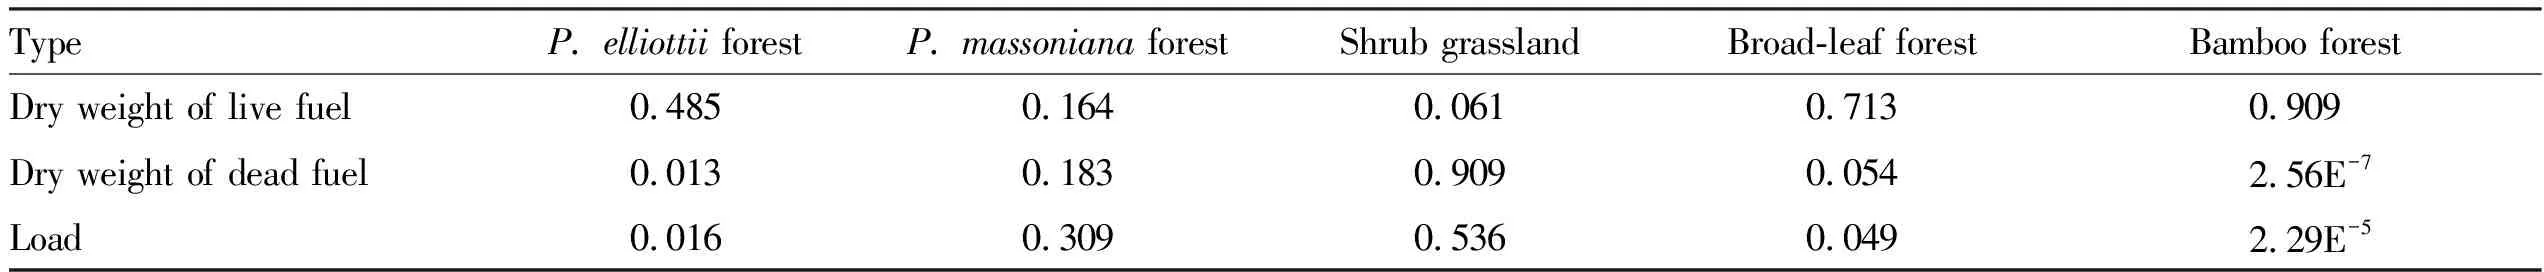
Table 3 Significance test of load difference(P value)
3.3 Analysis of the relationship between vegetation index and surface fuel loadThe Pearson correlation coefficient(Pearson’sr, hereafter referred tor)is usually used in statistics to measure the degree of linear correlation between two sets of data[14].In this study, we usedrto measure the degree of linear correlation between vegetation index and various types of surface fuel load, and itsrvalue is shown in Table 4.

Table 4 Vegetation index and r value of various vegetation types of surface fuel load
Generally, if the absolute value ofris in the range of 0-0.09, it indicates that the two sets of data are not correlated; if the absolute value ofris in the range of 0.1-0.3, it indicates that the two sets of data are weakly correlated; if the absolute value ofris in the range of 0.3-0.5, it indicates that the two sets of data are moderately correlated; if the absolute value ofris in the range of 0.5-1.0, it indicates that the two sets of data are strongly correlated[15].From Table 5, it can be seen that NDVI and EVI had a moderate correlation with the surface fuel load; NDVI had a strong correlation with the surface fuel load of shrub grassland, broad-leaf forest and bamboo forest; EVI had a strong correlation with the surface fuel load of broad-leaf forest and bamboo forest; NDVI had a moderate correlation with the surface fuel load ofP.massonianaforest; the correlation between other vegetation types and vegetation index was small.
For the two sets of data with moderate intensity and strong correlation, usingXto represent the vegetation index value andYto represent the surface fuel load, we can fit a linear function(Equation 1).We established the linear regression model of NDVI and surface fuel load(Equation 2):
Y=-5.935 4X+8.466 3
(1)
The linear regression model of EVI and surface fuel load:
Y=-5.848 5X+6.727 1
(2)
The fitting functions of surface fuel load of other vegetation types and vegetation index are shown in Table 5.
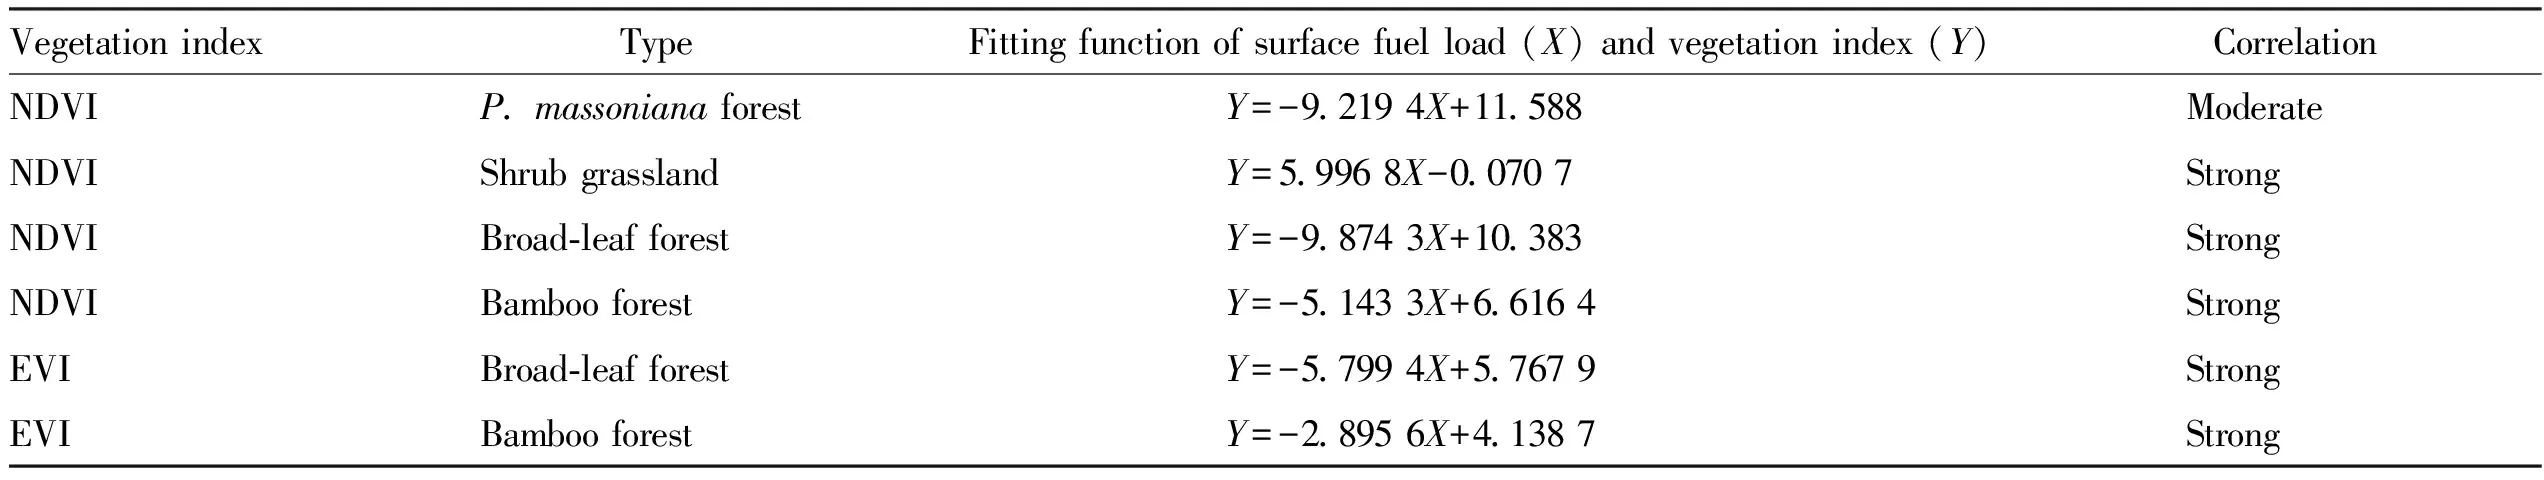
Table 5 Fitting functions of surface fuel load and vegetation index for each vegetation type
4 Conclusions and discussion
The average load of 50 sample plots is 3.933 kg or 39.33 t/ha, which exceeds the critical value of 30 t/ha for major forest fires[16], indicating that the surface fuel load in the experimental area is very high.Among them, the surface fuel load ofP.elliottiiforest is the highest, and the surface fuel load of broad-leaved forest and bamboo forest is lower.The difference in surface fuel load between bamboo forest and other vegetation types is extremely significant; the difference in surface fuel load betweenP.elliottiiforest and broad-leaf forest and other vegetation types is significant; the surface fuel load ofP.massonianaforest and shrub grassland is not significantly different from that of other vegetation types due to the large differences in surface vegetation populations.
Both NDVI and EVI have a moderate correlation with the surface fuel load, indicating that the models corresponding to surface fuel load can be constructed to a certain extent.We established the two models of vegetation index and surface fuel load, as shown in equations(1)and(2).The NDVI is moderately or strongly correlated with the surface fuel load ofP.massonianaforest, shrub grassland, broad-leaf forest and bamboo forest, while the EVI only has a strong correlation with the surface fuel load of broad-leaf forest and bamboo forest, which indicates that the use of NDVI can establish a more linear relationship with the surface fuel load.
In this study, we only collected relevant data in the same area, and only collected data from 50 sample plots, it is necessary to collect data from more sample plots in more different regions to make the conclusions more representative and universal.Since there are many types of vegetation indices, the relationship between other vegetation indices and surface fuel load can be further obtained by the method in this study, so as to find a more universal vegetation index for calculating the surface fuel load.
杂志排行

Asian Agricultural Research的其它文章
- Nitrogen Accumulation and Transport Characteristics and Grain Protein Content of Wheat Varieties with Different Nitrogen Efficiencies and Their Responses to Irrigation
- Antibacterial Effects of Essential Oils from Pomegranate on Two Kinds of Postharvest Pathogenic Fungi
- Construction of Water-saving Ecological Aquaculture Model in Ponds in North China
- Spatio-temporal Evolution of Landscape Pattern and Habitat Quality in Yunnan Province
- Comparison of Benefits of Different Tobacco Loading Methods and Matching Baking Processes in Intensive Curing Houses
- Effects of Mechanical Harvesting of Main Crop on Soil Rolling and Yield of Ratooned Rice