Spatio-temporal Evolution of Landscape Pattern and Habitat Quality in Yunnan Province
2022-11-28ChuqiaoYUShuxianZHULiLIGongshengWUHongyanGUO
Chuqiao YU, Shuxian ZHU, Li LI, Gongsheng WU, Hongyan GUO
School of Urban and Environment, Yunnan University of Finance and Economics, Kunming 650221, China; Wildlife Management and Ecosystem Health Research Center, Yunnan University of Finance and Economics, Kunming 650221, China
Abstract [Objectives]The paper was to explore the spatio-temporal evolution of habitat quality in inland ecosystem.[Methods]Using landscape pattern analysis and InVEST habitat quality model, the land use change, landscape pattern and habitat quality change in Yunnan Province from 1980 to 2020 were studied.[Results]The land use change in Yunnan Province was relatively stable, and the forest land area accounted for 57.2% of the total area.The landscape fragmentation index caused by artificial surface encroachment on ecological land was increased by 6.33%, and the landscape heterogeneity was enhanced to varying degrees.The mean patch area was decreased by 5.83%, the number of patches was increased by 6.29%, and the degree of fragmentation was deepened.The habitat quality in Yunnan Province showed a "high-low-high" distribution from northwest to southeast, and the overall habitat quality was above the average.It is necessary to formulate optimization strategies to improve the regional ecological environment and realize the ecological system protection and rational land use in Yunnan Province.[Conclusions]The results will provide a scientific reference for regional ecological protection construction and land use planning in Yunnan Province.
Key words Land use change, Habitat quality, InVEST model, Netdraw, Yunnan Province
1 Introduction
A large amount of human activity information is contained in land use change.Rapid economic development and population agglomeration and flow have a strong radiation effect on regional land use, which leads to land use change represented by urban and cultivated land expansion, and will aggravate habitat quality decline and biodiversity loss[1-3].In recent years, research methods on the impact of land use on habitat quality are roughly divided into 2 categories based on different research criteria.One is setting up an index system, which collects various parameters related to habitat quality and evaluates via analytic hierarchy process(AHP)and other methods based on field investigation, dominated by small cities[4], rivers[5], nature reserves[6]and other small scales.The other is model-based methods, such as HSI model[7], InVEST model[8-13], and SolVES model[14], which assesses habitat quality in a quantitative way at different scales, such as counties[15-16], mountains[17], and river basins[18-19].InVEST model has developed to a mature stage and is used most frequently among ecosystem service assessment models[20].
The complex ecological system and diversified habitat conditions in Yunnan are closely related to its special geographical location and unique natural geographical environment, and towering and undulating terrain have prominent impacts on landscape formation, biodiversity distribution, ecosystem regional combination and regional differentiation and other spatial configurations[21].In recent years, due to remarkable advantages in ecological location, Yunnan, as an important barrier, protects the ecological safety of southwest areas in China.However, due to the lack of long-term planning and design in the process of economic development in some areas, the structure and function of the ecological environment are destroyed, and too much human activities seriously disturb the natural landscape, resulting in the disorder of land landscape pattern.Based on this, the spatio-temporal evolution of land use change, landscape pattern and habitat quality in Yunnan Province from 1980 to 2020 was explored by InVEST habitat quality model, and the relationship between landscape pattern and habitat quality was studied, in order to provide a basic basis for ecological protection practice and land use planning in Yunnan Province.
2 General situation of study area
Yunnan Province is located in the southwest border of China(21°09′-29°15′ N, 97°31′-106°11′ E), adjacent to Guizhou and Guangxi in the east, Sichuan in the north, Tibet in the northwest, and bordering Myanmar in the west and southwest, and Laos and Vietnam in the south and southeast, with a total area of 394 100 km2.The average altitude is about 2 000 m, and the terrain is high in the north and low in the south.The area belongs to mountain and plateau terrain, with an elevation difference of 66 663.6 m between the north and the south.The province is dominated by subtropical plateau monsoon climate; Lijiang, Dali and other regions in the northwest belong to cold climate, while Kunming, Qujing and other regions in the eastern and central regions have temperate climate.
3 Data acquisition and research methods
3.1 Data source and processingThe basic data were derived from the land use remote sensing monitoring data of Chinese Academy of Sciences.The land use data of Yunnan Province in 1980, 1990, 2000, 2010 and 2020 with a resolution of 1 km×1 km were collected.The land use data were loaded by ArcGIS software, and the data in the attribute table were classified and summarized.The vector data of paddy field, dry land, urban land, rural residential land and other construction land were selected as the threat factors affecting habitat quality in InVEST model.
3.2 Research methods
3.2.1Analysis of land use change.Based on ArcGIS software, the interaction of land use types in Yunnan Province from 1980 to 2020 was analyzed, and the land use transfer matrix of two adjacent research periods was obtained.Several common indexes were selected from landscape pattern indexes, and the spatial differentiation of land use landscape pattern and its correlation with habitat quality in Yunnan Province was explored by using two modules: type level and landscape level.A total of 8 indexes were selected; number of patch(NP), patch density(PD)and mean patch area(AREA_MN)were used to describe the type level/landscape level; largest patch index(LPI)and cohesion index(COHESION)were used to describe the type level; contagion index(CONTAG), Shannon’s diversity index(SHDI)and fragmentation index(FN)were used to describe the landscape level[22-23].Based on the number of existing patches, the fragmentation index can be calculated by formula(1)[24]:
FN=(NP-1)/NC
(1)
whereFNstands for the landscape fragmentation index in the study area;NPstands for the total number of various patches in the landscape;NCstands for the total landscape area.
3.2.2Habitat quality module in InVEST Model.InVEST model is a comprehensive assessment system that balances the quality of ecosystem services and provides ecosystem management and decision-making, which is conducive to real-time testing of habitat quality changes and visually shows the assessment results in a graphical form[25].In this study, the land use/land cover data were used to assess habitat quality in Yunnan Province.Habitat quality, degree of habitat degradation and habitat scarcity can be calculated according to the sensitivity differences of different land use types, the location, threat intensity and maximum threat distance of different threat factors[26].
The analysis of habitat quality mainly regards different land use types as threat factors that may destroy habitat quality, constructs the relationship network between habitat quality and threat factors, and studies the specific situation of the impact of threat factors on habitat quality[27].According to the actual situation of the research area, the main parameters to be adjusted in the module included the maximum threat distance, weight and decay type of the threat factor.Combined with the actual situation of the research area and referring to relevant literature[11,18,25,27-31], paddy field, dry land, urban land, rural residential land and other construction land were selected as threat factors, and the related attributes of different threat factors are shown in Table 1.In addition, habitat quality was affected by habitat suitability and sensitivity to threat factors at different levels.The higher the suitability of the habitat type, the better the habitat quality performance; the stronger the sensitivity of the habitat type to threat factors, the weaker the anti-interference ability, and the worse the habitat quality[32-33].Based on the recommended values of the reference model and the relevant literature[17-19,34], the habitat suitability of each land use type and its sensitivity to different threat factors were assigned(Table 2).
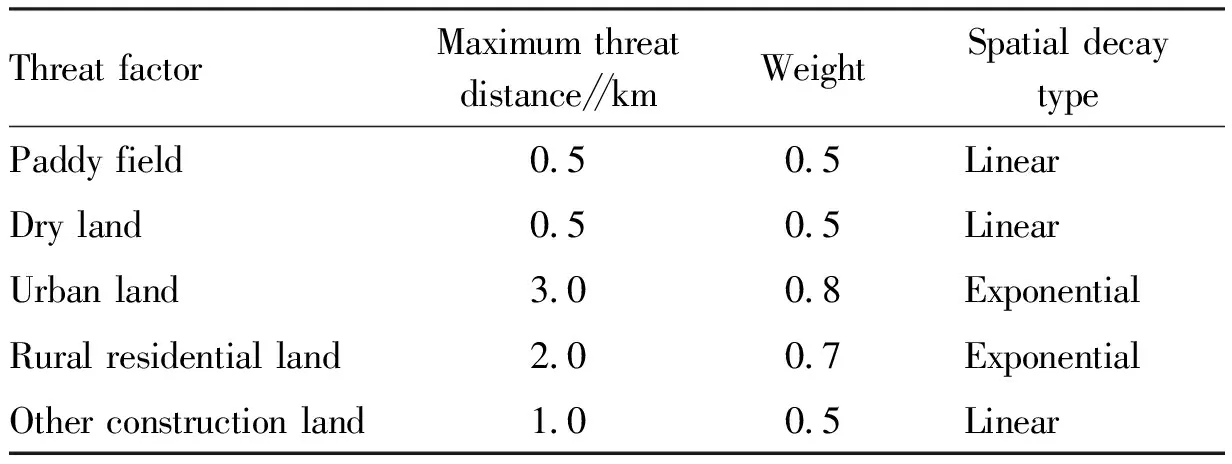
Table 1 Threat factors and their maximum threat distances, weights and decay types
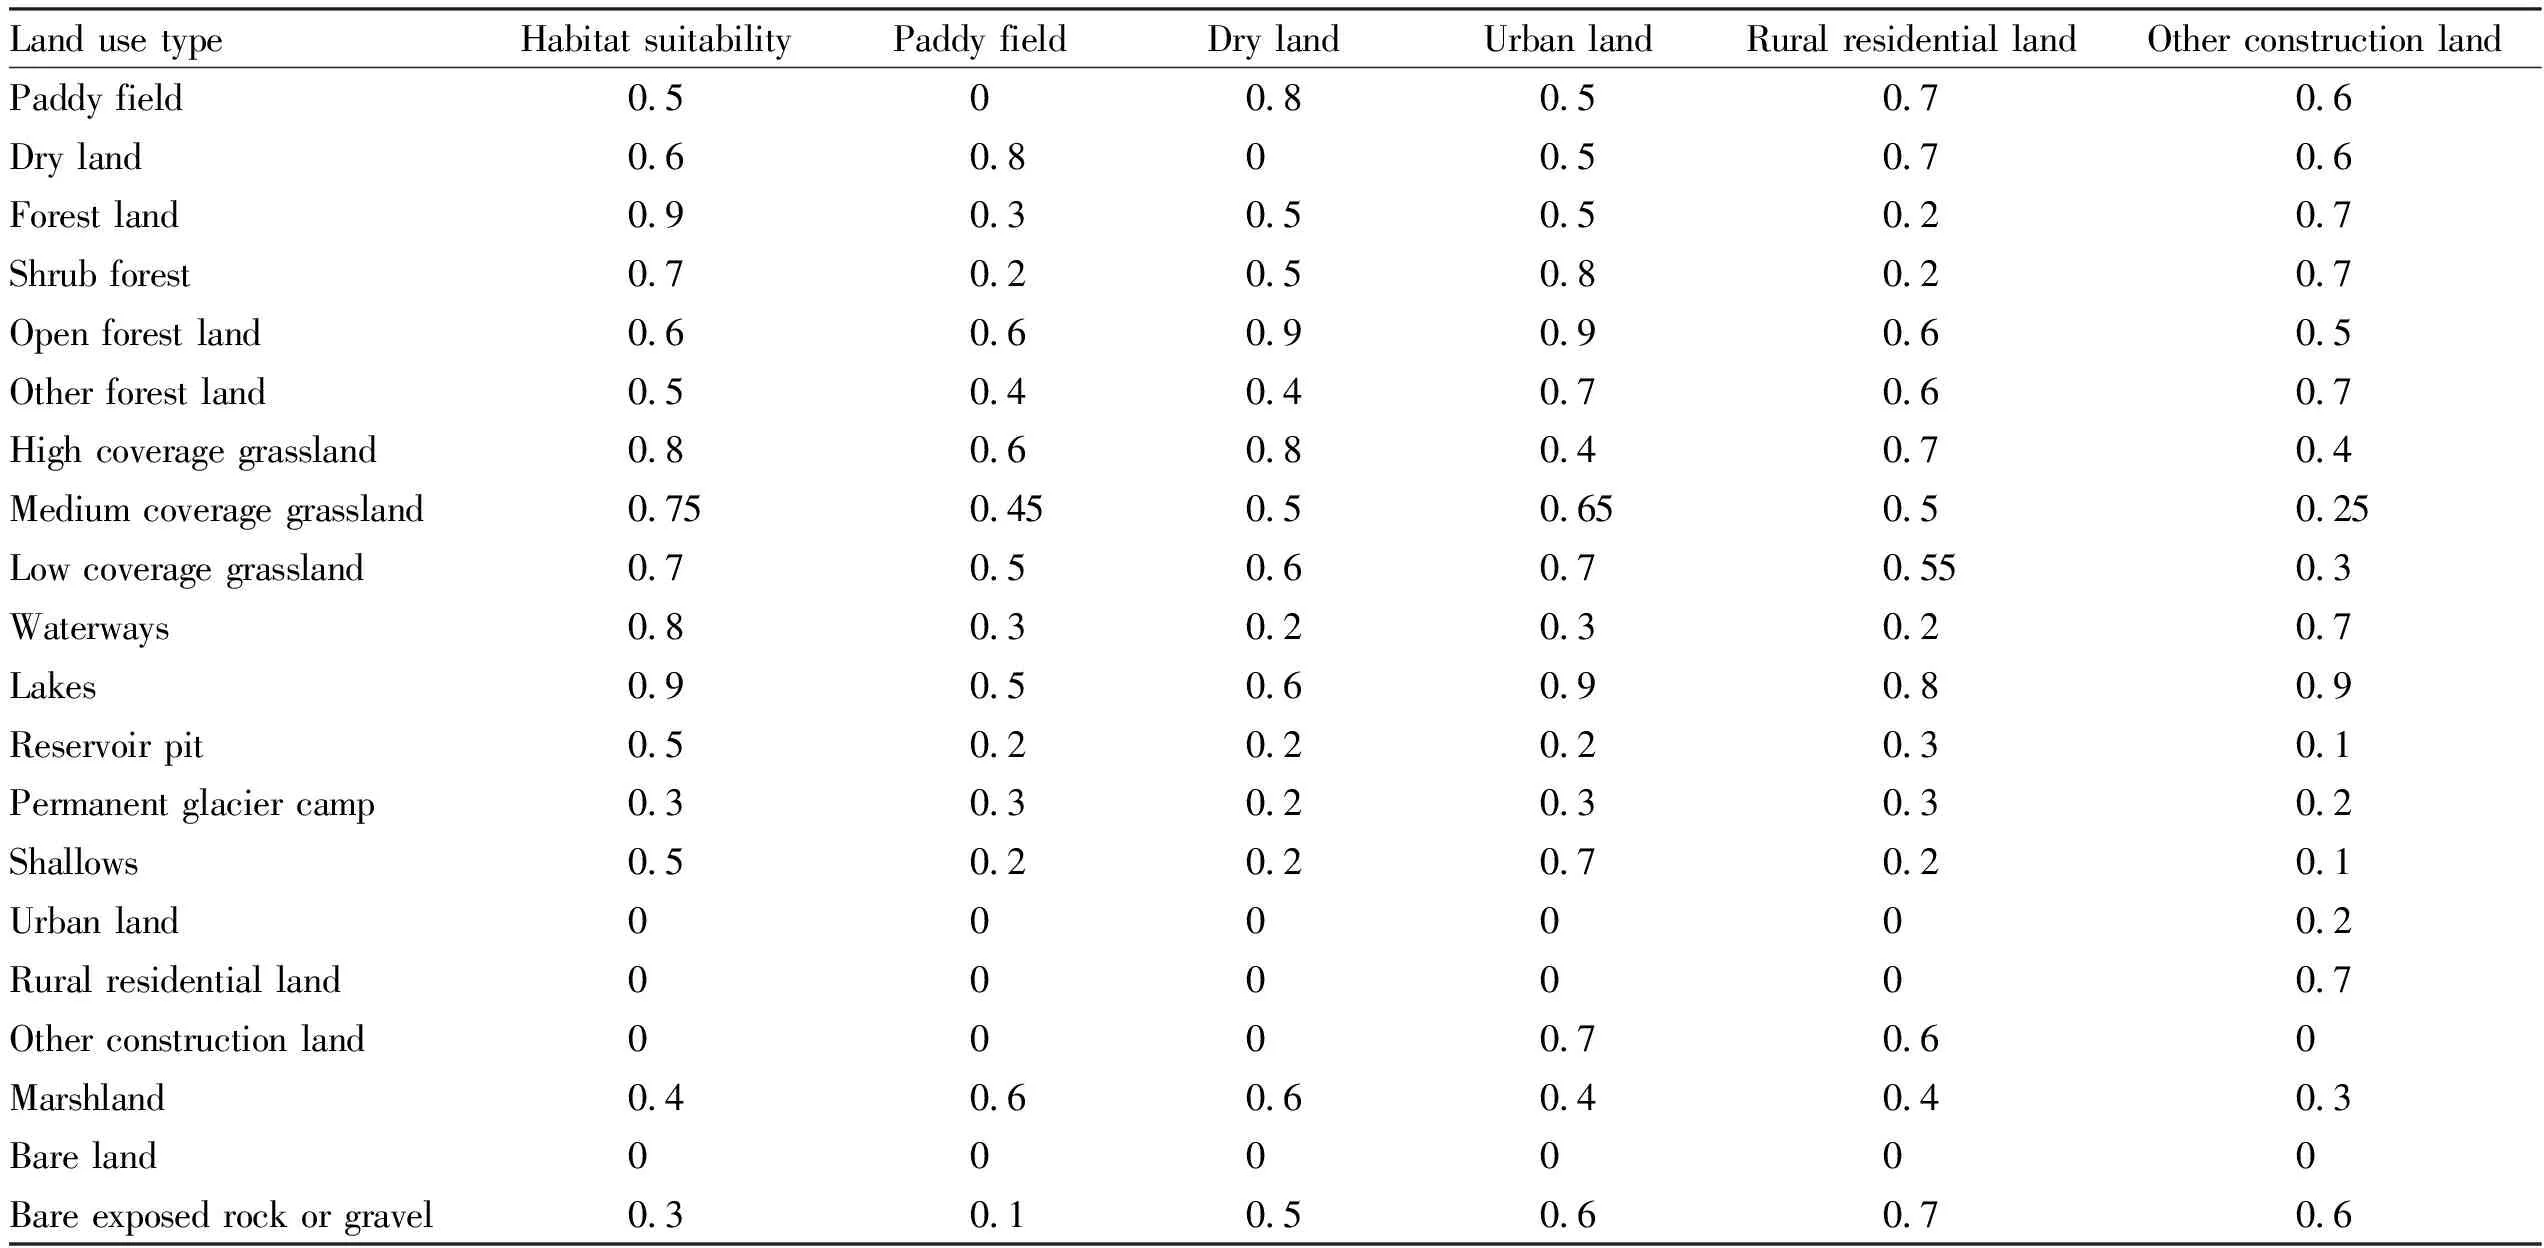
Table 2 Habitat suitability of different land types and their sensitivity to different threat factors
4 Results and analysis
4.1 Land use change in Yunnan ProvinceBased on the statistics of land use monitoring data, it can be seen that forest land, grassland and cultivated land were always the main land types in Yunnan Province, accounting for more than 90% of the total land area and constituting the landscape matrix of the province.The land use transfer grid in Fig.1 can directly and concretely show the inter-conversion trend and relationship among land use types.
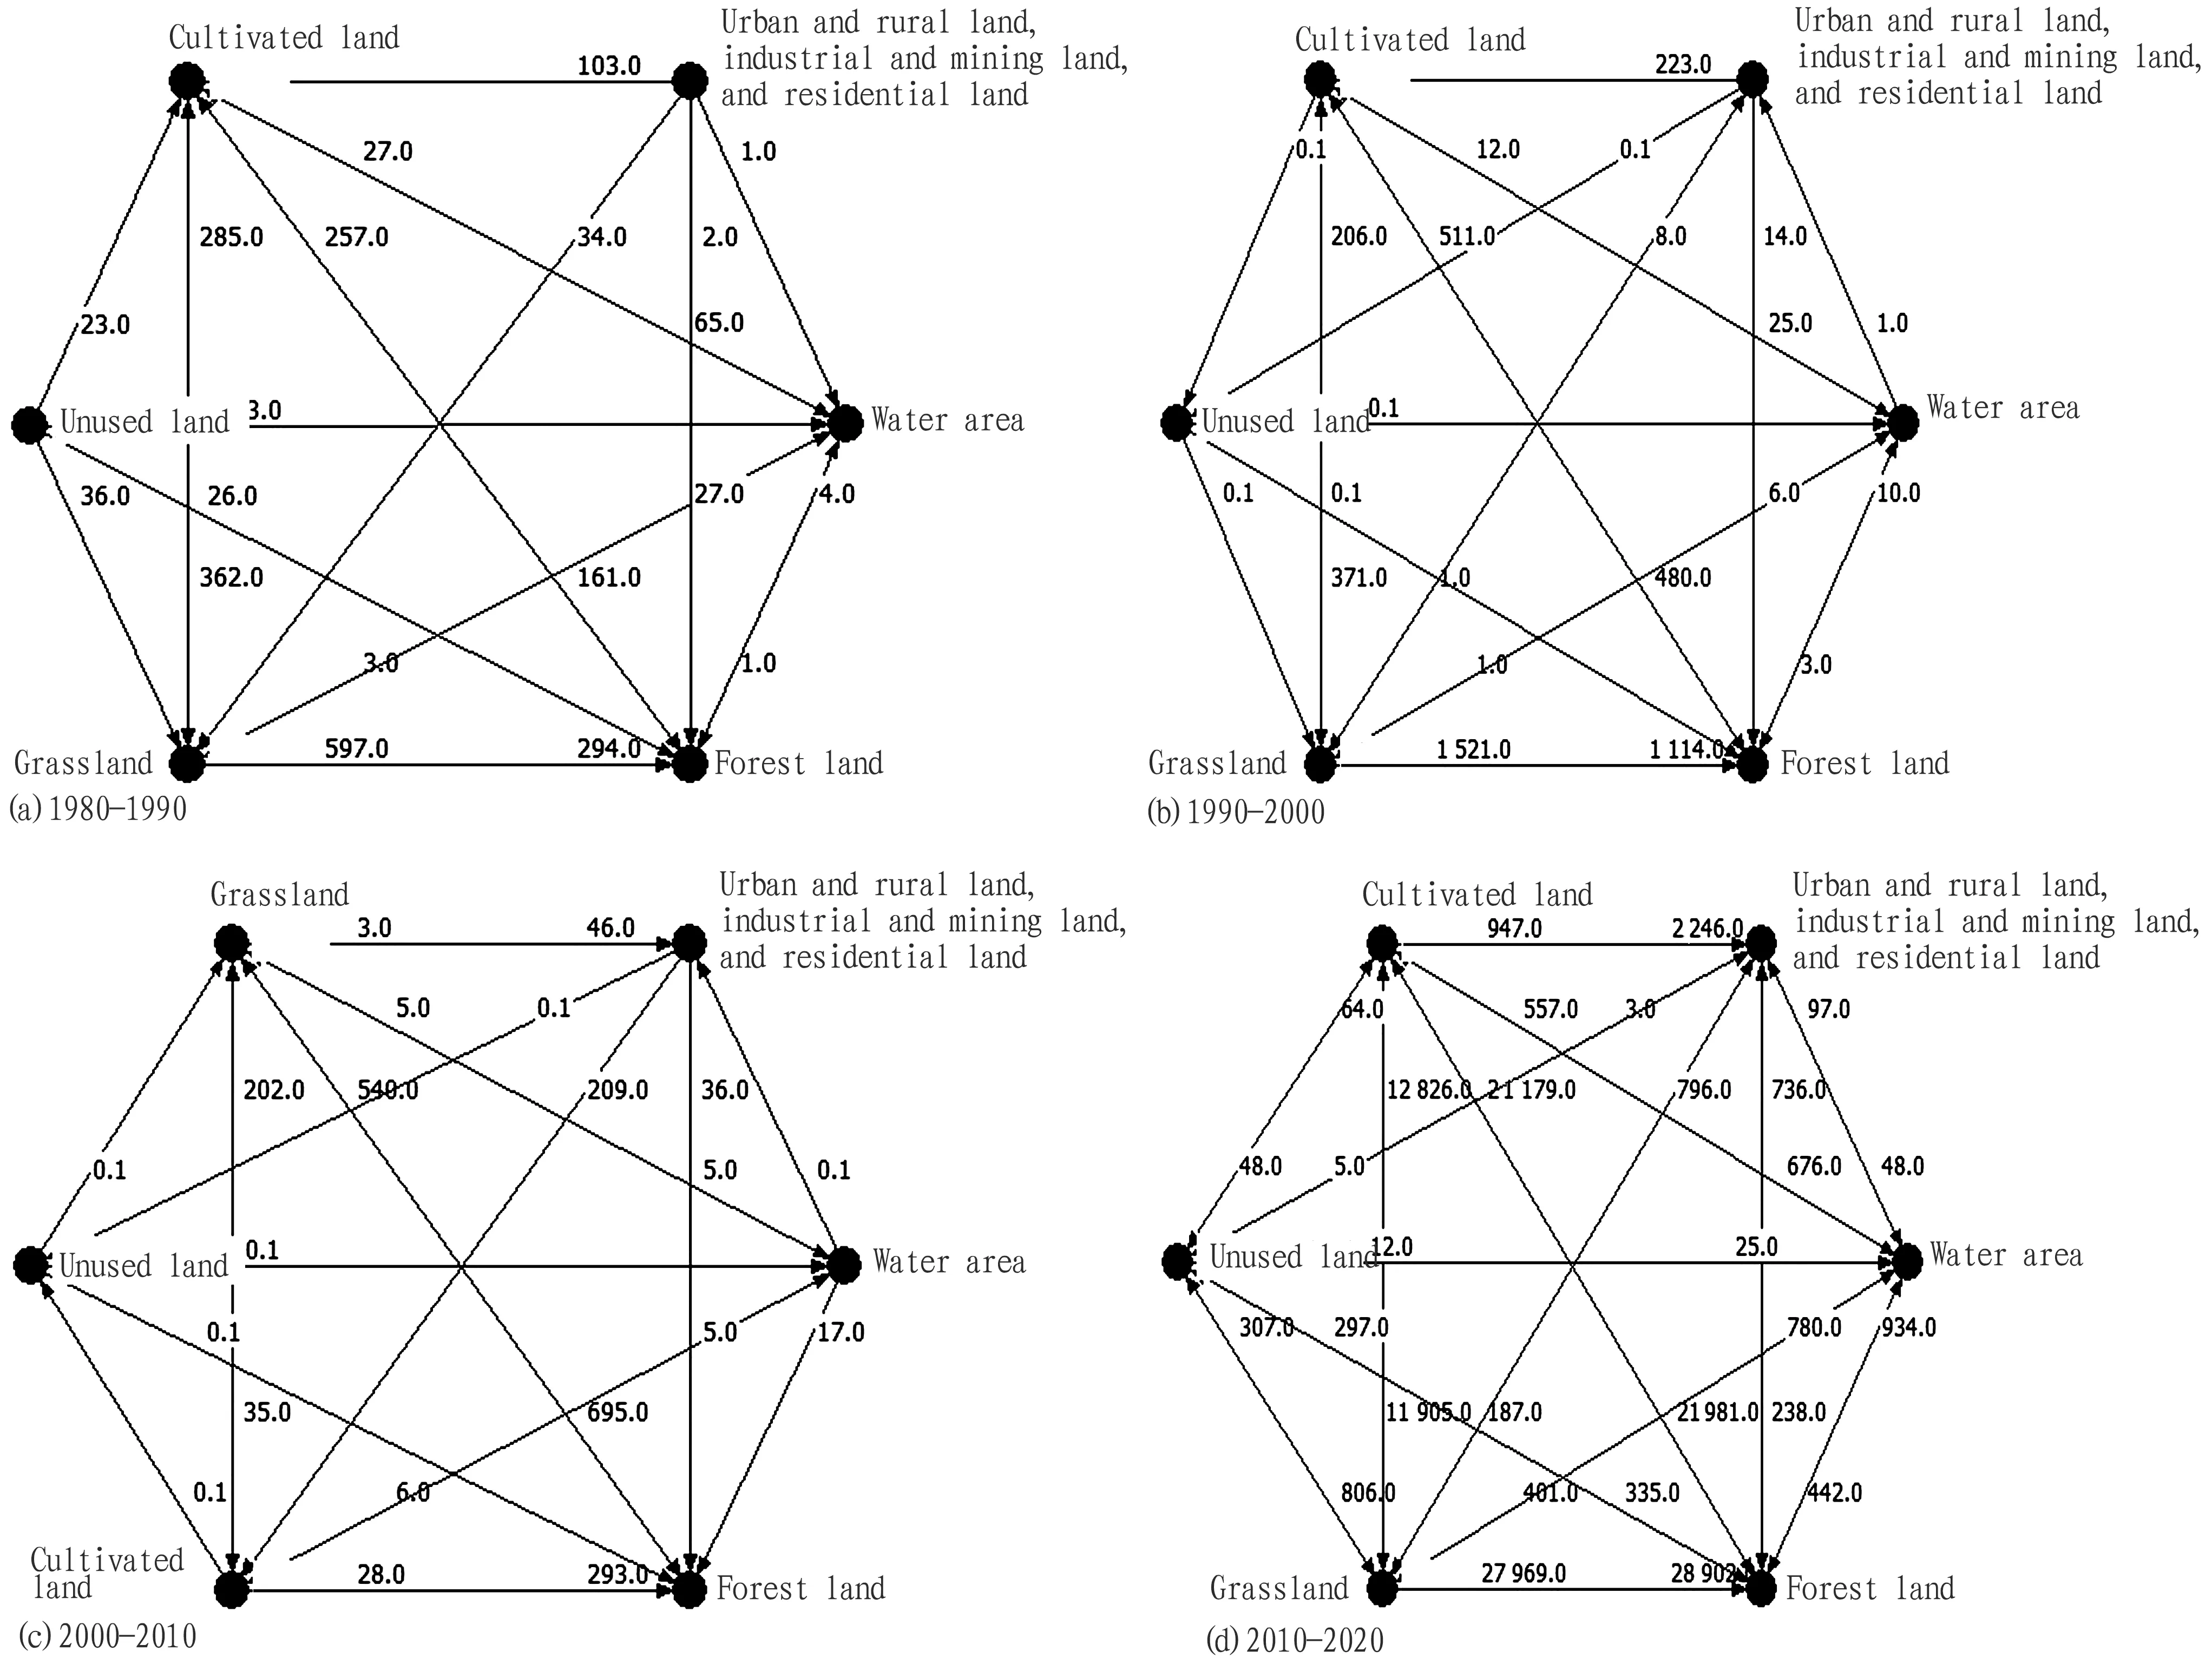
Fig.1 Land use transfer grid of Yunnan Province from 1980 to 2020
Generally speaking, a major feature of land use change in Yunnan Province was the gradual decrease of cultivated land area and the continuous expansion of urban and rural land, industrial and mining land, and residential land.Yunnan Province has been a pioneer in promoting the construction of ecological civilization in China.The proportion of forest land in the area was always about 57.2% from 1980 to 2020, and forest land was in a dominant position among the land use types of the province.The area of urban and rural land, industrial and mining land, and residential land nearly doubled, 65% of which came from the transfer of cultivated land and grassland.The trend of water area increased year by year, and the growth rate was 38.2%, only second to urban and rural land, industrial and mining land, and residential land.The area of land use types in each period changed to different degrees, and the overall fluctuation was not very drastic.Forest land, grassland and cultivated land always occupied the vast majority of the area during the study period, making a great contribution to the overall landscape.
4.2 Landscape pattern change of land use in Yunnan Province
4.2.1Analysis of landscape pattern at type level.Based on the perspective of landscape pattern, the change of land use was further discussed by analyzing the transfer direction and quantity change of land use types.
As shown in Fig.2, the NP and PD of forest land were relatively stable and had an upward trend, while the AREA_MN first increased and then decreased, and the LPI was the highest during these 5 periods, indicating that forest land was the dominant landscape in Yunnan Province.The NP and PD of grassland increased slightly, the LPI decreased slightly, and the AREA_MN and COHESION decreased first and then increased, indicating that the degree of aggregation decreased with the deepening of fragmentation level.With the acceleration of urbanization, urban and rural land, industrial and mining land, and residential land showed a trend of dense expansion in the past 40 years, which confirmed that its NP, PD, AREA_MN and COHESION all gradually increased year by year.The overall trend of NP, LPI and COHESION in the water area was gentle, and the increase of AREA_MN was more significant than that of other land use types, indicating that the water area in Yunnan Province was more dispersed and tended to become complex in shape.
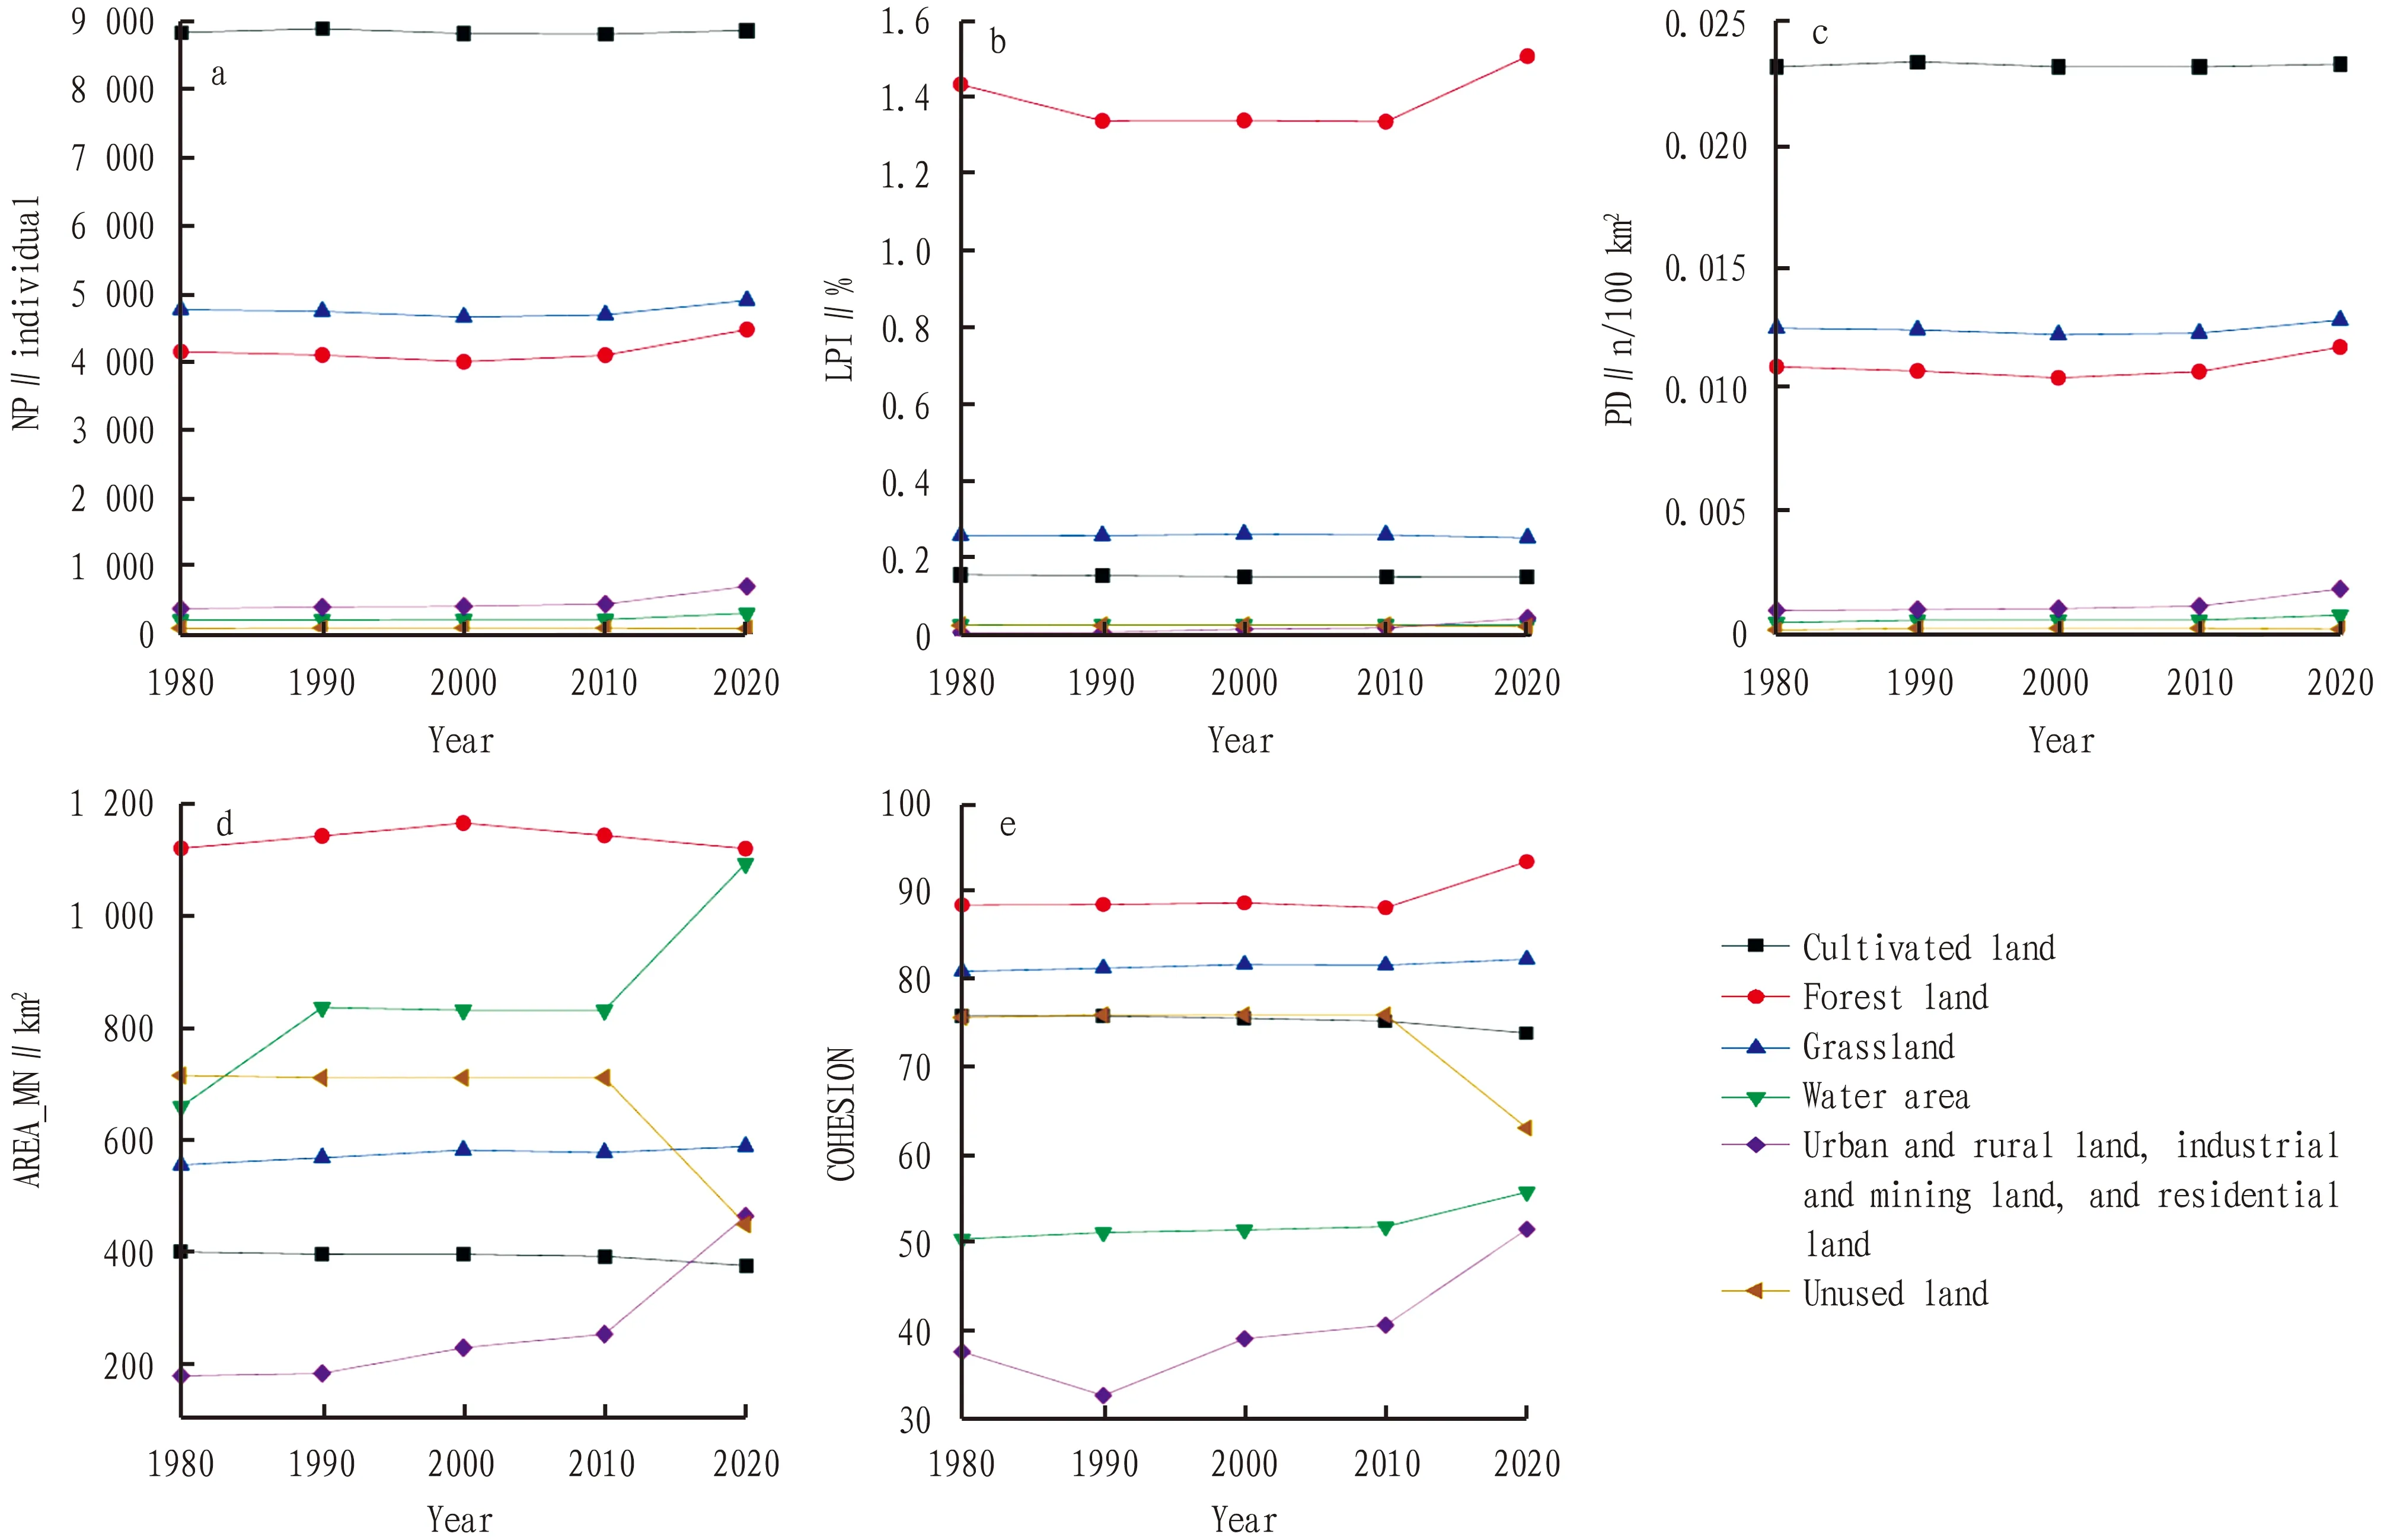
Fig.2 Landscape index change at type level
4.2.2Analysis of landscape pattern at landscape level.As shown in Table 3, the NP and PD in the study area showed different degrees of growth from 1980 to 2020, rising from 51 076 and 0.133 5 to 54 291 and 0.141 7, with an increase of 6.29% and 6.14%, respectively; the AREA_MN decreased by 5.83% from 749.242 3 to 705.597 6; the CONTAG decreased by 4.79% from 40.480 5 to 38.543 3; the FN increased from 0.129 6 to 0.137 8, with an increase of 6.33%, indicating that the overall degree of fragmentation in the study area had an increasing trend, the landscape connectivity in the area decreased, and the landscape heterogeneity increased, which led to the difficulty of maintaining ecological balance and habitat quality in the area.The SHDI increased from 1.972 6 to 2.039 0, indicating that the structural weakening of landscape had a certain equilibrium trend.This was because the increase in human-induced landscape, caused by rapid growth of urban and rural land, industrial and mining land, and residential land from 1980 to 2020, had led to a continuous decrease in the area of cultivated land, and the difference in the proportion of area occupied by each landscape type was reduced, showing an upward trend of SHDI index.
4.3 Spatio-temporal evolution of habitat quality in Yunnan ProvinceHabitat quality index is used to represent the quality of habitat, and the higher the value, the better the quality of habitat.The degradation of habitat quality within the maximum threat distance is caused by the increase of land use intensity, which will lead to the increase of threat source and intensity[33].The spatial distribution of habitat quality in Yunnan Province from 1980 to 2020 can be obtained by running InVEST model.In order to explore the changes of habitat quality, the calculation results of habitat quality index of 5 periods were divided into 5 grades by natural break grading method in ArcGIS, namely low[0-0.2), relatively low[0.2-0.4), medium[0.4-0.6), relatively high[0.6-0.8)and high[0.8-1.0](Fig.3), and the proportion of habitat quality of each grade in 5 periods was constituted(Table 4).The relationship between habitat quality and land use/cover change can be analyzed by studying land use change and landscape pattern index change.
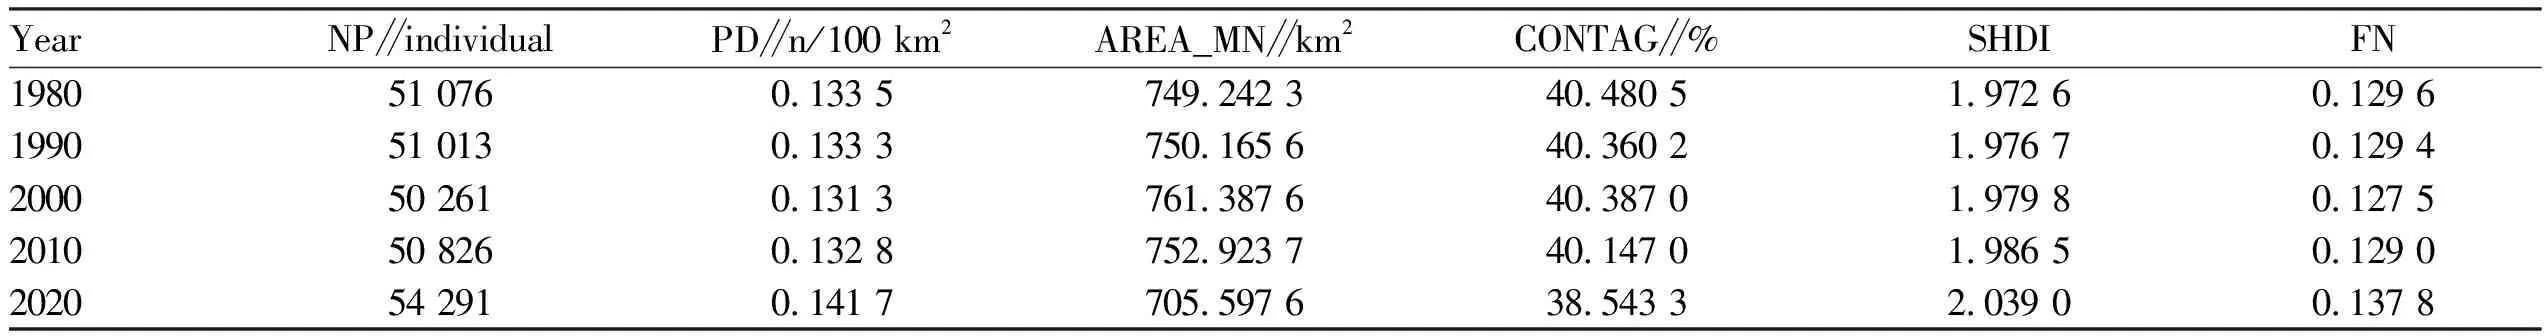
Table 3 Landscape pattern index at landscape level
According to the spatial pattern in Fig.3, the habitat quality in Yunnan Province roughly showed a "high-low-high" distribution from northwest to southeast, with medium-and higher-grade habitats occupying most of the area, and the overall habitat quality was above the average.There was a corresponding relationship between the distribution of habitat quality and land use types.The areas with high habitat quality were mostly distributed with forest land and natural grassland, while the areas with unused land had low habitat quality.High and relatively high grade habitats were mainly distributed in the northwest region, where a large number of forest land, natural grassland and Haba Snow Mountain Nature Reserve were distributed.Because of the dramatic and steep terrain, it is not easy to be disturbed and destroyed by human factors.There were medium-grade habitats in the southeast with cultivated land as the main land type, and man-made disturbance was limited in this area.The relatively low and low grade habitats were concentrated in the central area, and the main land types were urban and rural land, industrial and mining land, and residential land.
From the time scale shown in Table 4, the proportion of low and relatively low grade habitats hardly changed from 1980 to 2010, and only fluctuated slightly in 2020.From 1980 to 1990, the medium-grade habitats showed little change, but there was a significant transition between relatively high grade and high grade habitats, with the proportions increasing by 0.14% and decreasing by 0.23%, respectively.Since 2000, the number of relatively high and high grade patches had increased to varying degrees.The main reason was that Yunnan Province had vigorously promoted the policy of "returning farmland to forest" since 2000, which promoted the conversion of lower grade habitats such as unused land to higher grade habitats such as forest land.From 2010 to 2020, the habitats of medium and higher grades were transformed in the same proportion.It can be explained by land use change.The area of urban and rural land, industrial and mining land, and residential land increased by 2 453 km2during this period.The large increase in the area of low-grade habitat threatened the surrounding habitat, resulting in the decline of the overall habitat quality.In addition, the degradation of some wasteland to unused land also had a negative impact on the habitat quality.From the perspective of landscape pattern, the CONTAG decreased by 1.60%, and the degree of separation between habitat patches increased.At the same time, the stress level of threat factors on habitat increased due to the increase in the NP of urban and rural land, industrial and mining land, and residential land, resulting in a downward trend in the overall habitat quality.
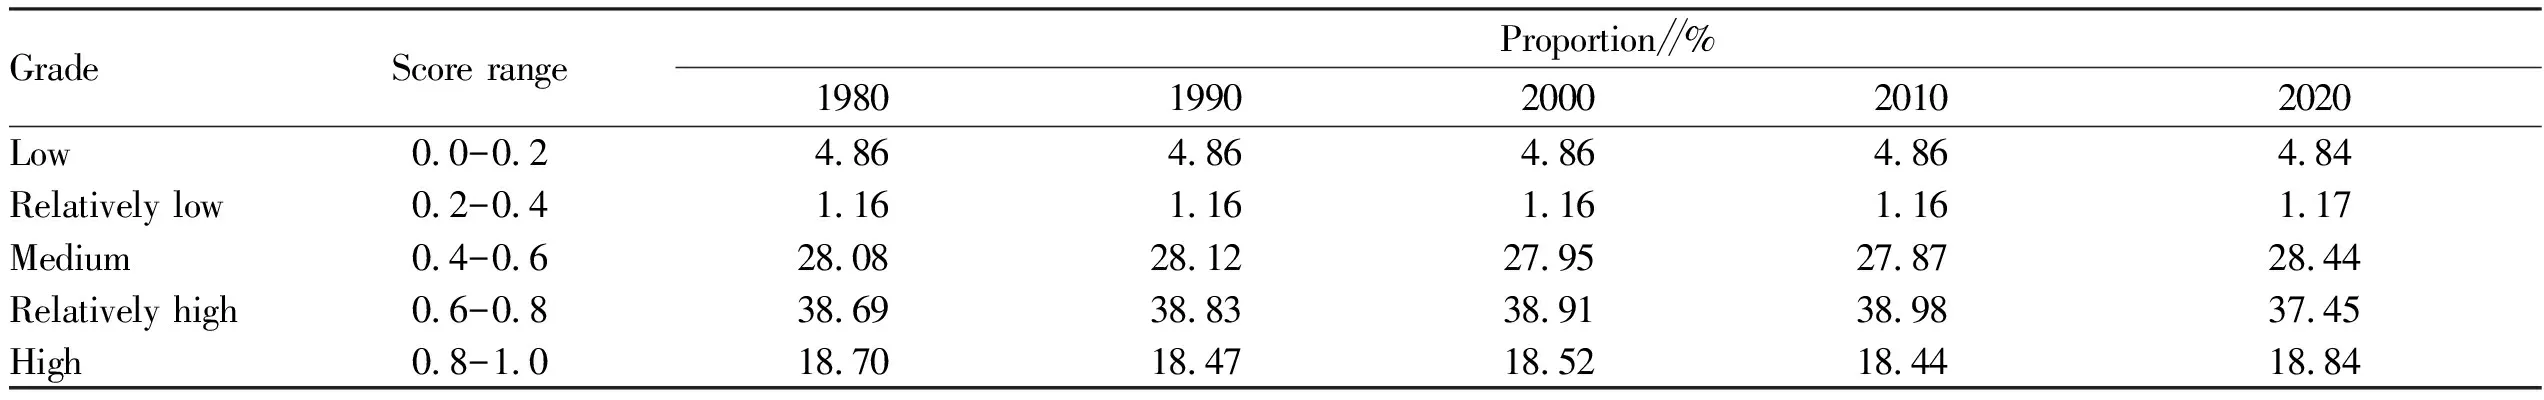
Table 4 Proportion of habitat quality at different grades in different years
In general, the mean values of habitat quality in the province from 1980 to 2020 were 0.622 3, 0.621 5, 0.621 5 and 0.616 3, which decreased year by year, indicating a downward trend of habitat quality in the province.The proportion of forest land, grassland and cultivated land as the landscape matrix in the province fluctuated steadily, and the overall habitat of the province did not change significantly.From 2000 to 2010, the forest land area increased greatly due to the active implementation of "returning farmland to forest" project and ecological management of steep slopes.From 2010 to 2020, the acceleration of urbanization promoted the modernization level, and the area of urban and rural land, industrial and mining land, and residential areas increased by 48.6%, showing a large increase; the increase of forest land area was relatively gentle of only 0.36%.From 1980 to 2020, the proportion of patches in Yunnan Province changed little in low and relatively low grades, followed by medium grade habitat patches, with an increase of 0.36%.The main reasons for the increase of the mean patch area and the increase of aggregation degree of forest land were the implementation of "three lines and one list" and "afforestation" projects, and relatively high and high grade habitats decreased by 1.24% and increased by 0.14%, The main reason was that cultivated land was converted to urban and rural land, industrial and mining land, and residential land during this period.The increase in the NP of urban and rural land, industrial and mining land, and residential land is bound to crowd out and adversely affect high-quality habitat patches, and aggravate the degree of habitat fragmentation.
5 Conclusions
With typical mountain plateau area, Yunnan Province as an example, the research field of habitat quality was extended to the provincial level, and the relationship and response among land use change, landscape pattern change and habitat quality were discussed.The study enriches the similar research results in the mountainous and plateau region, provides a reference for the construction of regional ecological security system in the future, and plays a positive role in the optimization of spatial pattern.
(i)From 1980 to 2020, the land use change in Yunnan Province showed a sharp increase in urban and rural land, industrial and mining land, and residential land, a significant decrease in cultivated land, and a gradual increase but insignificant overall change in forest land.It was represented by the transformation of cultivated land into urban and rural land, industrial and mining land, residential land and forest land, and the transformation of grassland into cultivated land and forest land.The above land use changes resulted in the increase in man-made landscape area and the decrease in natural landscape area, which led to the decrease of patch aggregation and mean patch area, and the enhancement of landscape heterogeneity and landscape fragmentation.(ii)With the development of productivity, the rising level of the central region was higher than that of the northwest and southwest regions.The distribution trend of habitat quality was opposite; the distribution of habitat quality in the central region was low, while that in the northwest and southwest regions was high, and the overall habitat quality was low.The habitat quality in the last period decreased faster than that in the first 3 periods, and the habitat quality around the city and near the river basin decreased significantly.Artificial surface encroached on ecological land and intensified its fragmentation.Combined with the spatial differentiation and change trend of habitat quality, it can be concluded that human factors have a great impact on habitat[35].(iii)In general, the quality of habitat in the province was stable and slightly decreased.The increase in construction land area led to the intensification of habitat fragmentation, and then the number of low-grade habitat patches in the region increased.Therefore, facing the characteristics and differences of habitat in different regions within the region, it is necessary to make targeted adjustments and formulate corresponding optimization strategies to further control the conversion direction among land use types and slow down the conversion speed.The land use types of high-quality habitats should be protected to reduce the occurrence of damage to the continuity of landscape patches and create a distribution pattern of land type agglomeration.
In the process of urban development, how to improve people’s happiness while making people and nature coexist in harmony and form a complete virtuous cycle needs to be discussed by the whole society, so as to implement the overall planning to meet the needs of urban development and explore the most appropriate urban landscape pattern[36].In the future, more sub-modules in the model can be included in the analysis scope in combination with research needs, and the correlation between land use change and changes of multiple ecosystem services can be studied by combining quantitative assessment and other methods.
杂志排行
Asian Agricultural Research的其它文章
- Nitrogen Accumulation and Transport Characteristics and Grain Protein Content of Wheat Varieties with Different Nitrogen Efficiencies and Their Responses to Irrigation
- Antibacterial Effects of Essential Oils from Pomegranate on Two Kinds of Postharvest Pathogenic Fungi
- Construction of Water-saving Ecological Aquaculture Model in Ponds in North China
- Comparison of Benefits of Different Tobacco Loading Methods and Matching Baking Processes in Intensive Curing Houses
- Effects of Mechanical Harvesting of Main Crop on Soil Rolling and Yield of Ratooned Rice
- Relationship between Vegetation Index and Forest Surface Fuel Load in UAV Multispectral Remote Sensing