Amplitude modulation excitation for cancellous bone evaluation using a portable ultrasonic backscatter instrumentation
2022-11-21BoyiLi李博艺ChengchengLiu刘成成XinLiu刘欣ThoTranYingLi李颖DanLi李旦DongshengBi毕东生DuweiLiu刘度为andDeanTa他得安
Boyi Li(李博艺) Chengcheng Liu(刘成成) Xin Liu(刘欣) Tho N.H.T.Tran Ying Li(李颖) Dan Li(李旦)Dongsheng Bi(毕东生) Duwei Liu(刘度为) and Dean Ta(他得安)
1Academy for Engineering and Technology,Fudan University,Shanghai 200433,China
2The Center for Biomedical Engineering,Fudan University,Shanghai 200433,China
3The State Key Laboratory of Medical Neurobiology,Fudan University,Shanghai 200433,China
The ultrasonic backscatter(UB)has the advantage of non-invasively obtaining bone density and structure, expected to be an assessment tool for early diagnosis osteoporosis. All former UB measurements were based on exciting a short single-pulse and analyzing the ultrasonic signals backscattered in bone. This study aims to examine amplitude modulation(AM)ultrasonic excitation with UB measurements for predicting bone characteristics. The AM multiple lengths excitation and backscatter measurement (AM-UB) functions were integrated into a portable ultrasonic instrument for bone characterization. The apparent integrated backscatter coefficient in the AM excitation (AIBAM) was evaluated on the AM-UB instrumentation. The correlation coefficients of the AIBAM estimating volume fraction (BV/TV), structure model index(SMI),and bone mineral density(BMD)were then analyzed. Significant correlations(|R|=0.82-0.93,p <0.05)were observed between the AIBAM,BV/TV,SMI,and BMD.By growing the AM excitation length,the AIBAM values exhibit more stability both in 1.0-MHz and 3.5-MHz measurements. The recommendations in AM-UB measurement were that the avoided length (T1) should be lower than AM excitation length, and the analysis length (T2) should be enough long but not more than AM excitation length. The authors conducted an AM-UB measurement for cancellous bone characterization.Increasing the AM excitation length could substantially enhance AIBAM values stability with varying analyzed signals.The study suggests the portable AM-UB instrument with the integration of real-time analytics software that might provide a potential tool for osteoporosis early screening.
Keywords: ultrasonic backscatter measurement,amplitude modulation,osteoporosis,bone diagnosis
1. Introduction
Osteoporosis is a systemic skeletal and metabolic disease[1–3]that is becoming a serious public health challenge to both developed and developing countries.It occurs in the elderly,the pregnant,or even adolescents.[4]Longevity resulting in aging populations may lead to an increase in prevalence.[5]The researchers estimated that the majority of adults over the age of 50 years in China will surge from 15.55% in 1990 to 23.43%in 2050.[6]In recent years,osteoporosis has brought a heavy economic burden[7]to patients and society.[8]
The key to osteoporosis early diagnosis is detecting bone characteristics degeneration. Bone characteristics degeneration relies on multiple factors,[9]including bone mineral density (BMD) and microstructure reduction, which are strongly associated with morbidity and disability.[10]Commonly, BMD reduction is considered of substantial importance to the strength of bones and correlates to osteoporotic fracture.[11]On the other hand, microstructures characteristics such as the bone volume fraction (BV/TV), the structural model index (SMI), the trabecular thickness (Tb. Th),and the trabecular number (Tb. N), are also responsible for the compression strength of the bone and are crucial factors for bone integrity. Additionally, collagen type I in bones essentially provides the bone with tensile strength and ductility due to its viscoelastic properties. Now advanced age,[12]genetics, ethnicity,[13]low body weight, physical inactivity,diet,heavy smoking,excessive alcohol consumption,vitamin D deficiency,and inadequate calcium intake[14]are known risk factors for osteoporosis. Lactation and postmenopausal osteoporosis also threaten females’health.The development of new methodologies and instrumentation for osteoporosis wholebone early screening and treatment has become a global focus.
The dual-energy x-ray absorptiometry (DXA)[15]evaluating the BMD has been extensively exploited in diagnosing osteoporosis. The BMD index derived from the x-ray attenuation describes a two-dimensional(2D)plane density and usually expressed in the unit of g/cm2. The DXA image is the projection of volume onto a plane in bone tissue. The fracture risk assessment tool(FRAX)[16]combines DXA and multiple osteoporosis risk factors for diagnosis. It is worth mentioning that more than 50%of fracture cases occur without BMD shortage. However, these DXA-based tools could not fully predict the biomechanical stiffness and strength of bones. The BMD, microstructures, collagen, and non-mineralized composition are co-determining the bone biomechanical and associated with osteoporosis fracture risk.[17]Balancing highcost DXA services[18]while screening osteoporosis has become a serious problem in both developed and developing countries. At the same time, fast and low-cost risks of bone fracture assessment services and instruments are in increasing demand.[19]
Quantitative ultrasound(QUS)could achieve the biomechanical characteristics in bone diagnosis,[20]which has the advantages of safety without ionizing radiation,[21]quick deployment,and low cost.[22–24]Recently,Wearet al.[25–30]and Matsukawaet al.[31]reviewed that ultrasound is an effective tool in bone diagnosis. The QUS has led to development of many approaches, including ultrasonic axial (UA),[32–38]ultrasonic transmission(UT),ultrasonic backscatter(UB),ultrasonic echo-graphic (UI),[39]and ultrasonic computer tomography(USCT).Due to the physical structure limitation of the dual transducers, UA and UT are challenging to measure areas where potential fractures occur sites,such as the proximal femur,lumbar,hip,and calcaneal.The cancellous bone degeneration in these sites has correlations with osteoporosis.[40,41]
In the recent decade, UB intelligently utilizes one transducer to achieve excitation and receiving. The previous explorations were mostly focused on the propagation of a singlepulse into bones, extracting parameters from backscatter signals,[42–44]and estimating bone characteristics.[45–49]The apparent-integrated backscatter coefficient(AIB),[50]as a crucial parameter in UB for bone evaluation, has been validated in the neonate reflecting cancellous bone characteristics.[51]AIB is also exploited for the dynamic characterization of material properties to monitor the setting process of bone-graft substitutes.[52]Several backscattering parameters,[53–56]such as BC and IRC,were proposed for the estimation of bone. Recently, Hoffmeisteret al.[57]extracted features directly from the amplitude of the backscatter signal in the time domain for estimating bone characteristics, including the amplitude decay constant (BADC), the normalized mean of the backscatter amplitude ratio, and difference(nBAR,nMBD).It should be noticed that the above parameters are based on using a short single-pulse excitement method. However, the cancellous bone responses to the ultrasonic amplitude modulation(AM)with multi-length excitation have not been fully understood. It motivates us to develop portable instrumentation integrated AM-UB technique for the assessment of bone characteristics.
In the present scrutiny,the main objectives are to extract the AM-UB parameter from the cancellous bone’s backscatter signal when using multi-length AM excitation; and to evaluate its performance in estimating bone characteristics.A novel AM-UB instrumentation is developed,and an AM-UB parameter namely the AM excited AIB coefficient (AIBAM) is proposed, and its performance is proved for estimating BV/TV,SMI,and BMD.
2. Methods
Thein-vitroexperiment processing and data acquisition flowchart are illustrated in Fig.1(a). To examine the AM-UB method performances,both the AIBAMresults and the micro-CT scanned BV/TV,SMI,and BMD results are compared and analyzed. The AM excitation’s central frequency and length effect on AIBAMperformances are also studied. Details are as follows.
2.1. Preparation specimens, micro-CT, and AM-UB measurement processes
A total of twenty-four cancellous bones are prepared before thein vitroexperiment. The preparation process is as follows. The fresh bovine femur’s heads and neck are dissected and sliced by an automatic electric bone cutter (260-1500W, DARIBO, China). All bone tissues are polished into 15 mm×15 mm×10 mm cuboid shapes specimens. Then specimens are immersed in 0.9% saline at a temperature of 39°C and washed marrow and lipids out of the medullary cavity by employing a high-power irrigator. Finally, degassing specimens are in distilled water for 30 minutes and then scanned by a micro-CT Sky-scan 1076 scanner(Skyscan,Antwerp, Belgium). By employing 75 kV and 130 μA with rotating from 0°to 180°at intervals of 0.8°to fully scan each specimen. All scanned data are imported into NRecon and CTan software suites(Skyscan,Antwerp,Belgium)for the reconstruction and statistics analysis. The statistics characteristics of specimens including the BV/TV, SMI, and BMD parameters are listed in Table 1. In AM-UB measurement,each specimen is non-exposed to the air and separately degassed for 30 minutes before measurement. A digitally controlled water heater(HY-738 800 W,HANYANG,China)regulates the deaerated distilled water temperature at 19.0±0.5°C in a water tank.
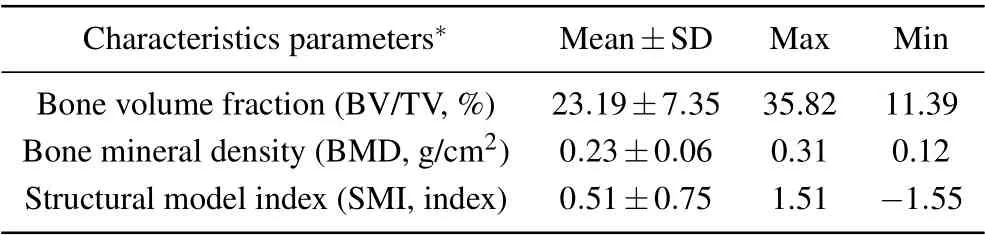
Table 1. Statistics of micro-CT measured specimens’characteristics results.
2.2. AM-UB instrumentation features, algorithm, and measurement processes
The developed bone ultrasonic diagnosis and therapy instrumentation (BUDT), which is supporting multiple lengths AM excitation and high sampling resolution UB measurement,its hardware architecture, and software user interface, as presented in Figs.1(c)–1(e). The AM-UB process in instrumentation is as follows:(i)the FPGA(Xilinx spartan 6,CA,USA)generated AM digital signal with adjustable central frequency and length;(ii)an Analog Front to End IC(LM96551,TI.Inc.USA)amplified digital signal and outputted to transducers to generate AM excitation,the central frequency supported from 0.2 MHz to 15.0 MHz; (iii) an Analog-to-Digital Converter(ADC) (AFE5803, TI. Inc. USA) with 8 channels received backscatter signals at a bandwidth 50 MHz/60 MHz sampling frequency with 12-bit or 14-bit resolution; (iv) the FPGA reconstructed ADC data and transferred it to an advanced RISC machines (ARM) processor; (v) the AIBAMis evaluated and saved by the ARM processor(Exynos 4412,Samsung,Korea)and then displays results on a 10.1-inch (1 inch=2.54 cm)touchscreen. BUDT supports synchronization with external devices, equips the USB interface, expandable storage up to 4.0 TB,Bluetooth 5.0,Wi-Fi,and 4G/5G cellular networks to easily upload data to the cloud server. The BUDT is powered by alternating current (AC) from 100 V to 230 V, or direct current (DC) 21-V lithium batteries lasting 18 hours. All the above components and transducers are integrated into BUDT,weight 1.5 kg with 27.0 cm×23.0 cm×4.5 cm. Compared with the traditional UB measurement platform constructed by a signal generator,a signal amplifier,a power amplifier,a PC with a display, and numerous power supplies with BNC connectors and cables,our portable instrumentation integrates all the above components in one device. It offers a solution with high integration, real-time display results, programmable and extensible functions,miniaturization,portability,and rapid deployment in clinical measurement.
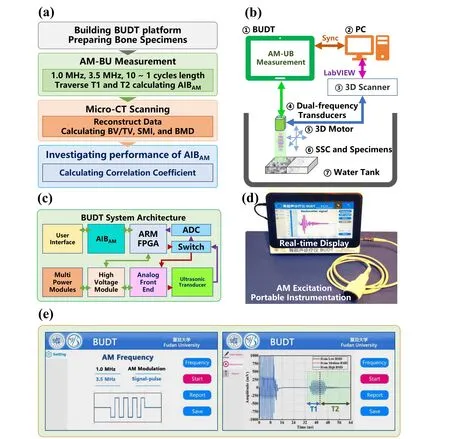
Fig.1. Experiment process,(a)flowchart,(b)measurement platform,(c)the architecture of BUDT,(d)hardware user interface,(e)software user interface.
The AM ultrasonic excitation could be written by

whereAdenotes the maximum amplitude of the AM excitation,and it is set as 84.0 voltage peak to peak. The AM central frequencyfcis set equal to 1.0 MHz and 3.5 MHz,corresponding to the center frequency of the transducers. A rectangular functionG(N/fc) is the modulation signal. The AM excitation total length sustainedN/fc(μs),where the cycleNequals[10,9,...,1],especially the case ofN=1 represents the traditional UB single-pulse excitation.
The BUDT connects two planar ultrasonic transducers(V539, V546, Olympus-Panametrics Inc., MA, USA), as demonstrated in Fig.1(b),which have 1.0 MHz and 3.5 MHz central frequency with a 6.35-mm and a 12.70-mm diameter. The transducers are driven to move by a three-axis precision displacement controller(Ultrapac scanning,PK268-03B,NJ,USA),and the LabVIEW SDK suite(National Instrument,USA). A polished SUS304 stainless steel cuboid (SSC, sizes 30 mm×30 mm×30 mm)is placed 25.4-mm distance to the transducers in distilled water, and then placed all degassed specimens’ surfaces parallel to the SSC. The region of interest(ROI)is locked in the same range of 15.0 mm×15.0 mm.It methodically controls and adjusts both the distance and angle of transducers to ensure the reflections from each specimen travel at the same time as from the surface of the SSC.The BUDT generates the AM excitations with ten kinds of lengths(Nfrom 10 to 1),respectively. Averaging 1024 times in each measurement, thus a total of 20480 backscatter signals are recorded for each specimen. We propose a parameter AIBAM(dB)[50]definition. The AIBAMcould be formulated in the following form:
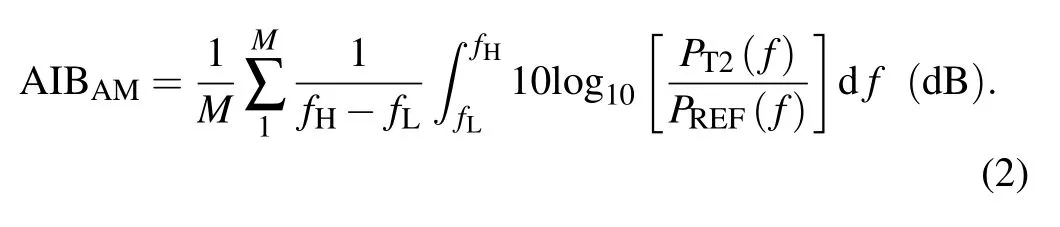
The detailed calculation process of AIBAMis given as follows. First,the signal of interest(SOI)is segmented backscatter signals into avoided length (T1) and the analysis length(T2)by two rectangular-window functions,where thePT2(f)represents the backscatter signal’s power spectrum in T2,andPREF(f)denotes a reference power spectrum,which acquired signals from the SSC. The functionPT2(f) is divided byPREF(f)to eliminate systematic errors,such as possible fluctuations in the near-field measurement. The limits of integration (i.e.,fLandfH) are set as 0.51 MHz–1.30 MHz and 1.62 MHz–4.69 MHz corresponding to the-6-dB bandwidth in reference power spectral density, which is acquired from SSC signals using single-pulse excitation. Then each specimen is measured and averagedM(equal to 1024) times to calculate AIBAM. Finally,the AIBAMequation is compiled in Matlab (Mathworks, Natick, MA, USA) and deployed equation in the BUDT through Matlab Coder Toolbox and Android NDK(Google Inc.,CA,USA).The BUDT has a friendly APP with its hardware drivers for users,which directly operates on an open-source Android operating system.
2.3. The statistical analysis to examine the AIBAM performance
The statistical analysis that Pearson’s linear correlations coefficients (R-value) and a 95% confidence interval (CI) are computed, examine the performance for AIBAMto estimate BV/TV,SMI,and BMD.The result is considered statistically significant when thep-values are lower than 0.05. The BUDT updates all data to an Intel Core i5-11400H 64 GB Memory notebook (Legion Y7000P, Lenovo, China), and then all statistical computations are processed in the notebook by SPSS Statistics(IBM Corporation,New York,USA)and visualized by Origin graphing software (OriginLab Northampton, MA,USA).All data are checked in SPSS Statistics through the KS normality test that BV/TV,SMI,BMD,and AIBAMobey the normal distribution in measurements.
3. Result
3.1. The cancellous bone responds to AM excitation
Here we show AM-UB measured three BV/TV levels cancellous bones as an example illustrated in Fig. 2, which includes low(12.44%),medium(27.22%),and high(32.91%)cancellous bones responded to the AM excitation(AM central frequency 1.0 MHz with length 10 μs).
Figure 2(a)demonstrates the received 64.0-μs signal using thefc=1.0 MHz withG(N/fc)=10.0-μs length AM excitation. The total SOI length is 30.0 μs and highlighted in the figure. Subsequently, the SOI is segmented into T1 and T2. The start point of T1 is marked as an absolute value that reaches a 2%threshold of the maximum vibration. From 0 μs to 34.0 μs are not included because they may contain nearfield fluctuation.For preventing undesired signals of the multireflection between the transducer and cancellous bone,signals after SOI are excluded(>64 μs).
Intuitively, the backscatter signals present a fluctuating at the beginning (T1=0 μs, T2<2 μs), as highlighted in Fig.2(b),this phenomenon is consistent with the single-pulse UB results. However,it is substantially different from singlepulse results,[59]in which a constant amplitude vibration state can be detected (T1=2 μs, T2≤10 μs), and the duration is roughly equal to the AM length. Finally,the signal’s envelope presents an exponential attenuation function(T1=12 μs,T2≤10 μs).
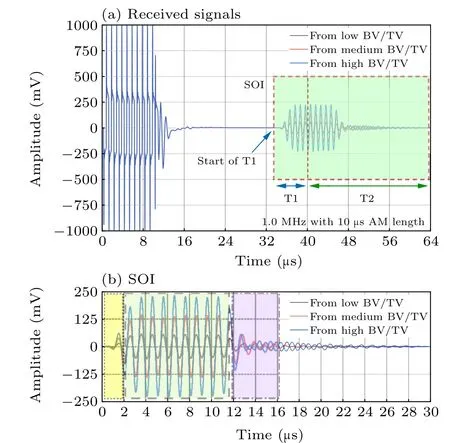
Fig.2. The cancellous bones response to the AM excitation.
3.2. The effect of AM excitation related factors on AIBAM performance
Each sample’s AIBAMresults at multiple-length AM excitation are evaluated using Eq. (2). Here we show AIBAMmeasured from a medium BV/TV(27.22%)cancellous bones responses to the 1.0-MHz central frequency AM excitation as an example. To compare the effects on AIBAMvalue stability, here set the AM excitation length as 10, 7,4, and 1 μs in Eq.(1),and the values of T1 and T2 are set as 0.1 μs~15 μs according to Fig.1(a). Figures 3(a)–3(c)illustrate AIBAMassociated with AM excitation length, T1, and T2. By settingG(N/fc)=1.0 μs in Eq.(1),N=1 stands for the traditional single-pulse excitation,in which the traditional AIB result has been shown in Fig.3(d).The AM excitation length is specified by the dotted lines,and each pixel represents a 0.1-μs step for T1 and T2.
The AIBAMvalues are stabilized when the values of T1 and T2 are lower than the pulse length. The stable values region shrinks with the decreasing of AM length,as presented in Figs. 3(a)–3(c). Especially, using the single-pulse excitation(AM length sets 1 μs),the stabilized AIB value is only placed within an exceedingly small interval(T1<1 μs),as presented in Fig.3(d). Meanwhile,T2 keeps a relatively small influence on the AIBAMvalues,as shown in Figs.3(a)–3(d). The same conclusion is also reached in our 3.5-MHz measurements.
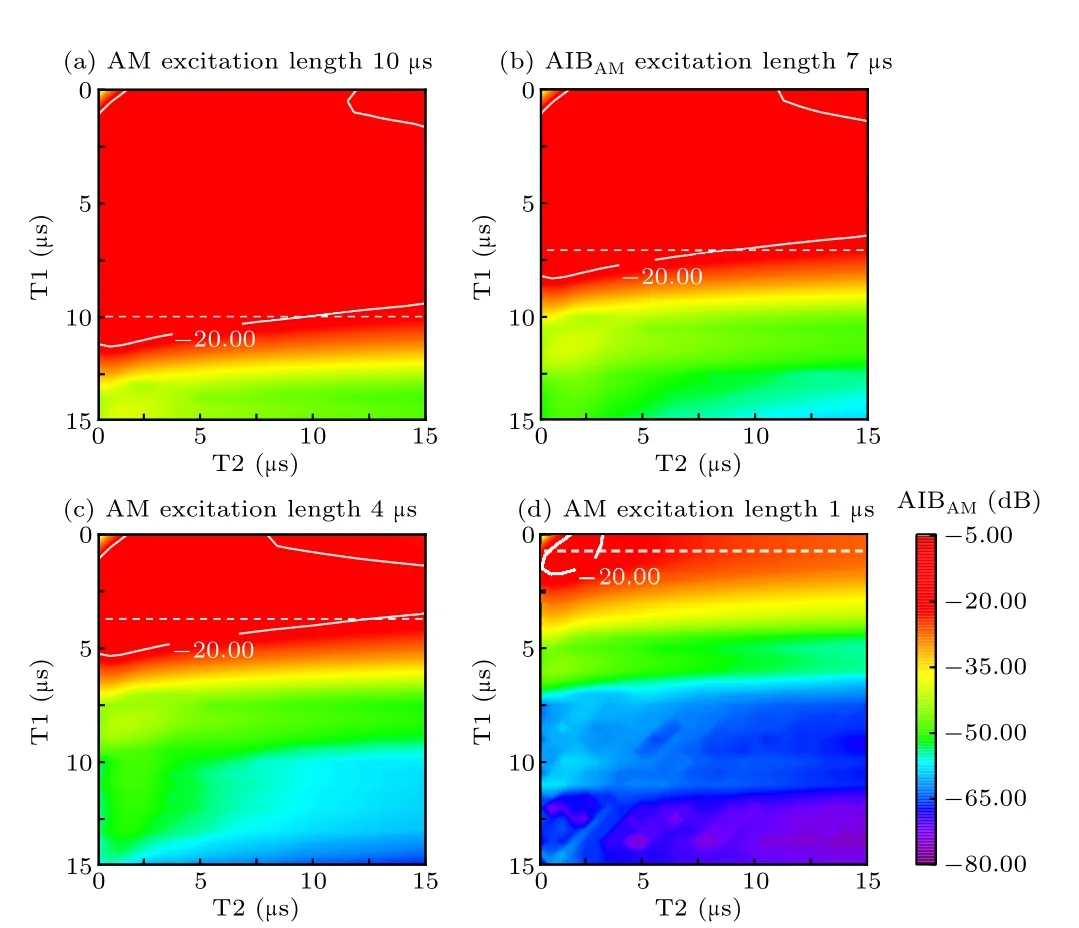
Fig.3. The AIBAM values varied with related factors,T1 and T2 on AIBAM results,(a)–(c)AM excitation,(d)traditional single-pulse excitation.
3.3. The effect of AM excitation central frequency on AIBAM performances
Based on the above results, in Eq. (1), let us setfc=1.0 MHz and 3.5 MHz,N=10 forG(N/fc) to examine the effect of the AM excitation central frequency on the AIBAMperformance. The maximum Pearson’s correlation coefficientR-value between AIBAMand BV/TV, SMI, and BMD with a 95%confidence interval(CI)are listed in Tables 2 and 3.
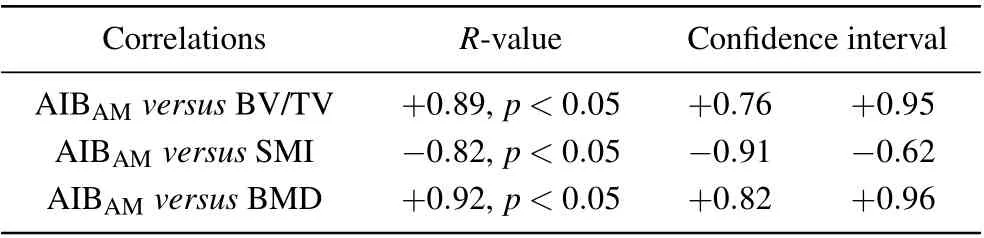
Table 2. The AIBAM performances using 1.0-MHz excitation.

Table 3. The AIBAM performances using 3.5-MHz excitation.
Figures 4–6 demonstrateR-value in 1.0-MHz and 3.5-MHz central frequency AM excitation measurement at intervals of 0.1-μs length in each T1 and T2 selection. Each R-value pixel represents the AIBAMperformance. The significant correlation areas have been marked with the contour lines. The obtained results reveal that the AIBAMhas a high performance and remarkably correlates to the BV/TV, SMI,and BMD in AM excitation measurement (|R| up to 0.93,p <0.05).
The AIBAMestimates BV/TV results, as presented in Fig.4. In the case of 1.0-MHz measurements,the strong positive correlations are chiefly concentrated in T1 from 0.1 μs to 10.0 μs and T2 from 1.0 μs to 10.0 μs. The|R|range is from 0.83 to 0.89,p <0.05, in Fig.4(a). For the case of 3.5-MHz measurements, strong positive correlations are also observed,which are essentially concentrated in T1 from 0.1 μs to 3.0 μs and T2 from 1.0 μs to 10.0 μs. The range of|R|is from 0.80 to 0.93,p <0.05, according to Fig. 4(b). The value BV/TV describes the bone volume density and could be treated as a bone density indicator. Moderately in higher BV/TV specimens, microstructures produce a stronger reflection and scattering,therefore,AIBAMsubstantially positively correlates to the BV/TV.
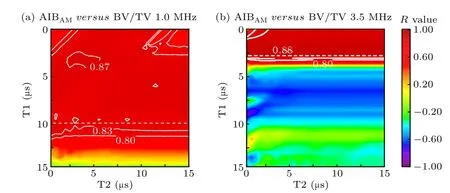
Fig.4. The correlations between AIBAM and BV/TV in terms of T1 and T2:(a)1.0-MHz results,(b)3.5-MHz results.
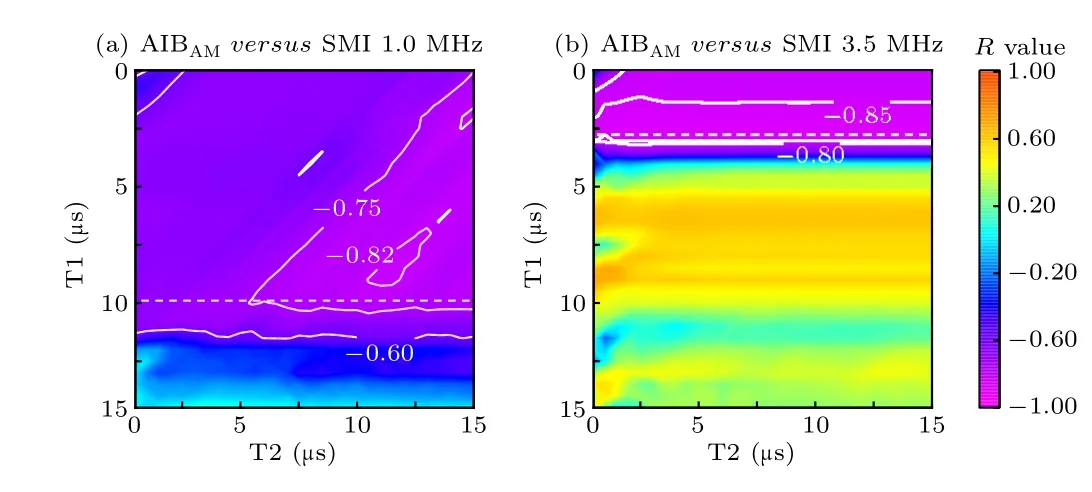
Fig.5. The correlations between AIBAM and SMI in terms of T1 and T2: (a)1.0-MHz results,(b)3.5-MHz results.
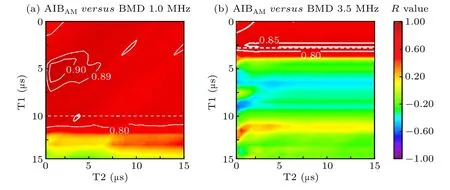
Fig. 6. The correlations between AIBAM and BMD in terms of T1 and T2:(a)1.0-MHz results,(b)3.5-MHz results.
The AIBAMalso estimates the SMI results, as demonstrated in Fig. 5. It is worth mentioning that the negative correlations are observed both in 1.0-MHz and 3.5-MHz measurements. According to Fig. 5(a), in the case of 1.0-MHz measurements,the significant negative correlations are mostly concentrated in T1 from 0.1 μs to 10.0 μs and T2 from 1 μs to 10.0 μs,where the corresponding|R|range is 0.75 to 0.82,withp <0.05. In 3.5 MHz measurements,the significant negative correlations are mainly concentrated in T1 from 0.1 μs to 3.0 μs, and T2 takes from 1.0 μs to 10.0 μs such that the range of|R| is 0.80–0.88, withp <0.05, as demonstrated in Fig. 5(b). The SMI is to describe trabeculae geometry in cancellous bone,plate-like geometry structure produces more negative SMI values, but rod-like geometry structure generates more positive values. The remarkable decrease in signal amplitude leads to the lessening of the AIBAMvalue when the bone alters from plate-like to rod-like geometry structure,thus,AIBAMwith SMI correlations are negative.
There exist strong positive correlations between AIBAMand BMD both in 1.0-MHz and 3.5-MHz measurements. In the case of 1.0 MHz(see Fig.5(a)),|R|range is from 0.80 to 0.91,p <0.05, which is essentially concentrated in T1 from 0.1 μs to 10.0 μs and T2 from 1.0 μs to 10.0 μs.For the case of 3.5 MHz(see Fig.5(b)),the achieved results reveal that the|R|range is 0.80–0.86,p <0.05,and the corresponding intervals of T1 and T2 in order are 0.1 μs–3.0 μs and 1.0 μs–10.0 μs.Considering when the BMD lessens,the signal amplitude and the AIBAMvalue noticeably reduce,thus,the AIBAMis positively correlated with the BMD.
4. Discussion
4.1. Transient-state and steady-state responses in the backscatter signal
Former researchers observed transient-state responses in single-pulse UB measurements, and the backscatter signal’s envelope approximates an exponential attenuation signal.However, the AM excitation to obtain steady-state responses has not been fully paid attention to before. In the present scrutiny, the AM-UB produces more information than the single-pulse UB in the time domain,as presented in Fig.2(a).The AM-UB backscatter signals fluctuate at the beginning of vibration(<2.0 μs),and finally,its envelope appears with an exponential attenuation signal (>12.0 μs). These results are consistent with the single-pulse UB studies. It should be also mentioned that the AM-UB introduces a steady-state response in the signal, and its maximum–minimum amplitude keeps steady from 2.0 μs to 12.0 μs (see Fig. 1(b)). It implies that the responses are associated with the length of excitation. The steady-state signal length in the time domain also decreases with the lessening of the AM length, resulting in AIBAMstabilizes value region significant contraction. This process has been illustrated in Figs.3(a)–3(d).
The reason for the steady-state response could be explained by the theory of mechanical vibrations. Although complex microstructures of trabecular in cancellous bone,herein, we assume and simplify a lumped cancellous bone model for the discussion. In this model, the cancellous bone mass is concentrated at a single degree of freedom coordinate. It could be depicted as the stiffness coefficient of a linear spring, exerting a force, and the displacement would be proportional to the mass. When the AM excitation acts on the cancellous bone, the vibration of cancellous bones to the AM excitation force could be described as a forced vibration process, and the corresponding ordinary differential equation(ODE)of motion could be written as

where equation(3)[60]represents a nonhomogeneous secondorder ODE with constant coefficients,Bmis described as the trabecular mass in bone,Bcis the damping coefficient,Bkis the stiffness coefficient,x(t) is the dynamical displacement,andFAM(t)represents the AM external forces. The received backscatter signals in the SOI could be outlined as total responses[61]

It can be seen from Eq. (4) that the responses to the AM excitation are divided into two parts,the transient-state responsexT(t) and the steady-state responsexS(t). The transient response could be written asx(t)=Xest. By imposing the rest conditions (the initial displacement ofx0= 0, the initial velocity ofv0= 0), andFAM(t) = 0, then thexT(t) could be determined by solving Eq.(3)in the following form:

Equation(6)[60]clearly suggests that the steady-state response length would be the same as the duration of the AM external force.[62]Therefore, too short single-pulse excitation causes transient and steady-state responses overlaying in signal,then reduces the AIB performance. However,the AM-UB extracts the AIBAMfeature from the steady-state response and effectively deduces AIBAMfluctuation through increasing the AM length. It is one of the reasons that the AM-UB performs better than the previous studies. The single-pulse UB results and the performance comparison are provided in Table 4.
4.2. AM-UB versus single-pulse UB performance comparison
In conventional single-pulse UB measurement, the AIB represents a complex product of the backscatter effect.[42,50]In the present study, AIBAMincludes the effects mentioned above, and the surface and subsurface characteristics in cancellous bone are analyzed by selecting T1 and T2. For the case of T1 length shorter than the AM excitation length, the signal mostly includes a backscatter effect,such as AM excitation length=10 μs,T1=2 μs,T2≤12 μs,and the signal amplitude chiefly presents a steady state. In the case of T1 greater than the AM excitation length,theFAM(t)=0 leads to the rapid decaying of the signal amplitude.It could explain the reason that AIBAMstabilized region shrinks with the growth of the AM excitation length and sharply reduces by growing of T1, such as the regions specified by T1>AM excitation length,as marked in Fig.3.
The formerly conducted explorations in 2009[54]and 2015[63]exhibited significant positive correlations (R=+0.74~+0.78,p <0.05)between the AIB and the BV/TV in both 1.0-MHz and 3.5-MHz measurements. Liuet al.[64]examined the AIB correlations to the BV/TV from 0.5 MHz to 10.0 MHz in single-pulse UB measurements. Recently, Liet al.[65]obtained a substantially stronger correlation by selecting appropriate T1 and T2 in 1.0-MHz single-pulse UB measurement,|R| up to 0.86,p <0.05. However, noticing these previous studies’results,[63,66]the significant correlation only exists in a tiny interval of T1, so it could be difficult to select its appropriate T1 whenin-vivo. The signal-to-noise ratio(SNR)could be lower due to the attenuation effect of tissues,and the individual differences in the thickness of soft tissues;therefore,it could be difficult to precisely determine the starting point of T1 causing value fluctuation in Fig.3(d).
In the present study, the obtained results reveal that the AIBAMexhibits a better|R| performance for estimating BV/TV than the single-pulse UB listed in Table 4. Compared to previous investigations, the range of T1 options has been expanded by 2 to 10 times. T1 expands from (0–2.0) μs to (0–10.0) μs in the presence of 1.0-MHz measurement.In the case of 3.5 MHz, T1 expands from (0–1.5) μs to(0–3.0) μs. Moreover, T2 could be from 1.0 μs to 10.0 μs in this time domain both in 1.0-MHz and 3.5-MHz measurements,and thePT2(f)is relatively stabilized in the frequency domain.This issue could be one of the reasons that the AIBAMpresents more correlation with BV/TV than the single-pulse AIB. Compared with the previous studies’ offline analysis of data through multiple scientific instruments,the BUDT offers a one-stop measurement service,less than 1-ms real-time measurement,and 60 fps display results with quickly deploy.
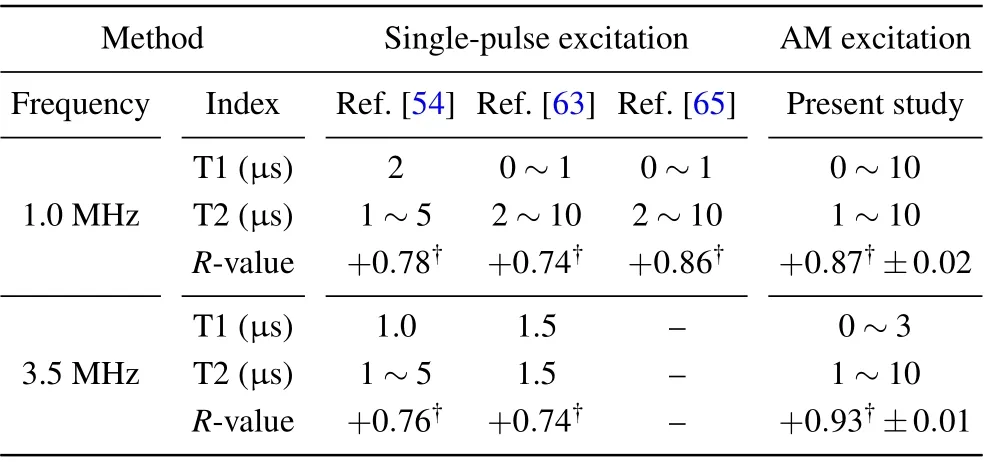
Table 4. Performance comparison between single-pulse UB and AM-UB.
4.3. Recommendations for selections of AM excitation lengths T1 and T2
Selecting the appropriate T1 starting point and T2 length are of particular significance for measurements. The individual differences in soft tissue that cause the thickening are mostly unknown,[67]and the distance varies between the surface of the transducer and the curved surface of the bone. Perhaps, the single-pulse excitation cannot be a good excitation because accurately determining the starting point of T1 could be a challenge from a low SNR signal; on the other hand, by employing a short pulse, the AIB may fluctuate with T1, as illustrated in Fig. 3(d). These factors could produce a lower AIB performancein-vivothanin-vitro.
In this study, by increasing the AM excitation length,the steady amplitude state with high SNR is observed from 2.0 μs to 12 μs, as demonstrated in Fig. 3(b). The AIBAMpresents much more stability and correlates to bone parameters in the ranges of T1 and T2,as illustrated in Figs.3(a)–3(c)and Figs.4–6. The AIBAMmay enhance the performance of fracture risk prediction. According to the above extracting AIBAMconclusions, we advise that the value of T1 should be lower than the AM excitation length, and the level of T2 should be appropriately long but not more than the AM excitation length.Considering the AM lengthG(N/fc),theNshould be appropriately more when using a high center frequencyfctransducers. Appropriately increasing the AM length would be more conducive to observing steady-state and obtaining a more stabilized AIBAMvalue. However, it should be customizedinvivo. As shown in Fig.2(a)from 0 μs to 34.0 μs,it could be considered a signal from the soft tissue,the AM length should be set according to the thickness of soft tissue when thein-vivomeasurement is employed.An improper AM length will result in a backscatter signal and secondary reflection signal aliasing.In addition,the planar transducer should be placed parallel to the surface of the bones duringin-vivomeasurement.
4.4. Limitations
The main limitations exist as the following. This study constructed anin-vitroAM-UB measurement method. However, the human skeleton is naturally curved, and thereby the diffraction effects should be appropriately corrected ifin-vivoAM-UB measurement. On the other hand, AIBAMestimates other microstructural parameters that will be further explored,such as utilizing higher frequency AM excitation to estimate Tb.Th,and Tb.N.
5. Conclusion
This paper introduces a novel AM-UB instrumentation that provides a one-stop estimation bone service with easy and quick deployment.In-vitroexperiments are performed to validate the advantages of the AM-UB method and instrumentation.The main findings of the present study are itemized in the following. Firstly, the steady-state responses are successfully observed through multiple-length AM excitation acts on cancellous bone. Secondly,the extracted AIBAMparameter could be a biomarker in estimating BV/TV, SMI, and BMD, and it has higher performance with respect to the traditional singlepulse UB method. The AM-UB method and instrument will advance the QUS technique in osteoporosis diagnosis.
Appendix A:List of abbreviations
Measurement method
QUS: Quantitative ultrasound, UB: Ultrasonic backscatter measurement, AM-UB: Amplitude modulation ultrasonic backscatter measurement, UA: Quantitative ultrasound axial measurement, UT: Quantitative ultrasound transmission measurement,UI:Quantitative ultrasound echo-graphic imaging method,DXA:Dual-energy x-ray absorptiometry,FRAX:Fracture risk assessment tool.
Ultrasonic backscatter signal,parameters,and index
SOI: Signal of interest, ROI: Region of interest, T1:Avoidance length in backscatter signal,T2: Analysis length in backscatter signal,AIB:Apparent integrated backscatter coefficient,AIBAM: Amplitude modulation excited apparent integrated backscatter coefficient,IRC:Integrated reflection coefficient,BC:Backscatter coefficient,nMBD:Normalized mean of the backscatter difference, nBAR: Normalized backscatter amplitude ratio,BADC:Backscatter amplitude decay constant, BUDT: Bone ultrasonic diagnosis and therapy instrument,R-value: Pearson’s linear correlations coefficients, CI:Confidence interval.
Micro-CT parameters
BMD:Bone mineral density,SMI:Structure model index,BV/TV:Bone volume fraction,Tb.Th: Trabecular thickness,Tb.Sp: Trabecular separation,Tb.N:Trabecular number.
Acknowledgments
Project supported by the National Natural Science Foundation of China (Grant Nos. 12104096, 12004079,82127803, 11827808, and 61871263), the Shanghai Science and Technology Innovation Plan (Grant Nos. 20S31901300 and 19441903400),the Shanghai Rising-Star Program(Grant No. 21QC1400100), and the China Postdoctoral Science Foundation(Grant No.2021M690709).
We thank Yaqing Chen and Yunkai Zhu for their contribution to this work, they are with the department of ultrasound, Xinhua Hospital Affiliated to Shanghai Jiaotong University School of Medicine,1665 Kongjiang Road,Shanghai,200092,China.
猜你喜欢
杂志排行

Chinese Physics B的其它文章
- Microwave absorption properties regulation and bandwidth formula of oriented Y2Fe17N3-δ@SiO2/PU composite synthesized by reduction–diffusion method
- Laser-modified luminescence for optical data storage
- Electron delocalization enhances the thermoelectric performance of misfit layer compound(Sn1-xBixS)1.2(TiS2)2
- TiO2/SnO2 electron transport double layers with ultrathin SnO2 for efficient planar perovskite solar cells
- Sputtered SnO2 as an interlayer for efficient semitransparent perovskite solar cells
- Defect physics of the quasi-two-dimensional photovoltaic semiconductor GeSe