A novel prognosis signature based on two cuprotosis-related genes for kidney renal clear cell carcinoma
2022-11-03XingYunLiuJingDuoZhaoZeRuiYangGuoTangTangYuShengZhou
Xing-Yun Liu ,Jing-Duo Zhao ,Ze-Rui Yang ,Guo-Tang Tang* ,Yu-Sheng Zhou,*
1The Affiliated Nanhua Hospital,Hengyang Medical School,University of South China,Hengyang,China.2Institute of Pharmacy and Pharmacology,Hunan Province Cooperative Innovation Center for Molecular Target New Drug Study,University of South China,Hengyang,China.3Key Specialty of Clinical Pharmacy,the First Affiliated Hospital of Guangdong Pharmaceutical University,Guangzhou,China.
Abstract Background: Cuprotosis is a newly discovered Copper-dependence form of cell death.Cuprotosis-related genes (CRGs) regulating mitochondrial metabolism and protein lipoylation suggest the critical roles cuprotosis for in cancer.However,the prognostic value of CRGs in the highly immunogenic cancer type,kidney renal clear cell carcinoma (KIRC)needs to be further studied.Herein,we aim to identify novel prognostic genes and construct a CRGs prognostic signature for KIRC.Methods:We downloaded the mRNA sequencing data from the Cancer Genome Atlas,differentially expressed CRGs were screened out and their bio-function was elucidated.Then we used Cox regression analysis to establish a prediction model of CRGs.Subsequently,a prognostic scoring model based on the regression coefficients of the screened out CRGs and their corresponding mRNA expressions were constructed and validated.Results:Seven differentially expressed CRGs were screened.A two-gene model was built to separate samples into high-risk and low-risk groups.Overall survival was lower in the high-risk group than in the low-risk group (p <0.05).The receiver operating characteristic curve showed a good diagnostic efficiency of the signature.We verified this prognostic model in the Cancer Genome Atlas test cohorts.The risk score was identified as an independent prognostic factor via multivariate Cox regression.Moreover,the nomogram was used to predict 1-/3-/5-year OS of KIRC patients.Furthermore,risk score has a very significant effect on the infiltration of immune cells and the expression of immune checkpoints.Conclusions:To conclude,we constructed a novel prognostic signature based on CRGs.Targeting cuprotosis may represent a promising approach for the treatment of KIRC.
Keywords: cuprotosis;KIRC;prognostic signature;cuprotosis-related genes
Introduction
The incidence of kidney cancer is increasing worldwide,especially in the younger population [1].Kidney renal clear cell carcinoma (KIRC),the most common histological subtype,has the highest mortality rate among all of the malignant tumors in the urinary system,causing more than 179,000 individuals in 2020 worldwide [2,3].Survival prediction of the KIRC patients mainly depends on the tumor node metastasis stage system.However,KIRC involves genetic and environmental factors due to its heterogeneity and complexity.The accuracy of KIRC prognosis assessed by the tumor node metastasis staging was limited,which poses a significant challenge in optimizing individualized treatment strategies for KIRC [4,5].Patient survival can be significantly improved by the accurate identification of high-risk patients with poor prognosis and the appropriate adjustment of cancer treatment regimens,including the utilization of immunotherapy or targeted therapy [6].Therefore,there is an urgent need for new markers and prediction models to optimize case selection and risk stratification for KIRC patients.To date,no reliable predictive biomarkers have been identified for mirroring the immune microenvironment and therapeutic response in KIRC.Until now,credible predictive biomarkers to reflect the immune microenvironment and treatment reaction of KIRC have not been identified.
Copper is essential as a cofactor for enzymes across the animal kingdom,and yet even modest intracellular concentrations can be toxic,resulting in cell death [7,8].Consequently,accumulating evidence revealed the involvement of cuprotosis in the pathogenesis of many diseases,such as genetic disorders of copper homeostasis,infectious disease,and cancer.Genetic variation in copper homeostasis results in a life-threatening disease,and both copper ionophores (e.g.,Disulfiram) and copper chelators (e.g.,tetrathiomolybdate,yersiniabactin,and chalkophomycin) have been suggested as anticancer agents [9-13].Recent studies have revealed that copper toxicity occurs by a mechanism distinct from all other known mechanisms of regulated cell death and depends on mitochondrial respiration,the main mediators of which include FDX1 and six genes that encode either components of the lipoic acid pathway (LIPT1,LIAS,and DLD) or protein targets of lipoylation(PDH,DLAT,PDHA1,and PDHB) [14].This causes aggregation of lipoylated protein and subsequent loss of iron-sulfur cluster protein,which leads to proteotoxic stress and,eventually,cell death [15,16].
The relevance of cuprotosis-related genes (CRGs) in multiple pathological processes,including malignant tumors,has been reported,foretelling that treatment targeting cuprotosis may become a novel prospective strategy for cancer treatment [17-20].Recently,prognostic risk models based on the expression profile of CRGs have focused the attention of many scientists and have been rapidly applied to the prognostic risk assessment of KIRC,as reported [17].However,the prognostic role of CRGs is still not fully studied and verified in KIRC.Although Bian Z et constructed a KIRC prognostic model with 3 CRGs,the area under the curve (AUC) was only 0.652,0.633,and 0.658 for 1,3 and,5 years of overall survival (OS) prediction [17].Therefore,there is still great potential to build a more reliable prognostic model based on CRGs.
In this further study,we built a prognostic model based on 2 CRGs(CDKN2A,DLAT),which was highly correlated with the prognosis of KIRC and can be used as an independent prognostic assessment index.In addition,we validated the performance of this prognostic model with the Cancer Genome Atlas (TCGA) test cohort.According to the risk models and some clinical characteristics,a nomogram (C-index=0.721) was created to offer a fresh reference indicator for prognostic risk stratification and clinical treatment options for patients with KIRC.Notably,we found that this 2 CRGs prognostic model for KIRC patients can accurately predict the 10-year OS of KIRC patients,much more powerful than that of conventional models based on T,N,M,and staging.Taken together,this novel signature was proved to have outstanding predictive performance.The workflow is summarized in Figure 1.

Figure 1 Flowchart for identifying the curoptosis-related prognostic signature in KIRC.KIRC,kidney renal clear cell carcinoma;TCGA,the Cancer Genome Atlas;GO,Gene Ontology;KEGG,Kyoto Encyclopedia of Genes and Genomes;CRGs,cuprotosis-related genes;OS,overall survival;ROC,receiver operating characteristic.
Materials and methods
Data acquisition
In order to screen out differentially expressed CRGs(DE-CRGs),a total of 10 CRGs were identified from previous studies,including FDX1,LIPT1,LIAS,DLD,PDH,DLAT,PDHA1,PDHB,MTF1,GLS,and CDKN2K [14].Information on RNA sequencing expression data(FPKM) and corresponding clinical follow-up information were downloaded from the TCGA-KIRC cohort.We obtained the information on transcriptome and clinicopathology of KIRC samples from the TCGA database with a total of 539 KIRC patients and 72 adjunct nontumor samples.The strawberry Perl 5.32.1.1 software was employed to extract the expression data of all CRGs [21].Next,the“limma”package in R software(version 4.1.2)was applied to screen out DE-CRGsbetween the tumor and normal tissues of KIRC [22].Under the criterion of |log2fold change (FC)| >0.5 and adjusted p<0.05,we considered it as statistically significant.
GO and KEGG Analysis of DE-CRGs
For the sake of elucidating the role of the DE-NRGs,we conducted a Gene Ontology(GO) enrichment analysis and a Kyoto Encyclopedia of Genes and Genomes (KEGG) enrichment analysis.GO enrichment analysis was performed using an online tool,which was Metascape(https://metascape.org) [23].Kyoto KEGG enrichment analysis was performed using two R packages,which were called the “cluster profiler” R package and the enrichplot package in R software [24].
Construction of a prognostic CRGs signature and its validation
After integrating DE-CRGs expression data and patients’OS data in the same table,we use R to divide them into two sets,namely,the test set and the train set [25].Firstly,the prognostic signature of every single DEG was predicted by using univariate Cox regression (UCR) analysis in the training cohort.To make the model fit moderately,Lasso regression analysis was performed to pick prognostic genes which were related to OS in KIRC patients.Finally,we further analyzed the DE CRG obtained in the previous step through multivariate Cox regression (MCR) analysis to further screen the final genes that can be included in the risk-scoring model.The risk score was calculated by using the formula: risk score=esum (each gene’s expression ×corresponding coefficient).Through the formula,we calculate the risk score of each patient and obtain the median score.Then,according to the median score,the patients were divided into two groups,which were the high-risk group and the low-risk group.Kaplan-Meier survival analysis was conducted to evaluate the difference in survival between high and low-risk score groups by using the “survival” and“survminer” R package [26].The R package “timeROC” was used to generate the receiver operating characteristic (ROC) curve [27].The accuracy of the risk score model was evaluated by the area under the ROC curves(AUCs)of the risk score.The test set and the entire cohort were employed to prove the risk score model by using the same formula.
UCR and MCR analyses were used to assess whether the risk score and clinical characteristics were independent variables.Histological grade,age,tumor stage,T stage,and risk score were used as covariables.Statistical significance was identified as p < 0.05.Meanwhile,we made ROC to compare different factors in predicting the outcome by using the“survivalROC” R package[28].
The Construction of Nomogram and Calibration Curves
For the sake of predicting the probability of OS of KIRC patients in 1,3,and 5 years,a nomogram was generated according to the risk score and clinical features by using the “rms” R package.The prognostic accuracy of the nomogram was evaluated through two parameters,namely C-index and calibration curve,which was also achieved by the“rms” R package[29].
Immunotherapy Targets and Immune Infiltration Analysis
To explore the potential relationship between the 10-gene signature and immune cell infiltration,enrichment scores for sixteen tumor-infiltrating immune cells (ICs) and the activity of thirteen immune-related functions were obtained by a single-sample gene set enrichment analysis (ssGSEA) implemented in the Bioconductor R package “GSVA” [25].Furthermore,since immune cells play an important role in the tumor microenvironment,we further used CIBERSORT to calculate the abundance of twenty-two types of infiltrating immune cells in every single tumor sample [30].Furthermore,the difference in enrichment scores and abundance of infiltrating immune cells between the high and low-risk groups were compared.
Results
Identification and Bio-functional analysis of Differentially Expressed CRGs
With the threshold of |log2 fold change (FC)| setting at >0.5 and adjusted p setting at <0.05,7 DE-CRGs were identified from the TCGA data.Heatmap and boxplot were drawn to visualize the expression patterns of 7 DE-CRGs(CDKN2A,FDX1,PDHB,DLAT,GLS,PDHA1,and DLD) between tumor and non-tumor tissues (Figures 2A-B).To further investigate the biological function of DE-CRGs,we conducted GO and KEGG analysis.KEGG pathway enrichment analysis revealed that the top 3 most enriched pathways of these DE-CRGs were the citrate cycle,pyruvate metabolism as well as glycolysis/gluconeogenesis (Figures 3A-B).GO enrichment analysis indicated that the above-mentioned 7 DE-CRGs were significantly enriched in pyruvate dehydrogenase activity and mitochondrial matrix pathway(Figure 3C).
Prognostic Biomarkers of KIRC Constructed Using the Train Set
Initially,we divided 539 KIRC patients with survival longer than one month into two cohorts,which were train set (N=258) and test set(N=256) with a ratio of 1:1.To find out genes related to the OS of patients with KIRC,UCR analysis was conducted on the 7 DE-CRGs mentioned above and further screened 5 DE-CRGs that were significantly related to OS using TCGA (Figure 4A).In order to make the model fit moderately,LASSO analysis was conducted on the remaining prognostic CRGs (FDX1,PDHB,DLD,DLAT,and CDKN2A),and 4 genes were retained (Figures 4B-C).Subsequently,two genes(CDKN2A and DLAT) were incorporated into the final risk model by MCR (Figure 4D).The formula was listed as follows: risk score=(1.056 ×CDKN2A expression) +(0.002 × DLAT expression).
Relationship Between the Risk Score and OS in the Train Set
After samples with a survival time of <30 days were removed,we calculated the risk score for each patient in the TCGA KIRC train dataset.According to the median risk score,the patients were separated into two groups,which were the high-risk and low-risk score groups.The distribution of scores obtained by all patients through calculation,survival status of all patients,and the expression data of the 2 selected DE-CRGs of patients was compared between the above-mentioned two groups,and the results were demonstrated in Figures 3A-C.
The KM figure indicated that the KIRC samples in the low-risk set exhibited remarkably better OS when compared with the high-risk group(p=7.31e-04)(Figure 5D).ROC analysis is exhibited in Figure 5E.The AUC of risk scores were 0.73,0.66,and 0.65,respectively,for the prediction of the patient’s one-,three-,and five-year survival rates.The AUC of risk scores in the present study was better than the one of Bian Z et al.,which indicated that our prognostic model is more accurate than Bian Z et al.
Validate the Prognostic Model Using the Test Set

Figure 2 Expression of DE-CRGs in KIRC and normal tissues.(A)The differences in gene expression between the normal and tumor groups were shown by heatmap;(B)The differences in gene expression between the normal and tumor groups were shown by boxplot.KIRC,kidney renal clear cell carcinoma;DE-CRGs,differentially expressed CRGs.

Figure 3 Functional enrichment analysis of DE-CRGs.(A) The result of the KEGG analysis was shown in a bubble plot;(B) The result of the KEGG analysis was shown in a circle plot.Upregulated genes in the pathway were highlighted in red color,whereas Upregulated genes in the pathway were highlighted in blue color.The higher the z value,the higher the enrichment pathway expression;(C) The result of GO analysis were shown in the boxplot.DE-CRGs,differentially expressed CRGs;KEGG,Kyoto Encyclopedia of Genes and Genomes;GO,Gene Ontology.

Figure 4 Constructing the prognostic signature based on CRGs.(A) Results of univariate Cox analysis.(B-C) Results of LASSO analysis.(D)Results of multivariate Cox regression analysis.CRGs,cuprotosis-related genes.
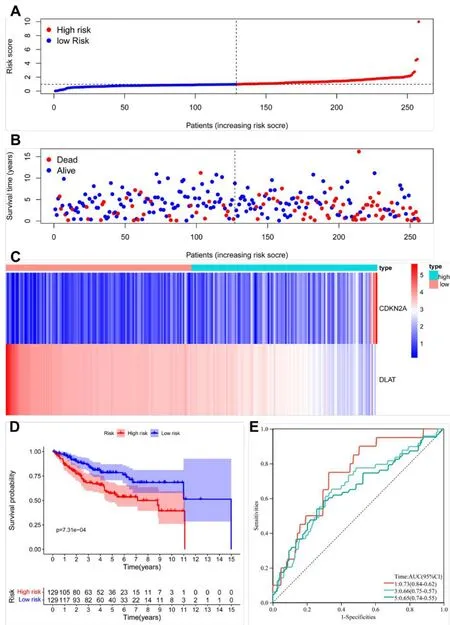
Figure 5 Association between risk score and OS in the train group.(A,B)The distribution of scores obtained by all patients through calculation,survival status of all patients of KIRC.(C)Expression data of the 2 DE-CRGs were shown in heatmap.(D)The results of Kaplan-Meier curve.(E)The results of ROC curve analysis.KIRC,kidney renal clear cell carcinoma;ROC,receiver operating characteristic;KEGG,Kyoto Encyclopedia of Genes and Genomes;DE-CRGs,differentially expressed CRGs;OS,overall survival.
By using the same risk score formula generated from the train set,we calculated the risk score of every single patient from the test group.Then,based on the similar medium value of the train set,we also separated the patients into two groups,which were the high-risk group(n=129)and the low-risk group(n=129).The distribution of scores obtained by all patients through calculation,the survival status of all patients,and the expression data of the 2 selected DE-CRGs of patients was exhibited in Figures 6A-C.The results obtained from the test group were similar to the results obtained from the train set,in which patients in the low-risk group had a better OS,with the AUC being 0.62,0.64,and 0.66 for the prediction of one-,three-,and five-year survival rates,respectively.(p=2.526e-03,Figure 6D-E).

Figure 6 Association between risk score and OS from the test group.(A,B) The distribution of scores obtained by all patients through calculation and survival status of all patients of KIRC.(C) Expression data of the 2 DE-CRGs were shown in the heatmap.(D) The results of the Kaplan-Meier curve.(E) The results were obtained from the ROC curve analysis.OS,overall survival;KIRC,kidney renal clear cell carcinoma;DE-CRGs,differentially expressed CRGs;ROC,receiver operating characteristic.
Validate the Prognostic Model Using the Entire Set
The entire set was also used as a validation group to further check the accuracy of the prognostic model.Based on the same medium value obtained from the above-mentioned train set,we also separated the patients into two groups,which were the high-risk group (n=258)and the low-risk group (n=256).Figures 7A-C showed the distribution of scores obtained by all patients through calculation,the survival status of all patients,and the expression data of the 2 selected DE-CRGs in the entire dataset.The results obtained from the test group were similar to the results obtained from the entire dataset.KIRC patients in the low-risk group have a better OS (p=1.01e-05,Figure 7D).Furthermore,the values of area under the curve were 0.73,0.66,and 0.65 for the prediction of one-,three-,and five-year OS,respectively (Figure 7E).

Figure 7 Association between risk score and OS from the entire dataset.(A,B) The distribution of scores obtained by all patients through calculation and survival status of all patients of KIRC.(C) Expression data of the 2 DE-CRGs were shown in the heatmap.(D) The results of the Kaplan-Meier curve.(E) The results were obtained from the ROC curve analysis.OS,overall survival;KIRC,kidney renal clear cell carcinoma;DE-CRGs,differentially expressed CRGs;ROC,receiver operating characteristic.
The Independence Analysis of two CRGs signatures in TCGA-KIRC dataset
For the sake of determining whether risk-score characteristics were independent predictors of OS,two kinds of methods,which were called UCR and MCR analyses,were performed using clinical factors(age,histological grade,tumor stage,and T stage).As depicted in Figure 8A,the UCR analysis indicated that all but gender were remarkably associated with survival in the TCGA-KIRC cohort.However,after conducting an MCR analysis,only the M stage and risk score (p <0.001) can still be recognized to be independent predictors of OS (Figure 8B).In addition,the AUC values of 0.693 for risk score predicting 10-year OS were remarkably better than other clinical features (Figure 8C). In conclusion,our constructed cuproptosis-related risk signature was demonstrated to be significantly related to the survival of KIRC.
For the sake of providing more accurate ways for doctors to make a prediction of the prognosis of cancer,a nomogram with C-index=0.721 was drawn so that the patients can be scored and their OS at one,three,and five years can be predicted (Figure 9A).The value of the C-index reflected a fairly satisfactory predictive performance of the above-mentioned nomogram.Furthermore,the results of the calibration curve revealed that the predictive performance of the above-mentioned nomogram could be satisfying(Figure 9B).
Association between the two cuprotosis-related genes signature and tumor immunity in KIRC
For the sake of further exploring the relationship between patient immune status and prognostic characteristics,we performed a ssGSEA analysis[25,30].We compared the score in thirteen kinds of IRFs and sisteen types of ICs in various risk groups.The scores in nine of the ICs(including pDCs,APC co-stimulation,CD8+T cells,T helper cells,and TIL) in the high-risk set exceed the low-risk set (p <0.01,Figure 10A).As for the IRFs,twelve of them had higher scores in the high-risk group than in the low-risk group,except APC co-inhibition and MHC class I (p <0.01,Figure 10A).What’s more,CIBERSORT was employed to compare the differential infiltration abundance of twenty-two immune cell species between the above-mentioned two groups[25,30].The high-risk group included notably higher numbers of Plasma cells,T cells CD8,T cells follicular helpers,T cells regulator,NK cells activated,dendritic cells resting and Eosinophils,whereas the high-risk group included notably lower numbers of T cell CD4 memory resting,Monocytes,Macrophages M1,Macrophages M2,Mast cells resting and Neutrophils(p <0.05,Figure 10B).
Discussion
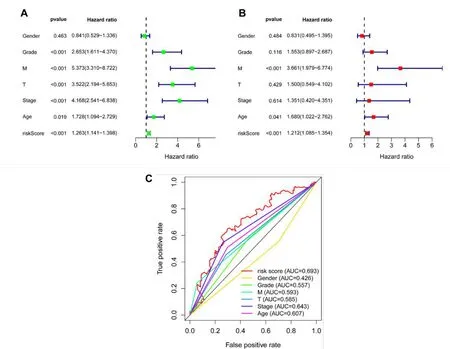
Figure 8 Independent analysis of the prognostic model.(A)The results of the UCR;(B)The result of the MCR;(C)The result of the 10-year ROC curves.UCR,univariate Cox regression;MCR,multivariate Cox regression;ROC,receiver operating characteristic.
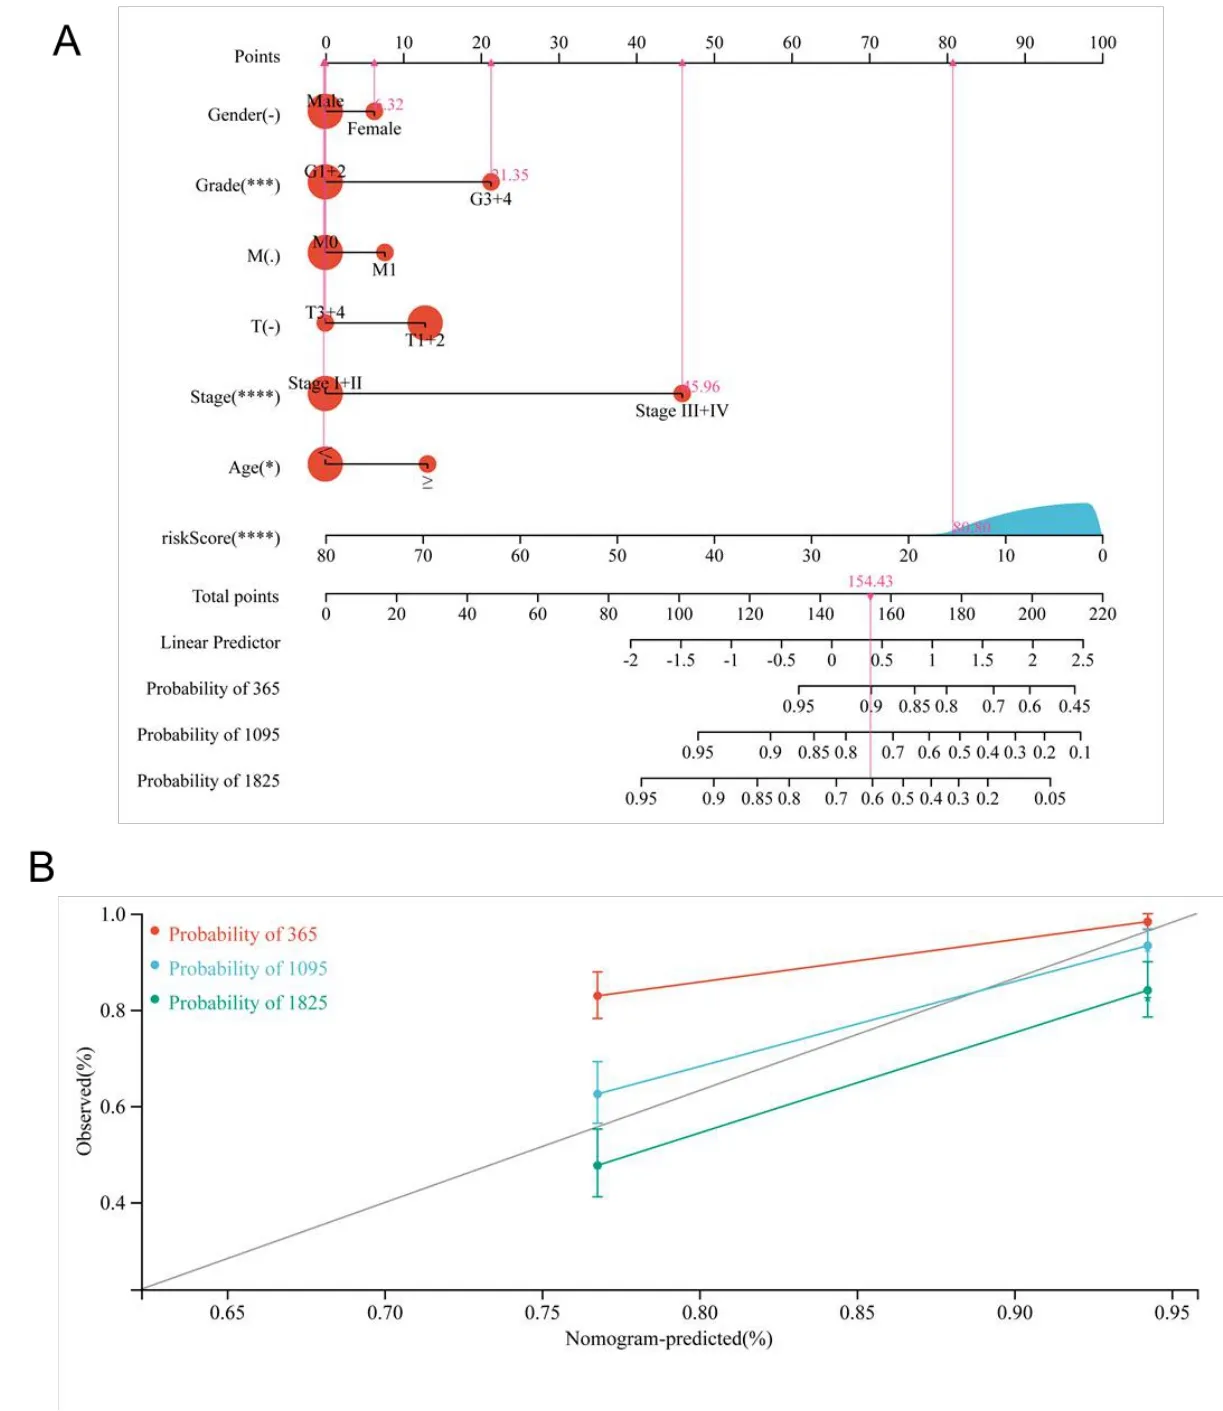
Figure 9 Nomogram analysis for KIRC patients with clinical features.(A)The nomogram for predicting the probability of KIRC patient overall survival;(B)The 10-year nomogram calibration curves,respectively.KIRC,kidney renal clear cell carcinoma.

Figure 10 (A) The distribution of ssGSEA enrichment scores of sixteen ICs and thirteen IRFs in different risk groups in KIRC patients from TCGA.(B)The ratio differentiation of the 22 immune cells between the high-risk and low-risk groups in the TCGA-KIRC training dataset.*p <0.05,**p <0.01,***p <0.001.ssGSEA,single-sample gene set enrichment analysis;ICs,immune cells;KIRC,kidney renal clear cell carcinoma;TCGA,the Cancer Genome Atlas.
Copper is a metallic transition element with redox activity [31].The reduced form Cu+can be converted to the oxidized form Cu2+under conventional physiological conditions and chemical reactions [31].Copper ions are involved in a variety of biological and chemical interactions by providing or receiving electrons [32].Cu2+can bind to a variety of proteins or enzymes and act as a cofactor or structural component regulating several physiological processes,including antioxidants,mitochondrial respiration,and energy metabolism [31].The Oxidative stress can be caused by imbalanced copper ion levels and abnormal cellular autophagy,which induce the development of several coppers or copper ion-related diseases [33,34].Notably,existing researches recognize copper as a key regulator in the development and progression of cancer [33].Pathways of copper’s impact on cancer development and progression have been summarized in previous papers,suggesting that cancer proliferation,angiogenesis,and metastasis are key interactions [35-37].Furthermore,elevated serum copper and intracellular copper levels in malignant tissues compared to that of healthy individuals suggest a link between cancer development and recurrence [37,38].Currently,copper chelators and absorption inhibitors have been suggested as anticancer drugs,including disulfiram,tetrathiomolybdate,yersiniabactin,chalkophomycin,and elesclomol [9-13].The role of elesclomol in apoptosis resistance and induction of iron death suggests that targeting the copper translocation system can enhance the sensitivity of chemotherapeutic drugs [39].What’s more,as the special role of lipid acylated protein modifications in copper-dependent cell death,studies related to targeted interventions in copper death have potentially important applications.Therefore,cuproptosis targeting may emerge as a potent anti-cancer therapeutic strategy [40].
Recently,Cuproptosis has rapidly become a research hotspot,providing additional inspiration for drug development as well as for the improvement of clinical indicators [41].The complexity and heterogeneity of KIRC involving genetics and environment make accurate prognostic indicators critical.Hence,more molecular markers of tumors to more accurately reflect the prognosis of KIRC are necessary.Some studies have constructed a cuproptosis-related gene-based prognostic model of KIRC,which consists of four copper death-related genes (CDKN2A,DLAT,FDX1,and LIAS) with the AUCs for OS prediction at one,three,and five years were only 0.652,0.633,and 0.658 [17].Therefore,it is warranted to find an adequate prognostic model based on CRGs.In the present study,the 10 CRGs in the KIRC sample and the interactions with prognosis were systematically analyzed.As a result,we constructed a prognostic model based on two CRGs (CDKN2A,DLAT),which were closely related to prognosis and could be utilized as a powerful and independent prognostic indicator.The AUC of the present risk model was 0.73,0.66,and 0.65 for the prediction of survival at one,three,and five years respectively,which was better than the above-mentioned four-genes model.Among the two prognosis-related NRGs,CDKN2A showed high expression in the high-risk group,suggesting that this gene may be oncogenes.On the contrary,DLAT showed low expression in the low-risk group,indicating that it may be a tumor suppressor gene for KIRC.CDKN2A expression regulates the cell cycle and is closely associated with the genesis of various tumors[42-45].Furthermore,Mutant CDKN2A was found to modulate the expression of P16/p14 through alternative splicing in KIRC [46].Dihydrolipoamide S-acetyltransferase (DLAT) is one of the components of the pyruvate dehydrogenase (PDH) complex,whose oligomerization has been attributed to the consolidation of copper and lipoylated proteins in the citrate cycle [17].Nonetheless,the specific mechanism of its role in KIRC has not yet been clarified by experiments.Meanwhile,we also found that the risk score based on two genetic traits for each patient was a clinically significant variable,as shown in our nomogram,indicating that the signature can predict prognostic outcomes of KIRC outcomes with high reliability (Figure 8).The results of the calibration plots and the C-index confirmed the excellent performance of the generated nomogram in discriminating clinical outcomes of KIRC patients.All of these indicated that we have successfully constructed a CRG prognostic risk model.
KIRC,with high immunogenicity,displayed high levels of T-cell infiltration in the immune microenvironment [47].Notably,the expression of PD-L1 can be regulated by intratumoral copper [48].Therefore,we performed ssGSEA to acquire enrichment scores for various immune cell types and relevant biopathways or functions.In addition,the infiltration abundance of 22 immune cells was estimated in different risk groups by CIBERSORT.The results showed a significant difference in the infiltration abundance and immune-related functions of immune cells between the high-risk and low-risk groups.According to the score comparisons of immune cell types and immune-related functions,the high-risk groups with shorter OS possessed higher scores in Plasma cells,T cells CD8,T cells follicular helpers,T cells regulator,NK cells activated,dendritic cells resting and Eosinophils,demonstrating the presence of imbalanced and dynamic immune regulation in the progression of KIRC.These data suggest that anti-tumor immunity levels in the low-risk fraction group were remarkably higher than in the high-risk fraction group.The results of this study suggest that the CRGs-based risk score may be a remarkable marker for assessing the effect of targeted chemotherapy and immunotherapy in order to facilitate the development of precise individualized KIRC.Indeed,our study has some limitations.The validity of this retrospective research based on TCGA may be restricted due to their selection bias,and the large-scale real-world data need to be obtained to validate our findings and results in further prospective studies.Second,our current findings relied heavily on computational analysis,and it will be necessary to find more biological evidence to support these conclusions in the future.
Conclusion
In conclusion,a new prognostic signature based on 2-gene (CDKN2A,DLAT) was proposed,which can predict the OS of KIRC patients with promising predictive performance.The 2-gene (CDKN2A,DLAT)prognostic signature may facilitate clinicians to make effective treatment strategies for KIRC patients.
杂志排行

Medical Data Mining的其它文章
- Highly expression of MYBL2 is correlated with a poor prognosis and immune infiltration in clear cell renal carcinoma
- Bibliometric analysis of literature review of osteoarthritis in the Cochrane database
- Simulation analysis and pharmacokinetic evaluation of atractylide I for the treatment of diabetic nephropathy
- Advancing biological fluorescence microscopy with deep learning: a bibliometric perspective
- Feature selection and machine learning approach for carotid atherosclerosis in asymptomatic adults
- Investigating public perceptions regarding the Long COVID on Twitter using sentiment analysis and topic modeling