Supergranular Fractal Dimension and Solar Rotation
2022-10-25SowmyaRajaniPaniveniandSrikanth
G. M. Sowmya, G. Rajani, U. Paniveni, and R. Srikanth
1 GSSS Institute of Engineering and Technology for Women, Mysuru-570016, Karnataka, India; sowmyabharth5@gmail.com
2 PES College of Engineering, Mandya—571401, Karnataka, India
3 Bangalore University, Jnanabharathi, Bengaluru–560056, India
4 Poornaprajna Institute of Scientific Research, Devanahalli, Bangalore-562110, Karnataka, India
Abstract We present findings from an analysis of the fractal dimension of solar supergranulation as a function of latitude,supergranular cell size and solar rotation,employing spectroheliographic data in the Ca II K line of solar cycle no.23.We find that the fractal dimension tends to decrease from about 1.37 at the equator to about 1 at 20°latitude in either hemisphere,suggesting that solar rotation rate has the effect of augmenting the irregularity of supergranular boundaries.Considering that supergranular cell size is directly correlated with fractal dimension,we conclude that the mechanism behind our observation is that solar rotation influences the cell outflow strength, and thereby cell size, with the latitude dependence of the supergranular fractal dimension being a consequence thereof.
Key words: Sun: chromosphere – Sun: rotation – Sun: magnetic fields
1. Introduction
Supergranules, the large convective eddies discovered by Hart in 1950 and later characterized by Leighton (1960), are believed to be visible manifestations of sub-photospheric convection currents. Typically, these cellular patterns have a horizontal flow velocity in the range of 0.3–0.4 km s−1, an autocorrelation length scale of around 30 Mm and a lifetime of about 24 hr (Simon & Leighton 1964). The supergranular pattern as a whole tends to be irregularly surface-filling(Leighton et al.1962)and has an estimated lifetime of about 2 days (Gizon et al. 2003). While their horizontal flows may reach 300–400 m s−1, their upflows are an order of magnitude slower. Unlike granules, they are not thought to be truly convective, which explains why they are better observed in Dopplergrams than in intensitygrams. Indeed, this is a reason why they were initially discovered through Doppler images. It is known that supergranular cell boundaries coincide with chromospheric networks, attributed to magnetic fields flushed to the cell boundaries by the horizontal flow (Simon &Leighton, 1964). The size and flow spectrum associated with supergranulation include smaller cells in such a way that the spectrum of supergranules leads to the spectrum of granulation(Hathaway et al. 2000) and has a dependence on solar cycle phase and total irradiance(Mandal et al.2017).Here it may be noted that both Doppler signals and the spectral component due to granules are visible in SDO/HMI data (Williams et al.2014).
A number of researchers have noted the effects of interaction between solar activity and the supergranular magnetic network.Based on an analysis of spectroheliograms spanning seven consecutive solar maxima, Singh & Bappu (1981) claim that the chromospheric network cell size is smaller at the solar maximum phase than at the solar minimum phase. This is in consonance with the findings of Kariyappa & Sivaraman(1994) on the chromospheric network variability, of Berrilli et al. (1999) on the network geometry and of Raju & Singh(2002), who study magnetic field influence on network scale,but differs from a study on the related velocity and magnetic fields (Wang 1988) and Münzer et al. (1989), who reported larger network cell areas in higher magnetic activity regions.
The supergranular rotation rate at the solar equator has been reported by various authors and found to be about 3% more than the surface plasma’s rotation rate, a phenomenon termed“supergranular superrotation” (Duvall 1980; Beck & Schou 2000), but it should be noted that this is probably a projection effect and not a genuine wave phenomenon (Hathaway et al.2006). Based on a time-distance helioseismology analysis of SOHO/MDI, the pattern of supergranulation is found to be oscillatory (Gizon et al. 2003), generating waves with a time period between six and nine days. The apparent superrotation may be explained by the fact that the waves are largely prograde.
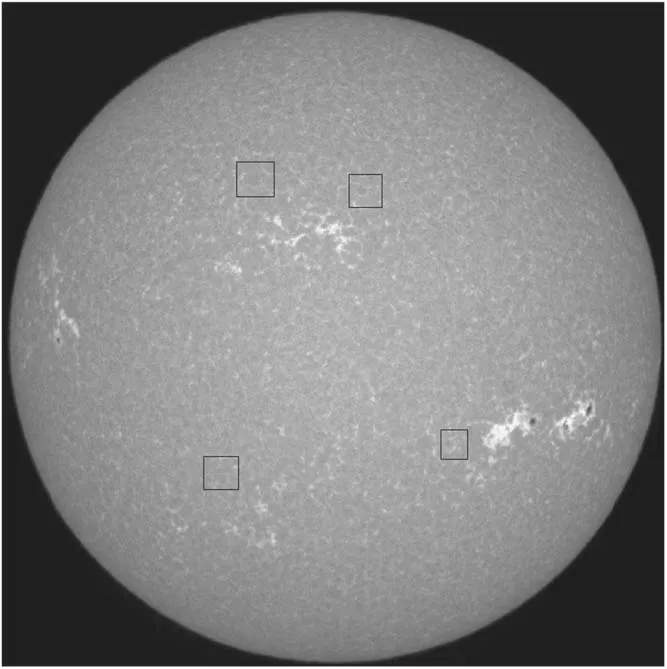
Figure 1. Spectroheliogram of Ca II K from KSO, indicating supergranule selections, taken during cycle no. 23, in particular the active phase of October 2000. The image orientation is N-S.
The fractal dimension is a useful mathematical representation for describing the complexity of geometrical structures and for understanding the underlying dynamics(Mandelbrot 1975).An object is called a fractal if it displays self-similarity at different scales. Fractal analysis has been used to study the turbulence of the magnetoconvection of solar magnetic fields(Lawrence et al. 1993; Stenflo & Holzreuter 2003). Fractal analysis has been applied in the context of solar surface studies,such as in the context of dopplergrams (Meunier 1999) and Ca II K filtergrams of SOHO/MDI (Paniveni et al. 2011) and of Kodaikanal Solar Observatory (KSO) data (Chatterjee et al.2017;Rajani et al.2022).The fractal nature of supergranulation was studied in detail by Paniveni et al.(2005)and its relation to solar activity by Paniveni et al. (2010), where the role of turbulence on the complexity of the cell was indicated. Pic du Midi data were analyzed to calculate the granulation pattern’s fractal dimension(Roudier&Muller 1986),which was the first application of fractal dimension investigation to a solar surface phenomenon. For smaller granules, they obtained a fractal dimension of 2 for large granules and 1.25 for smaller ones.Berrilli et al. (1998) relied on fractal analysis to explain the turbulent origin of supergranulation. They chose an intensity threshold and produced a binary image representing the chromospheric network and utilized a medial axis transform(skeleton) of the binary image to unleash the geometrical properties of the cells. To calculate the degree of circularity of supergranular cells, Srikanth et al. (2000) used the tessellation method on the supergranulation pattern.
2. Data and Analysis
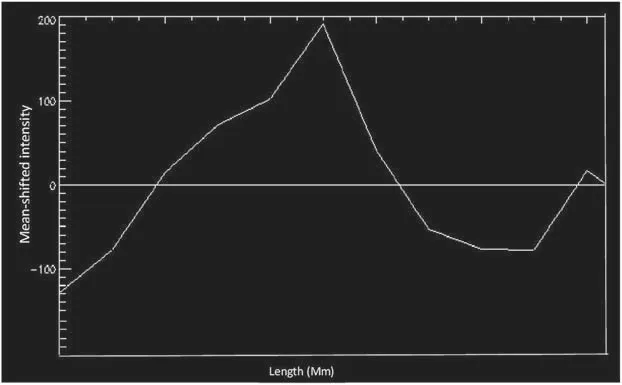
Figure 2. Ca II spectroheliogram scan: mean-shifted profile of a selected supergranule showing two crests,which stand for the cell boundary.If the peak position was ambiguous, one could potentially try to use a Gaussian profile to fit the cell wall. However, as in the above case, the position could be unambiguously determined. The cell area and perimeter are obtained with multiple such scans. (The negative values correspond to points with belowmean intensity.)
This analysis considers the quiet region data (in both quiescent and active phases) of the solar cycle no. 23(covering the years 1996–2008) from the KSO5https://kso.iiap.res.inarchives.Figure 1 depicts data obtained during the active phase of this cycle. The KSO’s dual telescope is equipped with a Ca II K spectroheliograph with a spectral dispersion of 7 Å mm−1near 3930 Å. It employs a 6 cm image obtained with a Cooke photovisual triplet of 30 cm,onto which sunlight is reflected by a 460 mm diameter Foucault siderostat. Light with a band width of 0.5 Å is admitted by the exit slits. The images are suitably time-averaged to remove the effects of p-mode oscillations.
Well-formed supergranular cells within an angular distance of 20°are selected by visual inspection,where the restriction is made to minimize projection effects, see Rajani et al. (2022).Figure 1 is part of a full-disk image in which we highlight a few regions where we are able to visually identify well-defined cells. Per day the setup generates 144 images with postaveraged time cadence of 10 minutes. As the image resolution is 2′, which is twice the granular scale, it is expected that our results are insensitive to granular effects. About 400 welldefined cells were extracted from quiet regions within the belt between 20° N and S. The area-perimeter relation obtained from them forms the basis for deriving the fractal dimension(Paniveni 2018).
The methodology was manual and not automated. It goes briefly as follows: first the visually identified cell is subjected,using IDL software, to “two-dimensional tomography”, i.e.,multiple sequential scans, such as shown in Figure 2. In each scan, the cell boundaries define the area included in the scan,which is added to obtain a consolidated area,while the locus of boundaries across scans determines the cell perimeter.
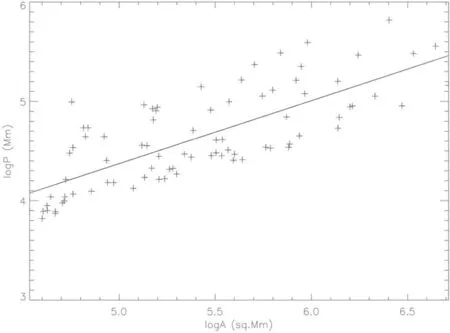
Figure 3.Log–log plot of supergranular perimeter vs.area in units of Mm and Mm2, respectively. The displayed data consist of about 130 cells, corresponding to the first data point in Figure 4.
Our analysis, based on direct visual inspection, yields a cell size in consonance with other works which employ methods that track individual cells(Hagenaar et al.1997;Paniveni et al.2005).The latter reference infers cell diameter between 13 and 18 Mm,and by employing a tessellation procedure based on the steepest gradient algorithm, obtained a characteristic cell diameter in the range 13–18 Mm, which is half of the cell scale obtained using methods such as autocorrelation method or spherical harmonics decomposition (Hathaway et al. 2000).The cause of this discrepancy is a matter under current investigation, to be reported elsewhere.
Figure 3 gives the area versus perimeter plot for the analyzed cells, demonstrating a power-law relationship. If P and A denote the cell’s perimeter and area, respectively, then the fractal dimension D is obtained according to

For perfect circles or squares, for which the area increases quadratically as a function of the perimeter, we find that the fractal dimension D=1. The more the cell structure deviates from regularity by being denticulate (i.e., the boundaries are craggy and rugged),the more it causes greater perimeter length to enclose a given area,and thereby the more is the increase of the fractal dimension toward 2.
The chosen region of study,which subtends about 30°about the image center, should contain approximately 300 cells per image. Thus, in principle, a greater number of cells can be employed than used in this study.In automated methods of cell extraction, such as the steepest-gradient method based tessellation technique of one of the authors here(e.g.,Srikanth et al. 2000), or autocorrelation based extraction of cell scale(e.g., Raju et al. 1998, by the same authors), a greater region can be mechanically covered for study. However, such methods require a degree of interpretation, such as (in the former case) whether the extracted cells are precisely supergranules or include other cell-like regions of smaller or larger scale. In the latter case, the autocorrelation scale may be enhanced as an artifact of open cells,which lack a well-defined boundary. The present manual method has the advantage of visually selecting well-defined cells, but being time-consuming, yields fewer cells in a given time. Further, the present method may involve a selection effect in that it may be biased toward cells of smaller size. This is because apparently they tend to be better defined than larger cells, which tend to have more broken/diffuse boundary walls.Ideally,it would be apt to develop a supervised machine learning algorithm that is trained by the present visual inspection method.

Figure 4. Supergranular fractal dimension dependence on area, showing that larger cells are more irregularly shaped. Here, the area parameter is grouped into bands of size 100 Mm2, which is large enough to enable inclusion of a statistically significant number of data points.In passing, it may be mentioned that this behavior is in agreement with the findings of Meunier(1999)for active regions.
3. Result and Discussion
3.1. Cell Size, Fractal Dimension and Rotation
In a first analysis, we look at how the fractal dimension varies with supergranular length scale. We have considered four size ranges, combining data across all latitudes. Figure 4 depicts a broad but well-established dependence of fractal dimension on the area of the supergranular cells and is shown in different ranges of the supergranular cell area.For those cells whose area is below 100 Mm2, the fractal dimension is found to be about 1, meaning that they are quite regular in shape.On the other hand, for an area between 100–200 Mm2,200–300 Mm2and 300–400 Mm2the fractal dimension is found to be about 1.38, 1.5 and 1.68 respectively, indicating a more irregularly shaped perimeter.
The choice of a band of 100 Mm2to classify the cells is rather arbitrary, but found to be convenient for our data set.Thus our main observation here is that the smaller supergranular cells are more regularly shaped than larger ones. This agrees with the result reported by Srikanth et al. (2000), who find that larger cells have less regular boundaries (quantified through a “circularity” parameter). This feature is attributed to the idea that supergranular outflows become choppier at larger distances,reflected in the irregularity of the swept-out magnetic fields. Here, it is of interest to note that Berrilli et al. (1998)used fractal analysis to explain the turbulent origin of supergranulation.
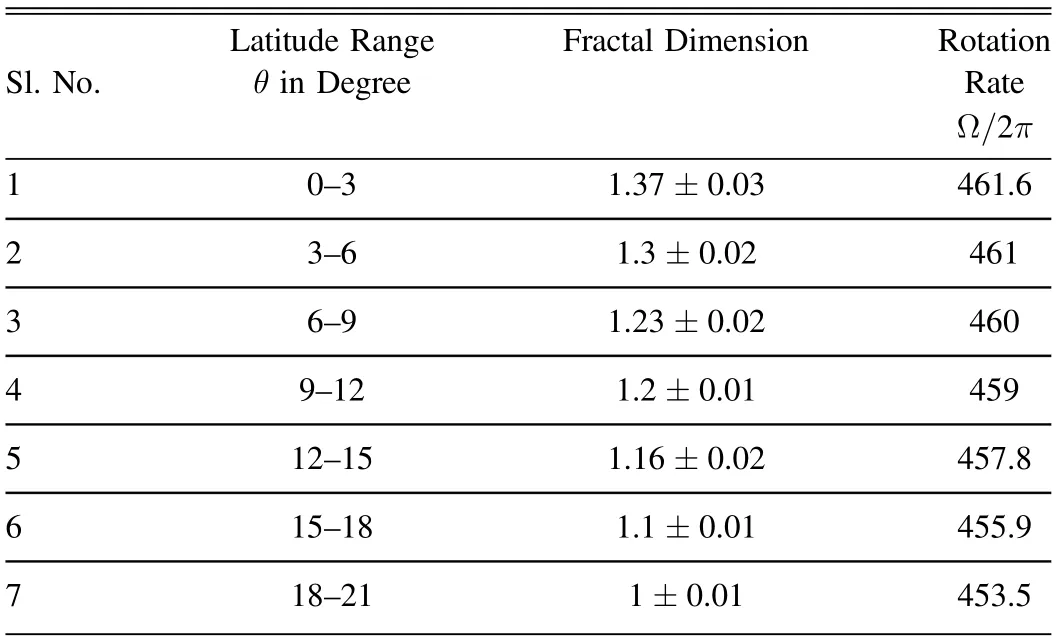
Table 1 The Individual Perimeter vs. Area Plots are used to Obtain Fractal Dimension for Each Latitude Belt, Plotted in Figure 3
3.2. Latitude, Solar Rotation and Fractal Dimension
In a second analysis, the fractal dimension is computed for the latitude belts (0–3), (3–6), (6–9), (9–12), (12–15), (15–18)and(18–21);the data comprise cells from both hemispheres.In this case, cells are not sifted according to size. Columns #2 and #3 of Table 1 give the latitude range and corresponding fractal dimension respectively. It shows that at lower latitudes,the estimated fractal dimension is higher than that at the higher latitudes (see Raju 2020). The result is given in Table 1. The data of Figure 4 and Table 1 together suggest that supergranular cell sizes fall slightly at higher latitudes in the selected belt, in agreement with the observation of Raju et al. (1998).
The latitudinal dependence of supergranular fractal dimension suggests a connection to solar differential rotation and possibly to supergranular superrotation. The cellular rotation rate, as determined by Hathaway (2012), is
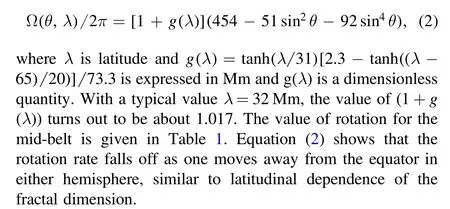
In order to connect the observation given by Equation(2)to our data, we shall assume a simple linear relation between fractal dimension and rotation given by D=a+b(Ω/2π), for certain real parameters a and b.The form of Equation(2)leads us to the relation

plotted in Figure 5. Other slightly different versions of the dependence Equation(2)are possible,e.g.,Korzennik&Ulrich(1989), and accordingly we may obtain slight variations of Equation (4).
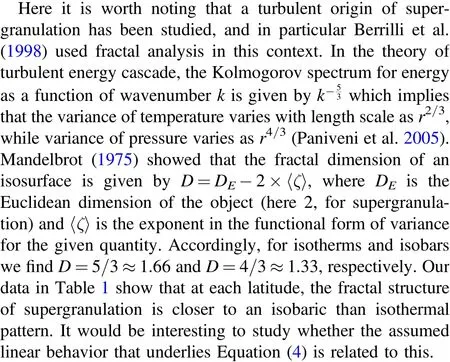
Two causes may be at play, working hand in hand, to produce the rotational dependence of fractal dimension, given by Equation (4). First is that, as we reported above, cell sizes fall toward higher latitudes(Table 1),which may be a rotational effect and can be understood as follows. The differential rotation through the dynamo action causes an enhancement of quiet Sun magnetic fields at higher latitudes. This field enhancement is expected to have a constricting influence on cell size (Singh & Bappu 1981), leading to smaller cells at higher latitudes,as confirmed by Raju et al.(1998).And as we show later (below in Equation(6)),larger cells are expected to have a greater fractal dimension.By virtue of Equation(2),we know that rotation speed falls toward higher latitudes. These considerations provide a basis for the observed direct correlation between D and the rotation rate. Another possible cause is related to the fact that when the radial outflow of a supergranule encounters the ambient plasma at the cell boundary, the fluidic stress and hence turbulence is expected to be relatively less where the plasma rotation speed is lower,assuming uniform outflow speed across the latitudes. Correspondingly, the cell boundaries at latitudes associated with slower rotation,namely the higher latitudes,are expected to be less corrugated, or in other words, have lower fractal dimension, as we find in Table 1.
4. Conclusion and Discussions
We have found that the fractal dimension for supergranulation is directly correlated with supergranular cell size(Figure 4), but anti-correlated with latitude (Table 1). Taking into account the observed quartic polynomial relationship between solar rotation and the sine of the latitude,Equation(2),we have proposed a simple dependence of fractal dimension on solar rotation. We now briefly and qualitatively consider the question of a potential underlying mechanism to explain this behavior and that we hope to understand more quantitatively in a future work.
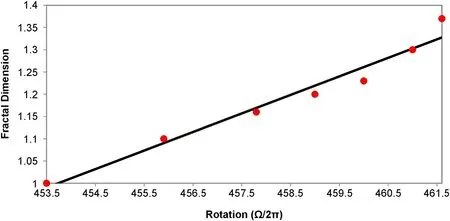
Figure 5.Variation of fractal dimension with rotation from the data of Table 1 and Equation(2).The linear fit comes from assuming a linear relation between the two variables, and requiring a best fit subject to the constraints of Equations (2) and (3).
The latitude dependence of fractal dimension D is expected to be influenced by its dependence on the scale of supergranulation and the quiet Sun magnetic field distribution. We now discuss the nature of these two dependences. With regard to the latter, we remark that the magnetic flux tubes, “frozen”into the plasma, have the constricting property, essentially because charged particles are not allowed to cut across field lines. This is due to the Lorentz force, given by FL∝v×B,where B and v represent magnetic field intensity and velocity,respectively. Indeed, the flow of plasma across a field line is forbidden in the limit of extremely high electrical conductivity because it would generate enormous eddy currents (Alfvén 1942).
We now speculate on a potential qualitative scenario that can account for our results. Assuming that supergranules are convective cells, magnetic field is expected to be accumulated at the supergranular edges thanks to the above magnetohydrodynamical feature. A larger number of flux tubes transported to the edges of the larger cells due to convective motions and the associated solar rotation may be a key factor in determining how strongly the supergranular outflow pushes against the ambient plasma, resulting in smaller cells at higher latitudes in the chosen latitudinal range.
Since the cell wall is formed by a heating of the overlying plasma by the magnetic flux swept by the supergranular convective flow, larger cells typically show more fluctuations and discontinuities in the cell wall, and hence larger fractal dimension.This may explain the direct correlation between cell size and the fractal dimension(Figure 4).We propose a simple model that tries to capture the above idea. For the turbulent medium described by Kolmogorov theory applied to solar convection associated with supergranulation, we expect the relation between the horizontal speed vhorizand the cell size L being given by

where η is connected to the plasma injection rate (Paniveni et al. 2004). Letting T=L/vhorizrepresent the time that a plasma fluid element takes to traverse from the point of upflow at the cell center to the boundary, and δhorizrepresent the standard deviation in the horizontal velocity, we may then estimate that the standard deviation induced in L is given by

which implies that the cell boundary has greater spread, the greater is the cell size. Paniveni et al. (2004) estimate using SOHO dopplergram data that η,δhorizand the mean value of L are, respectively, 2.89×10⁻⁶km2s−3, 74.1 m s−1and 33.7 Mm. Substituting these values into the right-hand side of Equation(6),we obtain about 5.4 Mm for δL,which is close to the value of standard deviation in L of 8.96 Mm reported by Paniveni et al. (2004).
It is not unreasonable to assume that the standard deviations mentioned above obtained over many cells also indicate the variation of the corresponding variables over different times and positions in a given cell. Under this assumption,Equation(6)can be interpreted as asserting that the boundaries of larger cells show greater fluctuation, and thus by extension,greater fractal dimension, consistent with the plot in Figure 4.Our result appears to support previous studies (Srikanth et al.1999,2000),which report that larger cells have a more craggy perimeter.
Raju et al. (1998) reported a decrease in the autocorrelation scale of supergranules as one moves to higher latitudes until±20°, and an increase thereafter until ±30°. In conjunction with Figure 4, this would suggest that the fractal dimension must have an analogous latitude dependence, with minima around ±20°. Thus, while D has the expected behavior at the lower latitudes,it appears that other factors must be invoked to explain its behavior farther up. Here we note that quiet Sun fields are reported to show enhancements around the equator and ±30° (Harvey 1998). This, in light of the preceding argument,would be consistent with the data of Table 1,except that we would expect a dip in D close to the equator. In conclusion,it appears that the latitude dependence of D that we find is the resultant of the somewhat conflicting constraints imposed by the cell scale and quiet Sun magnetic field distribution. We may conclude that further study, using a different method of cell statistics analysis to process a larger number of cells,is needed to unravel the detailed behavior of D as a function of latitude.
It will of be of interest to try to quantitatively obtain Equation (4) based on these considerations, which would then lead to Equation(3)in conjunction with Equation(2).In future works, we propose to return to the same data, but using other approaches, such as an autocorrelation, spectral analysis or an automated tessellation.
Acknowledgements
We thank Indian Institute of Astrophysics (IIA) for providing Ca–K filtergram data, and Fiaz for providing technical help with image handling. We are grateful to Prof.J. Singh for his valuable suggestions and support.
ORCID iDs
R. Srikanth https://orcid.org/0000-0001-7581-2546
杂志排行
Research in Astronomy and Astrophysics的其它文章
- A Wideband Microwave Holography Methodology for Reflector Surface Measurement of Large Radio Telescopes
- YFPOL: A Linear Polarimeter of Lijiang 2.4m Telescope
- Pre-explosion Helium Shell Flash in Type Ia Supernovae
- A Region Selection Method for Real-time Local Correlation Tracking of Solar Full-disk Magnetographs
- Research on the On-orbit Background of the Hard X-Ray Imager Onboard ASO-S
- Chinese Sunspot Drawings and Their Digitization—(VII) Sunspot Penumbra to Umbra Area Ratio Using the Hand-Drawing Records from Yunnan Observatories
