Active Depths of Main Faults in the Ying-Qiong Basin Investigated by Multi-Scale Wavelet Decomposition of Bouguer Gravity Anomalies and Power Spectral Methods
2022-10-24ANLongYUChongGONGWeiLIDeyongXINGJunhuiXUChongandZHANGHao
AN Long, YU Chong, GONG Wei, LI Deyong, XING Junhui, XU Chong, and ZHANG Hao
Active Depths of Main Faults in the Ying-Qiong Basin Investigated by Multi-Scale Wavelet Decomposition of Bouguer Gravity Anomalies and Power Spectral Methods
AN Long1), 2), #, YU Chong3), #, GONG Wei1), 2), *, LI Deyong1), 2), XING Junhui1), 2), XU Chong1), 2), and ZHANG Hao1), 2)
1),,,,266100,2),,266237,3).,.,264670,
The Ying-Qiong Basin is located on the northwestern margin of the South China Sea and at the junction of the South China Block and the Indochina Block. It is characterized by complex geological structures. The existing seismic data in the study area is sparse due to the lack of earthquake activities. Because of the limited source energy and poor coverage of seismic data, the knowledge of deep structures in the area, including the spatial distribution of deep faults, is incomplete. Contrarily, satellite gravity data cover the entire study area and can reveal the spatial distribution of faults. Based on the wavelet multi-scale decomposition method, the Bouguer gravity field in the Ying-Qiong Basin was decomposed and reconstructed to obtain the detailed images of the first- to sixth-order gravitational fields. By incorporating the known geological features, the gravitational field responses of the main faults in the Ying-Qiong Basin were identified in the detailed fields, and the power spectrum analysis yielded the depths of 1.4, 8, 15, 26.5, and 39km for the average burial depths of the bottom surfaces from the first- to fifth-order detailed fields, respectively. The four main faults in the Yinggehai Basin all have a large active depth range: fault A (No.1) is between 5 and 39km, fault B is between 26.5 and 39km, and faults C and D are between 15 and 39km. However, the depth of active faults in the Qiongdongnan Basin is relatively shallow, mainly between 8 and 26.5km.
Yinggehai Basin; Qiongdongnan Basin; active depth of fault; Bouguer gravity anomaly; wavelet multi-scale analysis; power spectrum
1 Introduction
The Ying-Qiong Basin is located where the Indochina Block intersection the South China Continental Block. The complex geological structure in the region includes the confluence of strike-slip and extensional continental margins to the northwest of the South China Sea. It also re- presents an area of tectonic extrusion or escape related to the collision of the India-Australian and Eurasian plates, and a subduction-related tectonic stretching zone in the paleo-SouthChina Sea (Zhang, 2013). Since 50Myr, the pro- cesses including the oblique convergence of the Indian and Eurasian plates, rapid trench retreat of the Pacific subduction zones, and the nearly south-north expansion of the South China Sea basin have caused the gradual disintegration of the northwestern continental margin of the South China Sea and the formation of the Ying-Qiong Basin.
The formation of the Yinggehai Basin is related to the collisional belt between the Indian and Eurasian plates, whereas the formation of the Qiongdongnan Basin is related to the subduction-stretching zone of the paleo-South China Sea. The research into the internal fault structure of the Ying-Qiong Basin is of great significance for understand- ing the structural attributes, evolution history, and formation process of petroliferous basins in the northern margin of the South China Sea.
Predecessors have conducted a sizable amount of work on the structural evolution history of the Ying-Qiong Basin, the characteristics of the regional stress field, the strength of extensional crustal deformation, and the geometry, activity rate, and stress state of principal faults in the basin (Sun., 2003, 2015; Clift and Sun, 2006; Li., 2006; Zhu., 2009; Song, 2012; Xie, 2015).
Previous researchers have also reported a series of basic geophysical studies in the Ying-Qiong Basin. The wide- angle seismic profiles in the Yinggehai Basin have been processed and analyzed to obtain the velocity structurecharacteristics of the basin sediments (Xia., 1998; Wu., 2009). The Ocean Bottom Hydrophones (OBHs) seis- mic data were integrated by the two-dimensional (2D) ray- tracing program to study variations in the characteristics of the Moho depth, upper crustal thickness, and Cenozoic sediment thicknesses from the northeast to southwest boun- dary of the Yinggehai Basin (Liu., 2011). The seismic data and satellite altimetry gravity anomaly data were com- bined to study the deep crust structural characteristics of the Yinggehai-Songhong Basin (Luo., 2014). Zhao. (2019) utilized the ambient noise tomography method to perform relevant processing on the seismic station data in the South China Sea area, along with three-dimensional S- wave velocity structures from the seafloor to the depth of 60km obtained by inversion.
Zhang. (2009) used the stack velocity spectrumdataset of near-vertical deep reflection profiles implement- ed in the deep water area of the Zhujiang River Estuary and the Qiongdongnan Basin to analyze the spatial variation of P-wave velocities at different depths, as well as characteristics of the stratified crustal geometry in the basin. Shan. (2011) calculated Moho surface temperatures and determined the thermal structure of the sedimentary cover, upper crust, lower crust, and the high-speed layers in the lower crust based on the submarine heat flow data and related petrological thermal properties of strata in the Qiongdongnan Basin. Zhao. (2011) used deep seismic reflection profiles and gravity data in the basin to obtain the crustal density structure in the study area by using a joint gravity and seismic data inversion method, and the rock composition of the upper crust of the Qiong- dongnan Basin was estimated. Based on seismic reflectionprofiles, layer velocities and gravity data, velocity and density structures were calculated for the sedimentary basement of the Qiongdongnan Basin (Qiu., 2013, 2014).
At present, the researches on the faults in Yinggehai Basin are mainly about their active periods (Zhu., 2009), activity intensity (Lei., 2015) and their controlling ef- fect on the basin formation (Clift and Sun, 2006; Cui., 2008; Lei., 2015). Few studies have focused on the depth of fault activities. The main faults in the Yinggehai Basin were mainly active during Oligocene to early Miocene (30–16Myr), middle to late Miocene (16–5.5Myr), and Pliocene to Holocene (after 5.5Myr) (Zhu, 2009; Yang., 2013). These faults mainly break the sediment sequences older than 13.8Myr (Lei., 2015).
Similarly, the researches on faults in Qiongdongnan Basin are mostly about their active periods (Liao., 2012),activity intensity (Xie., 2007; Yin., 2010; Li., 2011; Bo., 2013; Liu., 2015) and their controlling effect on the basin formation (Sun., 2005; Zhao., 2018). Few studies have focused on the depth of fault activities.
In summary, previous researchers have conducted extensive works on the structural evolution, the characteristics of faults, the velocity structure, the density structure, the crustal morphology, and the depth of the Moho surfacein the Ying-Qiong Basin. In these works, active source seis- mic data were most often analyzed, and partially supplemented by gravity or magnetic data. However, the limited detection depth and coverage of seismic exploration me- thods make it difficult to determine the active depth range of the main faults controlling the deeper parts of basin struc-tures. Therefore, the Bouguer gravity anomaly data are used to study the active depth range of the principal faults in the Ying-Qiong Basin by wavelet multi-scale analysis and power spectral methods in this paper.
2 Geological Setting
2.1 Red River Fault Zone
The Red River fault zone (RRFZ) is one of the largest strike-slip fault zones in Asia. It starts from the eastern edge of the Tibetan plateau and extends along the edge of the South China Block to Hainan Island, separating the South China Block from the Indochina Block. The RRFZ is a strong ductile shear zone. Zhu. (2009) believed that the offshore part of the RRFZ has experienced three consecutive deformation periods: first a 30–16Myr left- lateral movement stage, followed by a 16–5.5Myr slip re- versal stage. During this period, the shear sense of RRFZ changed from sinistral to dextral one. Finally, during the period of 5.5–3.6Myr, dextral displacement reached a peak and then ceased.
2.2 Yinggehai Basin
The Yinggehai Basin is located between the Hainan Is- land and the Indochina Peninsula. It is tectonically locatedin the South China Block and is a southeast-striking fusi- form basin with a length of about 500km and a maximum width of about 150km. Separated by reverse faults, it has the characteristics of a strike-slip basin. The Yinggehai Ba-sin is characterized by rapid filling, rapid subsidence, high temperatures, and high pressures, and diapiric structures that mostly occur in the middle of the basin (Zhu., 2009). The Yinggehai Basin opened at about 44Myr and mainly experienced tensile deformation in the initial stage. At 21–14Myr, the basin experienced continuous structural inversion at first, followed by a gradual decrease in sub- sidence rate (Clift and Sun, 2006). The Yinggehai Basin successively developed synrift strata and post-rifting strata. Zhu. (2009) considered the two boundary faults in the basin (fault No.1 and the Yingxi fault) and the two cen-tral faults to be the major offshore extensions of the RRFZ. Same as Zhu. (2009) in terms of the numbering of the main fault systems in the Yinggehai Basin, we name the fault No.1 and the Yingxi fault as faults A and D, respec- tively, and the two main faults in the center of the Ying- gehai Basin as faults B and C, respectively. The positions of the four faults, A, B, C, and D are marked in Fig.1.
Fault A separates the Yinggehai Basin from the Beibu Gulf and the Qiongdongnan Basin. Its trajectory is nearly a straight line, extending from the Beibu Gulf to the Zhong- jian Ridge, with a total length of about 420km. The strike of fault A is NE-SW in the north and N-S in the south. It is a southwestward-dipping, high-angle normal fault, whose displacement decreases with time (Zhu., 2009). The fault A (No.1) cuts through the crust at a depth of 8–9km. The structure on both sides of the fault A in the crust is greatly different, and the thickness of the crust suddenly decreases from 25km to 6–7km. That means the fault No. 1 may extend to greater depths, or even the entire crust (Wu., 2009).
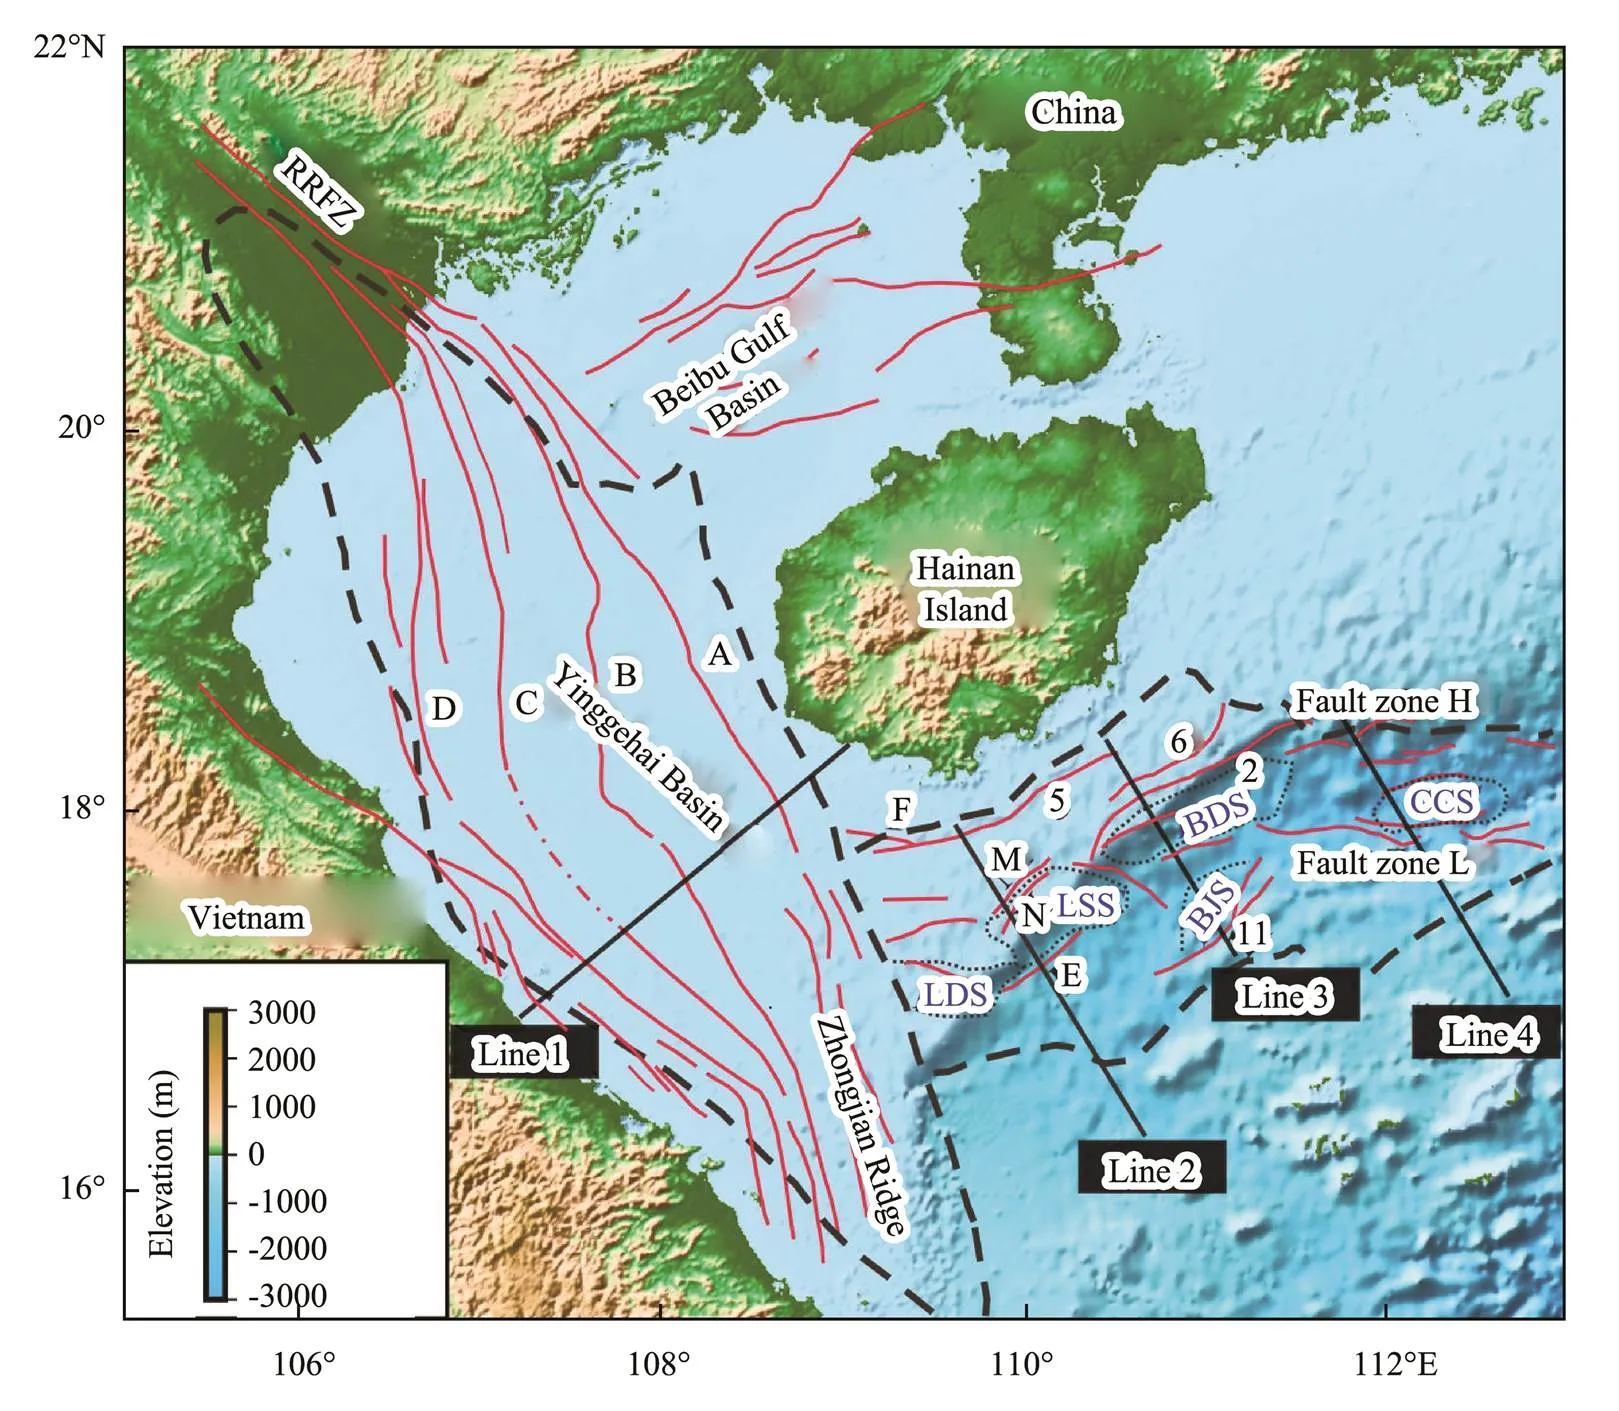
Fig.1 Fault distribution map in the Ying-Qiong Basin. LDS, Ledong sub-basin; LSS, Lingshui sub-basin; BJS, Beijiao sub- basin; BDS, Baodao sub-basin; CCS, Changchang sub-basin. The English letters A, B, C, D, E, F, M, N, fault zone H, fault zone L and 2, 5, 6, 11 are the marks of the main faults in the Ying-Qiong Basin. Line 1, Line 2, Line 3, and Line 4 represent the location of four stratigraphic profiles, respectively.
Fault B runs from the Gulf of Tonkin and goes through the center of the Yinggehai Basin to the south, with a total length of about 450km. It may extend all the way to the vicinity of the Zhongjian Ridge. The north segment of fault B strikes in the direction of N-S, but it bends to NW-SE in the south Zhu. (2009). Based on the seismic profile data, fault B is a high-angle reverse-slip fault in the northern part of the Yinggehai Basin and is inferred as a deep fault (Zhu., 2009).
Fault C starts from the Gulf of Tonkin, cuts across the center of the Yinggehai Basin, and extends southward to the Zhongjian Ridge, with a total length of about 480km. The overall trend of fault C is NW-SE. In terms of its sense of displacement, fault C significantly changes from a reverse fault in the northern basin to a normal one in the southern basin (Zhu., 2009).
Fault D extends along the western edge of the Yinggehai Basin, with a length of about 500km. In the northern part of the basin, the fault D strikes in a N-S direction and becomes NW-SE in the southern part of the basin. At the same time, the inclination and properties of fault D also significantly change from north to south. The northern seg- ment is a high-angle reverse fault with the fault plane dip- ping to the northeastward, accompanied by positive flowerstructures. The southern segment of fault D is a high-angle normal fault dipping northeastward (Zhu., 2009).
2.3 Qiongdongnan Basin
The Qiongdongnan Basin is located at the passive continental margin on the west side of the northern South China Sea. It is a Cenozoic rift basin with an average water depth of more than 2500m and is northeast-trending (Xie., 2007; Bo., 2013). The formation and evo- lution of the Qiongdongnan Basin have been affected by both the RRFZ and the spreading of the South China Sea (Han., 2016). There are five major depocenters in the Qiongdongnan Basin: the Ledong sub-basin (LDS), the Lingshui sub-basin (LSS), the Beijiao sub-basin (BJS), the Baodao sub-basin (BDS), and the Changchang sub-basin (CCS), from west to east (Bo., 2013). These sub-ba- sins are all formed during the rifting stage and are bound- ed and controlled by faults (Xie., 2007).
In the Qiongdongnan Basin, there is a fault zone formed during the rifting stage, which has a planar width of about 50–100km and a length of about 400km. The fault zone appears as an arc and can be divided into three parts: the western, middle, and eastern sections (Bo., 2013). These fault zones are covered by thick sedimentary layers(Bo., 2013). The layout of the main faults in the Qiongdongnan Basin is shown in Figs.1, 2, 4 and 5 (Bo., 2013). In order not to be confused with the fault numbers in Yinggehai Basin, the fault numbers in Qiong- dongnan Basin has been partially modified, that is: Fault C and Fault D on the north side of Lingshui sub-basin (LSS) in the literature were changed into faults M and N, respectively. En Echelon fault zone B and En Echelon fault zone A on the north and south sides of Changchang sub-basin (CCS) were changed into fault zones L and H, respectively.
The western section of the fault zone is mainly composed of some normal faults with the E-W orientation, including fault F and the LDS (Bo., 2013). The middle part of the fault zone is composed of a number of long, linear, NE-ENE-oriented tensional boundary faults, includ- ing faults 5, 2, 6, 11, M, N, E, and so on (Bo., 2013). In seismic profiles, these faults all have fault planes with large dip angles accompanied by normal fault displacement, which do not show strike-slip characteristics. The middle part of the fault zone also contains the LSS, BJS, and BDS. The No.5 fault was less active during the Eocene, while in the early Oligocene its activity rate increased with the maximum slip of 4290m. In the late Oligocene, the basin was in the fault-depression transition period with the maximum slip of 3732m. In the period of Sanya formation, the activity rate further decreased with the maximum slip of 1395m. The No.2 fault had a low activity rate in Eocene, with a maximum slip of 3615m; in early Oligocene, it had a maximum slip of 6800m; in late Oligocene, strong activities caused a maximum slip of 6413m; in Miocene, it had a low activity rate, with a maximum slip of 1006m. In the Eocene, the activity rate of No.6 fault was low and the maximum slip was 2532m. In the early Oligocene, the fault activity was significantly increased and the maximum slip was 3992m. In the late Oligocene, the maximum slip was 3109m. The slip of No. 11 fault is 3000m in Eocene and 9000m in early Oligocene, and its fault activity was the most intense in the late Oligocene, with a slip of 8607m. After the Miocene (12 Myr), the fault activities stopped (Yin., 2010). The lengths of faults M, N and E are all about 40km, and the maximum normal displacement is 1800, 3700 and 4900m, respectively (Bo., 2013).
The eastern section of the fault zone is mainly composed of the CCS and fault zones L and H (Bo., 2013), which are located on the north and south sides of the CCS. The faults that make up these fault zones are mostly large left-lateral strike-slip faults with E-W or nearly E-W orientations and internal faults in E-W or nearly NE orientations. The maximum normal fault displacement in fault zones H and L is 3200 and 5100m, respectively (Bo., 2013).
The large, deep, NE-trending faults exert the main controls on the strike and basin shape of the Qiongdongnan Basin (Xie., 2007; Zhang., 2013). The faults in NE-SW, E-W, and NW-SE directions in the Qiongdongnan Basin ceased to be active after 23Myr (Zhao., 2016). The Paleogene rifting stage also ended around 23 Myr, so the faults mainly controlled the strata formed during the rifting period.
3 Data Acquisition and Methods
3.1 Data
The research area of this study is between 15.3˚– 22˚N in latitude and 105˚–113˚E in longitude. The data used in this paper is the Bouguer gravity data provided by the Bureau Gravimetric International with a resolution of 2΄× 2΄ (Bonvalot, 2012). The data have been processed by terrain correction, height correction, normal field correction, middle layer correction, and atmospheric correction (eli- minating the influence of atmospheric mass on gravity) based on the original gravity data.
As shown in Fig.2, the Bouguer gravity anomaly values are low, close to 0mGal, in the northwest of the Yinggehai Basin and gradually increase to 100mGal toward the southeast direction. Near the Zhongjian Ridge, there is a gravity anomaly gradient belt with the north-south direction. From its west side to the east, the Bouguer gravity anomaly values gradually increase. The Bouguer gravity anomaly in the Qiongdongnan Basin gradually increases from the northwest to the south and most are greater than 150mGal.
3.2 Methods
The Bouguer gravity anomaly includes not only the influence of various ore bodies and structures that deviate from the normal density distribution in the crust but also the influence of the undulation of the lower crustal interface and large losses or surpluses of upper mantle mass in the lateral direction. Using wavelet multi-scale decomposition of the Bouguer gravity field and extracting gravity anomaly information at different frequencies, we focus on analyzing the field details (the second- to sixth-order details). This method is called the 2D discrete wavelet transform. The average bottom interface depth was obtained from each level of field detail after decomposition, and the gravity response of the faults in each level of field detail was analyzed.
This paper aims to characterize the large faults that control the formation of the basin. They have long active times,large penetration depths, and significant gravity anomalies, and involve the formation of synrift strata. Therefore, the depth range of such fault activities has a certain degree of continuity in space. As the decomposition order increases, low-frequency information in the reconstructed detailed field increases, and the proportion of the reflected deep field source information gradually increases. Consequently, it is possible to study the gravity anomaly response of faults at different depths in the Ying-Qiong Basin based on the detailed field information of different decomposition orders.
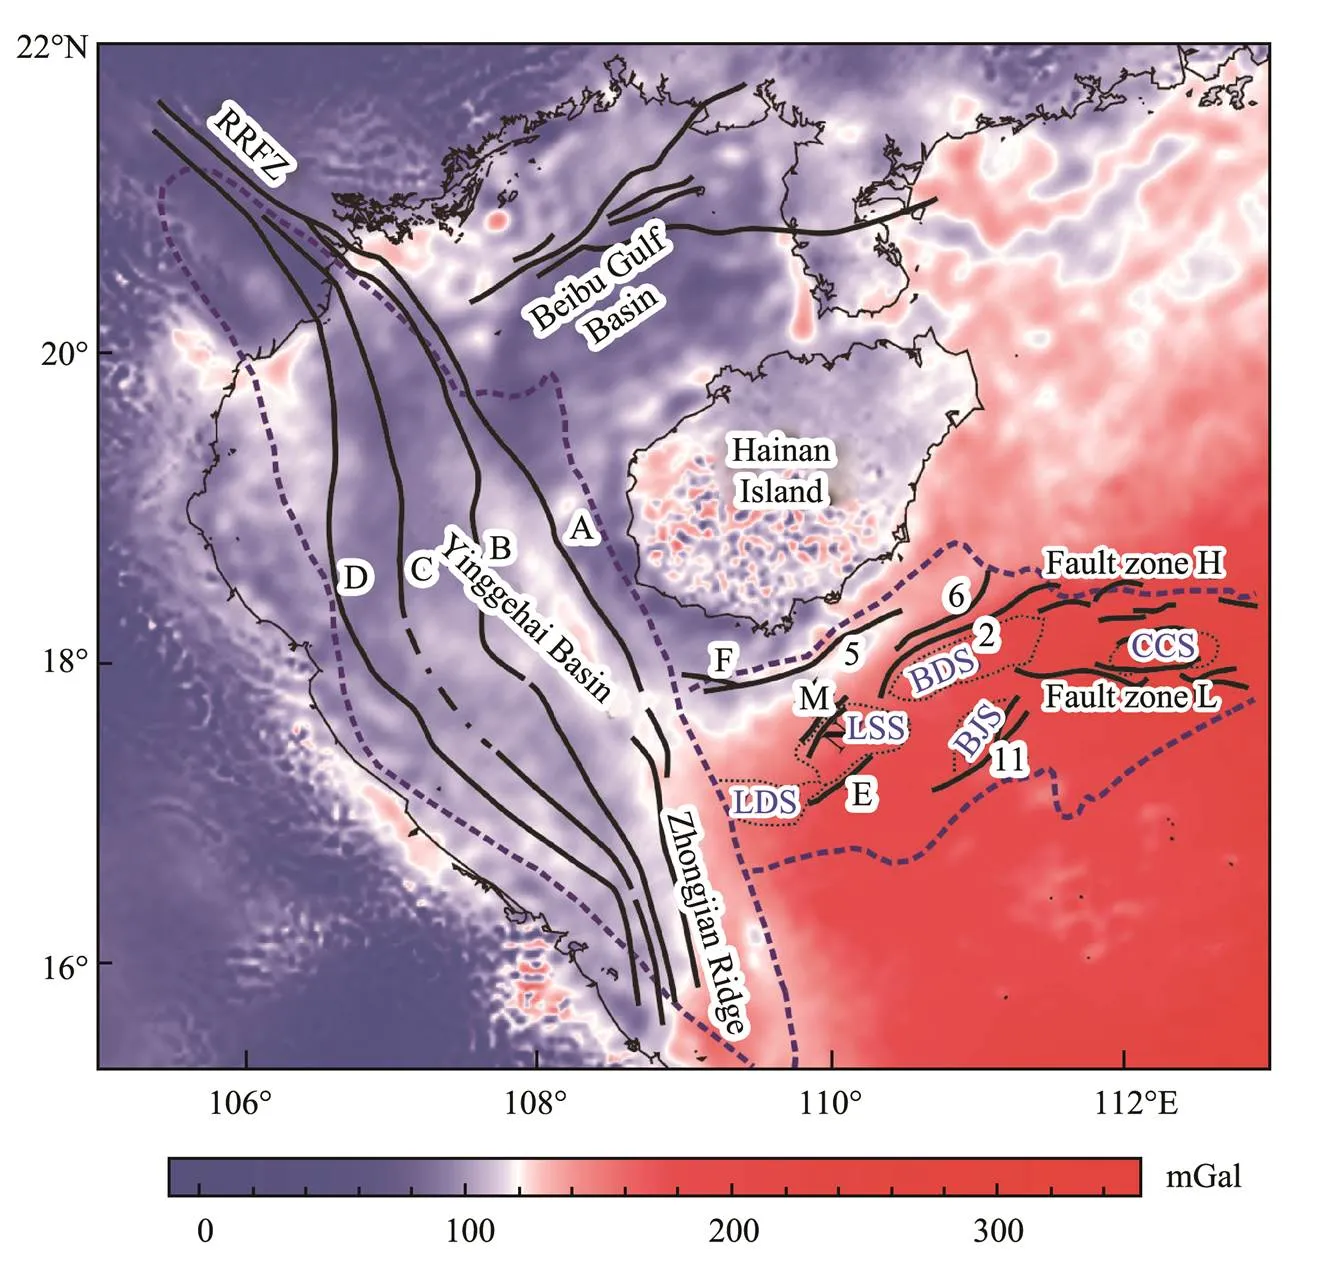
Fig.2 Bouguer gravity map. LDS, Ledong sub-basin; LSS, Lingshui sub-basin; BJS, Beijiao sub-basin; BDS, Baodao sub-basin; CCS, Changchang sub-basin.
3.2.1 Two-dimensional discrete wavelet transform
In 1984, French geophysicists Grossman and Morlet proposed the concept of the wavelet transform. They then established the theoretical system of wavelet transforms using translation and expansion invariance, and cooperated to complete the theoretical work of continuous wave let transforms and inverse transforms (Grossmann and Mor- let, 1984). The wavelet transform method has been applied in many disciplines (Chen and Feng, 1999; Feng., 2002). Mallat (1989) developed this theory in 1989 and first proposed the concept of multi-resolution analysis. The reconstruction formula for a 2D discrete wavelet transform is as follows:

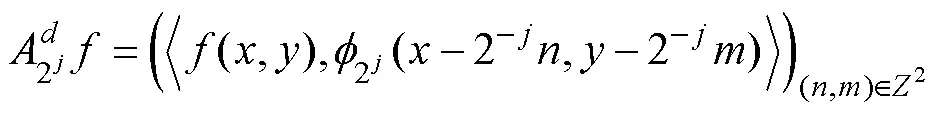

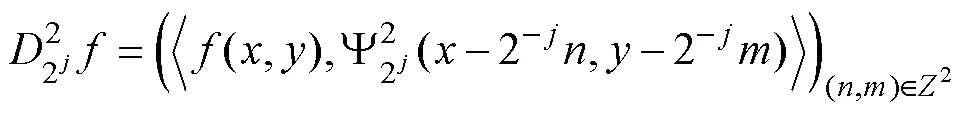

where6is the sixth-order approximation part of gra- vity anomalies obtained by the wavelet decomposition andDGare the sums of the three detail parts, namely, horizontal, vertical, and diagonal components. On a low-order wavelet detail map, the anomalies represent density ano- malies in the shallow crustal layer, while high-order details represent the density structures in the deeper crustal layers. The average depth of the field source can be esti-mated by power spectrum analysis.
3.2.2 Power spectrum method
The average depth of the field source in detailed maps derived from wavelet decomposition can be estimated by using the power spectrum method (Hannan, 1966; Cianciara and Marcak, 1976; Pal., 1978; Tselentis., 1988; Tanaka., 1999; Bansal and Dimri, 2001; Liu., 2013; Tian., 2017, 2020). According to Hou and Li (1988) and Li. (1998), the bottom depth of a prism can be estimated based on the formula to calculate the gravity anomaly from a rectangular prism in the frequency domain derived by Bhattacharyya (1966). The bottom depth can be written as follows:
where() is the power spectrum andis the circular wave number. The power spectra and average depths derived from the first- to sixth-order detailed wavelet field (1-D–6-D) are shown in Fig.3 and Table 1.
4 Results
4.1 Second-Order Detailed Field Characteristics
The average depth of the bottom interface of the field source of the second-order detailed field is 8km (Fig.3b), which may be the shallow, dense and inhomogeneous objects. As shown in Fig.4a, in the Yinggehai Basin, the positive gravity anomalies in the second-order detailed field are distributed in equiaxial or banded pattern, whereas the obvious gravity anomaly gradient belt which may indicate the four main faults (A, B, C, and D) in the basin has not been found. In the western Qiongdongnan Basin, the gravity anomalies are also equiaxial or banded, whereas along the northern and southern boundaries of the basin, two gra- vity gradient belts and beaded anomalies with nearly NE and E-W strikes occur, which indicate the boundary faults in the northern basin (such as faults 5, 6, 2, and F, and fault zone H), and the southern basin (such as the gravity anomaly response of fault zone L and fault 11).
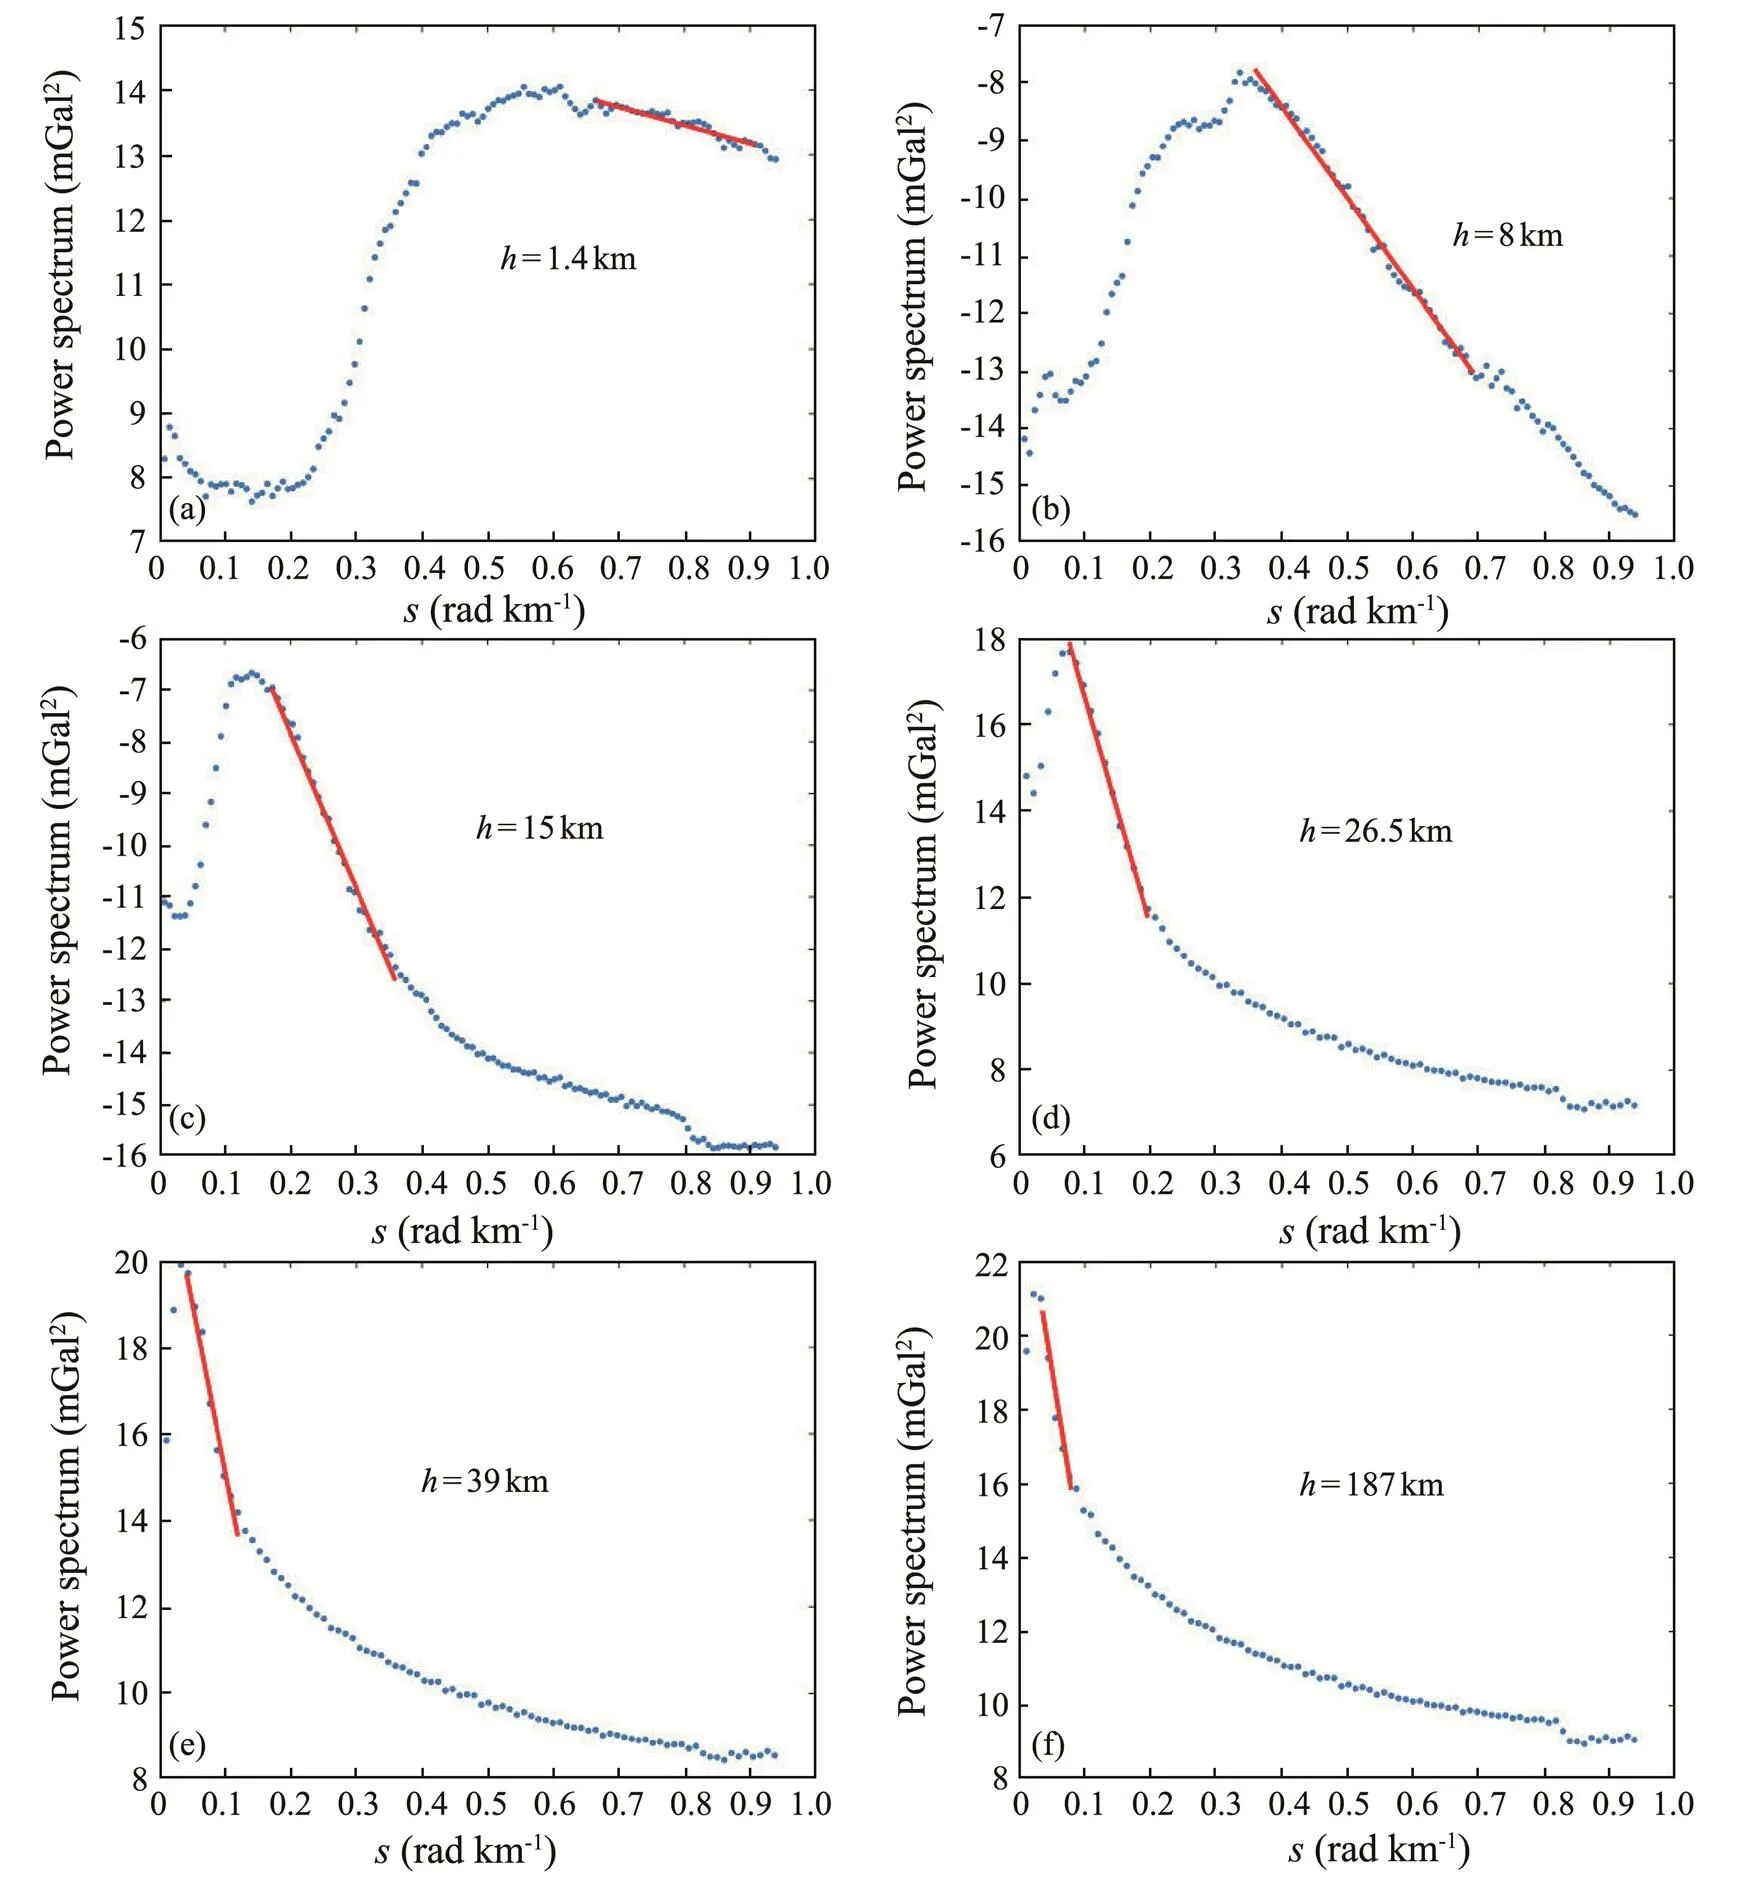
Fig.3 (a)–(f) represent the power spectrum and the average field source depth of the first- to sixth-order detailed fields, respectively.
4.2 Third-Order Detailed Field
The average depth of the bottom interface of the field source of the third-order detailed field is 15km (Fig.3c), being approximate to the previous result (Gao and Liu, 2014). As shown in Fig.4b, in the central Yinggehai Basin, positive gravity anomalies are distributed in a wide band or an equiaxial shape. Beaded anomalies occur at the eastern boundary of the basin and at the location of fault A; and a gravity gradient belt occurs at the southern end of fault A, near the Zhongjian Ridge. There are also weak bead- ed anomalies at the western boundary of the basin, namely, at the location of fault D. In the Qiongdongnan Basin, the gravity anomalies have obvious linear characteristics and are distributed in bands. In the northwest part of the basin, the gravity anomalies are close to NE-striking, whereas in the east of the basin they are close to EW-striking. According to the projection results for faults in the Qiongdongnan Basin from the third-order detailed field, these gravity gradient belts are the responses of faults F, 5, 6, 2, M, N, E, and 11, and fault zones H and L.

Table 1 Average bottom depth of the field sources of the first- to sixth-order detailed fields
4.3 Fourth-Order Detailed Gravity Field
The average bottom interface depth of the fourth-order detailed gravity field source is 26.5km (Fig.3d).
As shown in Fig.4c, positive gravity anomalies in the Yinggehai Basin are distributed in strips, striking NW to N-S. Fault A starts from the location where the RRFZ enters the sea, which is the eastern boundary of the basin, and extends southward to the vicinity of the Zhongjian Ridge. In the fourth-order detailed maps of the Bouguer gravity anomaly, a large-scale banded gravity gradient belt was identified. In the northern part of the basin, banded negative gravity anomalies occur between faults D and C, corresponding to the graben structure between the faults D and C with the opposite dip directions. In the southern part of the basin, there is a similar graben between the faults A and D according to the negative gravity anomaly strip. In the central part of the basin, fault B is shown as N-S- trending banded negative gravity anomalies and fault C is marked by a gravity anomaly gradient belt.
In the Qiongdongnan Basin, the fourth-order detailed gravity field is dominated by banded gravity anomalies with NE and E-W strikes. For example, the large banded negative gravity anomaly at the northern boundary of the basin starts from the western segment of fault M and extends to the east of the basin along faults 5, M, 6, and 2, and fault zone H. In the south of the basin beaded ano- malies start from fault E and propagate eastward along fault 11 and fault zone L. These faults are located at the edges of the banded gravity anomalies.
4.4 Fifth-Order Detailed Gravity Field
The average bottom interface depth of the fifth-order de- tailed gravity field source is 39km (Fig.3e).
As shown in Fig.4d, the fifth-order detailed Bouguer gra- vity anomalies in the Yinggehai Basin display a banded distribution pattern with the NW strike. Near the Hainan Island, which is in the eastern side of the basin, there is a band of positive gravity anomalies with the nearly NW strike between faults A and B. The banded negative gra- vity anomaly between faults C and D in the west of the basin starts from the estuary of the RRFZ and extends southward along the tracks of faults C and D. Finally, all four faults (faults A, B, C, and D) converge in the negative gravity anomaly area on the west side of the Zhongjian Ridge.
There are two large banded gravity anomaly areas in the Qiongdongnan Basin, one of which is inverted L-shaped at the northern boundary of the basin. It starts from the west side of Hainan Island and extends southeast along the boundary of the Yinggehai Basin. Beyond that, it extends northeastward along fault F and faults 5 and 6 in the Qiongdongnan Basin. Finally, it continues to extend east- ward along the fault zone H. The other area starts from the LDS, which is marked by the banded positive gravity anomalies, continues to extend eastward along the northwest boundary of fault E, faults M and N, and the BJS. After passing through the LSS and BDS, it reaches the CCS and extends eastward along the strike of fault zones H and L. The boundaries of these two large banded gra- vity anomaly areas are consistent with those of the deep and shallow water areas in the basin. According to isostaticgravity field theory, the depth of the Moho surface is shallower in the areas of deep water, and the upwelling of mantle materials leads to positive Bouguer gravity anomalies.
4.5 Sixth-Order Detailed Gravity Field
The average bottom interface depth of the sixth-order detailed gravity field source is 187km (Fig.3f). As shown in Fig.4e, on the sixth-order detailed maps of the Bouguer gravity anomaly, in addition to the banded positive gravity anomalies striking NW along the east coast of Vietnam, the northwest basin of the South China Sea displays six groups of bimodal banded features with NE-trending alternating positive and negative gravity anomalies. Because the main controlling faults in the Yinggehai Basin strike in NW direction, which is perpendicular to the trends of the gravity anomalies, the long banded gravity anomalies in the basin are not inferred to be caused by faults. Comparedwith the fifth-order detailed gravity field, the positive gra- vity anomaly zone in the Qiongdongnan Basin has a great- er area, which is supposed to be related to the distribution of deep mantle materials. Therefore, the formation of this zone is not considered to be related to the faults. In conclusion, the active depth of the fault system in the Ying- Qiong Basin is less than the average depth of the sixth- order detailed gravity field sources.
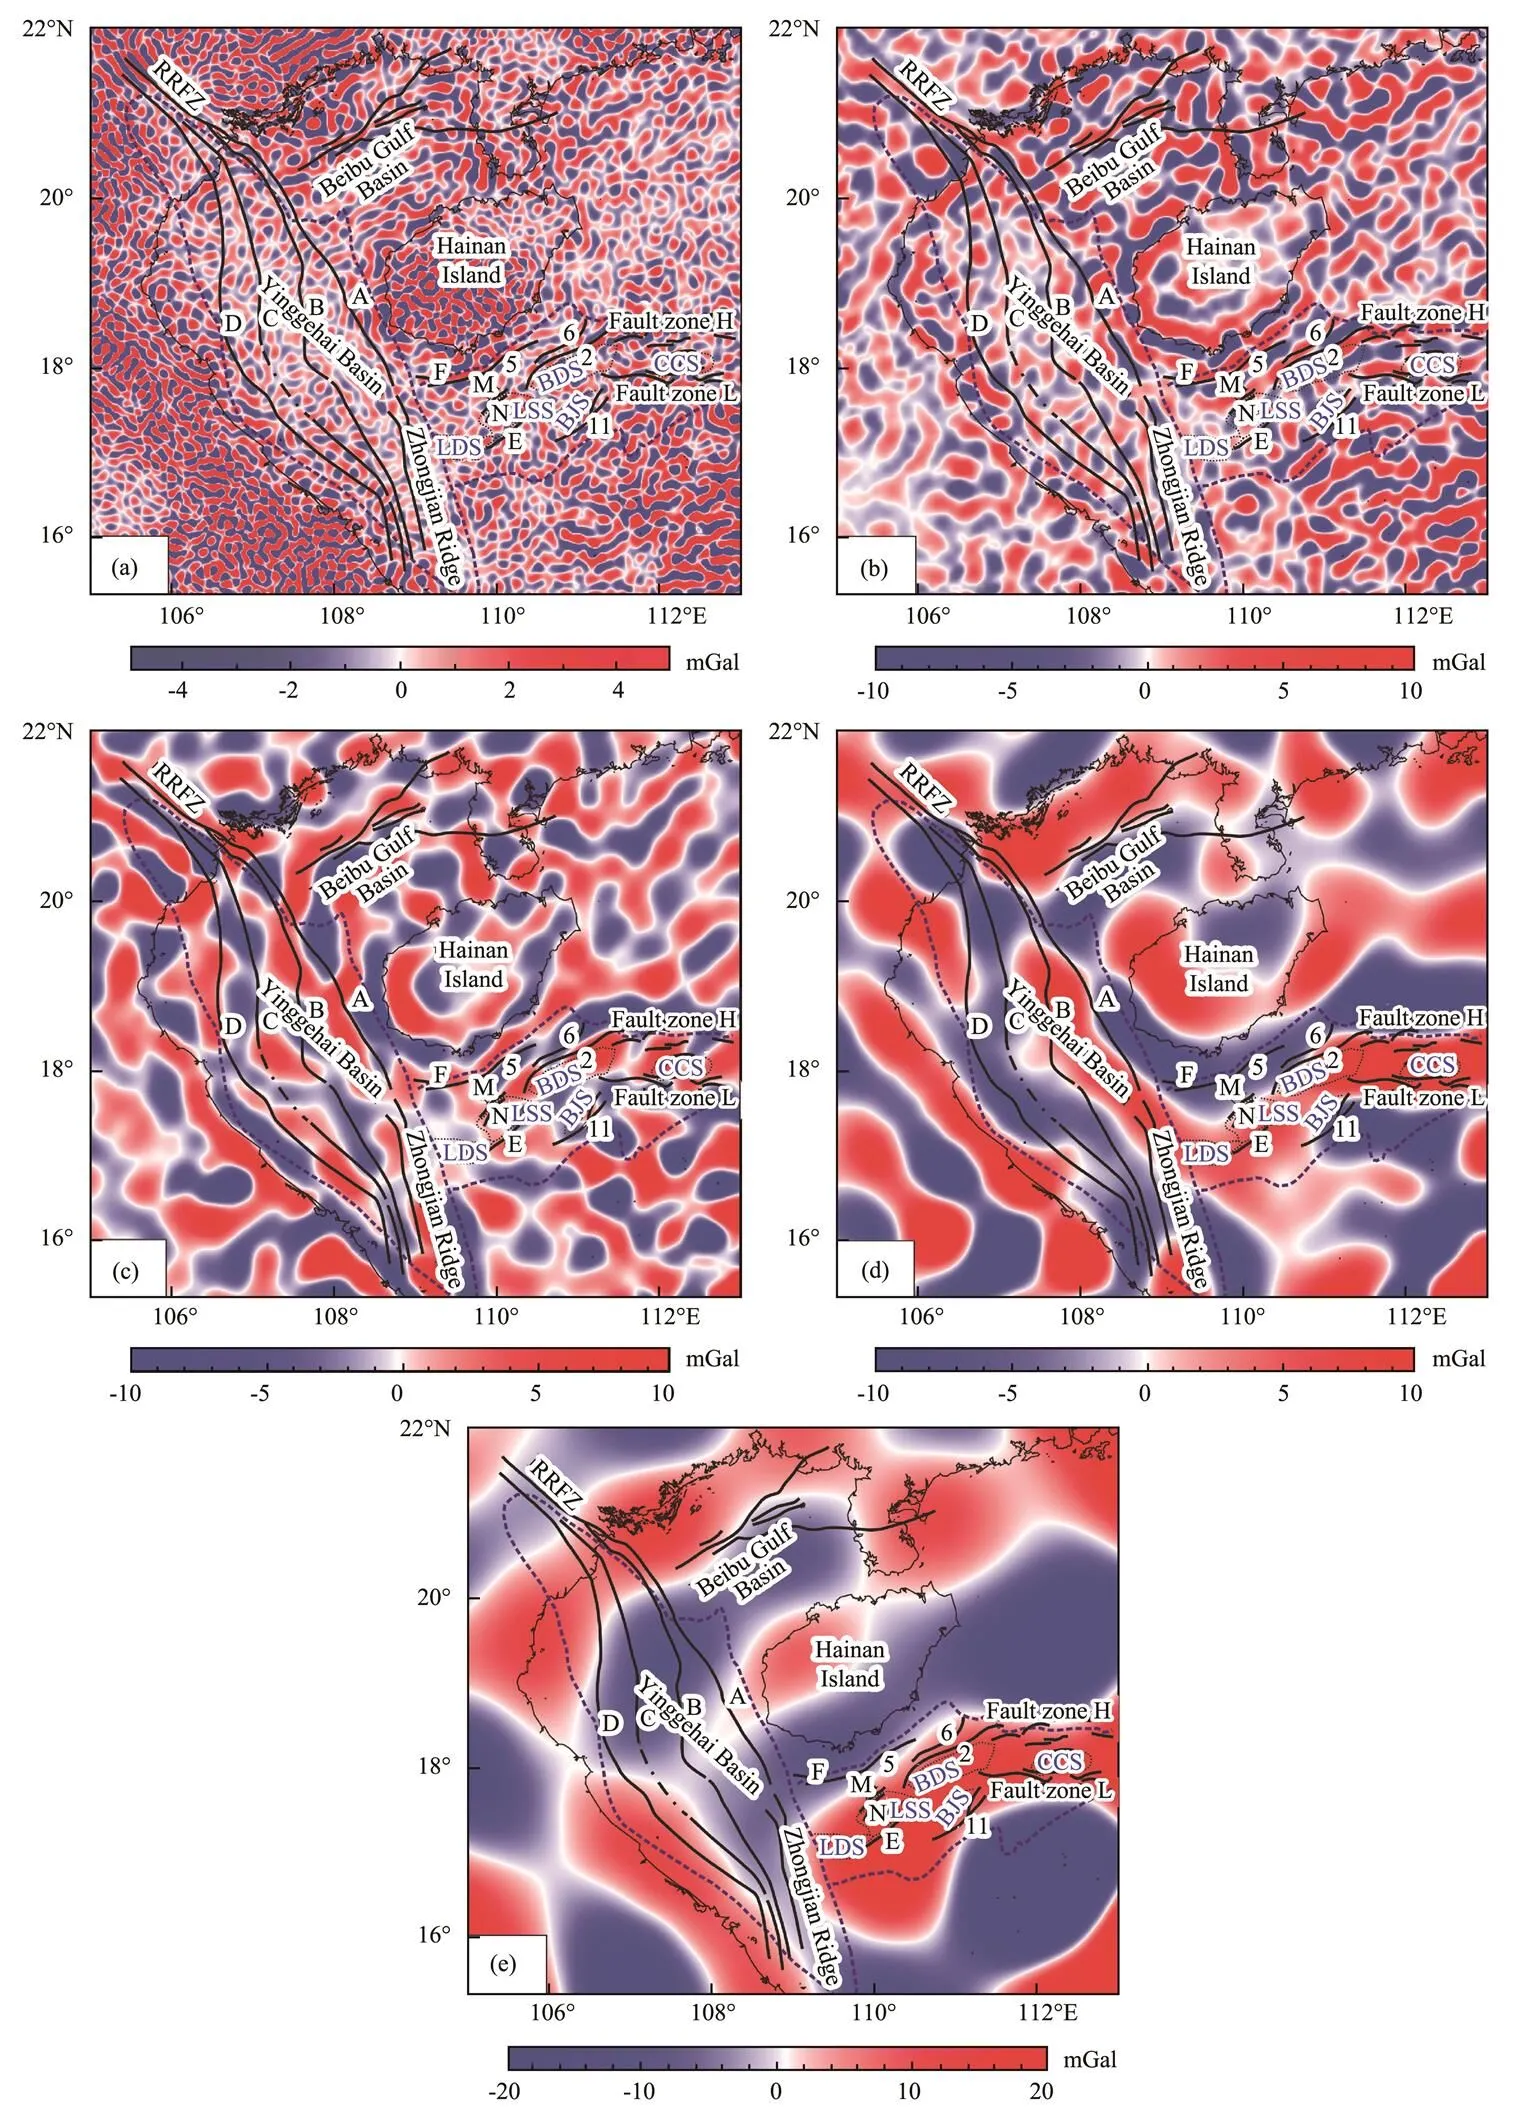
Fig.4 Second- to sixth-order detailed field maps, (a)–(e) represent the second- to sixth-order detailed fields, respectively. LDS, Ledong sub-basin; LSS, Lingshui sub-basin; BJS, Beijiao sub-basin; BDS, Baodao sub-basin; CCS, Changchang sub-basin.
5 Discussion
5.1 Gravity Response Characteristics of Controlling Faults in the Yinggehai Basin
Fault A is divided into three parts: north, middle, and south. The northern segment forms the boundary between the Yinggehai Basin and the Beibu Gulf Basin, the middle segment separates the Yinggehai Basin from the Hainan Island, and the southern segment is the boundary fault of the Zhongjian Ridge.
The first- to second-order detailed fields mainly reflect the gravity anomalies of shallow objects with different den-sities. A very thick sedimentary strata formed after the endof fault A (Clift and Sun, 2006; Bo., 2013; Yang., 2013), and this sediment cover masks the fault A to make its gravity response less distinct. Fault A was mainly active in sedimentary strata formed before 13.8Myr (Lei., 2015) and cut through the sedimentary basement (Song.,2002; Lu., 2015). In the third-order detailed field, the beaded anomalies occur along the strike of the north and middle segments of fault A (Zhu., 2009); therefore, the beaded anomalies represent the gravity response of fault A. Along the southern segment of fault A, a nearly N-S banded negative gravity anomaly zone with the same strike, greater than −10mGal, is also observed. The banded po- sitive gravity anomalies display on both sides of fault A. In the fourth-order detailed field, the position of fault A and the gravity gradient zone are basically coincident. A gravity gradient zone with NNW strike appears in the north and middle sections of fault A, whereas the banded gravity anomaly, which is thought to be related to the Zhongjian Ridge based on its scale, occur along the sou- thern segment of fault A. In the fifth-order detailed field, the large banded gravity anomaly along the north and mid- dle segments of fault A is related to the eastern boundary of the Yinggehai Basin. According to the tomography (Wu., 2009), in the center of the basin and near the Hainan Island, the crustal thickness on the right side of fault A is about 25km, whereas the crustal thickness on the left side is about 6–7km thinner than that on the right side, dis- playing as banded gravity anomalies. The southern seg-ment of fault A is the boundary fault of the Zhongjian Ridge (Sun., 2005), along which low negative gravity ano- maly values were found. In conclusion, based on the gra- vity anomaly characteristics of fault A in the third- to fifth- order detailed fields, we speculate that its active depth range is 15–39km. However, the tomography results in- dicate that the active depth of fault A in the crust near the northwestern part of Hainan Island ranges from 5 to 30km, cutting across the Moho surface (Wu., 2009). The difference between the two sets of results is related to the method used. The tomography results are more accurate in shallow regions, but due to the low signal-to-noise ratio of seismic data, the tomography method cannot describe fault activities deeper than 30km. Therefore, the active depth of fault A may range from 5 to 39km.
The northern part of fault B, near the Beibu Gulf Basin, is adjacent and parallel to fault A. The middle and southern sections of fault B are mainly active in the depocenter of the Yinggehai Basin. Some faults are related to the diapir structure (Lei., 2011), and the overlying sedimentary layer is very thick (Clift and Sun, 2006; Zhu., 2009); therefore, their gravity anomaly response in the second- and third-order detailed fields (Figs.4a–b) are very weak. A large amount of crustal gas contained in the diapir structure has migrated up through fault B, indicating that fault B has a greater active depth. In the fourth- order detailed field, near the Beibu Gulf Basin, fault B is located on a gravity gradient belt, whereas the middle and southern sections of fault B are located on a negative gra- vity anomaly belt with the SE strike, which is inferred to be related to the diapir structure in the area near fault B. In the fifth-order detailed field, the northern sections of faults B and A together form the boundary between the Hanoi depression and the Beibu Gulf Basin, giving rise to a gravity gradient zone; the gravity response characteristics of the middle and southern sections of fault B are very weak. In summary, the active depth range of fault B is inferred to be 26.5–39km based on the gravity anomaly response characteristics in the fourth- to fifth-order detailed fields.
Fault C can be divided into three sections according to changes in strike: north, middle, south sections. The north section extends southward from the Gulf of Tonkin to the middle of the Yinggehai Basin with a strike of nearly N-S; the middle section runs through the middle of the Yinggehai Basin, and its strike is NW-SE (Zhu., 2009); the southern section is located in the south of the Yinggehai Basin and is N-S-striking. In the second-order detailed field, the influence of small density inhomogeneities in the shallow part obscures the gravity anomaly response characteristics of fault C. In the third-order detailed field, fault C passes through a small negative gravity anomaly zone in the north section and corresponds to a series of small beaded gravity anomalies in the middle section, whereas the response of the gravity anomaly for the south section is not obvious. In the fourth-order detailed field, the north section of fault C is located in a gra- vity gradient belt with an approximately S-N strike. On its west side is a negative gravity anomaly area, and on its east side is a positive anomaly area. A gravity gradient belt with a NW strike appears in the middle section of fault C. The southern section of fault C is located in an approximately N-S-trending negative gravity anomaly zone. In the fifth-order detailed field, fault C is located in a strip of negative gravity anomalies whose shape is basically consistent with that of fault C. In conclusion, according to the gravity anomaly response characteristics of fault C in the third- to fifth-order detailed fields, the active depth of fault C is inferred to be 15–39km.
In the second-order detailed field, the gravity anomaly response of fault D is very small, without any obvious gra- vity anomaly characteristics. The third-order detailed field contains obvious beaded anomalies in the north and middle sections of fault D, and the response in the south is chaotic. In the fourth-order detailed field, negative band- ed gravity anomalies occur in the north of the Yinggehai Basin between faults C and D, which is located on the west side of the gravity anomaly belt. In the south-central part of the Yinggehai Basin, positive banded gravity ano- malies appear between faults C and D, where faults C and D become NE-dipping normal faults. In the fifth-order detailed field, faults C and D are located in a negative gra- vity anomaly strip whose shape is roughly same as that of fault D. In conclusion, we infer the active depth range of 15–39km for fault D according to its gravity anomaly response characteristics in the third- to fifth-order detailed fields.
In summary, the Yinggehai Basin contains four deep faults striking in the NNW direction referred to as A, B, C, and D, from east to west, which has influenced the formation of the Yinggehai Basin. According to the results of the above analysis, the active depth range of fault A is 5–39km and the active depth of faults C and D ranges from 15 to 39km, with the gravity response mostly reflected in the third- to fifth-order detailed fields (Table 2). The active depth range of fault B is smallest (26.5–39km), and its gravity response is mostly reflected in the fourth- and fif- th-order detailed fields (Table 2).
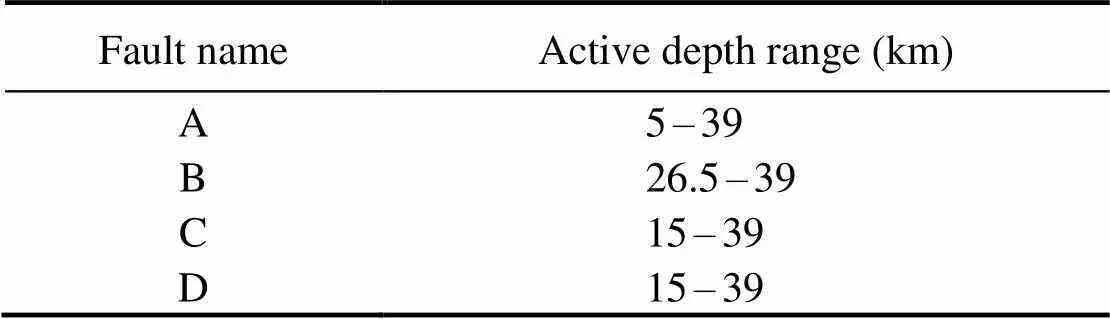
Table 2 Active depth range of the main controlling faults in the Yinggehai Basin
5.2 Gravity Response Characteristics of Controlling Faults in the Qiongdongnan Basin
The response characteristics of fault F are not obvious in the Bouguer gravity anomaly (Fig.2), whereas fault 5 is located on a gravity gradient belt with a NEE trend. In the second- and third-order detailed fields, faults F and 5 cor- respond to gravity anomaly gradient zones with the nearly ENE trend. The south and north sides of the gravity gradient zone are negative and positive gravity anomaly zone, respectively. The gradient zone is more obvious in the third-order detailed field, and the negative gravity anomaly strip becomes wider on its south side. In the fourth-order detailed field, the gravity response on the west side of fault 5 is weakened, but the response remains obvious on the east side. In the fifth-order detailed field, faults F and 5are located on a large ENE-oriented negative gravity ano- maly strip, but there is no sharp gravity anomaly change. Therefore, based on the gravity anomaly characteristics of faults F and 5 in the second- to fourth-order detailed fields,their fault activity depth range is inferred to be 8–26.5km (Table 3).
Faults 2 and 6 are parallel normal faults with opposite dip directions (Bo, 2013). Based on seismic interpretation, faults 2 and 6 were active in the upper Eocene and cut through the basement. The Yacheng formation andthe Lingshui formation were formed during the rifting stage (Bo., 2013; Sun., 2015). Both faults 2 and 6 are located in the high gravity anomaly area (Fig.2). In the second-order detailed field (Fig.4a), the western section of fault 2 corresponds to negative beaded anomalies; the eastern section is located on a gravity gradient belt with an approximately NE trend, whose north and south sides are abnormal bands of positive and negative gravity ano- malies, respectively. Fault 6 corresponds to beaded anomalies in a NE orientation. In the third-order detailed field (Fig.4b), faults 2 and 6 are located on the north and south edges, respectively, of a NE-trending negative gravity ano- maly belt. It is speculated that this negative gravity ano- maly belt is related to the horst structure formed between faults 6 and 2. In the fourth-order detailed field (Fig.4c), faults 2 and 6 are located on a NE-trending gravity ano- malous gradient belt. In the fifth-order detailed field (Fig.4d), fault 2 is located near the boundary between positive and negative gravity anomaly strips, but with different strikes. Therefore, no gravity response of faults 2 and 6 is infer- red from the fifth-order detailed field. Based on the gra- vity anomaly characteristics of faults 2 and 6 in the second- to fourth-order detailed fields, it is inferred that their fault activity depth range is between 8 and 26.5km (Table 3).
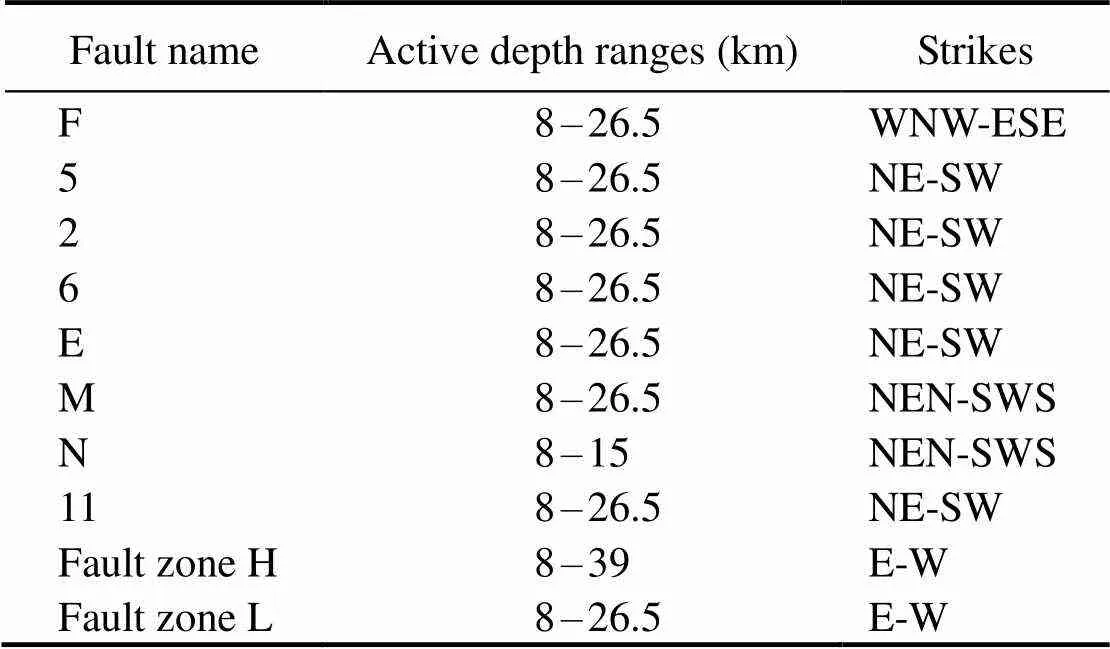
Table 3 Active depth ranges of the main controlling faults in the Qiongdongnan Basin
The interpretations of seismic profiles indicate that fault E was active in the upper Eocene and cut through the basement. The Yacheng formation and the Lingshui formation are synrift deposition (Bo., 2013). The response of fault E in the second-order detailed field is beaded anomalies with a NE trend. In the third-order detailed field, fault E corresponds to a gravity gradient belt, whereas fault E has a weak response in the fourth-order detailed field. The western section of fault E is located at the transition zone between high and low positive gravity anomalies, constituting a small gravity gradient belt. The eastern section of fault E extends into the negative gravity anomaly zone. In the fifth-order detailed field, fault E is in the positive gravity anomaly zone, and there is no gra- vity response. Based on the gravity anomaly characteristics of fault E in the second- to fourth-order detailed fields, its fault activity depth range is inferred to be 8–26.5km (Table 3).
According to the interpretation of seismic profiles, faults M and N were active in the upper Eocene and cut through the basement, and the Yacheng formation and the Lingshui formation were formed during the rifting stage (Bo., 2013). In the second-order detailed field, both faults M and N are located on the beaded anomalies with a NE orientation. In the third-order detailed field, faults M and N are located on a NE-trending gravity gradient zone. The fourth-order detailed field shows that the northeast section of fault M is located in a gravity gradient zone, where- as fault N is located in a zone with low positive gravity anomaly values, which infers that fault N has no gravity response characteristics. In the fifth-order detailed field, faults M and N are located at the edge of a large-scale NE-trending positive gravity anomaly belt. Based on the difference in scale between the fault and gravity anomaly belt, it is inferred that the gravity gradient belt at this location should be related to the distribution of materials in the deep mantle. In summary, the active depth ranges of faults M and N are 8–26.5 and 8–15km, respectively (Table 3).
The seismic data interpretation indicates that fault 11 was active in the Sanya formation that formed in the post- rifting stage, and active in the Yacheng formation and the Lingshui formation formed in the rifting stage during the upper Eocene, and also cut through the basement (Zhao., 2016). In the second-order detailed field, fault 11 is located on the beaded anomalies. In the third-order detailed field, fault 11 is located on a gravity gradient zone and on its north and south sides are banded positive and negative gravity anomalies, respectively. In the fourth-or- der detailed field, the western section of fault 11 is located in a banded negative gravity anomaly area, and the nor- theast section is located at the edge of the isometric positive gravity anomaly area in the BJS. Therefore, the gra- vity response of fault 11 in the fourth-order detailed field is weak. In the fifth-order detailed field, fault 11 is mainly located in a negative gravity anomaly zone, which may be related to the large-scale uneven distribution of materials in the mantle. Based on the gravity anomaly characteristics of fault 11 in the second- to fourth-order detailed fields, we speculate that its fault activity depth range is between 8 and 26.5km (Table 3).
Fault zones H and L are in a set of en echelon fault zones with parallel strikes and opposite inclinations. The CCS was formed between the two fault zones (Bo., 2013). According to the seismic data interpretation, fault zones H and L were active in the deposition of the Eocene Yacheng formation and Lingshui formation, and furtherly cut through the basement. In the second-order detailed field, beaded gravity anomalies appear at the position of fault zone H. In the third-order detailed field, the responses of fault zones H and L are both beadedanomalies with the E-W trend. In the fourth-order detailed field, fault zones H and L are both located on an E-W-trending gravity gradient belt with equiaxial positive gravity anomalies between the two fault zones. The CCS is in a high-value po- sitive gravity anomaly zone with an E-W trend in the fifth- order detailed field. The northern boun- dary of this anomaly zone corresponds to fault zone H, whereas fault zone L is located inside the positive gravity anomaly zone. There is no obvious gravity field response characteristic for either fault. The formation of this anomaly zone is related to the shallow depth of the Moho surface in the CCS (only 13.8km) and the gradual deepening to the north and south sides (Zhang., 2013). Therefore, it is inferred that the active depth of the fault zone H is between 8 and 39km and that of the fault zone L is between 8 and 26.5km (Table 3).
In the Qiongdongnan Basin, the gravity response of the fault zone H is reflected in the second- to fifth-order detailed fields, and the active depth ranges is from 8 to 39km. The gravity response of the fault N is reflected in the second- to third-order detailed fields indicating the depth range of 8–15km. Aside from these two faults, the gravitational responses of the other faults are reflected in the second- to fourth-order detailed fields, and their active dep- ths range from 8 to 26.5km.
5.3 The Influence of Deep Fault Systems on Basin Structure
According to the wavelet multi-scale analysis mention- ed above in the Yinggehai Basin, the four faults that constitute the offshore extension of the RRFZ have a maximum penetration depth of at least 39km, which are classified as crustal-scale faults, cutting through the Moho. Under the continuous activities of this dominant fault zone, the basin has developed significant sediment deposition since the Cenozoic. As can be seen from Fig.5, the thickness of the strata in the sedimentary center of the basin reaches as much as 15km. According to the theory of cru- stal equilibrium, the filling of a large amount of low-den- sity sediments in the basin may cause feedback in the deep structure of the lithosphere. It can be seen that the Moho is uplifted in the central part of the basin, and the crust has been significantly thinned by 10km, accounting for near- ly 1/3 of the average crustal thickness of the basin (34km).
According to wavelet multi-scale analysis in the Qiong- dongnan Basin, although there are significant spatial differences in the penetration depths of the faults, the crust- penetrating faults with an overall depth of nearly 40km also developed. The basin has received a large amount of sediment deposition in relation to the trans-crustal faulting mentioned above, and the input of low-density sediments has also caused isostatic adjustment of the lithospheric structure. As shown in Fig.5, the thickness of the central strata in the west side of the Basin reaches as much as 10km. Accordingly, the Moho has been uplifted by nearly 7 km, and the thickness of the crust has been reduced by approximately 1/4 of the total (27km). The profile along Line 3 in the central part of the basin shows that, under the control of faults 2, 6, and 11, around 7km of sedimen- tary strata has been deposited, and the Moho is uplifted 5km, thinning about 1/5 of the crustal thickness (27km). The profile along Line 4 on the east side of the basin shows that, under the main influence of the H and L fault zones, sediment accumulation in the center of the basin reaches 10km in thickness, and the Moho is uplifted by 10km, thinning 1/2 of the crustal thickness (22km). Thus, the presence of low-density strata has also induced the adjust- ment in crustal structure, varied in space, under the domi- nance of the aforementioned main controlling faults in the Qiongdongnan Basin. Toward the east of the basin, the adjustment becomes larger. In particular, the comparison between sections along Line 1 and Line 4 reveals that the crustal thinning along Line 4 (by 1/2 of crustal thickness) was significantly greater than that along Line 1 (1/3 of crustal thickness), although the two sections were dominated by the same main trans-crustal faults and both were loaded with nearly 10km of sedimentary strata. Compared to the Yinggehai Basin, the Qiongdongnan Basin gets the sufficient material supply from the areas such as the Sichuan-Yunnan region and Indosinian Blocks in southeastern Tibet, and from the Red River and other river systems. As the fault activity and the accommodating space increase, the thickness of the sedimentary strata is obviously thick- en. However, the range of crustal adjustment in the Yinggehai Basin is less than that in the Qiongdongnan Basin. This difference may not be simply attributed to the Airy equilibrium model. This indicates that the crustal structure adjustment in the Qiongdongnan Basin is not only related to the accretion of sedimentary strata dominated by the basin faults, but is also closely related to magmatic activities and other factors. The eastern part of the Qiongdongnan Basin is adjacent to the northwest sub-basin of the South China Sea and near its expansion center. Therefore, the Moho is shallower and the crust has been significantly thinned due to the upwelling of deep mantle materials (Shi, 2005, 2017; Mi., 2009; Liu, 2015).
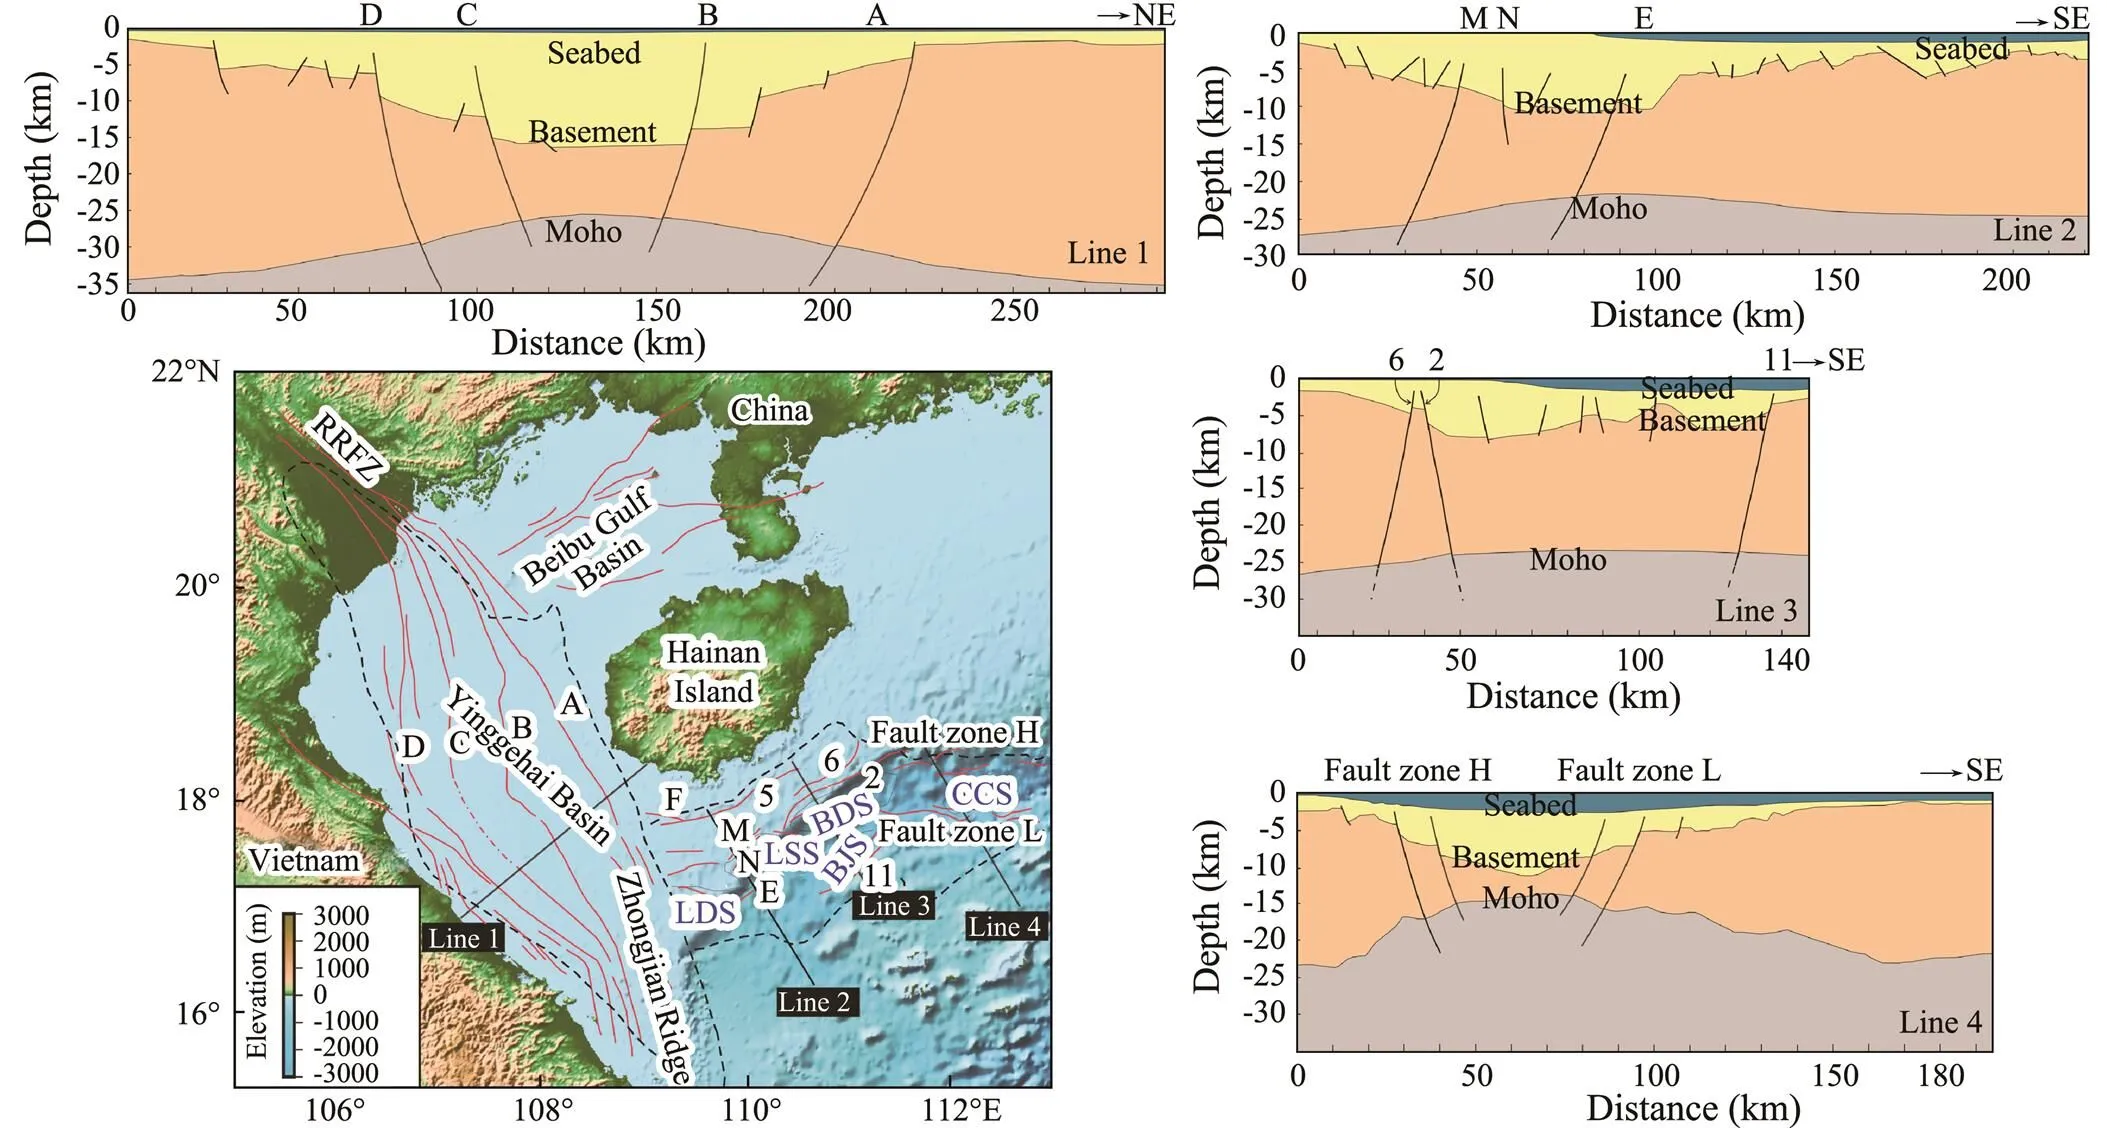
Fig.5 The distribution of faults in sections in Ying-Qiong Basin based on the seismic interpretation. Line 1 is referenced from Mazur et al. (2012), the shallow stratigraphic structure along Line 2 is referenced from He et al. (2017), faults in the section along Line 3 is referenced from Zhao et al. (2015b), the depth of the sedimentary basements is referenced from Zhao et al. (2015a), the stratigraphic section of Line 4 is referenced from Qiu et al. (2014), Moho depth along Line 2 and Line 3 is referenced from Zhang et al. (2008).
6 Conclusions
Previous studies in the Ying-Qiong Basin mainly focus on the active time and rate of the main faults and their relationship with the growth of the basin, but there are few studies on the depths of fault activities. Based on wavelet decomposition of the Bouguer gravity field and power spectrum analysis, this paper estimated the active depth ranges of the main controlling faults in the Yinggehai Basin and the Qiongdongnan Basin. In the Yinggehai Basin, the trending of the four main faults A, B, C and D is generally NW trending, and fault A has the largest activity depth range of 5–39km. The active depth ranges of faults C and D are all 15–39km, and their gravity responses are mostly reflected in the third- to fifth-order detailed fields. The active depth range of fault B is smallest between 26.5 and 39km, and the gravity response is mostly reflected in the fourth- to fifth-order detailed fields. Compared with the Yinggehai Basin, the active depth of faults in the Qiongdongnan Basin is relatively shallow. Among them, the fault zone H with E-W strike is significantly marked in the second- to fifth-order detailed fields with an active depth range from 8 to 39km. The gravity response of fault N is obvious in the second- to third- order detailed fields with an active depth range between 8 and 15km. Aside from the first two, the gravity responses of the remaining faults are mostly reflected in the second- to fourth-order detail fields with the active depth range between 8 and 26.5km.
The depths obtained by the gravity power spectrum method used in this paper are not accurate enough. It is suggested that joint inversion should be carried out in combination with gravity and seismic data in future.
Acknowledgements
We thank Wessel & Smith (https://www.soest.hawaii. edu/gmt) for the free use of GMT software, by which most figures in this paper were produced. This work was supported by the National Natural Science Foundation of Chi- na (Nos. 41530963, 91858215 and 41906048), the Fundamental Research Funds for the Central Universities (No. 201964015) and the Laboratory for Marine Mineral Resources, Qingdao National Laboratory for Marine Science and Technology (No. MMRZZ201801).
Bansal, A. R., and Dimri, V. P., 2001. Depth estimation from the scaling power spectral density of nonstationary gravity profile., 158 (4): 799-812.
Bhattacharyya, B. K., 1966. Continuous spectrum of the total magnetic field anomaly due to a rectangular prismatic body., 31 (1): 97-121.
Bo, H., Wang, L. S., Yan, W. B., Liu, S. W., Cai, D. S., Zhang, G. C.,., 2013. The tectonic evolution of the Qiongdongnan Basin in the northern margin of the South China Sea., 77: 163-182.
Bonvalot, S., 2012. The international gravimetric Bureau., 86 (10): 946-949.
Chen, Z., and Feng, T. J., 1999. Research developments and prospects of wavelet neural networks., 29 (4): 663-668 (in Chinese with English abstract).
Cianciara, B., and Marcak, H., 1976. Interpretation of gravity ano- malies by means of local spectra., 24 (2): 273-286, DOI: 10.1111/j.1365-2478.1976.tb00925.x.
Clift, P. D., and Sun, Z., 2006. The sedimentary and tectonic evolution of the Yinggehai-Song Hong Basin and the southern Hainan margin, South China Sea: Implications for Tibetan up- lift and monsoon intensification., 111 (B6): B06405, DOI: 10.1029/2005 JB004048.
Cui, T., Xie, X. N., Ren, J. Y., and Zhang, C., 2008. Dynamic mechanism of anomalous post-rift subsidence in the Yinggehai Basin., 33 (3): 349-356 (in Chinese with English abstract).
Feng, L. D., Sun, X. G., and Xu, K. H., 2002. Edge detection of coastline based on wavelet transform method., 32 (5): 777-781 (in Chinese with English abstract).
Gao, J. Y., and Liu, B. H., 2014.. China Ocean Press, Beijing, 100pp (in Chinese).
Grossmann, A., and Morlet, J., 1984. Decomposition of Hardy functions into square integrable wavelets of constant shape., 15 (4): 723-736.
Han, J. H., Leng, J. G., and Wang, Y. M., 2016. Characteristics and genesis of the polygonal fault system in southern slope of the Qiongdongnan Basin, South China Sea., 70: 163-174, DOI: 10.1016/j.marpetgeo.20 15.11.022.
Hannan, E. J., 1966. Spectral analysis for geophysical data., 11 (1): 225-236, DOI: 10.1111/j.1365-246X.1966.tb03502.x.
He, C., Wu, S. M., and Long, G. Y., 2017. Lithospheric stretching modeling of Qiongdongnan Basin: Based on line 1., 33 (8): 24-31 (in Chinese with English abstract).
Hou, C. C., and Li, B. G., 1988. Estimating depths and thickness of rock stratum by using the power spectra of potential fields and their derivatives of different order., 31 (1): 92-100 (in Chinese with English abstract).
Lei, C., Ren, J. Y., Clift, P. D., Wang, Z. F., Li, X. S., and Tong, C. X., 2011. The structure and formation of diapirs in the Yinggehai-Song Hong Basin, South China Sea., 28 (5): 980-991, DOI: 10.1016/j.marpet geo.2011.01.001.
Lei, C., Ren, J. Y., Sternai, P., Matthew, F., Willett, S., Xie, X. N.,., 2015. Structure and sediment budget of Yinggehai- Song Hong-Basin, South China Sea: Implications for Cenozoic tectonics and river basin reorganization in Southeast Asia., 655: 177-190, DOI: 10.1016/j.tecto.2015.05. 024.
Li, C. L., Xie, C. L., and Lu, Q. T., 1998. Calculating top and bottom depth effect of geological body by applying potential field power spectrum., 17 (5): 45-48 (in Chinese with English abstract).
Li, X. X., Zhong, Z. H., Dong, W. L., Sun, Z., Xia, B., and Zhang, M. Q., 2006. Paleogene rift structure and its dynamics of Qiongdongnan Basin., 33 (6): 70-78 (in Chinese with English abstract).
Li, Y. M., Shi, X. B., Xu, H. L., and Liu, B., 2011. Analysis on the characteristics of Paleogene basement fault’s activity in Qiongdongnan Basin., 30 (6): 74-83 (in Chinese with English abstract).
Liao, J. H., Wang, H., Xiao, J., Li, J. L., Yan, D., Li, G. L.,., 2012. Episodic rifting and integrated response process of tectonic, sequence stratigraphy and sedimentary filling in Paleo- gene of Qiongdongnan Basin, South China Sea., 42 (4): 970-983 (in Chinese with English abstract).
Liu, F., Zhu, Y. Q., and Chen, S., 2013. Multi-scale decomposition of wavelet of the temporal gravity variation in North China., 29 (1): 124-131 (in Chinese with English abstract).
Liu, J. B., Sun, Z., Wang, Z. F., Sun, Z. P., Zhao, Z. X., Wang, Z. W.,., 2015. Tectonic differences between eastern and west- ern sub-basins of the Qiongdongnan Basin and their dynamics., 36 (1): 61-79, DOI: 10.1007/ s11001-014-9247-3.
Liu, S. J., Zeng, G. P., Qiu, X. L., Fu, G., Wu, S. M., Ye, S. Y.,., 2011. The crustal profile and onshore-offshore seismic exploration in the marine area southwest to Hainan Island., 26 (3): 922-933 (in Chinese with Eng- lish abstract).
Lu, B. L., Wang, W. Y., Zhang, G. C., and Wang, P. J., 2015. Geophysical evidence of the Red River Fault extending position in the South China Sea and the relationship with seafloor spreading., 34 (5): 64-74 (in Chinese with English abstract).
Luo, D., Cai, F., Yan, G. J., Wang, L. L., and Tong, C. X., 2014. Tectonic characteristics and deep crustal structure of Yinggehai-Song Hong Basin., 29 (6): 2917- 2926 (in Chinese with English abstract).
Mallat, S. G., 1989. A theory for multiresolution signal decomposition: The wavelet representation., 11 (7): 647-693, DOI: 10.1109/34.192463.
Mazur, S., Green, C., Stewart, M. G., Whittaker, J. M., Williams, S., and Bouatmani, R., 2012. Displacement along the Red River Fault constrained by extension estimates and plate reconstructions., 31 (5): TC5008, DOI: 10.1029/2012 TC003174.
Mi, L. J., Yuan, Y. S., Zhang, G. C., Hu, S. B., He, L. J., and Yang, S. C., 2009. Characteristics and genesis of geothermal field in deep-water area of the northern South China Sea., 30 (1): 27-32 (in Chinese with English abstract).
Pal, P. C., Khurana, K. K., and Unnikrishnan, P., 1978. Two examples of spectral approach to source depth estimation in gra- vity and magnetics., 117 (4): 772- 783, DOI: 10.1007/BF00879978.
Qiu, N., Wang, Z. F., Xie, H., Sun, Z. P., Wang, Z. W., Sun, Z.,., 2013. Geophysical investigations of crust-scale structural model of the Qiongdongnan Basin, northern South China Sea., 34: 259-279, DOI: 10.10 07/s11001-013-9182-8.
Qiu, N., Wang, Z. W., Wang, Z. F., Sun, Z. P., Sun, Z., and Zhou, D., 2014. Tectonostratigraphic structure and crustal extension of the Qiongdongnan Basin, northern South China Sea., 57 (10): 3189- 3207 (in Chinese with English abstract).
Shan, J. N., Zhang, G. C., Tang, X. Y., Wu, J. F., Zhao, C. Y., Song, Y.,., 2011. Thermal structure and Moho temperature of Qiongdongnan Basin, northern margin of the South China Sea., 54 (4): 516-525.
Shi, X. B., Burov, E., Leroy, S., Qiu, X. L., and Xia, B., 2005. Intrusion and its implication for subsidence: A case from the Baiyun Sag, on the northern margin of the South China Sea., 407 (1-2): 117-134, DOI: 10.1016/j.tecto.20 05.07.004.
Shi, X. B., Jiang, H. Y., Yang, J., Yang, X. Q., and Xu, H. H., 2017. Models of the rapidpost-rift subsidence in the eastern Qiongdongnan Basin, South China Sea: Implications for the development of the deep thermal anomaly., 29 (3): 340-362, DOI: 10.1111/bre.12179.
Song, H. B., Hao, T. Y., Jiang, W. W., Qiu, X. L., Xu, Y., and Liu, J. H., 2002. Researches on geophysical field characteristics and basement fault system of South China Sea., 17 (1): 24-33 (in Chinese with English abstract).
Song, W. Y., 2012. Characteristics and dynamic evolution of inverted structure in Yinggehai Basin., 32 (2): 77-83 (in Chinese with English abstract).
Sun, Z., Wang, Z. F., Sun, Z. P., Wang, Z. W., Zhang, W., and He, L. J., 2015. Structure and kinematic analysis of the deep waterarea of the Qiongdongnan Basin through a seismic interpre- tation and analogue modeling experiments., 34: 32-40, DOI: 10.1007/s13131-015-0585-z.
Sun, Z., Zhou, D., Zhong, Z. H., Qiu, X. L., and Zeng, Z. X., 2005. A study on basal controlling fault pattern of YingQiong Basin through analogue modeling., 24 (2): 73-81 (in Chinese with English abstract).
Sun, Z., Zhou, D., Zhong, Z. H., Zeng, Z. X., and Wu, S. M., 2003. Experimental evidence for the dynamics of the formation of the Yinggehai Basin, NW South China Sea., 372 (1): 41-58, DOI: 10.1016/S0040-1951(03)0023 0-0.
Tanaka, A., Okubo, Y., and Matsubayashi, O., 1999. Curie point depth based on spectrum analysis of the magnetic anomaly data in East and Southeast Asia., 306 (3-4): 461-470, DOI: 10.1016/s0040-1951(99)00072-4.
Tian, T., Zhang, J. F., Jiang, W. L., and Tian, Y. F., 2020. Quantitative study of crustal structure spatial variation based on gravity anomalies in the eastern Tibetan Plateau: Implication for earthquake susceptibility assessment.,7 (3): e2019EA000943, DOI: 10.1029/2019EA000943.
Tian, T., Zhang, J. F., Liu, T. Y., Jiang, W. L., and Zhao, Y. B., 2017. Morphology, tectonic significance, and relationship to the Wenchuan earthquake of the Xiaoyudong fault in western China based on gravity and magnetic data., 138: 672-684, DOI: 10.1016/j.jseaes.2016. 10.008.
Tselentis, G., Drakopoulos, J., and Dimitriadis, K., 1988. A spectral approach to Moho depths estimation from gravity mea- surements in Epirus (NW Greece)., 36 (6): 255-266, DOI: 10.4294/jpe1952.36.255.
Wu, S. M., Qiu, X. L., Zhou, D., Zeng, G. P., Xia, K. Y., and Ye, S. Y., 2009. Crustal structure beneath Yinggehai Basin and adjacent Hainan Island, and its tectonic implications., 20: 13-26, DOI: 10.1007/s12583-009-000 2-7.
Xia, K. Y., Zhou, D., Su, D. Q., Flueh, E., Ye, S. Y., He, H. Y.,., 1998. The velocity structure of the Yinggehai Basin and its hydrocarbon implication., 43: 2047-2054, DOI: 10.1007/BF03183503.
Xie, W. Y., Zhang, Y. W., Sun, Z., and Jiang, J. Q., 2007. Characteristics and formation mechanism of faults in Qiongdongnan Basin., 27 (1): 71-78 (in Chinese with English abstract).
Xie, Y. H., Tong, C. X., Fan, C. W., Song, P., Zhang, H., and Tong, H. M., 2015. Characteristics and evolution of fault system in Qiongdongnan Basin., 39 (5): 795-807, DOI: 10.16539/j.ddgzyckx.2015.05.004 (in Chinese with English abstract).
Yang, F. L., Zhou, Z. Y., Zhang, N., Liu, N., and Ni, B., 2013. Stress field modeling of northwestern South China Sea since 5.3Ma and its tectonic significance., 32 (12): 31-39, DOI: 10.1007/s13131-013-0385-2.
Yin, X. Y., Ren, J. Y., Pei, J. X., and Lei, C., 2010. Quantitative calculation on fault activity and fault propagation mechanism in Qiongdongnan Basin, South China Sea., 16 (3): 388-396 (in Chinese with English abstract).
Zhang, C. M., Wang, Z. F., Sun, Z. P., and Sun, Z., 2013. Structural differences between the western and eastern Qiongdong- nan Basin: Evidence of Indochina block extrusion and South China Sea seafloor spreading., 34 (3-4): 309-323, DOI: 10.1007/s11001-013-9187-3.
Zhang, J. A., 2013. Research on the tectonic boundary of Ying- Qiong Basin and adjacent faults’ features based on gravity and magnetic data. Master thesis. Chang’an University.
Zhang, Y. F., Sun, Z., Zhou, D., Guo, X. W., Shi, X. B., Wu, X. J.,., 2008. Stretching characteristics and its dynamics significance of the northern continental margin of South China Sea., 51 (3): 422-430, DOI: 10.1007/s114 30-008-0019-2.
Zhang, Z. J., Liu, Y. F., Zhang, S. F., Zhang, G. C., and Fan, W. M., 2009. Crustal P-wave velocity structure and layering beneath Zhujiangkou-Qiongdongnan Basin, the northern continental margin of South China Sea., 52 (10): 2461-2471 (in Chinese with English abstract).
Zhao, B., Zhang, S. F., and Li, S. L., 2011. Crustal density and composition models beneath Qiongdongnan Basin., 54 (1): 98-107 (in Chinese with English abstract).
Zhao, J. Z., Li, Z. W., Lin, J. M., Hao, T. Y., Bao, F., Xie, J.,., 2019. Ambient noise tomography and deep structure in the crust and mantle of the South China Sea., 62 (6): 2070-2087 (in Chinese with English abstract).
Zhao, Z. X., Sun, Z., Sun, L. T., Wang, Z. F., and Sun, Z. P., 2016. Cenozoic tectonic subsidence in the Qiongdongnan Basin, northern South China Sea., 30 (S1): 269- 288.
Zhao, Z. X., Sun, Z., Wang, Z. F., and Sun, Z. P., 2015a. The mechanics of continental extension in Qiongdongnan Basin, northern South China Sea., 36 (2-3): 197-210, DOI: 10.1007/s11001-014-9238-4.
Zhao, Z. X., Sun, Z., Wang, Z. F., Sun, Z. P., and Zhang, C. M., 2015b. The high resolution sedimentary filling in Qiongdong- nan Basin, northern South China Sea., 361: 11-24, DOI: 10.1016/j.margeo.2015.01.002.
Zhao, Z., Sun, Z., Sun, L., Wang, Z., and Sun, Z., 2018. Cenozoictectonic subsidence in the Qiongdongnan Basin, northern South China Sea., 30: 269-288, DOI: 10.1111/bre. 12220.
Zhu, M., Graham, S., and Mchargue, T., 2009. The Red River Fault zone in the Yinggehai Basin, South China Sea., 476 (3-4): 397-417.
December 13, 2020;
March 3, 2021;
June 1, 2021
© Ocean University of China, Science Press and Springer-Verlag GmbH Germany 2022
#The two authors contributed equally to this work.
. E-mail: 21120411040@ouc.edu.cn
(Edited by Chen Wenwen)
杂志排行
Journal of Ocean University of China的其它文章
- Stress Analysis of Wire Strands by Mesoscale Mechanics
- Effect of Temperature on the Carbon, Nitrogen, and Phosphorus Nutrient Budgets of Steelhead Trout (Oncorhynchus mykiss) with Different Sizes
- Impact of Evaporation Duct on Electromagnetic Wave Propagation During a Typhoon
- A New α-Cyclopiazonic Acid Alkaloid Identified from the Weizhou Island Coral-Derived Fungus Aspergillus flavus GXIMD 02503
- Design of Copper Oxide Nanosheets-Loaded Zeolite with Efficient Inhibition of Marine Bacteria
- 3-D Marine CSEM Modeling in General Anisotropic Media by Using an Adaptive Finite Element Approach Based on the Vector-Scalar Potential