Variation of nutrient f luxes by rainfall redistribution processes in the forest canopy of an urban larch plantation in northeast China
2022-09-08HoucaiShengNaGuoCunyongJuTijiuCai
Houcai Sheng ·Na Guo ·Cunyong Ju ·Tijiu Cai
Abstract Atmospheric deposition (dry and wet deposition)is one of the primary sources of chemical inputs to terrestrial ecosystems and replenishes the nutrient pool in forest ecosystems.Precipitation often acts as a primary transporting agent and solvent; thus, nutrient cycles in forests are closely linked to hydrological processes.We collected precipitation data during a growing season to explore variations in nutrient cycling and nutrient balances in the rainfall redistribution process (wet deposition) in a larch plantation in northeast China.We measured nutrient ( NO-3 , PO3-4 , Cl - , K,Ca, Na, and Mg) inputs via bulk precipitation, throughfall and stemflow, and used a canopy budget model to estimate nutrient f luxes via canopy exchange.Our results suggest that the average concentrations of the base cation (K, Ca, Na,and Mg) showed the following order: stemflow > throughfall > bulk precipitation.Throughfall and stemflow chemistry dramatically f luctuated over the growing season when net f luxes (throughfall + stemflow–bulk precipitation) of NO-3 ,PO3-4 , SO2-4 , Cl - , K, Ca, Na, and Mg were - 6.676 kg·ha -1, - 1.094 kg·ha -1 , - 2.371 kg·ha -1 , 1.975 kg·ha -1 , 0.470 kg·ha -1 , - 5.202 kg·ha -1 , - 0.336 kg·ha -1 , and 1.397 kg·ha -1 ,respectively.These results suggest that NO-3 , PO3-4 , SO2-4 ,Ca, and Na were retained, while Cl - , K, and Mg were washed offby throughfall and stemflow.
Keywords Rainfall redistribution·Aqueous f luxes ·Water chemistry·Macronutrients input·Plantation forest ·Harbin
Introduction
In forest ecosystems, bulk precipitation acts as a transporter and solvent, and is an important source of nutrients(Lu et al.2017 ).When rain enters the forest canopy, it is redistributed into throughfall and stemflow, and some rain and nutrients reach the forest soils (Van Stan II et al.2012).Therefore, nutrient cycles in forest ecosystems are often closely related to hydrological processes (Su et al.2019).Throughfall and stemflow are important pathways for the migration of elements in the forest.The nutrient elements transported by throughfall and stemflow can be used by plants directly.Concentrations of some nutrients that are essential for plant growth (e.g.K+) are greater in throughfall and stemflow than in the inputs from litter decomposition (Rodrigo et al.2003; Hamdan and Schmidt 2012; Tan et al.2018).With the increasing intensity of global climate change, variation in precipitation regimes can profoundly alter forest hydrological processes (Allan and Soden 2008) and nutrient cycling (Su et al.2019).Therefore, understanding of the relationship between precipitation and nutrient cycling in forest ecosystem is highly important.
In nutrient cycles of forest ecosystems, dry–wet deposition f luxes and canopy exchange play important roles (Lu et al.2017).Before reaching the forest floor, the chemical composition of bulk precipitation can be strongly modified by vegetation.Many studies have showed that tree species can influence throughfall and stemflow chemistry (Hamdan and Schmidt 2012; Legout et al.2016; Liu et al.2019).The chemistry of throughfall and stemflow can be altered by leaching or absorbing the dissolved substances or particulate matter accumulated on leaves (Chuyong et al.2004;Hamdan and Schmidt 2012; Cortia et al.2019).In contrast,some of the dissolved substances (e.g.NH4+–N and NO-3–N)in throughfall and stemflow solutions can be absorbed by the forest canopy and tree bark (Zhang and Liang 2012; Su et al.2019).Furthermore, the interactions between rainfall and epiphytes affect the quantity and the chemical concentration of throughfall and stemflow (Van Stan II and Pypker 2015).Stemflow chemistry is also influenced by bark traits (e.g.thin or thick, grooved or smooth) and tree size(e.g.tree DBH and tree height) (Hofhansl et al.2012; Liu et al.2019).Understanding of nutrient exchange contributes to understanding of the functioning of forest ecosystems.Therefore, throughfall and stemflow are commonly measured and analyzed to quantify the f luxes of nutrients in the rainfall redistribution process.
Nutrient inputs from hydrological processes can impact forest soil properties and soil processes (Zhang et al.2016).Although some studies have shown that the forest canopy can efficiently filter trace metals, sulfur, and chlorine in rainfall deposits (Zhao et al.2017; Tan et al.2019), throughfall inputs can also contribute to nutrient concentrations in soils.By transferring nutrients accumulated on leaves, nutrient inputs via throughfall can exceed concentrations in bulk precipitation (Chuyong et al.2004; Zhang et al.2010; Lu et al.2015; Su et al.2019).Although stemflow accounts for a fraction of the volume of throughfall, stemflow can supply nutrients to the rhizosphere soil, which can be directly absorbed and utilized by vegetation (Liu et al.2019).However, most recent studies focused on how forest canopy affects the chemistry of throughfall, often ignoring the nutrient input of stemflow to the forest floor.Additionally, the forest study areas were typically distant from urban areas(Wu et al.2019).Given that urban areas have more complicated climate (urban heat island effect) and environmental conditions (serious air pollution), urban trees and forests can provide more ecosystem services than rural forests (Zhu et al.2019; Zabret and Raj 2019).Our current understanding of urban forest regulation of nutrient f luxes is limited by inadequate research.
Larix gmeliniis the main tree species of natural forests in northeast China.It is also one of the most important reforestation tree species in northeast China.Though larch plantations have single canopy layers rather than complex, multiple canopy layers as in natural forests,they have made important contributions to the ecological barrier of the northeast China forest region.However, it remains unclear whether larch plantations play the same role in redistribution of chemical nutrients as do natural forests in complex urban environments, since larch has not been planted as a dominant greening species.China has the largest area of plantation in the world.With increased research focus on larch plantations, there is a pressing need for better understanding of the chemical f lux in larch forest hydrological processes.In this study, we monitored bulk precipitation, throughfall, and stemflow in an urban larch plantation to quantify nutrient concentrations and transfer characteristics.The objectives of the study were:(1) to analyze and evaluate concentrations of eight nutrients in bulk precipitation, throughfall, and stemflow; (2)to compare and evaluate nutrient exchange characteristics of the larch plantation; and, (3) to observe the patterns in eight nutrient concentrations and f luxes from the deposited precipitation.
Material and methods
Site descriptions
This study was carried out during the growing season(May to October) of 2015 within an urban larch plantation in northeast China.Our study area was located in the urban area of Harbin (126°37′15″ E; 45°43′10″ N), on a portion of the 44 ha Northeast Forestry University campus in which a larch plantation covered about 5.5 ha.Average annual temperature on the study area was 3.5 °C.Average annual precipitation (1995 - 2014) was 512.2 mm, falling mainly from June to August as rain and accounting for 60% - 70% of total annual precipitation.Average annual surface water evaporation was 726 mm.
The larch plantation was planted in 1959 with two-year seedling cavernous colonization.After more than 50 years of tending and management, the forest canopy density was 0.80 and tree heights were (17.3 ± 1.2) m (mean ± s.d.)with (17.8 ± 0.8) cm diameter at breast height (DBH).Tree density was 1120 tree/ha.The understory species includedLonicera maackii(Rupr.) Maxim.,Rhamnus ussuriensisJ.Vass., and saplings ofFraxinus mandschuricaRupr.,Phellodendron amurenseRupr.,Ulmus pumilaLinn.et al.Understory height was 0.2 to 2.5 m with ground coverages of 5% - 35%.
Study design
We collected samples from every rainfall event in the growing season of 2015.Different rainfall events were divided according to the interval of more than 4 h.Bulk precipitation(P) was monitored using a tipping-bucket rain gauge (HOBO RG3-M, 0.2 mm per tip), which was installed on a roof platform located 200 m from the sampling site.We installed on the same platform three collectors (cross sectional area of 314.16 cm2per collector) to sample for chemical analysis.
To measure throughfall, we set up a 20 m × 20 m observation sample plot in the center of the larch plantation.Throughfall (Tf) was collected and measured using 13 collectors (same as above) across the plot.The gauges were crossed at the center of the plot, and the distance between any adjacent collectors was 2 m in the same direction.Throughfall collectors were set up not less 50 cm above the forest floor to avoid the influence of ground splash rainwater and were evenly distributed at fixed positions throughout the growing period.At the end of each rainfall event, the volume of rainwater in every gauge was measured and the samples were collected for chemical analysis.
Stemflow (Sf) was collected using a halved, spiral rubber collar (Sheng and Cai 2019).The bottom part of the rubber collar was kept intact, and the collected stemflow was funneled into a plastic jug near the base of a stem (Su et al.2019).Due to the similar diameter in breast high of trees in the plantation, 5 typical larches were selected for stemflow sampling.At the end of each rainfall event, we measured the volume of rainwater and collected samples for chemical analysis.
Chemical analysis
Water samples were collected in clean polyethylene bottles immediately after each rainfall event.Sample bottles were rapidly transported to the on-campus laboratory where they were filtered using qualitative filter paper and then divided into two parts.One sample was used to measure the concentrations of anions (i.e.,and Cl-) by ion chromatograph (Metrohm 883), and the other sample was adjusted to a pH of 1 - 2 with high-purity grade (GR) nitric acid for measuring the concentrations of metal elements(i.e., K, Ca, Na, and Mg) by atomic absorption spectrometry(Thermo Scientific ICE-3500).
Data analysis
Stand throughfall (mm) was calculated by the average value of the 13 throughfall collectors.Stand stemflow (mm) was estimated according to the stemflow of the sampled standard trees, the tree number and the area of the studied plot(Eq.
( 1) (Sheng and Cai 2019).
where,Sfis the stemflow volume (mm),Nis the total number of trees number in the plot,Sis the average value of stemflow from 5 standard trees (mL), andAis the area of the studied plot (m2).
Rainfall interception (I) was estimated using the wet-canopy water balance equation (Sheng et al.2019) as follows:

where,Pis the bulk precipitation (mm),Tfis the throughfall volume (mm),Sfis the stemflow volume (mm).
For each rainfall event, the volume-weighted mean E(VWME) of bulk precipitation, throughfall and stemflow were calculated according to Eq.( 3).The input of a given nutrient was estimated according to Eq.( 4), (Su et al.2019) for details.

where,VWMErepresents the mean concentration of a chemical element or compound (mg L-1),Ci,Erepresents the concentration at collectorifor eventE(mg L-1),Vi,Erepresents the bulk precipitation, throughfall, and stemflow amount at collectorifor eventE(mm).

where,Frepresents the input of a certain element or compound (kg ha-1) andVrepresents the total volume of bulk precipitation, throughfall, or stemflow (mm).
The total wet input is the sum of the solute in the throughfall and stemflow, and the difference between total wet input and bulk precipitation input is regarded as the canopy exchange effect.
The Duncan test was used to compare the nutrient concentrations among bulk precipitation, stemflow and throughfall (Sun et al.2021).All statistical analyses were performed using SPSS 18.0.
Results
Rainwater f luxes
Between 1 May and 31 October, there were 31 discrete rainfall events resulting in a total bulk precipitation of 430.2 mm.The volume of bulk precipitation during the growing season of 2015 was 3.5% lower than the annual average precipitation (445.9 mm) during the period of May to October, 1995-2014 (Fig.1).Bulk precipitation varied by month.Bulk precipitation in August was 159.4 mm, which was the highest monthly rainfall and accounted for 37.1% of the total bulk precipitation.In October, the bulk precipitation was 23.6 mm, which was the lowest monthly rainfall,accounting for 5.5% of the total bulk precipitation.
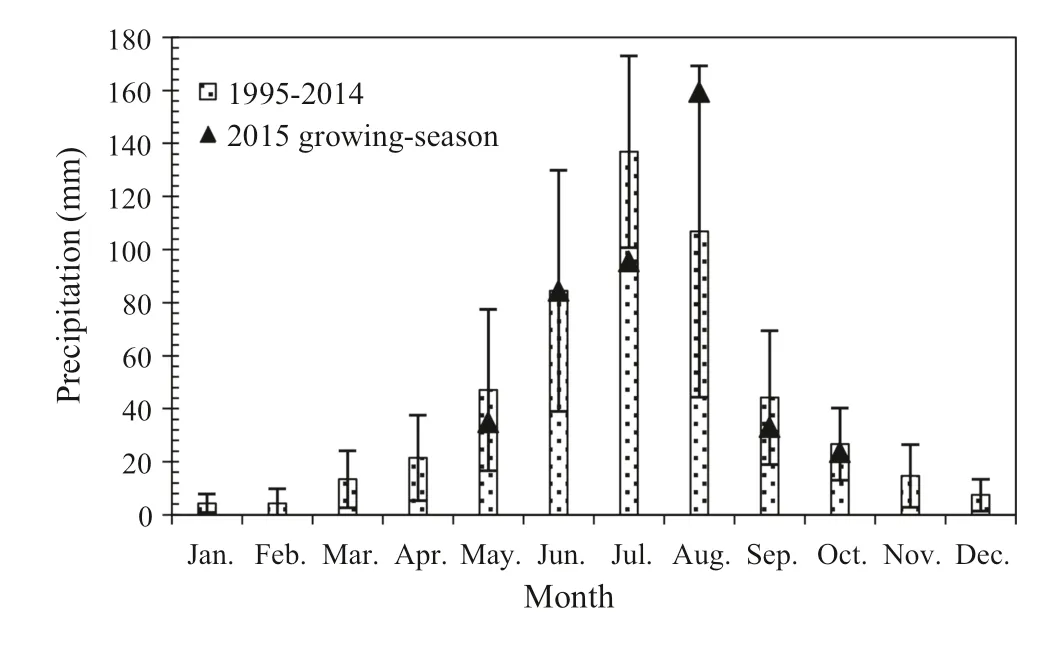
Fig.1 Monthly bulk precipitation
Throughfall and stemflow during each month are shown in Fig.2.Total throughfall and stemflow were 241.0 and 15.1 mm, accounting for 56.0% and 3.5% of total bulk precipitation, respectively.The interception loss was 174.1 mm,and the retention rate from canopy and stem was 40.5%.The linear regression relationship between throughfall and bulk precipitation was:
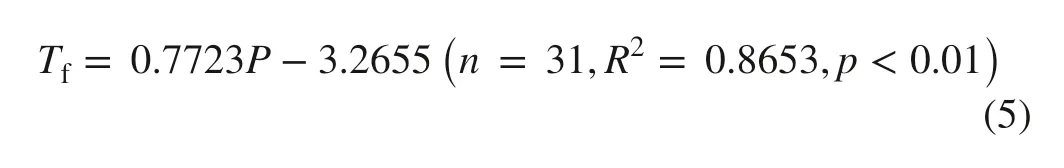
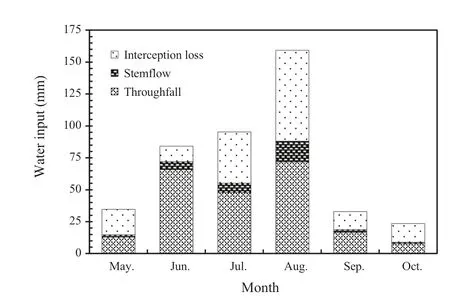
Fig.2 Monthly input of throughfall, stemflow and interception loss
where,Tfis the throughfall volume (mm),Pis the bulk precipitation (mm).The logarithmic relationship between stemflow and bulk precipitation was:
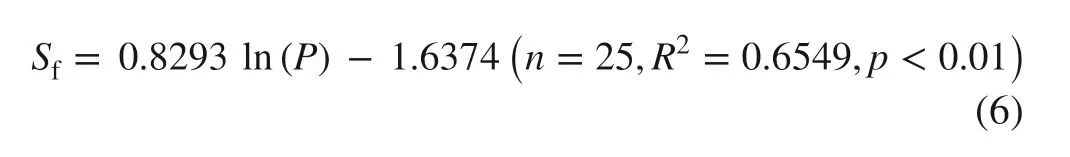
where,Sfis the stemflow volume (mm),Pis the bulk precipitation (mm).The coefficient of variation (CV) of the collected throughfall ranged from 9.7 to 54.6% with a mean of 28.8% during the study period.Throughfall was mainly influenced by rainfall amount and duration of rainfall event.
Chemistry of canopy water f luxes
The volume weighted mean concentration of all solutes in bulk precipitation, throughfall, and stemflow are shown in Table 1.The concentrations of 4 metal elements ranked in descending order as stemflow > throughfall > bulk precipitation, butandshowed the opposite trend (bulk precipitation > throughfall > stemflow).The concentrations ofand Cl-in stemflow were higher than in bulk precipitation, but both were lower than in throughfall.
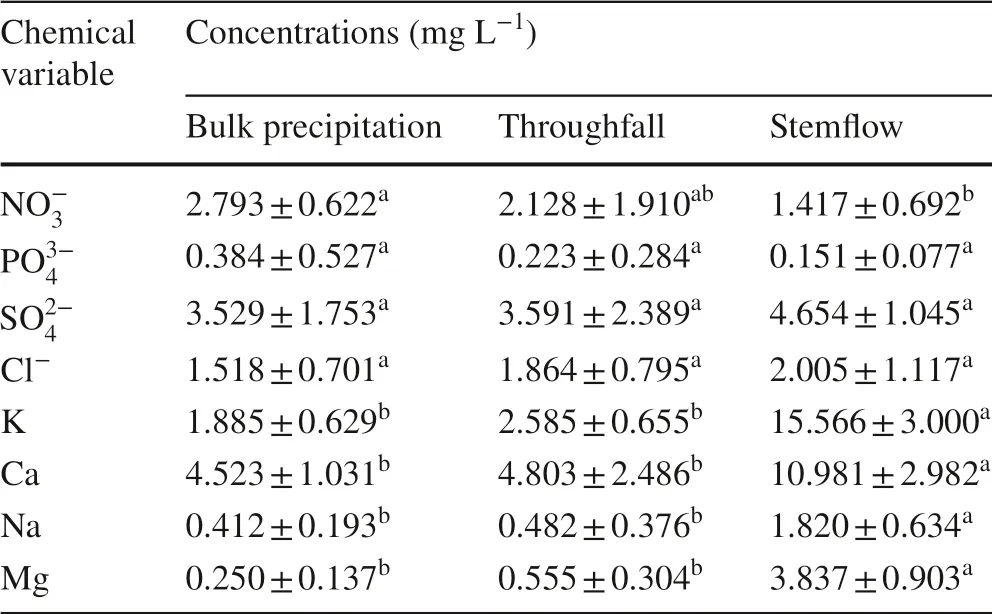
Table 1 Chemical characteristics in different types of water during the study period
Among all nutrients in bulk precipitation, the maximum and minimum concentrations were 4.508 mg·L-1(Ca) and 0.250 mg·L-1(Na), respectively, and the maximum was 18.03 times greater than the minimum.The concentrations of the solutes in bulk precipitation ranked in descending order as:
Temporal dynamics of water f luxes
The monthly volume weighted mean solute concentrations in the bulk precipitation, throughfall, and stemflow are shown in Fig.3.For bulk precipitation, the highest concentration of the 8 solutes was 6.821 mg·L-1(Ca), and the lowest value was 0 mg·L-1.The concentration ofwas low, and the concentrations ofin July and September were both 0 mg·L-1.The highest concentration ofwas recorded in June,, and Ca in October,and Cl-, K, Na, and Mg in September.The lowest concentrations of Mg, Cl-, K,, and Ca were recorded in May, and onlywas recorded in October.Among the concentrations of the other 7 solutes, Na showed the highest CV (149.3%), while Ca showed the lowest CV (26.5%).The CVs of these 7 solutes ranked in descending order as:K > Ca.

Fig.3 Monthly variation in chemical content of different types of water.(Only 2 rainfall events occurred in October)
For stemflow, the maximum and minimum concentrations were 20.553 mg·L-1(Ca) and 0.093 mg·L-1,respectively, and the maximum was 221 times greater than the minimum.Among the concentrations of 8 solutes,had the highest CV (160.9%), while K had the lowest CV(42.5%).The CVs of these 8 solutes ranked in descending order as:Mg > K.
Nutrient input
We recorded large variation in nutrient input within the larch plantation.Nutrient inputs by bulk precipitation, throughfall,and stemflow, and total input and canopy exchange effect are shown in Table 2.The greatest nutrient input via bulk precipitation and throughfall was Ca, while K was the greatest input for stemflow.In bulk precipitation, the total input of 8 solutes was 65.795 kg·ha-1, of which the inputs of Ca,, andwere higher than the others, accounting for 29.6%, 23.1%, and 18.3%, respectively.
The total wet input of 8 solutes during the study period was 53.958 kg·ha-1, and these ranked in descending order as:Mg > Na >(Table 2).Canopy exchange effect of 8 solute f luxes indicated slight differences in total wet input.The canopy exchange effect of 8 solutes f luxes was - 11.837 kg·ha-1and canopy exchange effect ranked in descending order as: Cl-> Mg > K > Na >During the interaction of rainfall with the arborous layer, only Cl-, K, and Mg leached from trees, indicating that these nutrients in bulk precipitation were increased after passing through canopies and stems.Na,, Ca, andwere absorbed by the canopy,and the absorbed quantities were 0.336, 1.094, 2.371, 5.202,and 6.676 kg ha-1, respectively.
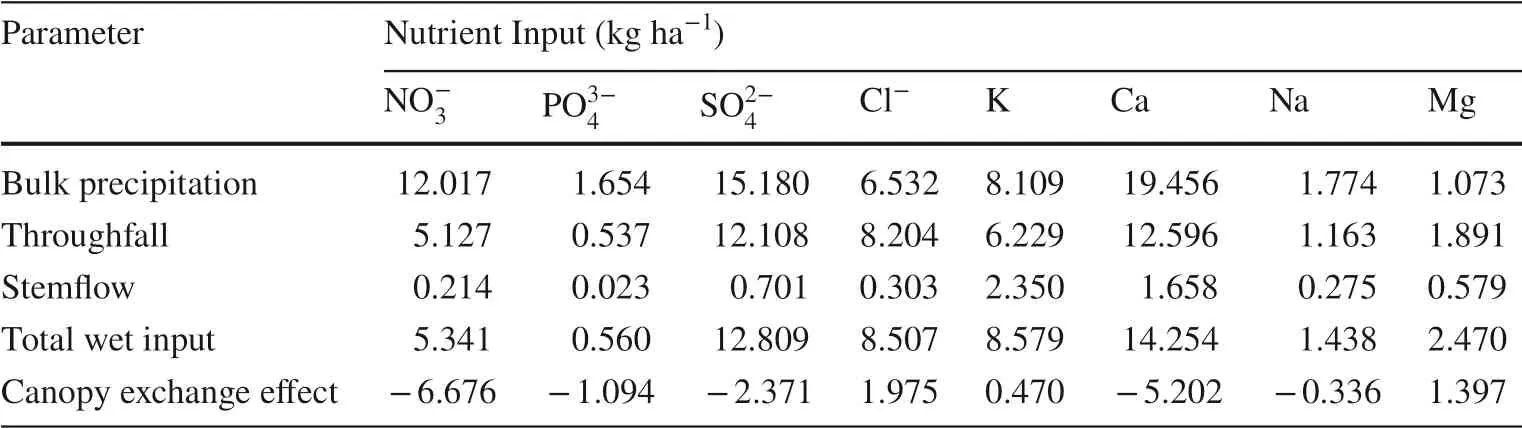
Table 2 Macronutrient f luxes by type of water and total wet input, and canopy exchange effect
Discussion
Effects of forest on nutrient concentrations in bulk precipitation
In a forest canopy, interactions between bulk precipitation and the canopy lead to rainfall redistribution and solute exchange, which results in changes in nutrient concentrations (Su et al.2019).By flowing over the vegetation surface,particles and excreta on plant organs dissolve into rainwater,thus changing the chemical composition of throughfall.The rough surface of tree bark adsorbs a large amount of dry deposition, and the longer residence time of rainfall on bark yields higher nutrient concentrations in stemflow (Levia and Herwitz 2000).Generally, forest canopy can concentrate the nutrients in bulk precipitation, leading to a descending rank order of mean concentration as: stemflow > throughfall > bulk precipitation (Tan et al.2018).But we recorded different outcomes at our study site.For example, in our results, Cl-, Na, K, Ca, and Mg showed small increases in throughfall nutrient concentrations compared to those in bulk precipitation.Increases in stemflow were similar.However,andconcentrations showed the opposite trend.These results are not completely consistent with those of previous studies (Rodrigo et al.2003; Lu et al.2017;Dawoe et al.2018; Su et al.2019).
In this study, concentrations ofandin bulk precipitation were higher than those in throughfall and stemflow.This is because the leaves and the cracked bark had absorbed a large amount of the nutrients dissolved in rainwater.This effect was even greater than that leaching from plant organics.The concentrations of nutrients in bulk precipitation were probably also affected by the atmospheric environmental, forest canopy characteristics, and rainfall properties (Rodrigo et al.2003; Tan et al.2019; Zhang et al.2019).Moreover, the results of the impact can vary by year (Zhang and Liang 2012).Urban atmospheres can contain large amounts of pollutants and particulate matter that provide greater volumes of nutrients in bulk precipitation (Rodrigo et al.2003).The results in our study could be caused by the special urban environment where the forest is located.The factors affecting the changes in concentrations ofandduring the forest hydrological process are more complicated, and further research is needed.
In addition, the extent of nutrient concentration enrichment is also affected by the solute characteristics.For example, the concentration of K was greater than that of Ca in throughfall and stemflow.Both K and Ca are essential nutrients for plant growth, but K is more active than Ca.Although, the content of K in bulk precipitation (1.885 ± 0.629 mg L-1) was lower than that of Ca(4.523 ± 1.031 mg L-1), the content of K in throughfall changed to a greater extent than did that of Ca.Dovey et al.( 2011) and Lu et al.( 2017) reported that K has high leachability than Ca under the tree canopy.
Limited enhancement of throughfall nutrient concentrations compared to those in bulk precipitation were probably caused by high levels of particulate matter (PM) in the urban atmosphere.Urban forests have proven to be efficient PM collectors and to improve air quality (Xu et al.2019).PM has strong adsorption capacity and elements such as Ca, Mg,and K are mainly found in particles with large diameters.Therefore, throughfall and stemflow contain high levels of particulate matter.But when these sources are filtered to measure the concentrations ofions, particles of large diameter will be intercepted by the filter paper, thus reducing the ion concentration in the water.We recorded seasonal variation in the chemistry of bulk precipitation and throughfall, but limited change in stemflow chemistry.Most of the nutrient concentrations in throughfall were very low at the beginning of the growing season,but increased over time.This is because the pre-senescent leaves were able to absorb a large amount of the nutrients dissolved in rainwater.However, bark undergoes no obvious physiological and trait changes by season.The interaction of rainwater with large areas of bark leads to a decrease in the volume of rainwater and the dissolution of more nutrients.Therefore, nutrient concentrations in throughfall showed a dramatic rise toward the end of the growing season, but showed limited change in stemflow across seasons.
Effect of forest type on nutrient input
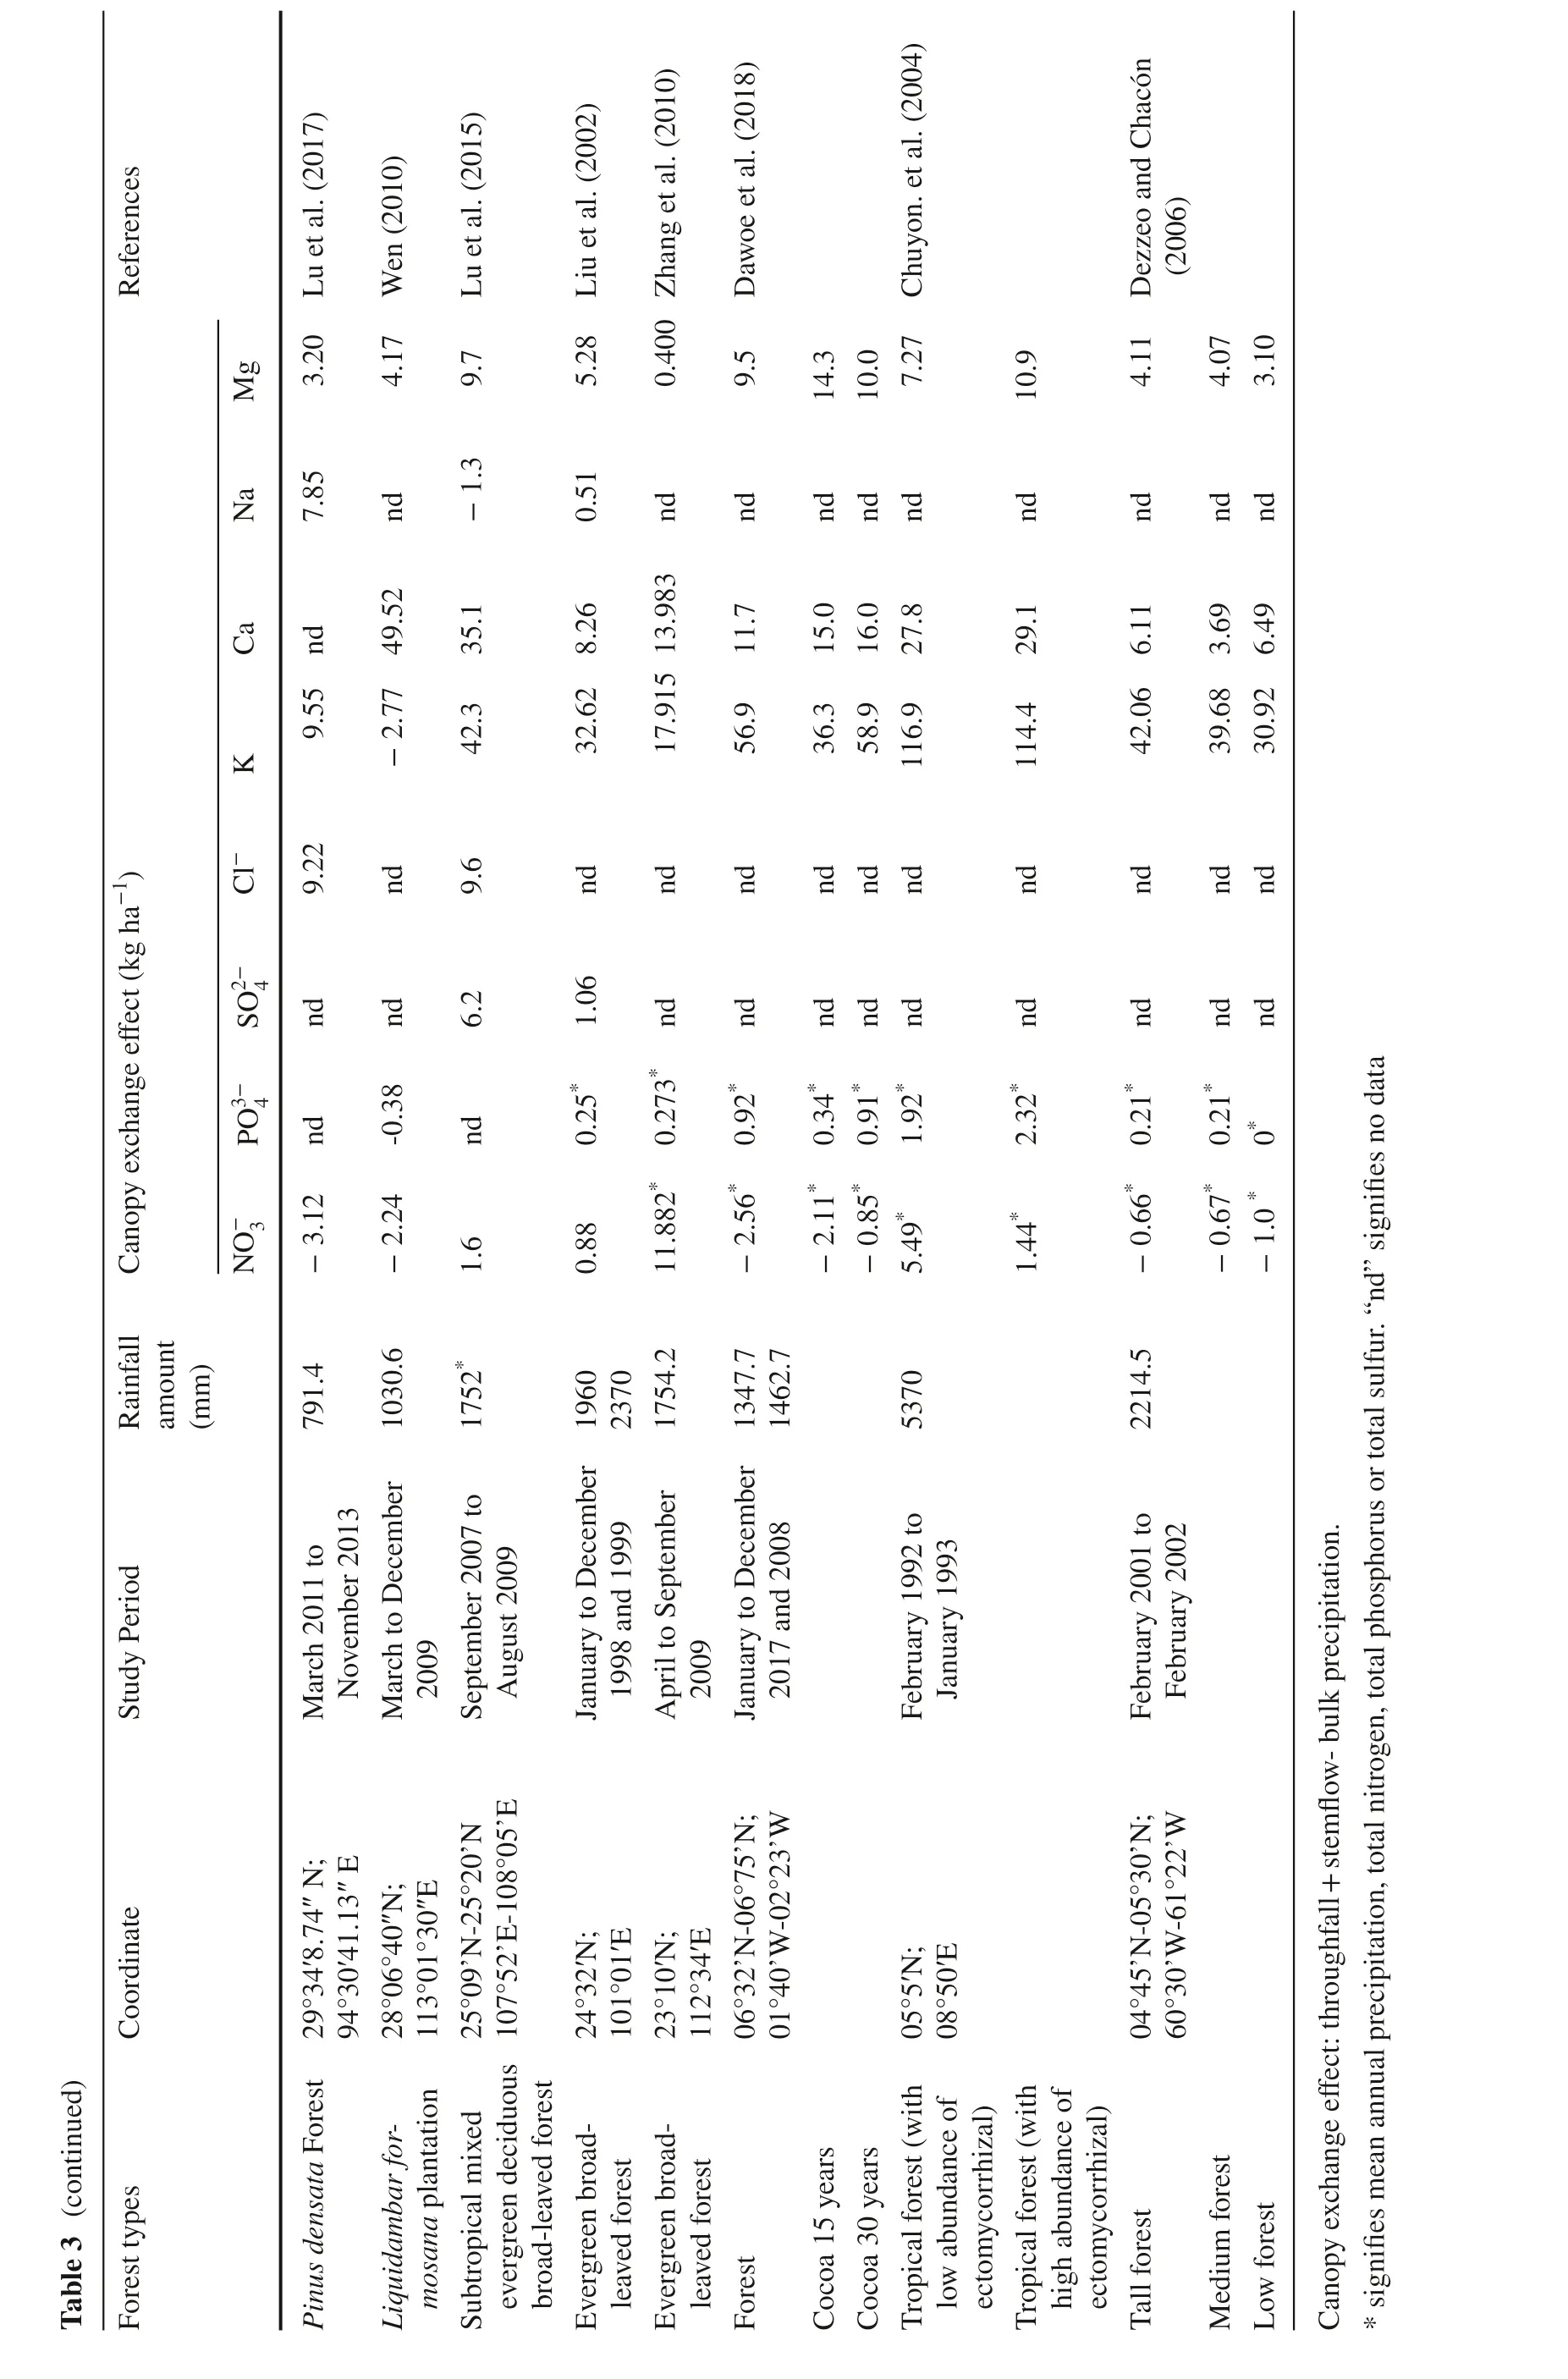
Bulk precipitation is a significant source of nutrient input to the forest ecosystem.The nutrients input by bulk precipitation can affect the nutrient cycling of forest ecosystems,including the growth and succession of forest communities(Lu et al.2017; Dawoe et al.2018; Su et al.2019).We surveyed 17 papers that assessed 22 different plant species on 16 sites around the world (Table 3).The research was mainly concentrated in China (12 papers).These studies focused more on f luxes in total nitrogen, total phosphorus,K, Ca, and Mg, but less on f luxes of, Cl-, and Na.In general, the canopy exchange effect on nitrogen was negative (absorbed by the forest canopy and stems), and the canopy exchange effect on K, Ca, and Mg were positive(leaching from the forest canopy and stems).

5)3))),09 0 1 1 9 00 6)5))(2 0 0 0 0)(2 20.04(2 2 0(2(1 9).a l e s ..a l 2 0 1 5(y .20(n c .e t a l u d a l a l(.e t a l o .a l re 20 e t e t e t a l(g s t i ig fe e t e t en u.is r t d r n g n g e t n R e L i Wu S h T h C o R o W a G o S u X i 097 0 5 80 9 2 0 6 0.25 72 2.2.3 9 Mg 3 3 1..0.759 1.85 1.70 2.06 2.51 67 32 0.1 41.0.15 1 2 9.0.336 4 3 1 1 6 1 6 7 2 6 3 4 3 3 0.0.0.6 2 9.9 7 3.1 4 7 0 6 6 6.1 0 0.N a 0.---1 0 1 3 0.1.-n d n d n d0 3 0.0.2 52.0 2 5 02 2.4 1.9.2 8 10 5 77 2 0 5.8 5.0 8 2.7 1 4 6 1 6.2 3 9 5.0 1 8.3 3 C a 7.6 2 1 1---2 9-3 7 3.7.16 1.0.3 9 1 10---6 3 3 5 5 8 3 0 7.64 7 1 18 6..5 8 2.3.6.8 2 20..2 7..9.3.9 6 8 2 2.35 6 6 8 2 5 2 8 1 0 4 1 1 11 4 7 1 0.2 63.K 8 0 9 695 09 6 9 5 0 4.1 5.1-1.C l 1 7 67)1.06 03 51-1 1.1.72 9 7 1.1 9-0.2 4 5.7.n d n d n d 0.n d48-h a g 21 2 *8 *8 *7 2(k 02 84 3 3 7 5 3 6 3.4.8.3 8.t 2-4.7.0 e c 89 02 200.2.08 82 1 0 2 3 2 8 17 5 5 effSO 0.4.0.--4 5 5 4 1.3.n d 2.-g e *4---an 3 3-4 0 8 09**1 7*ch PO n d 1 9 6 4 3 1 1.6 30.6 6 1.n d -nd nd4 0 0.0.nd 0.0.nd -0.8 *ex py 53 7 546 1 6 4 nd 2**.0 05 35 NO-3 n o 64 0.6 80 4.4.*6 7 6.76 2..2 1.25 57 661 2.22 10 1.1 4 C a 1.0.1 1-0.-----0.4.-----l l*fa*un .0.1 in 21 2 t (mm)2 amo R a 9.3.0.5 0 *5 *5.7 4 3 4 90 43 43 64 50 80 13 11 1 5 e r p e 2 0 u- ary 2005 1 4 ty 04 20 emb e r b r emb r F e 25 2 0 b e r s t r Ma to01 o d re to 83 b e to b e fo p t to 04 9 5 to 9 6 to to 0 02 0 S e r i e r P e S e by O c O c 2 0 2 0 1 9 1 9 to 0 2 to O c to mb to to y y e c t 1 3 h l p t l 20 0 5 ce a r u d y y 20 rc n e r i n e r i y y effA p20 S t Ju Ju Ma y 2003 A p Ma Ma nu Ma Ma D e Ja g e ch an N;3 8″E 47″ex 5′E E 4′;py 0’N;°2°° N°1°1 N;E 7’E 1 3 4 5 n o 2’°0 5’0 4°5°4 4 7 502.c a E 3.1 2-4 6″-N;E te N;3 3-1 N;2 9 1 5″n a 9 4–5 o f 0 8″;6 1 5″5 5′’E 1 0″2 7″4 2″d i 4 8′°–N-2 3″N-E-e s o r 8°8°107′3′3 7′6′N 3′3′N 4′N 2 8′E 9’8′6°2 8′21′E 5’23′E 5’6°.2 f l ux 5 5°0 2.C o °4°3 8°12°4°4°5°4°1°3 3°°2 11 12 47 0°12 43 5 3 41 12 2°2°10 41 3 2 31 39 11 29 94 r i t en s t ed te 45(A)(B s i u t a n re s t fo on s t m i av s t ed s (sheltered site)n o r re c r))o n re le ti re ti s t e e fo fo re o s Ma dn e e f ta s t i ta s t s fo o a s t p i x p kk p e fo s t h i k fo re s ts(e rean la re e r k it o a o n ty re bu b r fop l a n re o a an o a fo 3 ev fo o a ta s t fo p l ey sm d e re s re h d b l hhh c e s t s K o lm rc re rc rk rc xe ey rk lm h fo ie rc rc Ta F o L a M i B i L a B i Tu Tu H o H o s forest nu Pi B i rruxe F i d deciduous broad- leaved forest g r S p M i A b
0)8)4)00 có 7)))02 0 1 0 1(2.15(2 h a 0 1(2 0).2 0 a l.e s(2 2 0 a l d C((a l e t n c ...a l 0 1 e t e t.an)re a l(2 a l g e o n eo e t e t e t an w o u y n (0 6 fe n u z z 2 0 R e L u W e L u L i Z h D a C h D e 0 Mg 4.20 3.17 7 9.28 5.40 0.5 9..3.027.9 11 4.07 10 4.1 4 1 07.1 0 8 5 1.3.3 5 1 N a 7.n d -0.n d n d n d n d n d n d n d n d n d.9 2 C a .1 2 6.5.7.0 8 3.0.8.1 1 1 6 9 4 9 n d 3 5 8.4 9 1 3 1 1 1 5 1 6 2 7 2 9 6.3.6.6 82 5 5 2 1 5 7 7 2..6 9..3.9.9.3.99 4 4..0.6.9 3 2 4 2-1 7 3 6 1 1 5 6 4 2 1 1 5 86.3 9 3 0-K)22 6 C l-1 9.n d 9.n d n d n d n d n d n d n d n d n d n d h a g(k t 2-4 e c 2 06 effSO n d n d 6.1.n d n d n d n d n d n d n d n d n d g e *ta an 3-4 8*3*******d a ch PO 9 2-0.3 nd 0.3 4 0.2 7 2 5 0.0.9 2 3 2 nd 1.9 1 2 1 2 1*0.2.0.0.0 n o ex py ****i es*12**if n o NO-3 24 8 2*56*11 2.3.85 66 88 67 0.8 gn C a 6 2.2.0.49 44 0.0.1.s i--1.0.1 1 5.---1.---d”“n.l l fa.6 un u r 4.2*.7.7.5 l fin 1.3 0 5 2 6 0 7 0 5 4 4 7 6 2 7 0 1 4 su l t (mm)amo R a 79 10 17 19 23 17 13 14 53 22 ta to e r e r e r o r 1 3 to e r mb mb mb 9 9 to to n.u s 2 0 0 7 to ce emb c e 0 8 io 1 9 o r c e o d D e 9 29 3 p t e r 0 10 2 2 0 1 1 1 91 9 2 009 2 0 2 0 ph a t 2 0 r i mb i t D e o s S e P e 2 0 D e to e r s t an tod tod an ryy ry y a r ip u a ph hve y l gu ec to a r 0 9 rc ry y h rc a r emb 9 8 0 9 u a u a N o u d 20p t r i l 1 7 nu b r b r nu ta 19 b r nu p r S t 20 Ma S e Ja A u F e lk to,A p20 Ja Ma Ja F e F e b u en l ow o g tr E-n i N;5’N W W N;emf l ta N;E °0 0’3’2’s t 5’°2 to 0’3″°2 0 8 E°2 0 60 2 0″N;l +°7°3 n,te 2 5-1 0 56 1 a l io n a .1 7 4″°3’E ;;;h f a t d i 8.N-6°4 14 0″4′W-0′0 1 N-N-9’2′N it 5 2 0′N o r 2’0’0′E 0 1′E 5’0’°5′N ug°3 W-°0°0°3°3 3°°1 3 4′E°3 ro 1°ip°4 2°C o °5 7°°4°3 24 94 28 11 10 25 23 11 10 01 05 08 0 6 04 60 th e c pr)t:s t ed i t n o u n u e dd u h high abundance of ectomycorrhizal)re eff(w r- mosana plantat F o 2 9 io ix nu ti d- leaved forest(w e ca l ss fo gean an on a r a c i d- leaved forest d e a r s t a r s t an re o a s t(c re p e n l m re c a ch s a t o a n s me n b r y e amb y e fo e e fo n s t fo s t ty e e ex e e 3 1 5 3 0 a l d e a l p i re b r re i e s id if ro e um s t g r fo e r s p y g r b l g r ic s t ic aa fo n u re e r q u re co b t ev co o p d i e r l l n og n F o Ta w o p s broad-leaved forest P i L i S u E v E v F o C o h low abundance of ectomycorrhizal)i t C o T r T r T a Me L o C a s i*
Based on the 15 papers surveyed and organized along the line of latitude gradient, we found that the canopy exchange effect of different elements and compounds varied in different forest types (Table 3 ).K was reported to yield a greater contribution to the total wet inputs on the forest floor.In contrast, the limiting nutrient of nitrogen is usually removed from rainwater as it passes through the canopy and bark.In our study, the canopy and bark had strong nitrogen absorption ability (Canopy exchange effect was - 6.676 kg ha-1).In contrast, the canopy exchange effect of K in our study appeared to be lower than at other sites, suggesting that the canopy and bark had weak leaching ability (canopy exchange effect was 0.470 kg ha-1).Even so, our findings support those of previous studies.However, the canopy exchange effects of PO3-4and Ca in our study were negative, only corroborating results for Spruce forest (Gong et al.2005), but differing from the results reported for other forest types (Table 3).Many factors affect the canopy exchange effect of different nutrients.These include rainfall properties (amount and intensity), forest canopy structure, and plant morphological attributes.However, it is not clear which factors regulate the canopy exchange effect.Our study suggests that air pollution levels at the study site may be a factor influencing forest nutrient input.
Conclusions
The forest canopy and tree stems can be regarded as a selfregulating system that filters or leaches nutrient solutes in rainfall.We present new information on nutrient solutes in bulk precipitation and their interactions with forest cover in a larch plantation.The net input f lux (canopy exchange effect) of 8 solutes was - 11.837 kg·ha-1.Forest canopy and stems significantly influenced nutrient inputs.Some f luxes were not increased and some decreasedNa, and Ca), whereas others considerably increased (Cl-,K, and Mg).Our data indicate that rainfall (wet deposition)played an important role in nutrient supply (especially NO-3and Ca) to a larch plantation.These results provide new insight into the nutrient cycles and rainfall redistribution processes of a larch plantation, and they can inform efforts to explore forest water conservation functions.
AcknowledgementsWe gratefully acknowledge the Heilongjiang Mohe Forest Ecosystem National Observation and Research Station for its assistance in hydrochemical analysis of samples.The authors also gratefully acknowledge Liangliang Duan of Northeast Forestry University for his assistance with English language and grammatical editing of the manuscript.
杂志排行

Journal of Forestry Research的其它文章
- Journal of Forestry Research
- Reversibly photochromic wood constructed by depositing microencapsulated/polydimethylsiloxane composite coating
- Surveillance of pine wilt disease by high resolution satellite
- Adaptation of pine wood nematode, Bursap helenchus xylophilus,early in its interaction with two P inus species that differ in resistance
- Pine wilt disease detection in high-resolution UAV images using object-oriented classification
- Transcriptome analysis shows nicotinamide seed treatment alters expression of genes involved in defense and epigenetic processes in roots of seedlings of Picea abies