Increased salinity and groundwater levels lead to degradation of the Robinia pseudoacacia forest in the Yellow River Delta
2022-09-08ChaoxiaLuChenZhaoJingLiuKailunLiBaoshanWangMinChen
Chaoxia Lu ·Chen Zhao·Jing Liu·Kailun Li ·Baoshan Wang·Min Chen
Abstract Forest degradation is a worldwide problem,although its causes vary due to geographical and climatic differences and man-made causes.In recent years, the Robinia pseudoacacia forest in the Yellow River Delta has suffered severe degradation.The causative mechanisms were investigated in the field over two years, and the results show that increased forest degradation was ref lected by increased tree mortality, high leaf and soil sodium salt levels and groundwater depth.Average tree diameters decreased, and leaf chlorophyll and soil microbial contents decreased.Redundancy discriminate analysis (RDA) showed that degradation of the forest was correlated positively with soil salt content, but negatively with groundwater depth.Correlation analysis showed that 0.79%–0.95% soil salt content and above 1.20 m groundwater depth caused the death of R.pseudoacacia trees due to localized anthropogenic economic activities, such as rice farming, that disrupted the original water–salt balance.Measures are recommended to prevent further degradation and restore degraded forests.Keywords Forest degradation·Groundwater depth ·Robinia pseudoacacia forest·Soil salt content·The Yellow River Delta
Introduction
Forests plays important roles in improving the environment,providing resources for humans, regulating the circulation of air and water in nature, affecting climate change, protecting soils from wind and rain, and reducing the harm caused by environmental pollution (Führer 2000; Lasch et al.2002).However, forest degradation is worldwide (Zhang et al.2010;Mitchard et al.2011 ; Evans 2017) and is an important issue in the global carbon cycle and climate change (Führer 2000;Lasch et al.2002).The main causes of forest degradation include the effects of human economic activities such as illegal logging and building construction, as well as changes in the natural environment, such as soil erosion and global warming (Curran et al.2004; Sheil et al.2009; Matricardi et al.2020; Yu et al.2020).Given the vital importance of forests to human life, taking steps to avoid forest degradation and to restore degraded forests is a crucial challenge.Because of the variety of environments in which forests occur, the causes of their degradation vary widely and appropriate mitigation methods may be different.Among causes of forest degradation, the abundance or scarcity of water and salt are important factors.Doyle et al.( 2010) showed that climate variability and sea level rise resulting in increasing tidal inundation and saltwater intrusion were the main causes of tidal forest degradation in coastal regions of the southeastern United States and the Gulf and south Atlantic coasts.The degree of tidal forest degradation depends on the sensitivity of forest species to saltwater (Krauss et al.2009).In contrast, tidal saltwater forests (i.e., mangroves) are expected to expand with rising sea levels (Saintilan and Wilton 2001; Rogers et al.2005).For inland forest decline (e.g., western white pine in California and silver fir in the Vosges Mountains in France), drought has always been a major cause (Becker et al.1989; Auclair et al.1990).In northwestern China, drought and high soil salinity are the causes of forest degradation (Samuel et al.2011; Lian 2020).It is important to determine the primary causes of forest degradation so that measures might be taken to prevent further degradation and restore degraded forests.
2Shandong Provincial Key Laboratory of Crop Genetic Improvement, Ecology and Physiology, Shandong Academy of Agricultural Sciences, Ji’nan 250100,People’s Republic of China
The Yellow River Delta (YRD) is relatively new land formed from the abundant sediment deposited by the Yellow River into the Bohai Bay (Xia et al.2010; Duan et al.2018; Qi et al.2018; Zhu et al.2019).In order to improve the ecology and local natural environment, 10,000 ha ofRobinia pseudoacaciaL.(black locust) plantations were established from 1959 to 1960 and is now the largest plantedR.pseudoacaciaforest in Asia (Zhang et al.2009; Xia et al.2010;Liu et al.2011; Wang et al.2015).In the decades since its formation, theR.pseudoacaciaforest has greatly promoted the local economy (Xia et al.2010; Peng et al.2014).However,in recent years, the forest has undergone increasingly severe degradation, with numerous trees dying in their crowns or in their entirety (Fig.S1) (Xia et al.2010; Liu et al.2011; Wang et al.2015).If the cause of degradation is not determined and restoration implemented in a timely fashion, the forest will disappear completely.
Robinia pseudoacaciais endemic to a few small areas in the United States (Barrett et al.1990).Because ofits rapid growth,drought tolerance and nitrogen fixation properties (Wei et al.2009), the species thrives in both temperate and semiarid regions and has become one of the most widely cultivated tree species worldwide.However, it is often reported to be invasive and difficult to eradicate (Krizsik and Kormoczi 2000;Motta et al.2009).But in the last two decades, the degradation ofR.pseudoacaciaforests have been reported and without a consensus on the cause or causes.Snyder et al.( 2007) and Blujdea et al.( 2011) suggested thatR.pseudoacaciaforest degradation in southwest of Romania is caused by anthropogenic disturbances, such as repeatedly cut and continuous browsed by grazing animals (Unruh Snyder et al.2007; Blujdea et al.,2011).Berthold et al.( 2009) suggested that the reduction in growth ofR.pseudoacaciain Hungary was due to pathogens rather than to chemical changes or acidification of the soil.On the Loess Plateau,R.pseudoacaciaforest degradation has appeared, manifested as being oflow ecological benefit,dry shoots, sparse undergrowth because of water shortages,nutritional deficiencies, density restricted conditions and site mismatches (Xu et al.2019).The YRDR.pseudoacaciaplantation forest has experienced increasingly severe degradation,however, the degradation mechanism is unknown.To determine the reasons for the degradation, an afforestation model,forest component allocation, canopy health, water–salt dynamics, and soil physical and chemical properties of plantedR.pseudoacaciahave been done (Bespalov and Os’kina 2006;Hofmann et al.2009; Xia et al.2010; Mao et al.2016).But the studies only investigated soil properties or forest degradation separately, and there were no detailed investigation forest degradation characteristics nor correlation analysis of forest degradation and soil characteristics, so the conclusions are one-sided and unconvincing.In this study, forest degradation characteristics, soil conditions (including salt content, groundwater levels, and microbial status), the correlation between forest degradation characteristics and soil conditions and the effects of farming patterns around the forest on soil conditions are investigated.A comprehensive view of the degradation of theR.pseudoacaciaforest in the YRD will supply a reliable scientific basis for local ecological management and sustainable development in the future.
The main objectives of this study were: (1) to obtainR.pseudoacaciaforest degradation data and soil conditions data and their correlation analysis results; (2) to elucidate the degradation mechanism of theR.pseudoacaciaforest in the YRD; and, (3) to recommend remedial measures to local authorities.
Materials and methods
Study site
The study site was located in the YRD (118°15′–119°19′ E,37°24′–38°10′ N, Kenli District, Dongying City, Shandong Province).The YRD has a warm temperate, continental monsoon climate and there are four distinct seasons.Spring and autumn are dry and windy while summers are hot and rainy, and sometimes typhoons occur.Soils in the YRD are high in salt and poor in nutrients.
Rainfall, evaporation and temperature data for theR.pseudoacaciaforest area were provided by the Dongying City Meteorological Bureau for 2017 and 2018 (Fig.S2).Evaporation is high most of the year except in winter.There is little rainfall in spring and autumn, and considerable rainfall in summer (in July and August).On August 18–19, 2018,Typhoon Rumbia led to f looding at the experimental site.R.pseudoacaciagrowth period is from April to October.
TheR.pseudoacaciaforest was created from 1959 to 1960 through planting.The average age is 60 years and average height 15 m.Different degrees of degradation have occurred in recent years such as crown dieback, windthrow and death.
Determination of the degradation level of R.pseudoacacia
This was graded according to the range of dieback length.The following scale was used: CK (control, no dieback); ID(level I degradation, the dieback length was 2–4 m); IID,the dieback length was 5–7 m; IIID, the dieback length was 8–10 m; and IVD, all trees were dead (Fig.S1).
The ranges of dieback length for the different levels were determined with a laser altimeter (XR850, Beijing Xinrui Zhicheng Photoelectric Technology Co., Ltd., Beijing,China) in the middle of each month from May to September 2017 and in 2018.
Determination of collar and breast-height diameters,mortality and falling rates, plant species distribution and quantity, and collecting leaves and soil samples
For each degradation level, five 100 m × 100 m areas were selected by the five-point sampling method and 50 trees selected to determine degradation indicators in the middle of each month from April to October 2017 and 2018.
The total number of trees (a), number of dead trees (b)and the number of fallen trees (c) were counted for each degradation level.The mortality rate (A) and fallen rate (B)were calculated using the following formulas:
Collar and breast-height diameters were measured with a millimeter-scale ruler for each degradation level.
ForR.pseudoacacialeafion content and chlorophyll content, mature leaves from the same leaf position (third branch position from the lowest branch) were collected for each degradation level.
For depth from surface to the water table, soil salt content, pH and soil microorganisms, soil samples were from the surface using a spade, and the depth from the surface to the level of the groundwater was measured for each degradation level.Samples were collected for measuring salt content, pH and microorganisms.For each degradation level, 100 m × 100 m areas were selected with the five-point sampling method, and the species and numbers of plants were counted in the middle of each month from May to September 2017 and 2018.Five replicates (five 100 m × 100 m areas) per treatment were carried out.
Determination of leafion and chlorophyll contents, soil salt content, pH, and soil microorganisms
Leaves were washed twice with deionized water and surface water drained off.A 0.3 g sample of leaves was weighed,placed into a test tube, 10 mL of deionized water added,and the test tube sealed with parafilm.The test tubes were placed in a boiling water bath for two hours and then cooled to room temperature.The solution in each tube was filtered and the filtrate diluted to 25 mL with deionized water and used to measure the sodium ion (Na+) content using a f lame photometer (410 Flame Photometer, Sherwood Scientific,UK).The chlorine ion (Cl-) content was measured using an ion chromatograph (Dionex ICS-1100, Thermo Fisher Scientific Inc, Waltham, Delaware, USA).Five replicates(five 100 m × 100 m areas) per treatment were made for each degradation level in the middle of each month from April to October 2017 and 2018.
Samples of 0.5 g leaves were weighed and then ground completely in 10 mL 80% acetone.The solution was filtered and diluted to 25 mL with 80% acetone (Qiu et al.2018).The absorbance of the chlorophyll solution was determined at 663 (A663) and 645 nm (A645) using a TU-1810 UV–visible spectrophotometer (Puxi Biological Technology Co., Beijing, China).Total chlorophyll (C t, mg L-1) was calculated using the formula below according to Arnon ( 1949).Five repetitions (five 100 m × 100 m areas and 50 trees were sampled in each area with the five-point sampling method) per treatment were carried out for each degradation level in the middle of each month from April to October 2017 and 2018.

Soil electrical conductivity (EC, dS m-1) at different soil depths (0.5, 0.5–1.0, and 1.0–1.5 m) at different degradation levels was determined with a WET-2 sensor (Delta-T,Cambridge, UK) in the middle of each month from May to September.The EC values were converted into percent salt content (SC) using the below formula:
Five repetitions (five 100 m × 100 m areas) per treatment were carried out for each degradation level in the middle of each month from April to October 2017 and 2018.
A 100 g soil sample from different soil depths (0.5,0.5–1.0, and 1.0–1.5 m) were extracted with 500 mL of 0.01 mol L-1CaCl2solution.After thorough stirring, they were equilibrated for 30 min and then measured with a pH meter (PHS-3E, Shanghai Instrument and Electric Instrument Co., Ltd.).[Five repetitions (five 100 m × 100 m areas)per treatment were carried out for each degradation level in the middle of each month from April to October 2017 and 2018.]
The numbers of culturable soil microorganisms were determined according to Qi et al.( 2018).Populations and species of microorganisms were analyzed according to Shi et al.( 2017) in July of 2018.For each sample, 500 mg of soil was subjected to extraction of total genomic DNA with the E.Z.N.A.Soil DNA Kit (Omega Biotek, USA) and the DNA purified and quantified using a NanoDrop 2000 spectrophotometer (Thermo, USA).PCR amplification of each extract was done for the V3-V4 regions of the 16S rRNA(the primer sequence: 338F: 5′-ACT CCT ACG GGA GGC AGC A-3′; 806R: 5′-GGA CTA CHVGGG TWT CTAAT-3′).Double-end splicing according to the original sequence was done to obtain the optimized sequence (tag), and was followed by clustering of the optimized sequence, division into operational taxonomic units (OTUs) and classification into categories based on the OTU sequence composition.
Statistical analysis
Statistical analyses were performed with the software package SPSS (IBM, SPSS statistics 19.0).Statistical significances were determined using analysis of variance(ANOVA).The significant differences between values atP< 0.05 were identified using Duncan’s multiple range tests.The relationships betweenR.pseudoacaciagrowth indicators, ion content and depth of groundwater, and the relationships between the number of cultural soil microorganisms,ion content and depth of groundwater were visualized using redundancy discriminate analysis (RDA), which is a linear canonical community ordination method.
Results
Condition of R.pseudoacacia trees at different degradation levels in 2017 and 2018
Mortality rate, falling rate and height of dieback
Under the control (CK), trees were growing with very low mortality and falling rates.At higher levels of degradation,mortality and falling rate were significantly higher.Mortality reached 100% in trees at the IVD degradation level in 2017 and at IIID and IVD degradation levels in 2018.In 2017 and 2018, both the mortality and the falling rates increased from April to October (Fig.1 A–D).At higher levels of degradation, dieback became increasingly serious.At the fourth grade of degradation (IVD), the entire tree died (Fig.1 E, F).
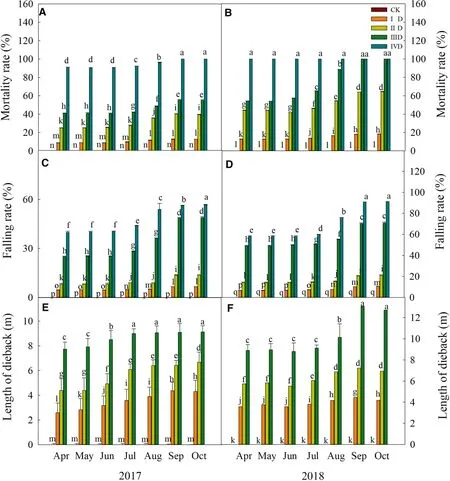
Fig.1 Mortality, falling rates and tree-top death height of trees at different degradation levels.Values are mean ± standard deviation of five biological replicates.Bars with different letters are significantly different at P < 0.05 according to Duncan’s multiple range tests.A mortality rate in 2017; B mortality rate in 2018; C falling rate in 2017; D falling rate in 2018; E average temperature in 2017; F average temperature in 2018
Contents of chlorophyll and Na + in leaves at different degradation levels
In 2017 and 2018, the chlorophyll content of trees at all degradation levels increased initially and then decreased from April to October (Fig.2 A, B).Chlorophyll content significantly decreased as the degree of degradation increased every month.
The Na+content increased as the degree of degradation increased every month.In September and October of 2017 and 2018, the Na+content significantly increased compared to other months at levels IID and IIID, (Fig.2 C, D).In June–August of 2018, Na+levels decreased compared to other months at levels IID and IIID.
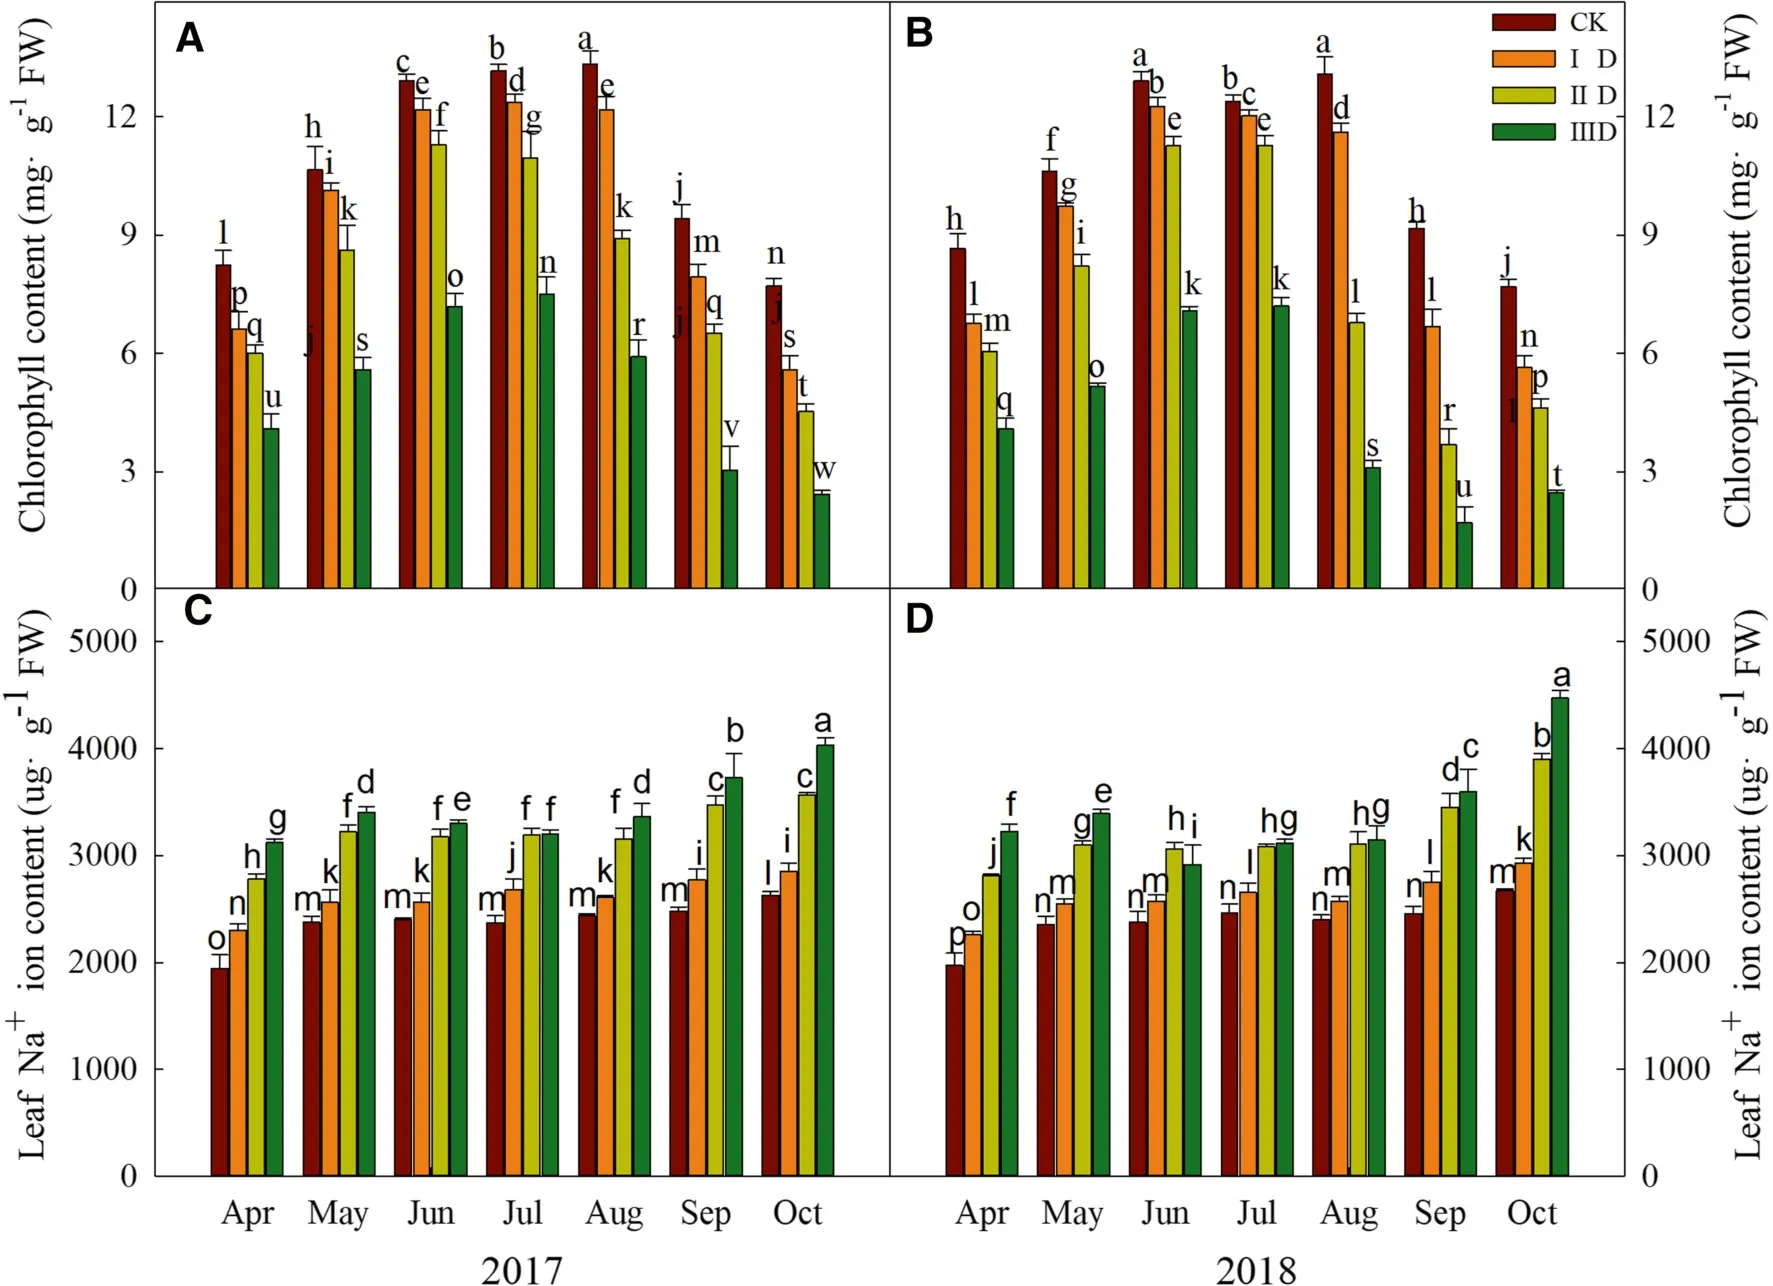
Fig.2 Chlorophyll and Na + contents of trees on different degradation levels in 2017 and 2018.A Chlorophyll content in leaves in 2017; B chlorophyll content in leaves in 2018; C Na + content in leaves in 2017; D Na + content in leaves in 2018.Values are mean ± standard deviation of 5 biological replicates.Bars with different letters are significantly different at P < 0.05 according to Duncan’s multiple range tests
Root collar and breast diameters at different degradation levels
Measurements of ground and breast height diameters in 2017 and 2018 showed that, as degradation increased, root collar and breast diameters decreased.In 2017, collar diameters were largest under the controls (CK) and decreased at higher degradation levels.Diameter at breast height (DBH)showed no differences between the controls and level ID, but were lower at higher degradation levels.In 2018, root collar diameters also showed no differences between controls and level ID, but were less at other degradation levels compared with the controls.DBH were largest in the controls and decreased at higher degradation levels.Collar diameter and DBH showed no significant changes at degradation levels IID, IIID and IVD in 2017 and 2018 (Fig.S3).
Root characteristics at degradation levels IIID and IVD
Fig.S4 shows that the development of the main roots were severely damaged.Numerous lateral roots branched from the main root next to the surface and grew horizontally.In addition, many lateral roots formed from the main roots about 0.5 m from the surface, and the main roots either were degraded or bent horizontally to grow at about 0.7 m from the surface (Table S1, Fig.S4).In degraded areas, the roots grew and developed in the same way regardless of the size of the trees (Table S1).
Groundwater levels and soil characteristics
Groundwater levels and salinity at different degradation levels
Regardless of month in either year, the groundwater was the deepest under control conditions and decreased as the degree of degradation increased.In both years, the depth of the water table was shallowest in August at all degradation levels (Fig.3), which may be due to heavy rainfalls (Figs.3 and S2).
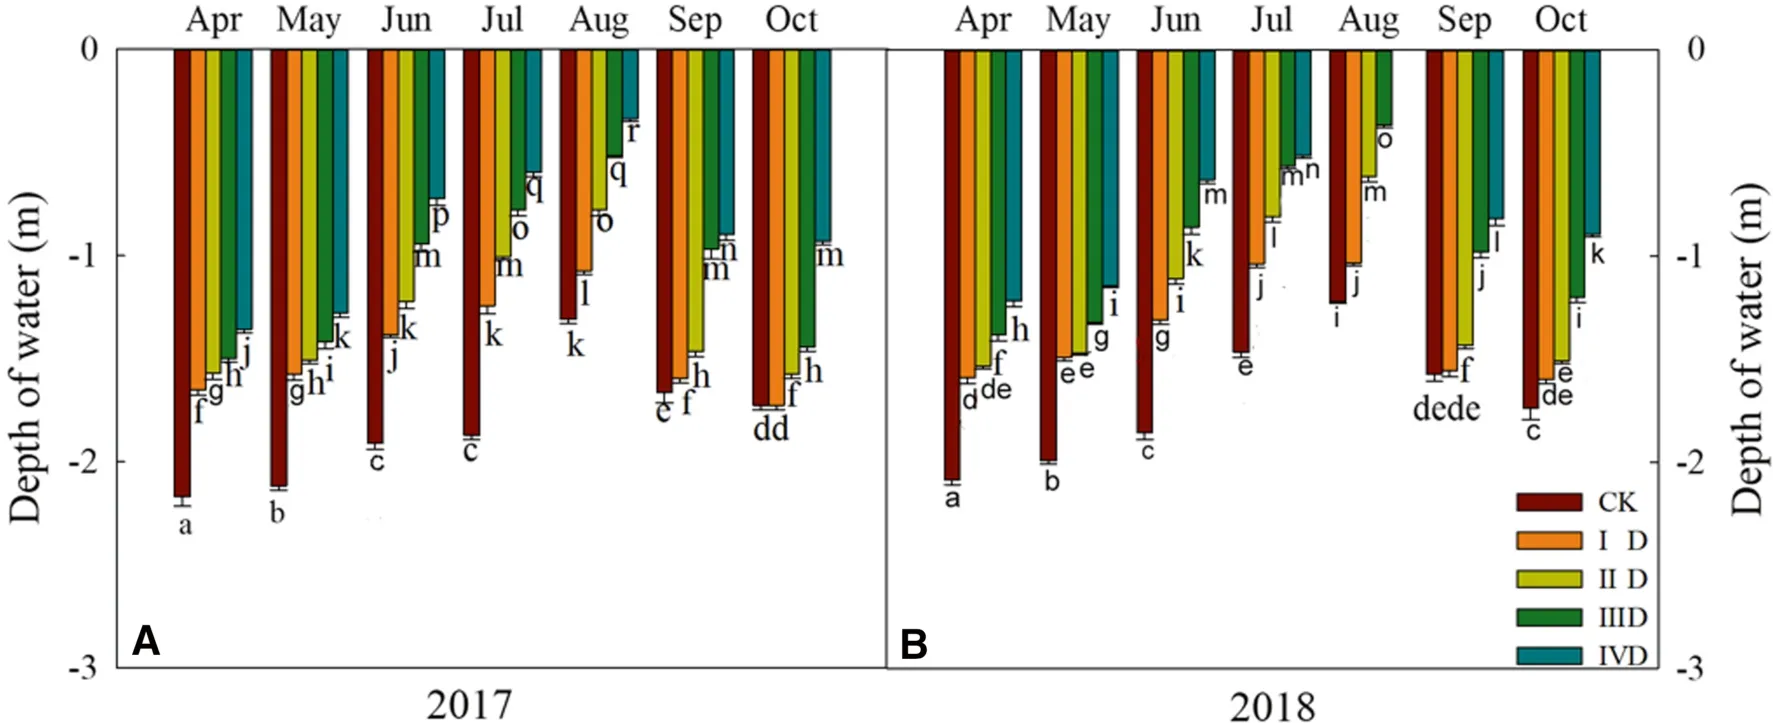
Fig.3 Depth from surface to groundwater level on different degradation levels in 2017 and 2018.A The groundwater depth in 2017; B the groundwater depth in 2018.Values are mean ± standard deviation of 5 biological replicates.Bars with different letters are significantly different at P < 0.05 according to Duncan’s multiple range tests
In both years, salt content in different soil depths increased as the degree of degradation increased.The salt content was closely related to the degradation level and soil depth.The salt content was the least in the surface layer than in deeper layers.In both years, at every degradation level, soil salt content was negatively correlated with rainfall(Figs.4 and S2).
Biological diversity in soil and above ground at different degradation levels in 2017 and 2018
The populations and species of soil microorganisms at different degradation levels were analyzed (Fig.5, Table 1).There were no significant differences in microorganisms at different degradation levels and soil depths.As the level of degradation increased and soil depth increased, soil microbial content significantly decreased (Table 1).
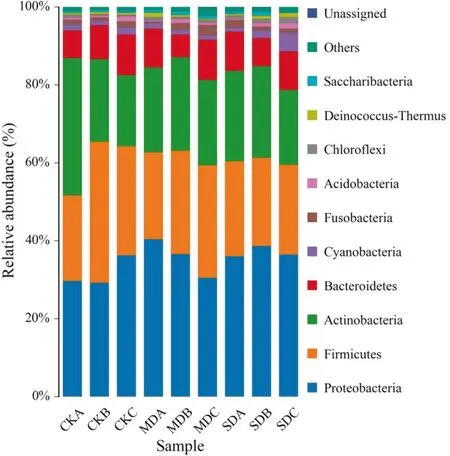
Fig.5 Relative abundance of soil microorganisms on different degradation levels in 2018.Values are mean ± standard deviation of three biological replicates.(CKA, soil microorganisms from ground surface to 0.5 m underground of CK; CKB, soil microorganisms from 0.5 to 1.0 m underground of CK; CKC, soil microorganisms from 1.0 to 1.5 m underground of CK; MDA, soil microorganisms from ground surface to 0.5 m underground of IID; MDB, soil microorganisms from 0.5 to 1.0 m underground of IID; MDC, soil microorganisms from 1.0 to 1.5 m underground of IID; SDA, soil microorganisms from ground surface to 0.5 m underground of IVD; SDB, soil microorganisms from 0.5 to 1.0 m underground of IVD; SDC, soil microorganisms from 1.0 to 1.5 m underground of IVD)
In Fig.4, with the level of degradation increasing, the salt content of the surface gradually increased as well.Different soil salinities led to significant differences in the distribution and quantity of plant species (Table S2).Halophytes such asSuaeda salsaL.,Tamarix chinensisL.andPhragmites communisTrin.were mainly distributed in severely degraded areas with high surface salt contents.Salt-sensitive species such asEleusine indica,Chloris virgataSwartz andEclipta prostratewere found in the control sites and lightly degraded areas with low salt levels.Other species such asInula japonicaandPotentilla reptanswere distributed throughout the study area.The numbers of species were larger on sites with low salt content.
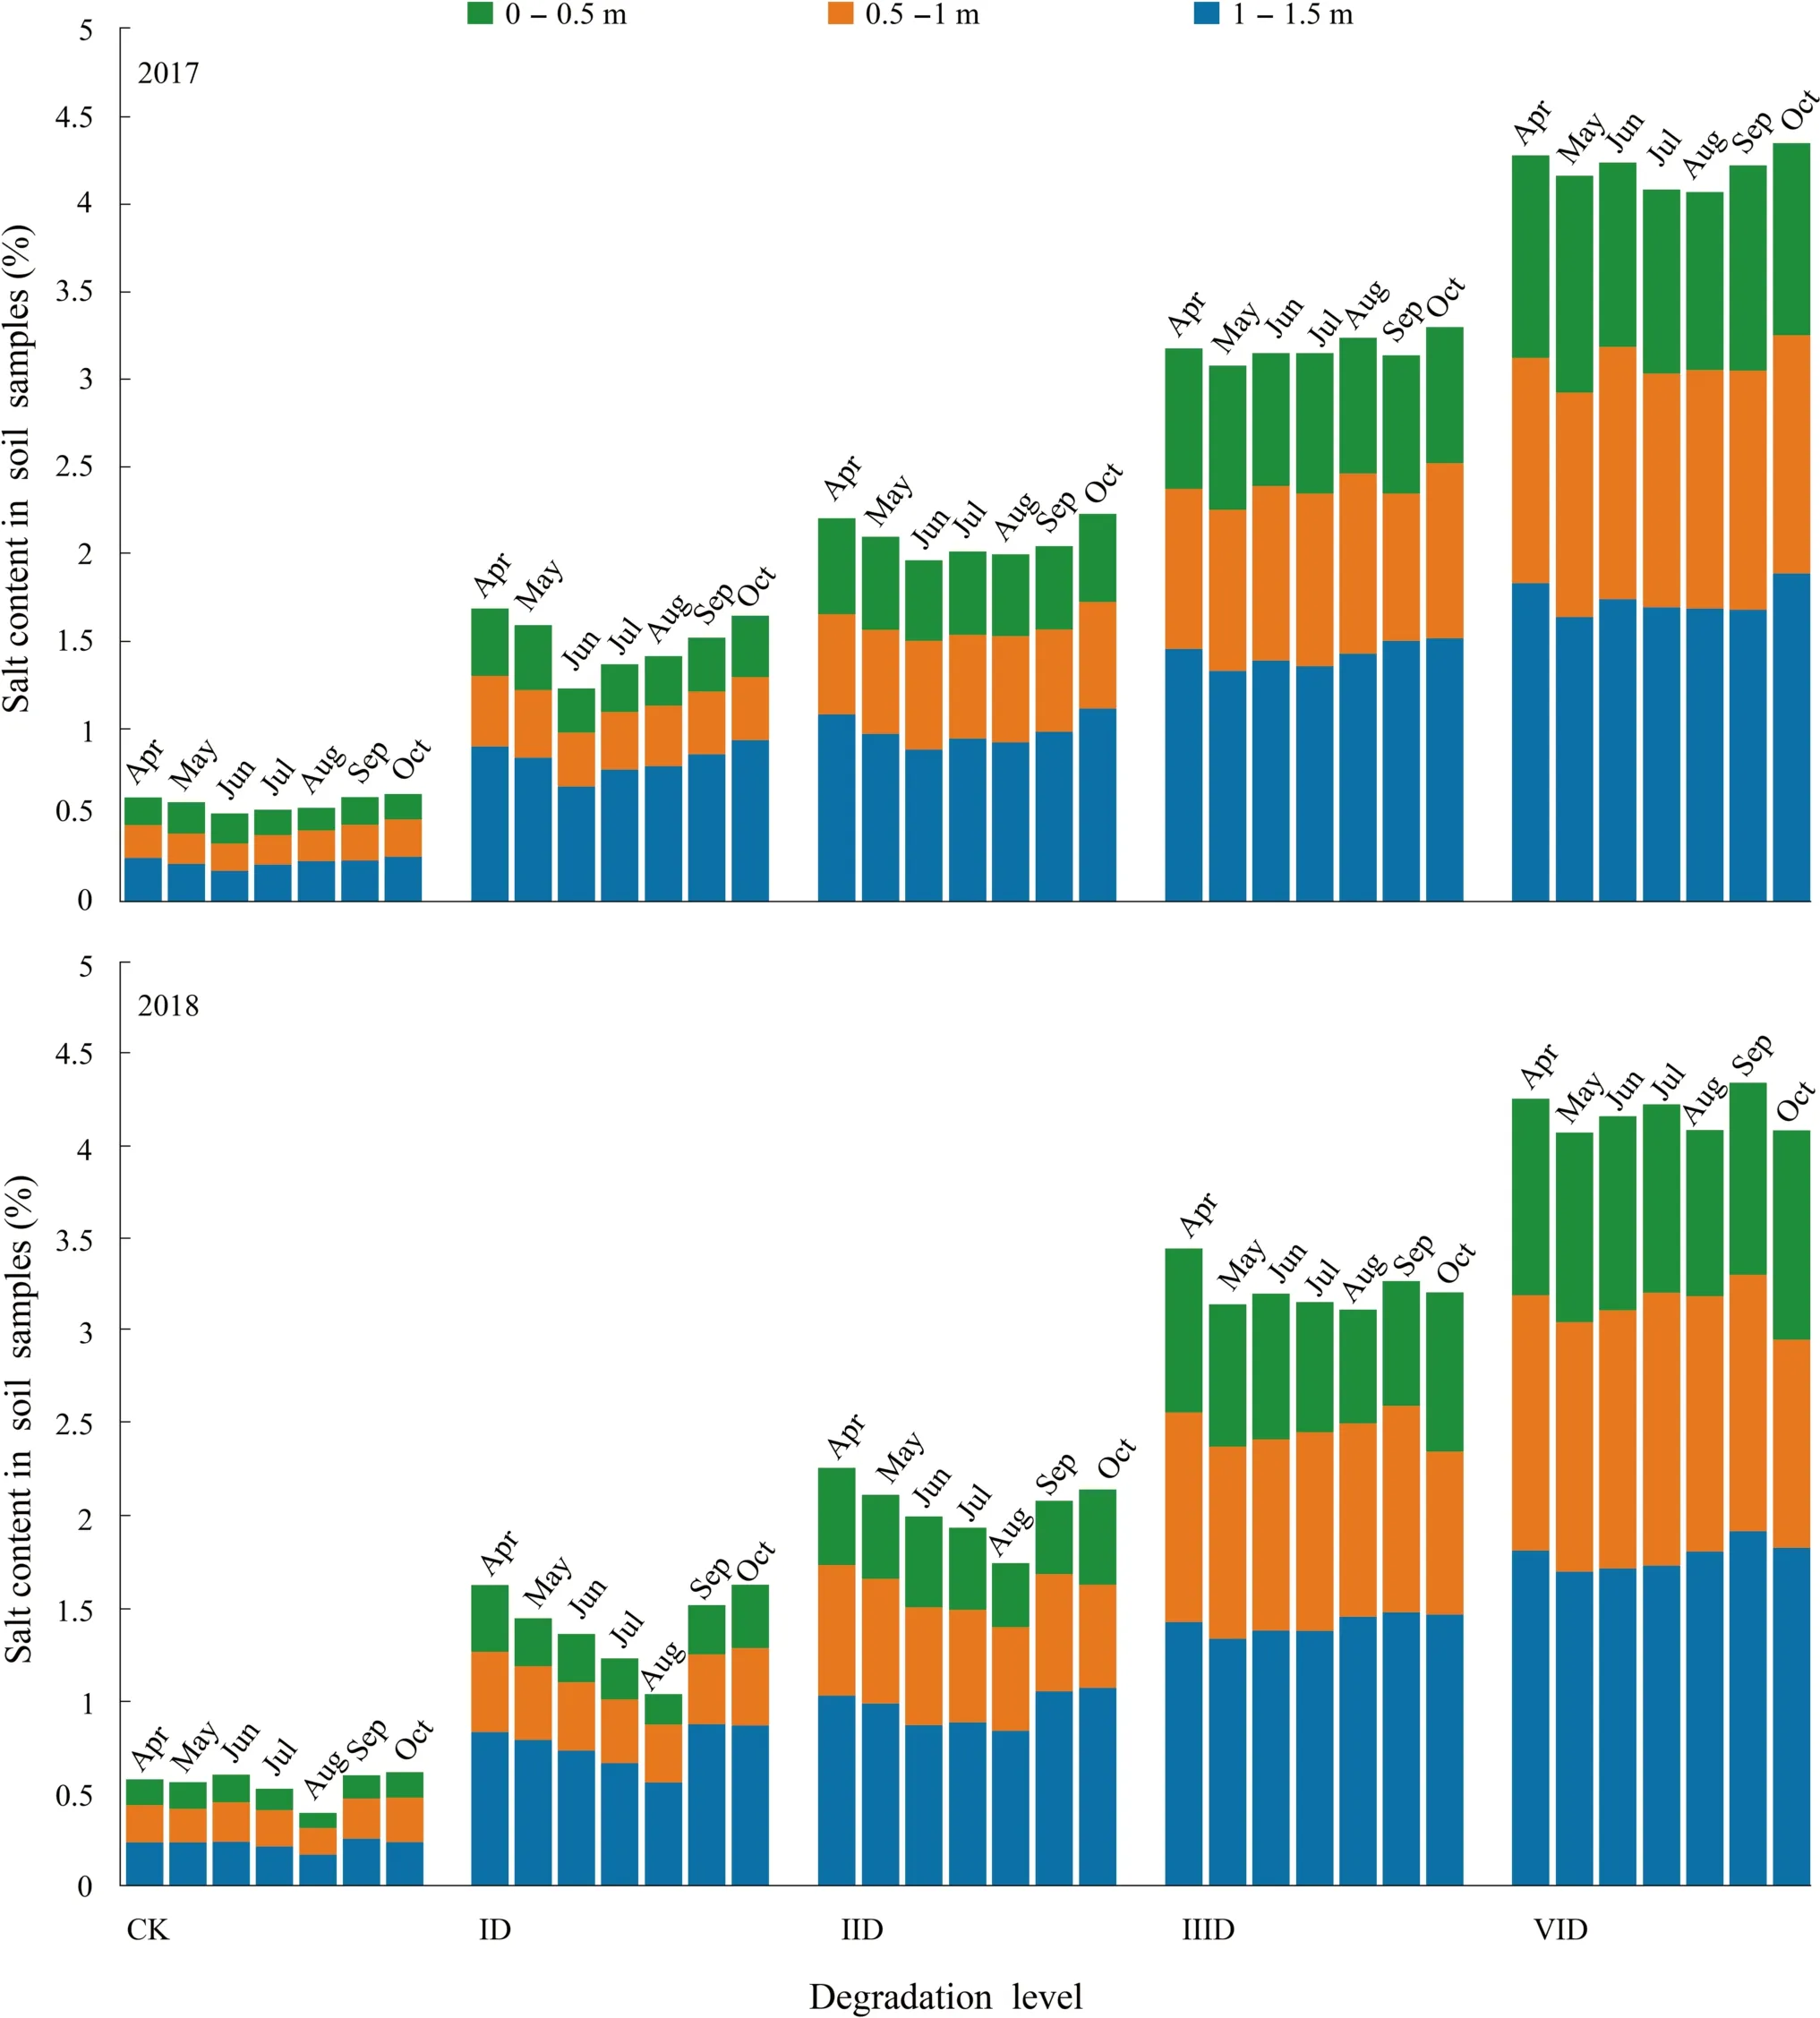
Fig.4 Salinity at different soil depths (0–0.5, 0.5–1.0 and 1.0–1.5 m) on different degradation levels in 2017 and 2018.Values are mean ± standard deviation of five biological replicates.Bars with dif-ferent letters are significantly different at P < 0.05 according to Duncan’s multiple range tests
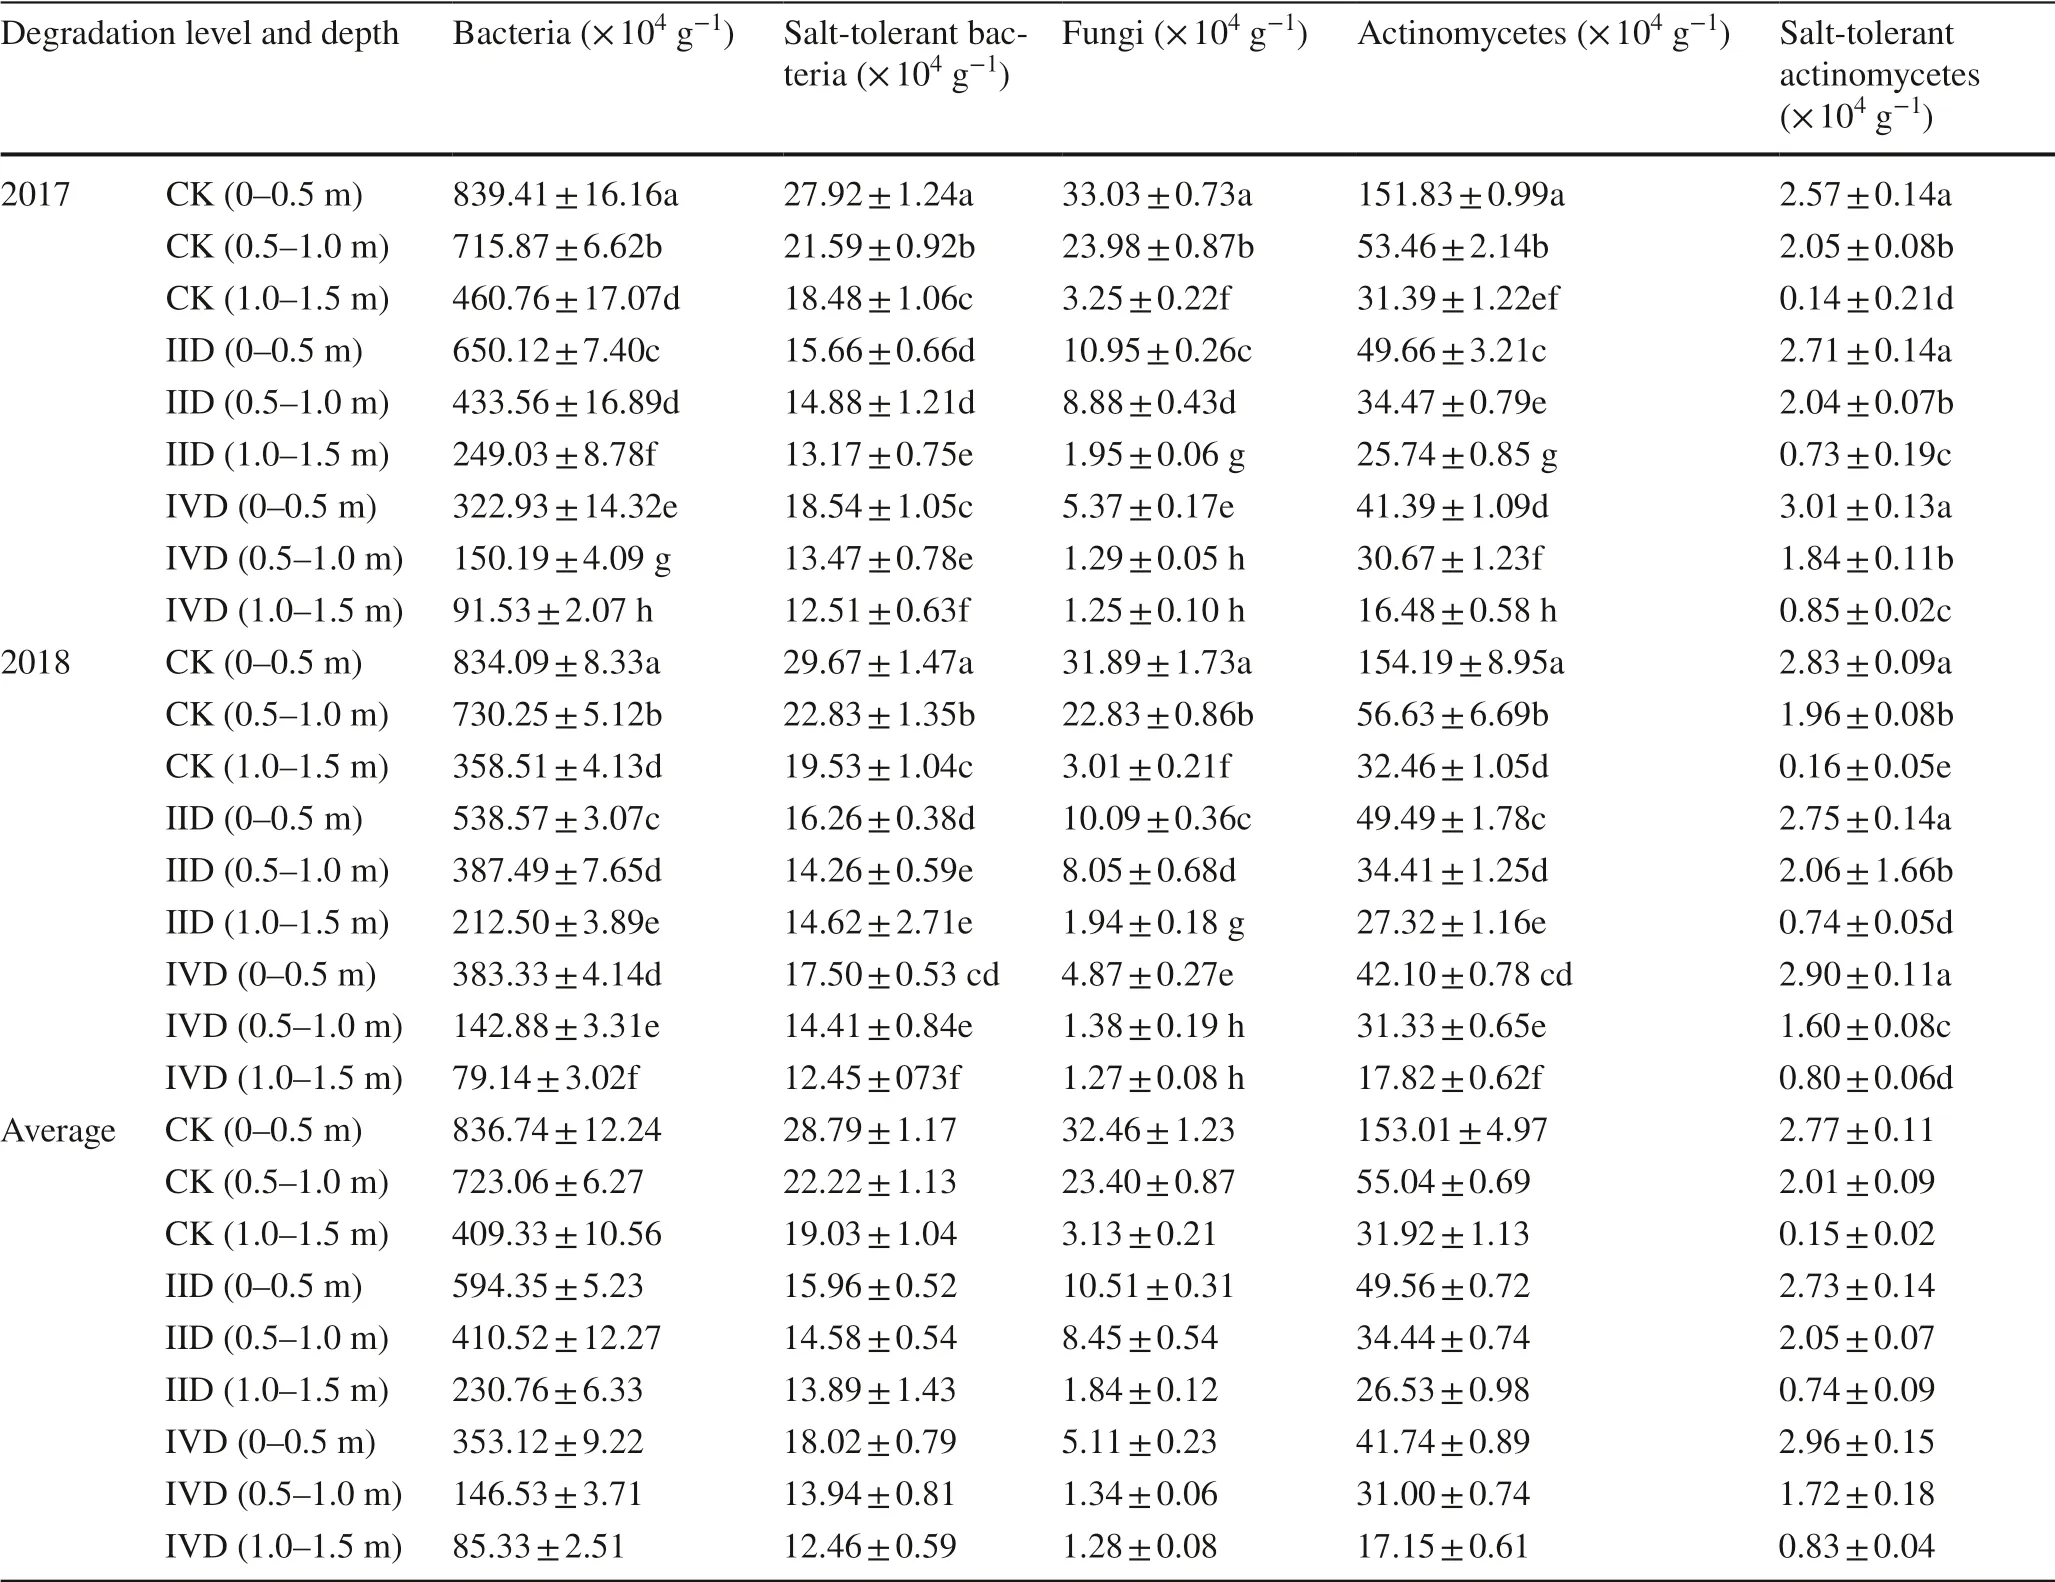
Table 1 Effects of degradation level and depth on numbers of culturable soil microorganisms in July of 2017 and 2018
Relationships between condition of R.pseudoacacia trees and environment
RDA plots of growth characteristics and the number of culturable soil microorganisms with ion content and groundwater depth
RDA analysis was used to examine the relationships between the growth characteristics ofR.pseudoacaciaand soil ion content and depth of groundwater.Ion content correlated positively with dieback height, falling and mortality rates,and leaf sodium ion content, but negatively with collar diameter, breast diameter and leaf chlorophyll contents (Fig.6 A,B).In contrast, groundwater depth was negatively correlated with falling mortality rates and leaf sodium ion content, but positively with collar diameter, breast diameter, and leaf chlorophyll content.
RDA analysis also examined the relationships between the number of culturable soil microorganisms, the soil ion content, and the depth of groundwater.The results show that groundwater depth positively correlated with the number of culturable soil microorganisms, but negatively with soil ion content (Fig.6 C, D).
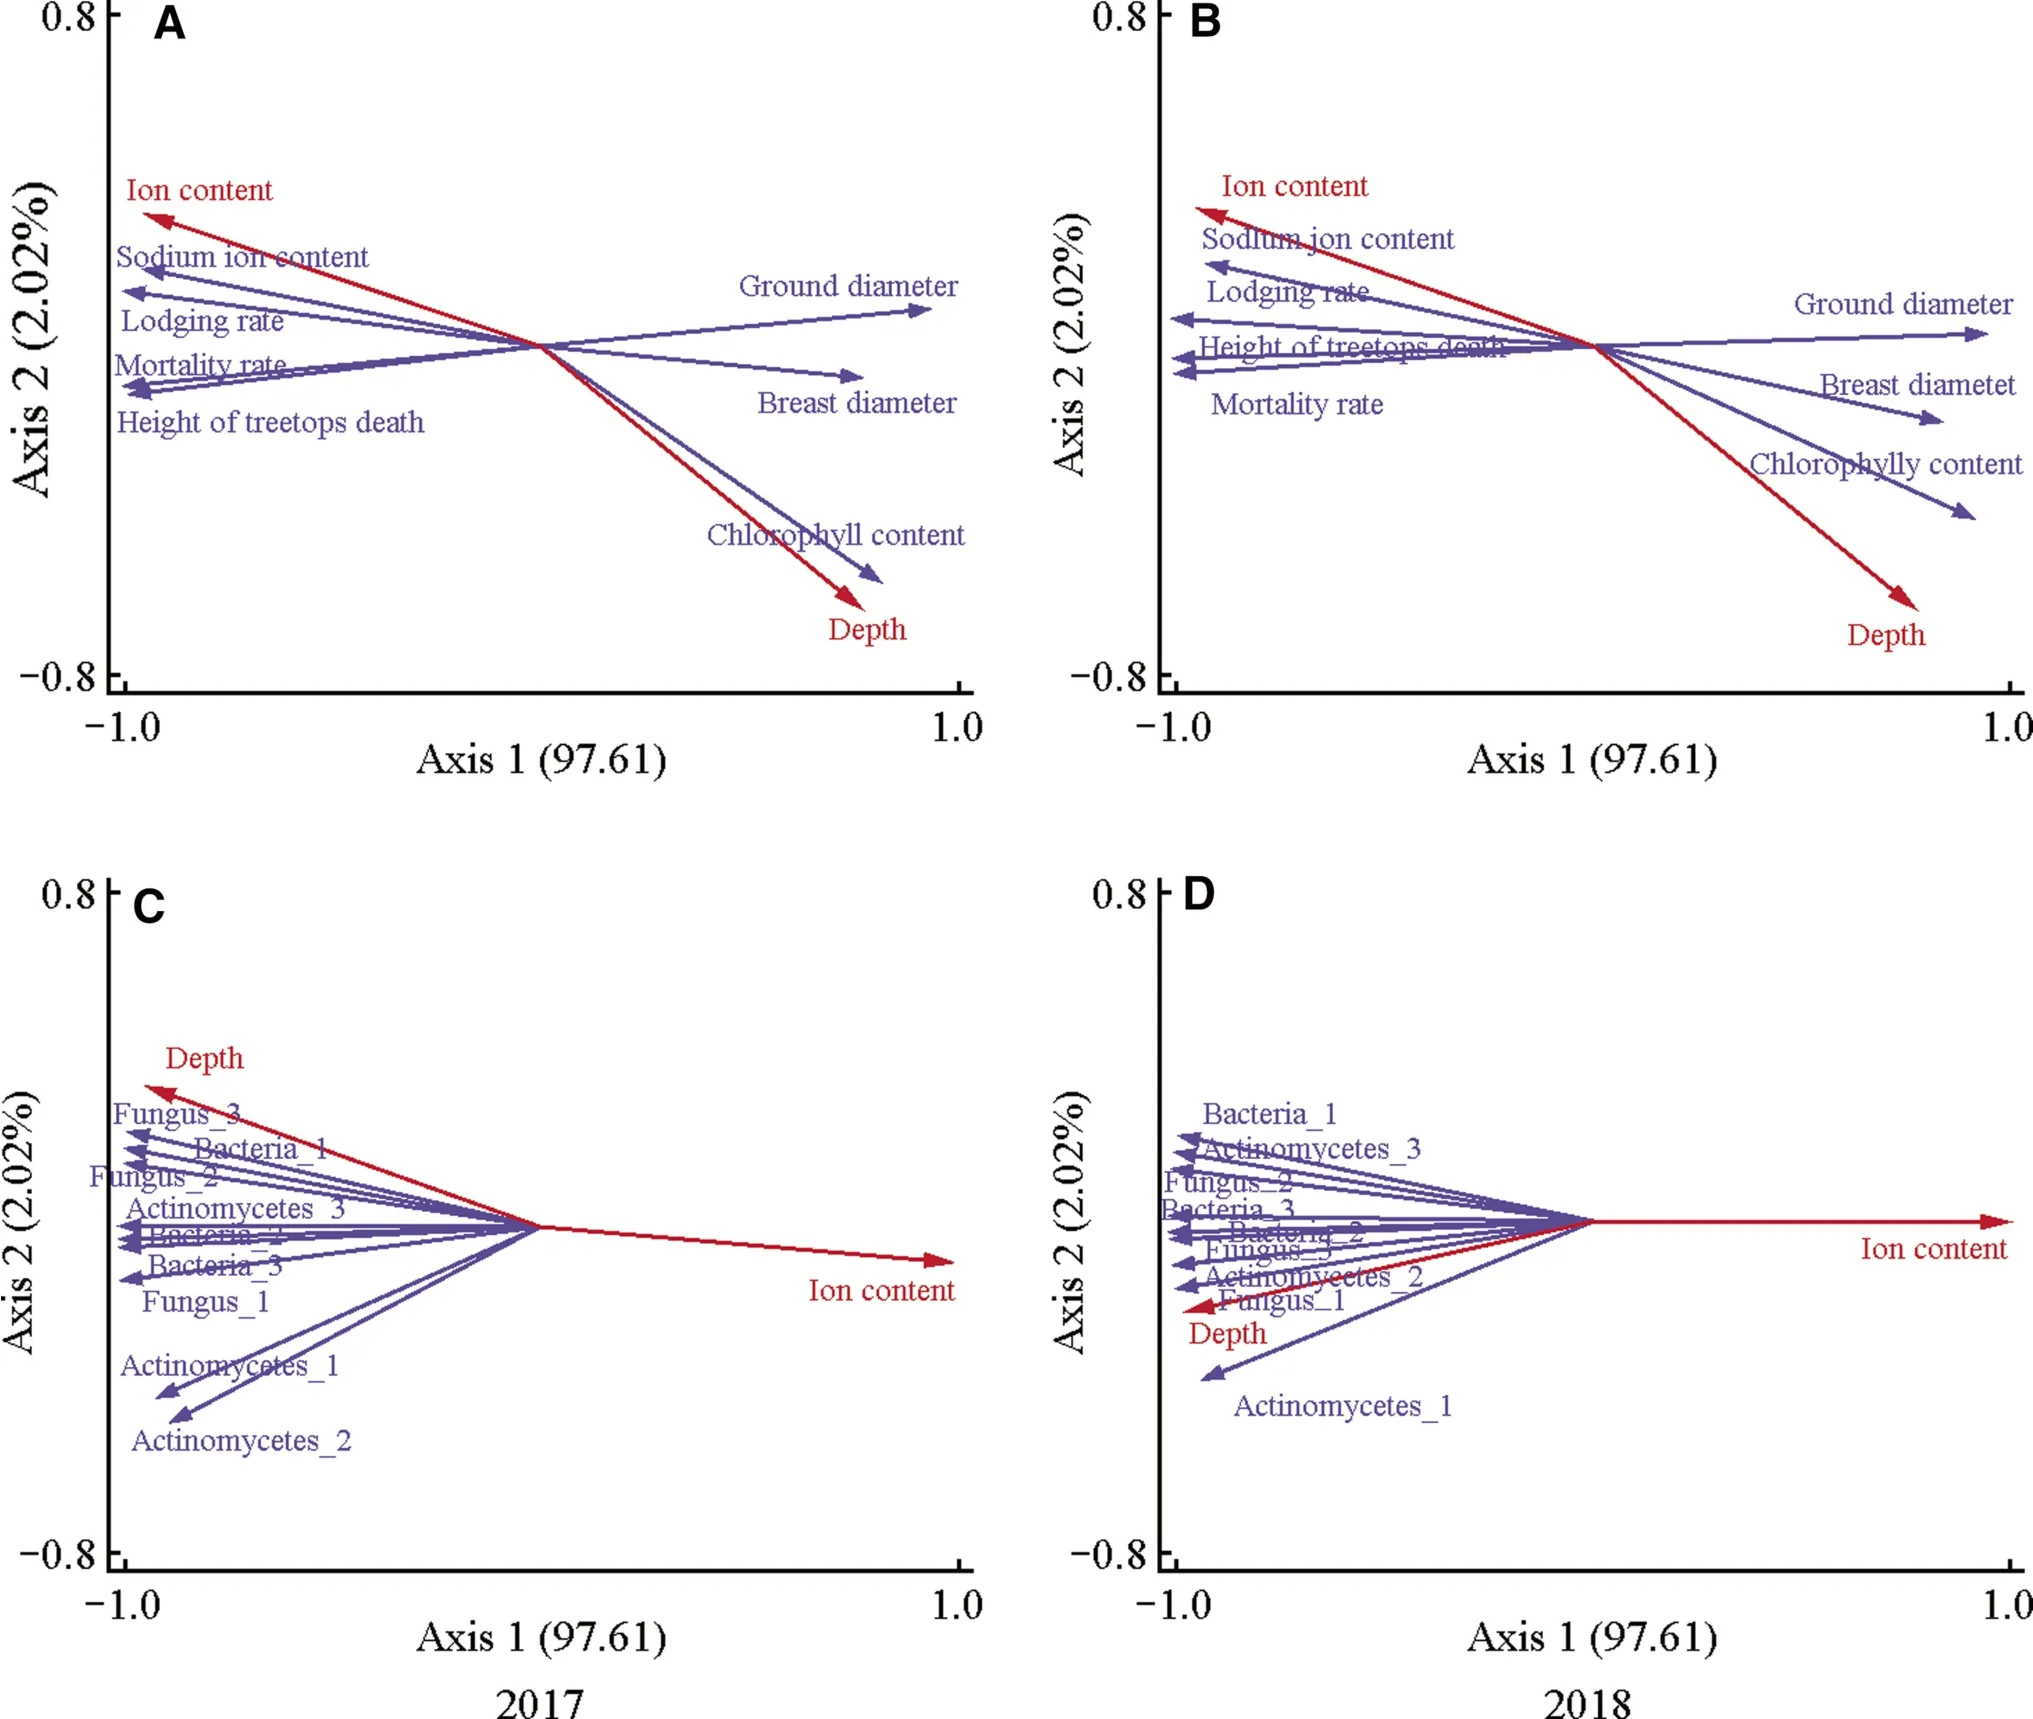
Fig.6 RDA plots of the growth indicators of Robinia pseudoacacia and the number of culturable soil microorganisms with soil ion content and the depth of groundwater in experimental fields in 2017 and 2018.The red “Ion content” and “Depth” mean soil ion content and depth of groundwater, respectively.A RDA plots of R.pseudoacacia growth characteristics with soil ion content and groundwater depth in 2017; B RDA plots of R.pseudoacacia growth characteristics with soil ion content and groundwater depth in 2018; C RDA plots of the number of culturable soil microorganisms with soil ion content and groundwater depth in 2017; D RDA plots of the number of culturable soil microorganisms with soil ion content and groundwater depth in 2018.Values are mean ± standard deviation of 5 biological replicates.Bars labeled with different letters are significantly different at P < 0.05 according to Duncan’s multiple range tests
According to the RDA analysis, the main factor affecting the growth ofR.pseudoacaciaand the number of culturable soil microorganisms was soil ion content, and the depth of groundwater was secondary.
Correlation analysis of mortality of R.pseudoacacia with soil ion content and depth of groundwater
Mortality ofR.pseudoacaciacorrelated positively with salt content and negatively with the depth of groundwater(Fig.7), i.e., high salt content and high groundwater levels led to the death of the species.With regards to the salt content, when the mortality rate was 50%, the level of salt in the soil was about 0.95% in 2017 and 0.79% in 2018, which shows with time the saline environment increased, more salt accumulated in the species and the lethal salt concentration decreased in 2018.For the depth of groundwater, when the mortality rate was 50%, the depths of groundwater were 1.21 m in 2017 and 1.18 m in 2018.

Fig.7 Correlation analysis of mortality of R.pseudoacacia with soil ion content and the depth of groundwater in 2017 and 2018.A Correlation analysis of mortality rate of R.pseudoacacia with soil ion content in experimental fields in 2017; B Correlation analysis of mortality rate of R.pseudoacacia with soil ion content in 2018; C Correlation analysis of falling rate of R.pseudoacacia with the depth of groundwater in 2017; D correlation analysis of falling rate of R.pseudoacacia with the depth of groundwater in experimental fields in 2018.Values are mean ± standard deviation of 5 biological replicates.Bars labeled with different letters are significantly different at P < 0.05 according to Duncan’s multiple range tests
Discussion
Forest degradation is a worldwide problem and it is important to identify the underlying mechanisms and propose mitigation measures.Because of geographical and climatic differences, forests in different regions have suffered varying types and degrees of disturbance (Simula 2009; Matricardi et al.2020; Yu et al.2020).The Yellow River Delta (YRD),is the fan-shaped alluvial plain formed by the deposition of sediment carried by the Yellow River (Qi et al.2018; Zhu et al.2019) and is thus new land with high salt levels, low nutrient and organic matter contents, and overall a delicate ecosystem (Xia et al.2010).Ecological restoration technology based on vegetation restoration is one of the main means for the reconstruction of delicate ecosystems in the Delta.
There is no logging, grazing or plant diseases and insect pests, and not caused by changes in soil pH (Fig.S5).This study started from the dynamic changes of water and salt in soil to investigate degradation mechanism.Mao et al.( 2016)showed that precipitation impacts on soil moisture and salt in the Yellow River Delta.Our results showed that rainfall decreased soil salt content while decreasing the depth of groundwater, especially in August (Figs.3 and 4), which is beneficial for shallow-rooted plants but leads to the decline of deep-rooted species (Du et al.2013).High salt content in the deeper layers of the soil causes changes to the spatial structure ofR.pseudoacaciaroots.The spatial distribution and characteristics of the fine roots of this species were distributed in the shallow soil layer, as shown by these results (Table S1, Fig.S4).Plants have developed different strategies to adapt to high salinity, among one important option is avoiding salinity, especially in the roots (Zhu 2001;Guo et al.2012, 2018; Du et al.2013).Galvan-Ampudia and Testerink ( 2011) showed that high salt levels change auxin distribution, affecting root system architecture, and altering lateral root formation and the direction of primary root growth.High salt contents on severely degraded areas caused main roots to degenerate or lose geotropism and horizontal growth (Table S1, Fig.S4), suggestive of a strategy of salinity avoidance rather than salt tolerance (Du et al.2013).Our study showed that the salt content in the surface soil layer was relatively low compared to that in deeper layers(Fig.4), which is consistent with Mao et al.( 2016).The large volume of surface roots is beneficial to the acclimation of trees to saline soils and is related to high nutrient concentrations (Ford and Deans 1997), but it makes the trees vulnerable to windthrow.Soils on severely degraded sites often contain high salt levels, which is shown by the type and quantity of surface plant species (Table S2), and halophytes such asS.salsaandT.chinensiswere mainly distributed on severely degraded areas.Soil characteristics affect the distribution of microorganisms (Fig.5, Table 1).
The RAD analysis between the state ofR.pseudoacaciaand the environment showed that the main factor causing the degradation ofR.pseudoacaciaforest is high soil salt, and the secondary factor is depth of groundwater (Fig.6).This has been the result of economic activities in the Yellow River Delta; rice planting in particular has disrupted the original water–salt balance in the forest, resulting in high salt contents and high groundwater levels (Bobba 2002).Xia et al.( 2010)have shown that changes in soil volume weight, porosity,permeability and water storage are some causes of forest degradation, but our results show that high salt content and groundwater lead to forest degradation (Figs.6 and 7).The more severe the degradation of these forests, the higher the ion content and the shallower the ground water (Figs.2, 3, 4 and 5).The most severe degradation occurred on sites closest to rice fields (Fig.S6).Heavy summer rainfall, especially in August, is another factor causing rises in groundwater levels.High salt content and high groundwater tables cause root necrosis, leading to high mortality.At the same time, strong winds that normally occur due to monsoons in the YRD (Wang et al.2014) cause the trees to tilt and sometimes fall, especially given the shallow roots that develop in response to high salinity.
The causes ofR.pseudoacaciaforest degradation in the YRD have been identified and remedial measures are needed.Local agricultural planting needs to be changed and engineering measures such as a developed drainage system should be implemented to reduce soil salt content to < 0.8%and groundwater levels to < 1.2 m.
Conclusion
The degradation of theR.pseudoacaciaforest in the Yellow River Delta is caused by increasing soil salt contents and decreasing groundwater depth.Redundancy discriminate analysis and correlation analysis showed soil ion content > 0.8% was the main factor causing degradation while groundwater depth < 1.2 m was secondary.High soil salt content and high groundwater were due to local human economic activities and remedial measures are recommended.
杂志排行

Journal of Forestry Research的其它文章
- Journal of Forestry Research
- Reversibly photochromic wood constructed by depositing microencapsulated/polydimethylsiloxane composite coating
- Surveillance of pine wilt disease by high resolution satellite
- Adaptation of pine wood nematode, Bursap helenchus xylophilus,early in its interaction with two P inus species that differ in resistance
- Pine wilt disease detection in high-resolution UAV images using object-oriented classification
- Transcriptome analysis shows nicotinamide seed treatment alters expression of genes involved in defense and epigenetic processes in roots of seedlings of Picea abies