Comparative analysis of thinning techniques in pine forests
2022-09-08OlgaGrigorevaElenaRunovaVeraSavchenkovaEdwardHertzAnnaVoronovaViktorIvanovViktoriaShvetsovaIgorGrigorevMikhailLavrov
Olga Grigoreva ·Elena Runova ·Vera Savchenkova ·Edward Hertz ·Anna Voronova ·Viktor Ivanov ·Viktoria Shvetsova ·Igor Grigorev ·Mikhail Lavrov
Abstract Thinning is a necessary and complex forestry activity.The complexity increases due to theoretical disagreements, contradictory recommendations, and errors of modern practice, which require confirmation through longtime experiments.This article presents a summary of experimental results from plantations established 20–30 years ago and explains concepts of the theory, methods, and regime of thinning in permanent sample plots of pine stands in Gatchinsky forest of the Leningrad region.The research results allow for the clarification of growth patterns and age dynamics of pine stands subject to heavy, low thinning, as well as the results of applying the crown (high) thinning technique and a mixed treatment.A combined thinning and fertilization could improve wood quality and yield compared to conventional methods.Of particular scientific importance is the analysis of change in tree diameter classes during growth and after thinning.The research results allow for optimizing the treatment regime in pine plantations and reducing labor intensity by increasing the intensity of thinning and reducing the number of techniques.
Keywords Forest management practices·Forest stand ·Selective thinning·Silviculture
Introduction
Thinning of forest stands and plantations has been the subject of numerous studies for decades (Zeide 2001).Choosing the most suitable thinning method is one of the most important and necessary measures in silviculture.The impact of thinning on tree growth and the development of the stand,which in turn influences the functionality and productivity of forest plantations, began to be studied experimentally from the late nineteenth century, comparing different thinning techniques with untreated (control) plantations (Powers et al.2010).The first results of pine forest experiments for Central Europe are in the work of Pommerening and Murphy ( 2004),followed by other experiments with different forest species in different regions around the world (Hosius et al.2006).
Generally accepted thinning methods research is aimed at studying growth and yield.These studies provide additional information on average volumes, the size of trees and, in some cases, features of the crowns and conicity, the property of being conical (del Río Gaztelurrutia et al.2017; Duissenbekov et al.2020).However, in terms of environmental consequences, the impact of different thinning techniques has been poorly studied, being mentioned sporadically(Pretzsch et al.2014; Sohn et al.2016).To date, the focus on wood yield has lost its priority in some European forest areas, and more attention is paid to different forms of forest management, including thinning.Further, due to global climate changes, the research focus is to explore different alternatives for ensuring the sustainability of forest plantations (Schulze et al.2020).The literature review in Seidl et al.( 2017) showed that ongoing climate change increases forest disturbances caused by fire, insect infestations, and pathogens.These factors will continue to grow over the next several decades.Moreover, serious forest changes will occur due to climate change and related phenomena such as drought, wind, or snow.All these factors can lead to devastating consequences such as fires, deforestation, or soil degradation.
Existing long-term thinning experiments can fill the knowledge gap on such aspects as carbon accounting(Alvarez et al.2016; Ruiz-Peinado et al.2016 ; Borodin and Zhangabay 2019) or the impact of climate change (Sohn et al.2016).Scots pine (Pinus sylvestrisL.) is the most widespread coniferous species in northern Europe.There are controversies and disagreements over thinning among researchers who recommend different treatments.Current thinning techniques may be summarized into two groups:crown (high) thinning and low thinning (Lindroth et al.2018; Marchi et al.2018).Sometimes a mixed method of the two is mentioned.Many researchers have been involved in determining the optimal timeframes for a thinning procedure (Tahvonen 2016).There are two points of view on the possibility to change the overall productivity of forest plantations, one is proposed by scientists and forest practitioners who support the concept of sustainability of stands after thinning (Schulze et al.2020).The other viewis that thinning can significantly increase overall productivity (Yoshimoto et al.2016).The results in both these practices were also controversial, possibly due to the large range of the species,introducing geographical variability, specific resistance to environmental changes (Kremer et al.2012), and differences in the experimental planning and thinning methods used (Utelbaeva et al.2013; Primicia et al.2016).In spite of a sharp increase in forested area and general restoration of biodiversity, passive reforestation or self-regeneration on abandoned farmlands requires constant monitoring to prevent sudden wildfires (Rudel et al.2020).In addition,the intentional planting of trees to avoid flooding and soil degradation may also be part of a strategy to help stabilize the climate.According to Rudel et al.( 2020), artificial forest stands will remain a priority for carbon sequestration and the reduction in greenhouse gases compared to naturally regenerated forests.However, resolving a problem by expanding forest plantations exacerbates other problems, leading to reduced biodiversity and slowing down natural processes(Austin et al.2017).
There is an opinion about maintaining stable tree growth from the age of 20–30 years, sometimes earlier, and the opposite about the possibility to improve the growth of small trees through specific treatments.The selection of crop trees is based on a stable growth of large trees planted at a young age (Karlsson 2013).There are recommended guidelines for crop trees selection (Ministry of Natural Resources and Environment of the Russian Federation 2020).Only longterm experiments reveal changes in trees during growth and clarify the treatment method.The results obtained by Stephens et al.( 2020) indicate that applying fire protection measures, including thinning, may also enhance biodiversity,carbon sequestration and storage, and increase the resilience and adaption to climate change in forests.Such measures may have positive ecological effects in seasonally dry forests(Bosela et al.2021).As a result, the intensity of thinning and fertilization may increase tree growth but also reduces their resistance to drought.Therefore, selecting optimal thinning methods to enhance forest productivity and reduce its vulnerability to climate change is a necessary and relevant issue.
Although two main thinning methods have been known for considerable time, there are no firm recommendations for using either in stands of different composition.Related issues have been studied separately.This current study has attempted to comprehensively assess the impact of thinning techniques on plantation structure and its productivity.
The purpose is to analyze the results of thinning plantations that were established 30–40 years ago and specify theories, practices, and thinning regimes.The impact of thinning on the age dynamics and changes in tree diameter class distribution within pine stands of Gatchinsky forestry has been analyzed.The research program included the following: (1) Studying the age dynamics of pine stands formed under the influence of thinning and without thinning; (2)Studying the process by which the tree stand forms, changes in diameter classes, and the effect of different thinning methods on these processes; (3) Estimating the influence of thinning on the merchantability of the stand; and, (4) Specifying practical recommendations on thinning methods in pine stands of the southern taiga subzone.The results of this work are of practical significance and provides recommendations on the choice of thinning technique in dry pine stands and evaluating the effectiveness of fertilizers (integrated care).
Materials and methods
Forest inventory
For extensive forest inventories, methods of partial inventory are used, i.e., not carried out on the entire area but only on a specific, typical portion, and the data are extrapolated to the entire area (stock/ ha, sum of the cross-sectional areas/ha, stems/ ha are established by the ratio of a sampled part to the entire area).This study used the most common partial forest inventory technique, namely permanent sample plots(PSP).Sample plots should be homogeneous with the study site according to all forest inventory indices, and therefore typical for the whole area according to composition, age,density, and other forest inventory indices.
The research was carried out on PSPs established in 1971 with the last measurements carried out in 2019.By the time the field studies were conducted, the plantations were 70 years old.Thus, the complete cycle of silviculture in pine stands and the impact of thinning can be analyzed in detail.
PSPs are established and used for long-term, multi-year stationary observations.The inventory was carried out with metal calipers in two perpendicular directions on the stem at 1.3 m (DBH) with an accuracy of 1 mm.Heights were measured with a hypsometer for 3–5 trees in each diameter class.Repeated measurements were every 5 years, recording diameters of all trees in the same directions (N–S, W–E) and the height of every tenth tree.The data enabled the study of growth rates of the stand, dynamics of decay, growth in diameter, height, and stock.All PSPs had a protective strip 20–30 m wide.
The influence of thinning on age dynamics was estimated by comparing the control (unthinned) and thinned PSPs.Forest inventory data such as species, age, average diameters, average heights, total stock, and merchantability, were determined by the following methods.
Average age (Aav) of the stand was determined through the ages of the accounting trees; the latter was estimated according to the diameter class by the Eq.1
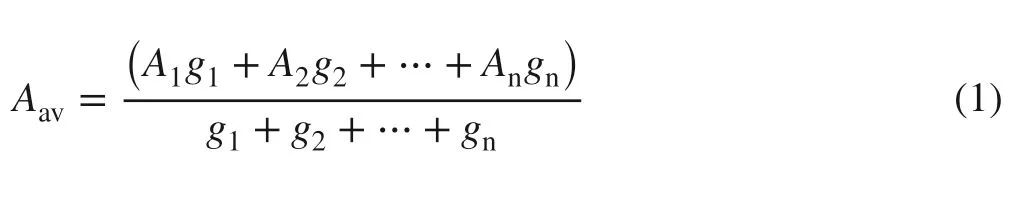
whereA1,A2,…,Anare average age of trees (years) according to diameter class;g1,g2, …,gnare cross-sectional areas of stems (m2) according to diameter class,, 1, 2, …, n are class numbers.The average age was determined within the accuracy of one year.Average diameter (Dav) is the diameter of the stem, which is equal to the calculated average crosssectional areagavaccording to the Eq.2.

wheren1,n2, …,nnare the number of trees according to the diameter class, obtained by counting, 1, 2, …, n are class numbers.
Absolute density of the stand (G) per hectare of forest(m2/ha) was determined as follows:
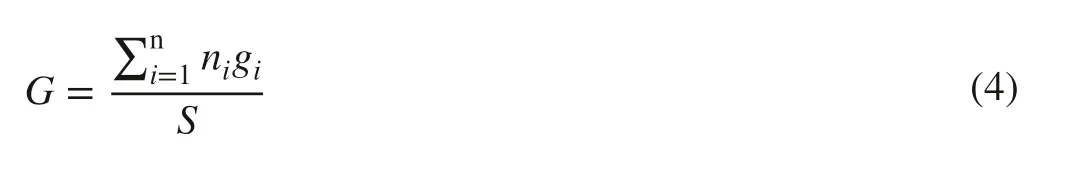
whereSis sample plot area (ha).
Average height (Hav) was determined by the Eq.5.

whereh1,h2,…,hnare heights of trees (m) with different diameters; n is number of trees.The stock of the forest unit(M) based on the data of the continuous enumeration and forest inventory of the felled trees was determined by the Eq.6.
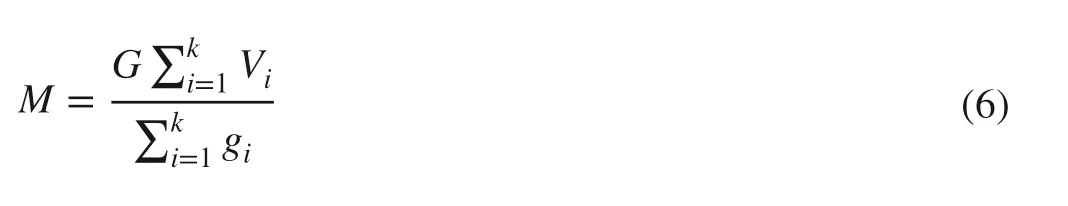
whereViis the volumes of thei-th accounting trees felled on the sample, m3;giis cross-sectional areas of thei-th accounting trees, m2; k is the number of felled accounting trees.
To characterize the state and intensity of tree growth over time, growth was studied by forest inventory indices(tree diameter).The absolute current growth value (Z) for the period was determined by the Eq.7.

whereDis trunk diameter at 1.3 m at the end of the period;dis trunk diameter at 1.3 m set at the beginning of the observation period.The relative growth rate (P) was calculated according to Eq.8.
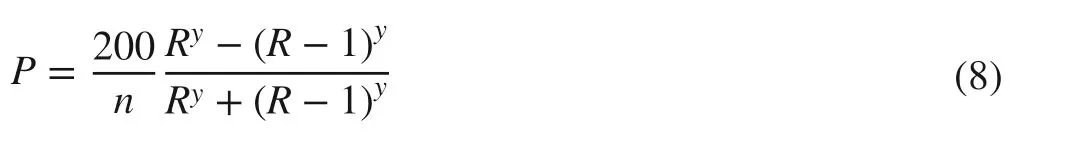
whereRis relative tree diameter that is determined by the Eq.9.
The diameter class (y) is defined as:
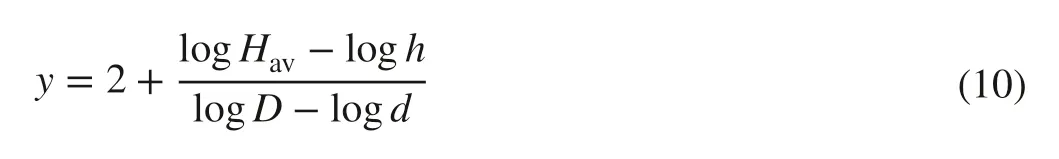
whereHavandhare values of average height (m) at the current time and the beginning of the observation period (n years ago), respectively.Dis trunk diameter at 1.3 m height at the end of the period;dis trunk diameter at 1.3 m height.
Experimental data were processed under GOSTs, the state standard adopted in the Soviet Union, which is commonly used in post-Soviet countries (State Duma 1972).
Inventories used tables of height and stem diameters for stands in the Leningrad, Arkhangelsk, and Vologda regions.Growth was determined according to GOST 18264-72 (State Duma 1972).Quality classes were based on age and height of the dominant species of the upper canopy.The classification of the quality scale is the average height Havof the stands at the corresponding age.The fractionality of the quality scale adopted in Russia is 4 m in height and ≈ 20%in stock.Quality classes were allocated as: Ia, I, II, III, IV,V, Va (Rogozin and Razin 2015).Data processing were performed using Excel 2013.
Research objects
The study on permanent sample plots or PSPs (series 5 and 6) in the Gatchinsky forest began in 1971.The size of each inventory PSPs area was 0.2 ha.The PSPs differed in treatment such as thinning and fertilization.For comparison,there was a control plot where no thinning operations were performed other than deadwood harvesting.
Both low and crown thinning regimes were used.In low thinning in pure stands, trees that were part of the lower canopy or secondary canopy were eliminated.In low thinning treatment, a single-tier stand was formed with horizontally closed crowns due to periodic felling of all stunted trees (Rogozin and Razin 2015).The crown thinning method regulates trees in the upper tier of the canopy and trees that do not meet the criteria of the class and interfere with the growth of selected species are removed.Considerable attention is paid to the best species with an even trunks in this method.Trees with large diameters and drooping crowns are removed as they interfere with the growth of the better individuals.In addition to thinning, mineral fertilizers are applied to increase the growth of large and medium-sized trees.When fertilizing middle-aged and mature pine stands,it is recommended to apply a complete mineral fertilizer(nitrogen and phosphorus 100–200 kg/ha) in the beginning,and potassium (100–150 kg/ha) after intermediate cuts and subsequently fertilize only with nitrogen (90–120 kg/ha) (in two applications at 10-year intervals) (State Duma 1984).
Series 5 was established in a drained pine stand 43 years ago.The composition of the stand consisted of a pure single-age pine plantation and less than 2% of birch.The soil type is iron-illuvial sand podzol.Series 5 consisted of three PSPs: 5–1 control, 5–2 low-thinned, and 5–3 low-thinned and double-fertilized (Table 1).Series 6 was established among pines 36–45 years ago.The stand consists of a single-age pine plantation and less than 2% of birch.The soil is humus iron podzol.Series 6 consisted of 7 PSPs (Table 1): (6–2) low-thinned, (6–3)control, (6–4) control + fertilized, (6–5) low-thinned with fertilizers, (6–7) crown-thinned, (6–8) crown-thinned, (6–9)low-thinned, which differed in the volume of trees felled(Table 1).
Natural conditions of the study area
The research was conducted in the Gatchinsky forest located 70 km south of St.Petersburg.This area is in the western district of the southern taiga subzone in the coniferous forest zone.The climate is temperate.Prevailing winds are southwestern, western, and southern.Sometimes strong winds occur causing windthrow.The terrain is a slightly undulating plain with primary soil-forming rocks, thin and young Quaternary moraines, and lake-glacial deposits.The main forest species are spruce, pine, birch and aspen.The middlequality class II positively characterizes the forest conditions of the experimental farm.
Results and discussion
Age dynamics of trees
The characteristics of permanent sample plots are presented in Table 2.The results of studying forest stand composition in series 5 showed that it consists of pure single-age pine and less than 2% spruce.For series 6, the composition contained pure single-age pine stands.The quality class increased in almost all PSPs at the time of this study as shown in Tables 1 and 2.An increase in diameter class from II to I occurred in the control plot and the control fertilized plot, while on the thinned PSPs, the quality class improved from II to Ia(see Notes, Table 2).
As shown in Table 2, the increase in the average diameter of trees to be thinned is closely related to the thinning intensity, i.e., the number of remaining trees, the less dense the stand, the higher the average diameter of the thinned portion.In PSPs 5–2 and 5–3 and PSPs 6–5 and 6–9, the densities were much lower during the thinning period than in the control PSPs (6–3, 5–1).Therefore, the average diameter of the thinned PSP is larger than the controls.Maximum diameter was recorded in the PSP with intense low thinning.The results show that the application of fertilizers without thinning (PSP 6–4) does not yield results as opposed to mixed treatment (PSP 6–5).
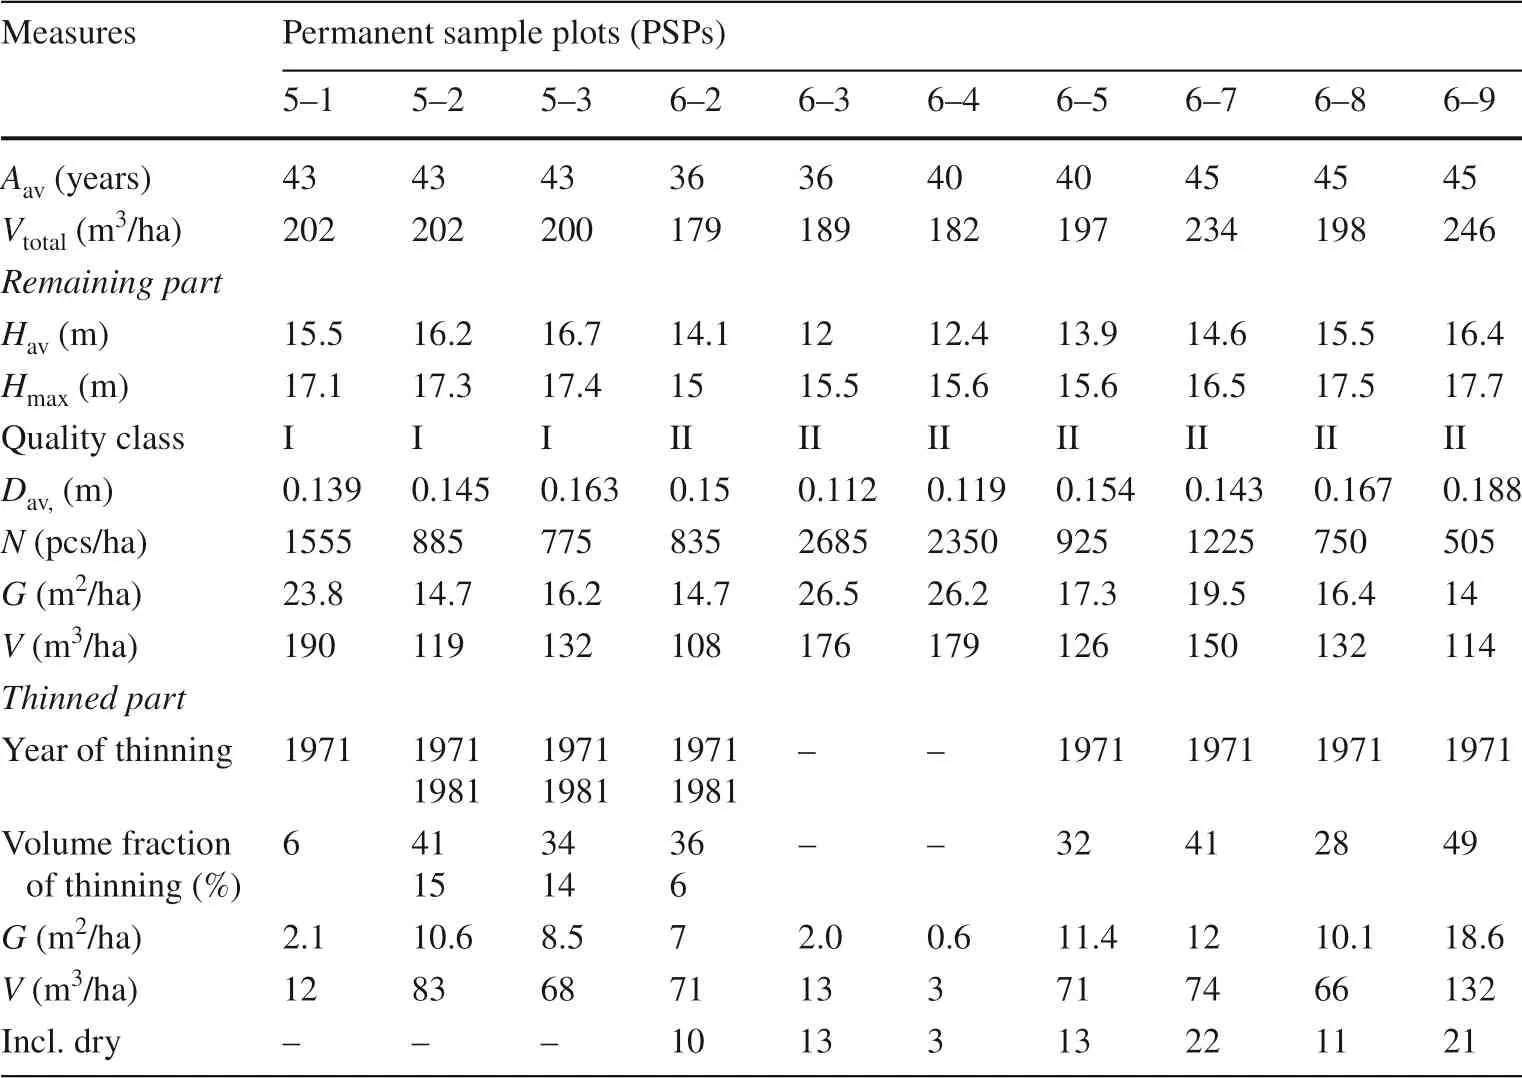
Table 1 Characteristics of permanent sample plots and subsequent thinning operations
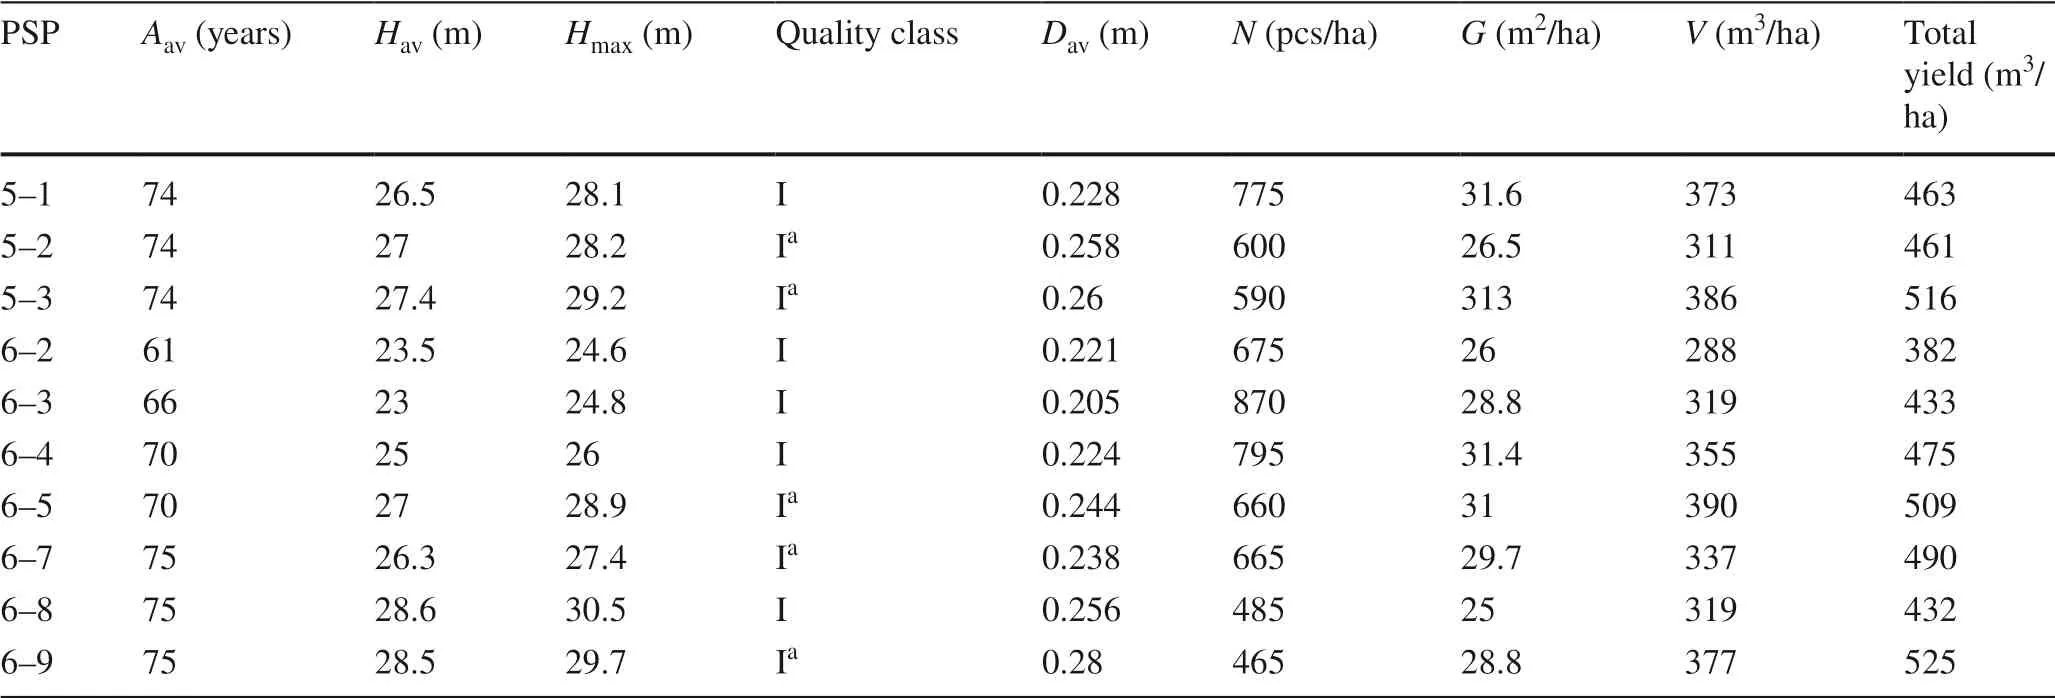
Table 2 Characteristics of sample plots
Table 2 shows that the best average and top height results correspond to the heavily low-thinned (PSP 6–8)plots where thinning was carried out together with fertilizer application (PSP 5–3).On the low-thinned plots,the absolute density of the stand was reduced to 0.5 m2/ha and restored to 0.9 m2/ha in PSPs 5–3 and 6–9, and to 0.7 m2/ha in PSP 5–2 due to double thinning treatments.A more detailed analysis of stand growth for PSPs 6–7 and 6–9 with different thinning methods can be seen in Fig.1.
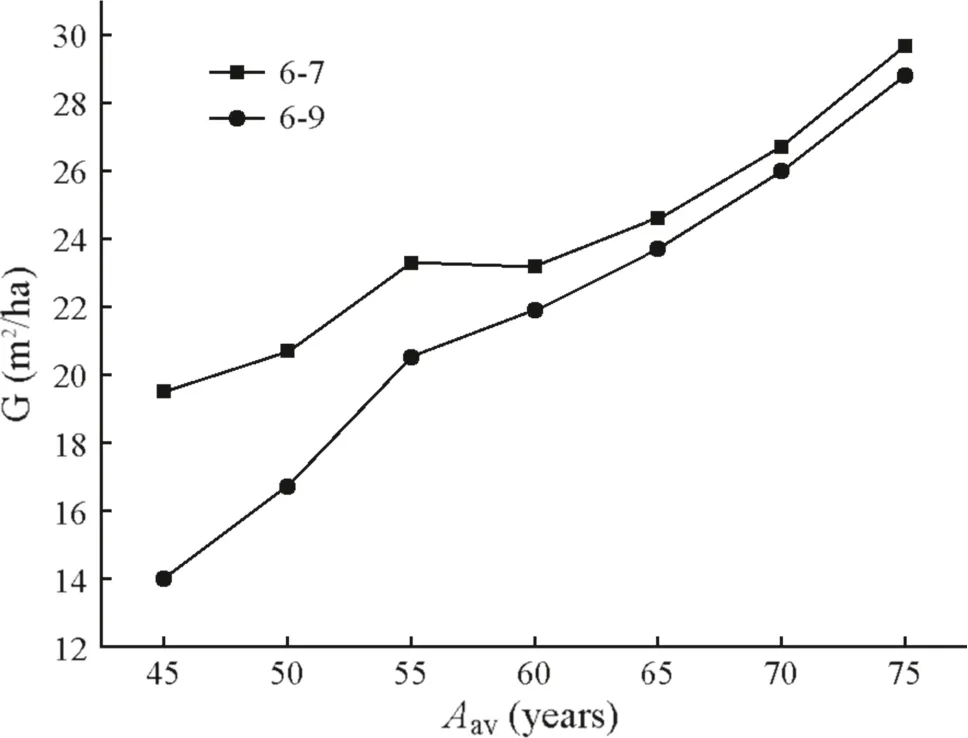
Fig.1 Absolute density (G) growth dynamics by every 5th year ( Aav is average age of stand)
Figure 1 shows that even though the basal area differed from crown-thinned PSPs by 5.5 m2/ha after intense low thinning, this difference decreased to 0.9 m2/ha by the end of the experiment.Figure 2 shows the results of the current ingrowth rate estimation of PSPs 6–5, 6–7, and 6–9.
Data presented in Fig.2 indicates that the volume increment in both the low- and crown-thinned PSPs increases in the first five years after treatment due to the decrease in the number of trees.The ingrowth in low-thinned PSPs then decreases sharply at 60 years with a subsequent rapid increase.
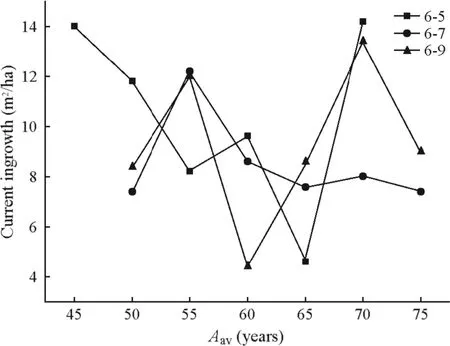
Fig.2 Change of the current ingrowth rate by years ( Aav is average age of stand)
Effect of thinning on changes in diameter classes
The data on changes in tree diameter classes in low-thinned and crown-thinned PSPs are provided in Table 3.Regardless of the technique applied, at the end of the experiment the stand consisted mainly of high diameter classes but the class was significantly reduced in such trees during growth.The change in diameter class cannot be predicted even for a 40-year-old tree.Therefore, the selection for crop trees is not valid, and crown thinning would help reduce the number of large trees (PSP 6–7).Table 4 presents the results of mortality among diameter classes for all PSPs.
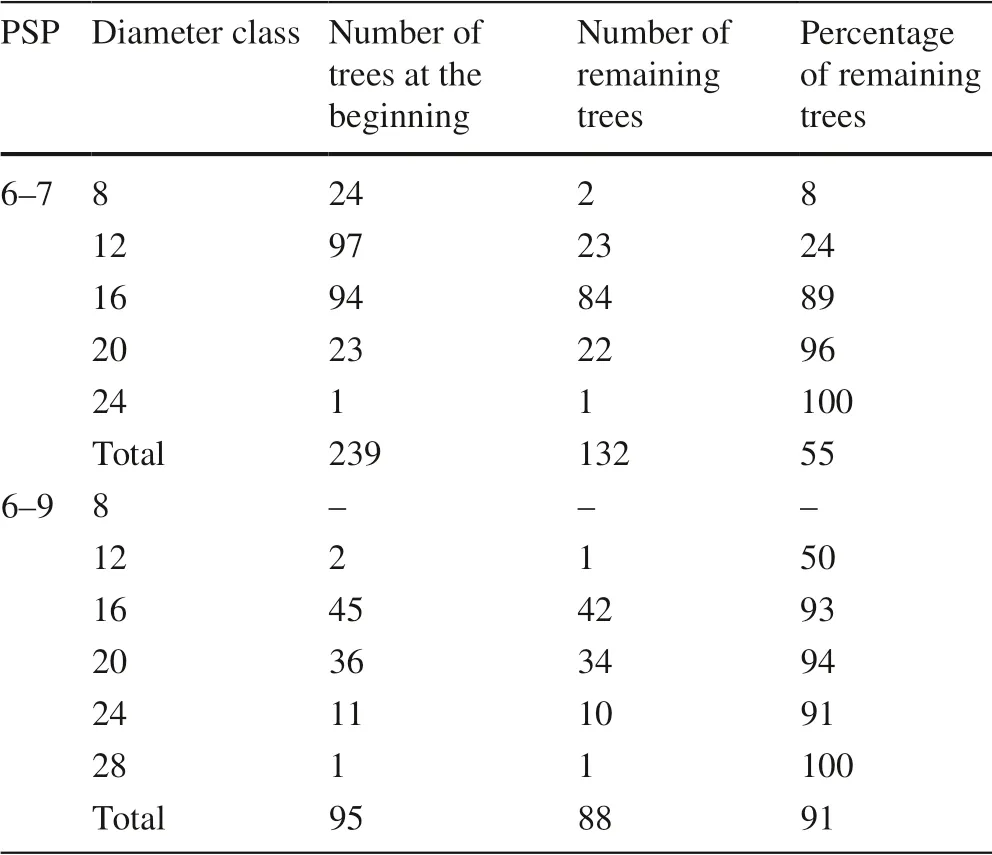
Table 3 Changes in tree diameter class in low-thinned and crownthinned PSPs
As can be seen from Table 4, mortality occurs mostly in trees in the 12th diameter class.In the low-thinned plots,mortality was higher in the 16th diameter class, amounting to 20–46% of the total stand volume.The highest mortality is observed in the control, fertilized unthinned, and crownthinned plots (6–7, 6–9).Since the low thinning technique is based on the silvicultural principle of trees selection, mortality was almost eliminated at treatment.
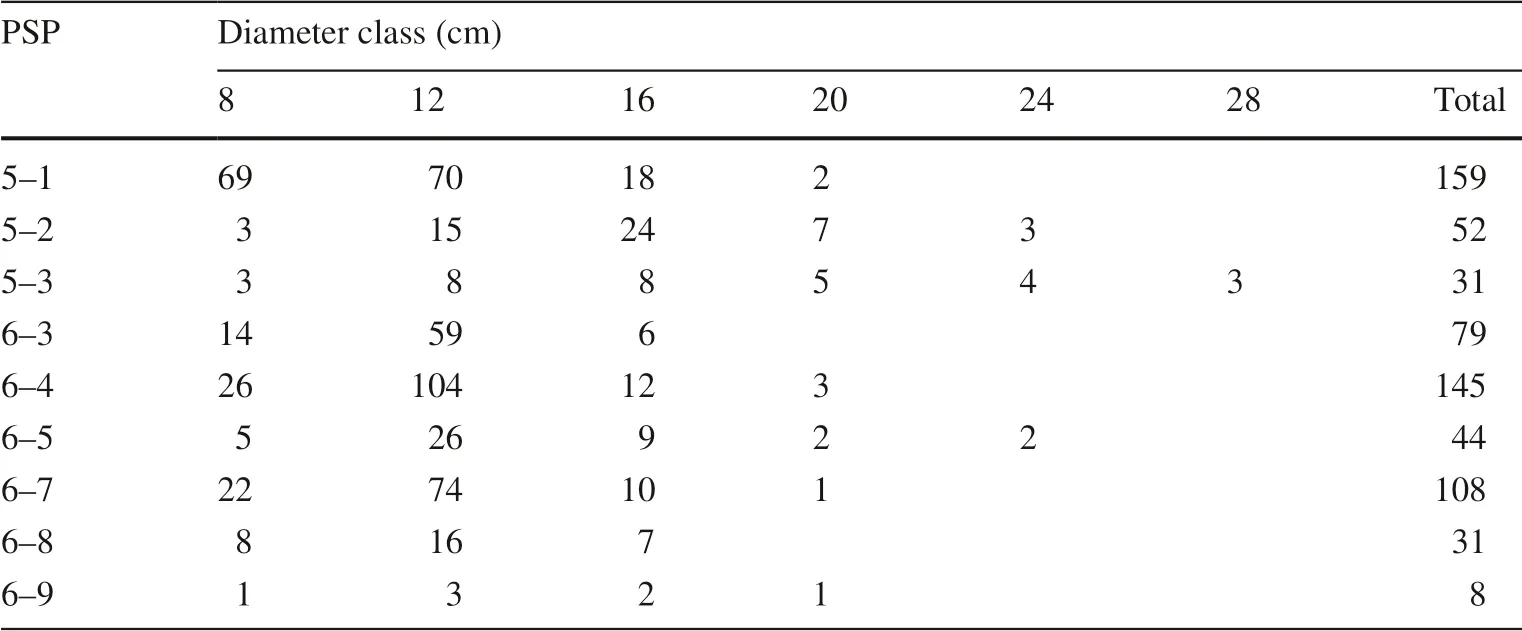
Table 4 Mortality distribution*by diameter classes
The effect of thinning on yield and productivity
The effect of thinning on overall stand yield has long been and still is a controversial issue.The total yield is the total volume of the stand and the felled trees.Productivity refers to the total yield minus mortality, i.e., the entire ordinary growing stock.
Figure 3 demonstrates the influence of stand thinning on total yield.Hence, the overall performance is for all sample plots with aging.Despite the different initial stock levels, yields are about the same at a certain age in all sample plots when the stand reaches the density typical for the habitat conditions.It occurs, for example, on strongly lowthinned and crown-thinned sample plots around 65 years.Many researchers noted similar convergence in overall yield values.
The initial stock on the sample plots was different at the beginning of the plantation.Thus, a small variation in the initial stock contributes to faster yield alignment.Noteworthy is that overall yield leveling corresponds to a natural tendency towards a mandatory balance between plants and the environment.
The initial yield oflow-thinned (PSP 6–9) and crownthinned (PSP 6–7) plots was the same, but by the end of the study, it was 14 m3/ha higher in the low-thinned plot(Fig.3 d).In the mix-treated sample plot (PSP 6–5), the yield was 34 m3/ha higher than on the fertilized control plot(Fig.3 c).
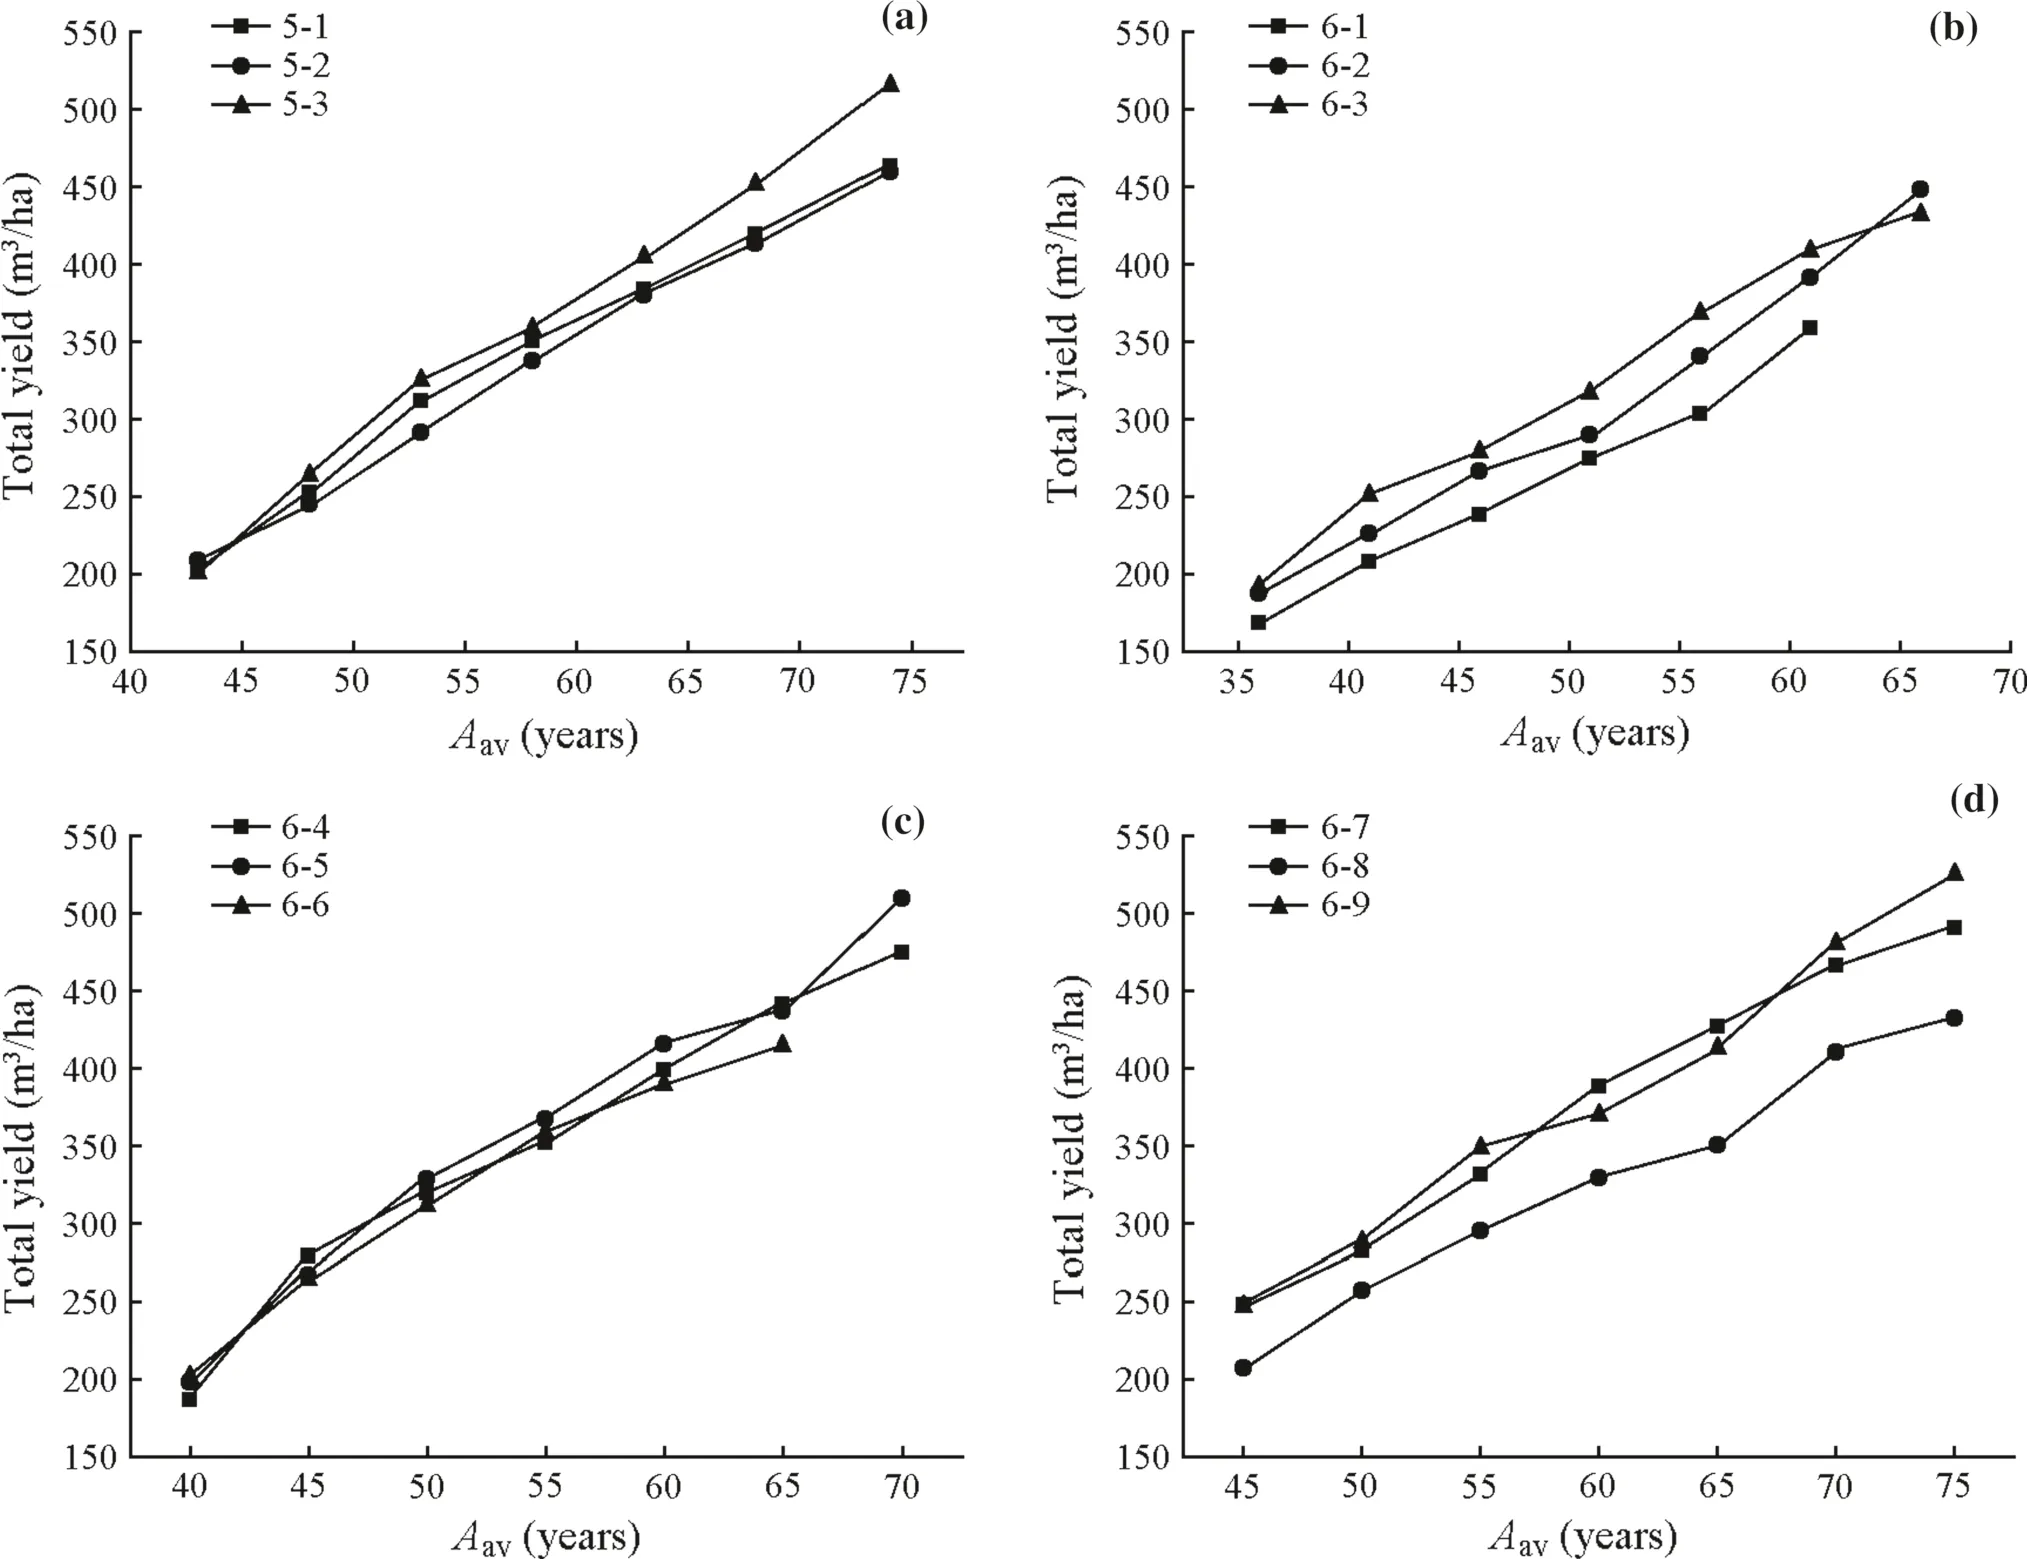
Fig.3 Age is yield dynamics on sample plots by sections ( Aav is average age of stand)
In the control (PSP 6–3) and the low-thinned plot with a double-entry (PSP 6–2), yield increased with age, and the difference was 4% higher in the treated stand at 70 years(Fig.3 b).
For series 5 (Fig.3 a), the initial yield on different sample plots is approximately the same.On the thinned fertilized(PSP 5–3) sample plot, the yield gradually increased, and by the end of the experiment, the difference was 11% more for the sample plot with complex treatment.The final yield in the plot with a double-entry (PSP 5–2) was lower than in the control (PSP 5–1) by only 3 m3/ha.
The data in Fig.3 d indicate that the overall yield increases smoothly with age in all three sample plots.At 65 years of age, the yield in a low-thinned plot was equal to that on a crown-thinned plot.However, over the next ten years, the total yield in the low-thinned plot increased and reached a 75-year difference of 35 m3/ha.At that, an increase in total yield will continue.The yield in a slightly crown-thinned sample plot is lower than in low-thinned and crown-thinned plots.
Comparing yield and productivity rates is necessary to assess the feasibility of applying high-intensity thinning(Table 5).
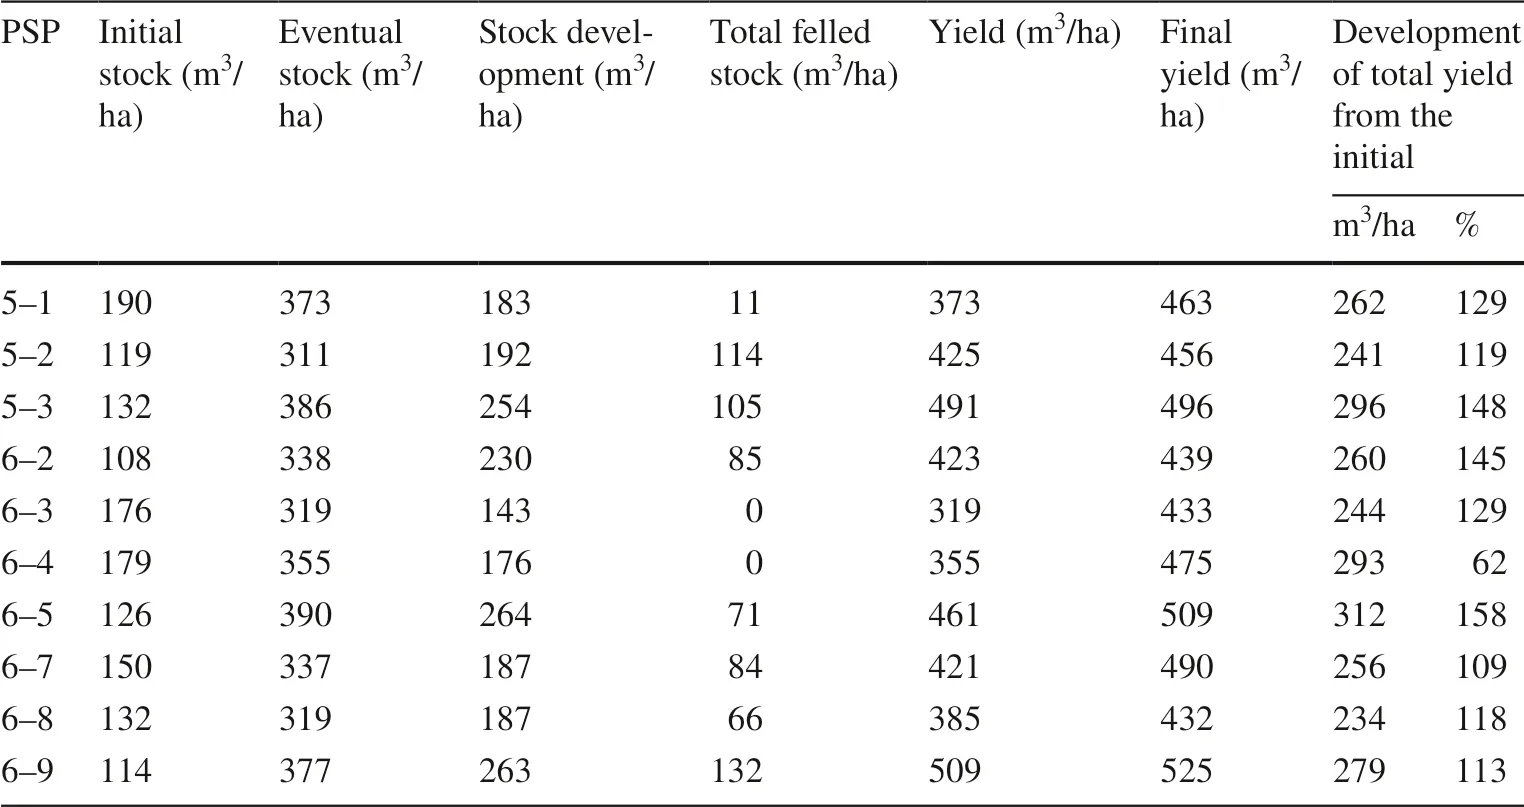
Table 5 Effect of thinning on yield and productivity
At 75 years, the plot treated to heavy low thinning (PSP 6–9) was 21% more productive and had 7% higher yields compared to heavily crown-thinned plots.Fertilization without thinning (PSP 6–4) was less effective than integrated treatment (PSP 6–5).By the end of the experiment, the yields and productivity on the sample plot with comprehensive treatment were respectively 7% and 30% higher than on the fertilized control plot.Of series 5, the highest productivity was in a trial area with comprehensive treatment.However, in the test area, productivity was lower than in the control area after two times oflow thinning.It would be better to increase the first thinning intensity and not to perform the second one.
Heavy low thinning does not influence the eventual yield.Moreover, the part of the remaining plantation with a sufficient number of stems reacts more actively to the improved growing conditions and makes better use of the nutrient resources of the environment.In all sample plots, especially those heavily low-thinned, large trees were removed in close groups with low-value trunks, branchy, knotted, and buttressed.On the other hand, the productivity of a stand is determined not so much by its structure as by the nutrient resources of the site (Kunickaya et al.2020a, 2020b; Ushanov et al.2020).
Effect of thinning on stock recovery
Estimating the influence of thinning intensity on the standing stock is required from an economic point of view as heavy thinning decreases the stock and, as a result, reduces the profitability of harvesting.
The lowest stock level after thinning was on the heavily low-thinned sample plot (Fig.4).However, by the age of 65, the stocking had levelled out.Growth in low-thinned plot then gradually increased more than in the crownthinned plot.By the end of the observations, there was a 12% increase in the low-thinned plot compared to the crownthinned one.

Fig.4 Age stock changes in crown-thinned and low-thinned sample plots
After thinning, the lowest stocking was in PSP 5–2 (double low-thinning) which could not be restored to the level of the control by the end of the observations (Fig.5).The first treatment was performed on 41% of the stock, i.e., thinning was quite intensive.Although the stock volume and productivity were not restored, the second thinning was held to 15% at the age of 53.On the mixed treated PSP 5–3, the first thinning was 34%.The following year, fertilizers were applied, and by the age of 53, the increase in productivity was restored to the level of the control plot.At this point, a second 14%-thinning was carried outwith fertilization a year later.After thinning, fertilizers were applied at the age of 68 so that the stocking levels in the control and in the sample plots were equal to that of the mix-treated plots.By the end of the research, the stock was better on mixed treated sample plots than on the controls.

Fig.5 Age stock changes on series 5 plots
Estimating current mortality is necessary to assess the expediency of applying the crown and low thinning techniques in pine plantations.The data on age-related changes in mortality are presented in Fig.6.As shown in Fig.6,mortality is higher in the heavily low-thinned sample plot(6–7) immediately after treatment.Then, mortality significantly decreases in both sample plots (6–7, 6–9).However,the mortality remains significant on low-thinned plots and equals zero in the last five years.On average, mortality is 2.6 times higher on crown-thinned plots compared to lowthinned and four times lower on low-thinned plots (6–2) with double thinning than in the control (unthinned) area (6–3).

Fig.6 Age changes in mortality rates on differently sample plots (M is the stock of the forest unit)
Effect of thinning on the merchantability of the stand
The thinning method significantly affects the size distribution (Table 6).According to the calculations in Table 6, thinning affects the distribution of the stock by size and wood value.Comparison of the wood value in 70–75 aged stands estimated at the rates of yield reveal that the most significant inventory value is the result of the complex treatment on PSP 5–3.This is followed by the low-thinned PSP 6–9 and mixed-treatment PSP 6–5 plots.It can be explained by a sizeable standing stock and particularly, an extensive stock of large and medium wood.The lowest inventory cost was recorded for the PSP 6–3 control plot.
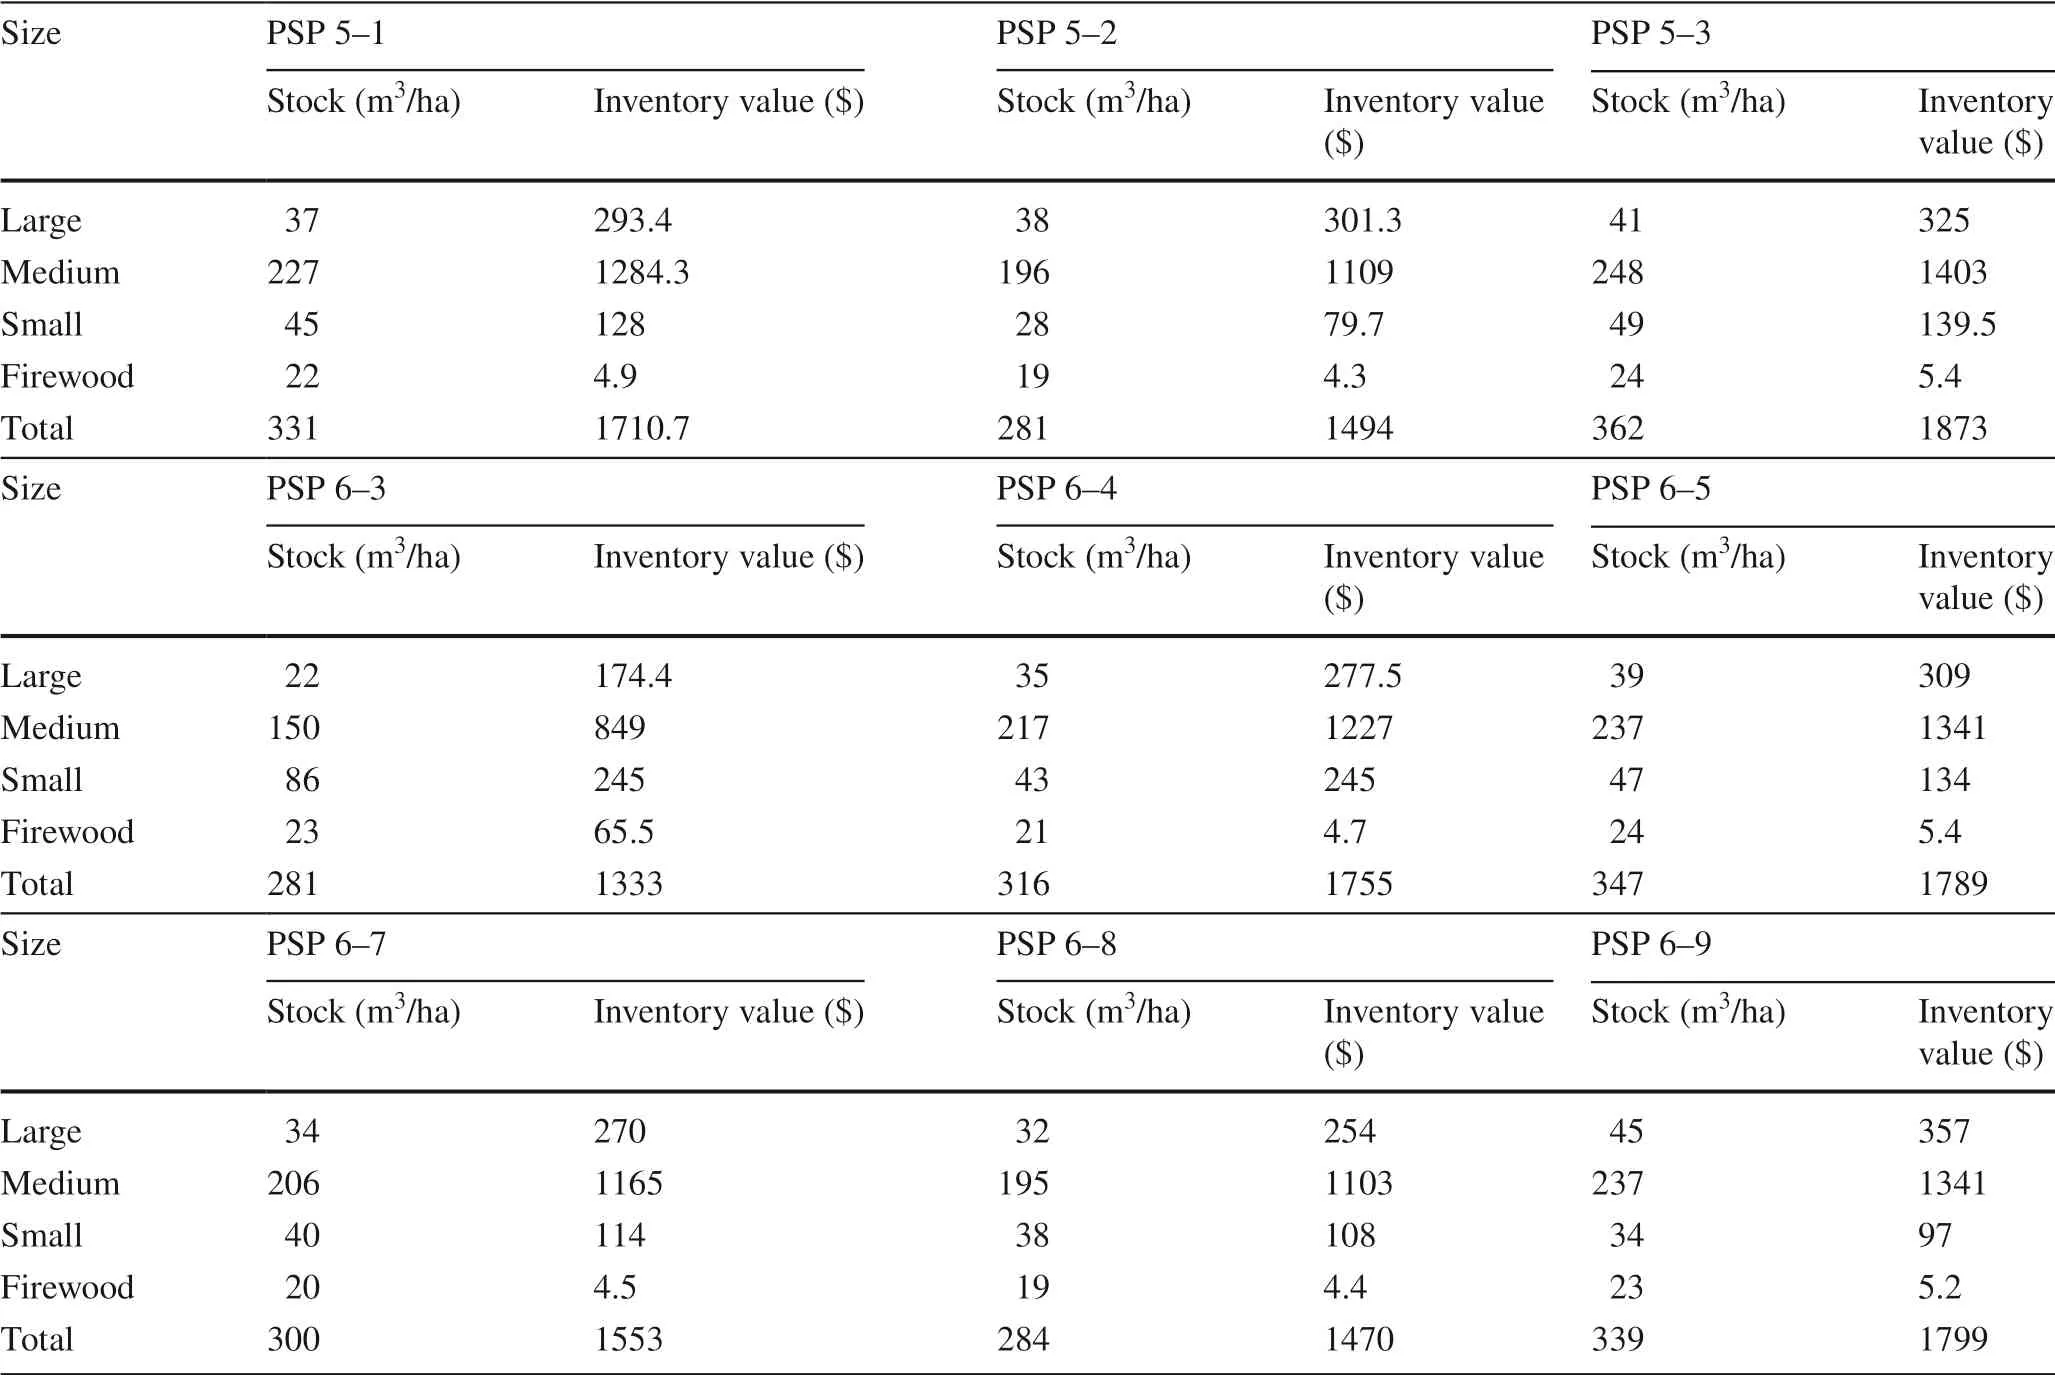
Table 6 Valuation of pine stock volume by PSP (30 years)
Discussion
Improving the quality of the wood at harvest increases its attractiveness for consumers–timber processing companies of various profiles (Grigorev et al.2019; Kunickaya et al.2019a, 2019b).
One of the research objectives was to study the processes of tree formation, changes in diameter class during growth,and the effect of different treatment methods on these processes.An essential characteristic of a growing stock structure is the diameter classes of trees.
After processing the results in this study, it has been established that diameter distribution is subject to the ordinary law of distribution.Immediately after treatment,distribution on these PSPs was almost even.However, it significantly increased in PSP 6–7 after five years, while this increase was insignificant in PSP 6–9.The increase in diameter class distribution in PSP 6–9 was smooth and varied from 0.15 to 0.36, while in PSP 6–7, a sharper change was observed.By 60 years, it slightly decreased and then increased again by the end of the experiment (Fig.7).Smaller diameter dispersion allows the logger to receive a more homogeneous assortment of round timber during the crop logging.
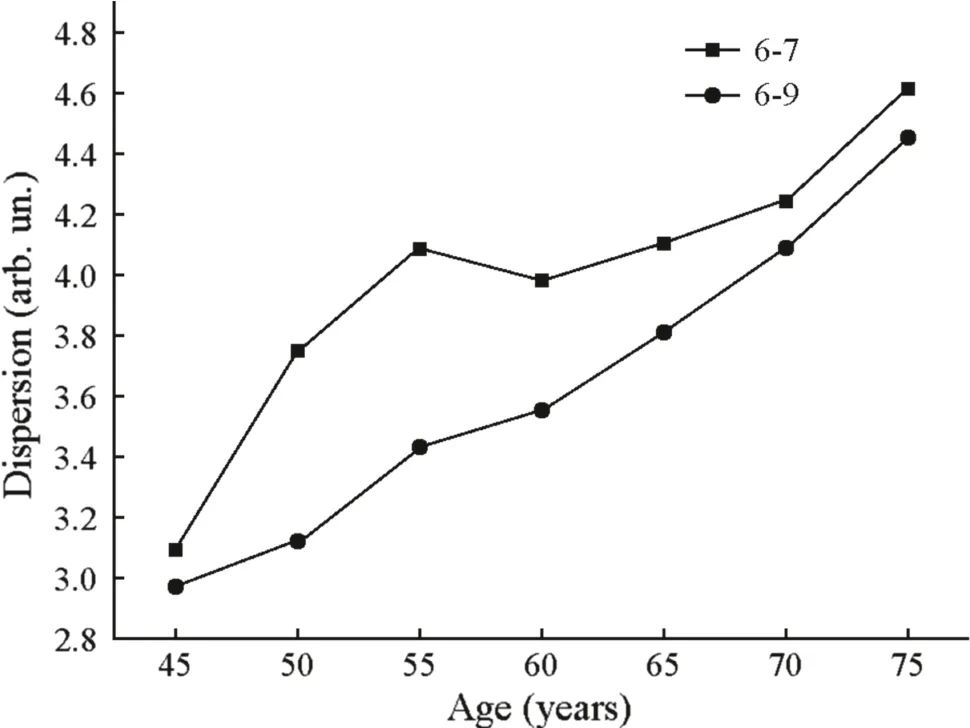
Fig.7 Dispersion by years (arb.un is arbitrary unit)
Conclusions
Thinning in a 30-year-old stand with the proper selection of trees for felling did not decrease the overall yield, final density, and stand volume.In fact, several positive consequences were observed: an improvement in the stand merchantability, shorter stand regeneration period, and simplified thinning programs.The crown thinning method, however, will inevitably lead to deterioration in the quality of crop trees and increase mortality.
The results of studying changes in diameter classes both in the untreated control and thinned plots highlight the injudicious of preliminary crop tree selection.Thinning in a pine stand does not reduce the overall yield and improves the quality of stands.All indicators of growing stock after comprehensive treatment are significantly improved.A complex treatment regime in pine stands has a positive effect on tree growth, while fertilization without thinning does not yield such results.Information from this research can be used to develop practical recommendations to optimize the thinning treatment of pine stands and assess fertilizer efficiency.
AcknowledgementsThe work was carried out within the confines of the scientific school “Advances in lumber industry and forestry”.
杂志排行
Journal of Forestry Research的其它文章
- Journal of Forestry Research
- Reversibly photochromic wood constructed by depositing microencapsulated/polydimethylsiloxane composite coating
- Surveillance of pine wilt disease by high resolution satellite
- Adaptation of pine wood nematode, Bursap helenchus xylophilus,early in its interaction with two P inus species that differ in resistance
- Pine wilt disease detection in high-resolution UAV images using object-oriented classification
- Transcriptome analysis shows nicotinamide seed treatment alters expression of genes involved in defense and epigenetic processes in roots of seedlings of Picea abies