The effects of dilution gas on nanoparticle growth in atmospheric-pressure acetylene microdischarges
2022-09-06XiangmeiLIU刘相梅XiaotianDONG董晓天HongyingLI李洪影andShuxiaZHAO赵书霞
Xiangmei LIU (刘相梅),Xiaotian DONG (董晓天),Hongying LI (李洪影) and Shuxia ZHAO (赵书霞)
1 School of Science,Qiqihar University,Qiqihar 161006,People’s Republic of China
2 School of Physics,Dalian University of Technology,Dalian 116024,People’s Republic of China
Abstract A two-dimensional multi-fluid model is developed to investigate the effects of dilution gas on microplasma properties and nanoparticle behavior in atmospheric-pressure radio-frequency acetylene discharges.The percentage of dilution gases (argon and helium) percentage varied from 0% to 90%,with the pressure kept constant.Simulation results show that the dilution gas percentage has a significant influence on the spatial distributions of the electron density and temperature,as well as on the formation of nanoparticles in acetylene microplasmas.With increasing dilution gas percentage,the electron density profile changes continuously from being high at the edge to high in the center.A mode transition from a mixed discharge mode with both α regime and drift-ambipolar regime into α regime occurs,which is associated with a sudden decrease in the electron density of the presheaths and an increase in the electron temperature of the bulk plasma.The mode transition point corresponds to the lowest number density ratio of hydrocarbon ions to acetylene.The highest number density ratio is observed at a dilution percentage of 90%,and causes more effective nucleation and coagulation of nanoparticles.Furthermore,owing to the high ionization potential of helium,the transition point moves to a larger dilution gas percentage inC 2 H2/He microplasmas.Finally,the growth of nanoparticles via coagulation is studied.
Keywords: dusty plasmas,acetylene microdischarges,dilution gas effects,mode transition
1.Introduction
Hydrogenated amorphous carbon (a-C:H) coatings with extraordinary material properties are widely used in various industrial applications,including tribological materials [1],field emission cold cathodes for flat-screen displays[2],passivation layers[3],and wear-resistant coating[4].Amorphous carbon thin films are usually deposited using the plasma-enhanced chemical vapor deposition (PECVD) technique through the decomposition of methane (CH4) or acetylene (C2H2) in low-pressure systems.Recently,there has been increasing interest in using atmospheric-pressure plasmas to deposit amorphous carbon thin film[5,6].These plasmas are low-cost and easy to integrate into the in-line production process.In atmospheric-pressure capacitively-coupled reactive gas discharges,a great variety of microplasmas have been reported due to their exciting properties,including high plasma density,highly energetic electrons,and non-equilibrium characteristics [7-13].Microplasmas are increasingly used for thin film deposition,etching,and plasma catalysis [14-18].
Dust particle formation is an important phenomenon in PECVD reactors that limits the usability of equipment and the film growth rate.This problem is particularly prominent in the microelectronics industry,in which dust particle turns out to be the major source of yield loss.However,in certain material science applications,dust particle formation is considered beneficial [19,20].In amorphous carbon thin films manufacturing,the formation of dust particles can improve electron emission efficiency,which is useful in the production of field electron emitters[21].Considering the important applications of such particles in materials processing,comprehensive research on the formation,growth,and transport mechanisms of dust particles in atmospheric-pressureC2H2orCH4microplasmas is greatly needed.C2H2is usually taken as the example in investigations of hydrocarbon discharge chemistry,since it can produce more highly polymerized ions and form dust particles more easily thanCH4[22].
The initial stage of dust particle formation in low-pressure C2H2discharges has been well understood [22,23],but insufficient research has been done on atmospheric-pressure hydrocarbon dusty plasmas.The formation,growth,and transport mechanisms of nanoparticles in such conditions are not well understood.To date,several experimental studies on the dust particles behavior in atmospheric-pressure discharges have been carried out.Cole et al[24]investigated nanoparticle production using a dielectric barrier discharge plasma system.They observed that the reactor volume and gas flow rate have a significant impact on the nanoparticle production rate and its concentration.The synthesis of amorphous carbon nanoparticle was investigated by Barankin et al [19].They observed that the nanoparticle generation rate increases with the precursor concentration and plasma power.By using mass spectrometric measurement,Herrendorf et al [25]examined the formation of poly-acetylenes.The results showed that the growth of nanoparticles results in a periodic behavior of plasma properties.However,these experiments cannot detect the small particles during early coagulation stage owing to the diagnostic limit.Therefore,the objective of this article is to further understand the growth of nanoparticles and their transport mechanisms.In order to obtain a stable,capacitive discharge at atmospheric pressure,helium and argon dilution gases are usually fed into the discharge chamber [26,27].A comprehensive study of the effects of these dilution gases on the properties of microplasmas and the behavior of nanoparticles is now necessary.
More than 50 different species and hundreds of chemical reactions are involved inC2H2discharges [28],and thus the fluid model is an excellent choice with which to describe the first step of dust particle formation (nucleation).The step of rapid growth by coagulation is described by an aerosol dynamics model,for which a detailed description is provided in section 2.Section 3 presents the numerical simulation results forC2H2discharges,as well as a discussion of the effects of dilution gas on the particles densities and electron temperature.Finally,a summary of the simulation results is given in section 4.
2.Model description
2.1.Fluid model
The fluid model is introduced to describe the behavior of all particles j,including neutral gases,radicals,electrons,ions and nanoparticles.The particle densitynjand flux Γjare described by the continuity equation and the drift and diffusion approximation of momentum conservation equation,

withμjthe mobility,Djthe diffusion coefficient,andSjthe source and loss terms of particles j.Since the mass of the ions is much larger than that of the electrons,the effective electric fieldEeff,iis introduced instead of the electric fieldEin equation (1).
The electron temperatureTeis calculated from the electron energy balance equation

whereΓeis the electron flux andΓwis the electron energy density flux.Swrepresents the electron energy loss.The temperatures of the ions and neutral gases are assumed to be constant,and thus no energy balance equations need to be incorporated.
Finally,the Poisson equation is incorporated to ensure the self-consistency of the model,

withni,ne,andndthe ion,electron,and dust particles densities,respectively,andε0the vacuum permittivity.φis the potential andQdis the charge of the dust particles.
The first stage of particle formation (nucleation) is mainly described by a series of polymerization reactions between C2nH−(C2nH−2) andC2H2.Therefore,more than 50 different species are involved,such asH2CC−,C2H−,C4H−,C6H−,C8H−,C10H−,C12H−,CH+,C2H+2,C4H+2andC4H−2.Since the polymerization reactions cannot be described for an unlimited number of anions,reactions are included only for anions containing 12 carbon atoms(mostly C12H−).These are considered the main source of nanoparticle coagulation with a given radius.
The transport of the nanoparticles is dominated by electrostatic,ion drag,neutral drag and thermophoresis forces[29].It is assumed that the neutral drag force is balanced with the sum of the electric field,ion drag and thermophoresis forces.The nanoparticle fluxΓdcan then derived as a drift and diffusion equation

withDdthe diffusion coefficient andμdthe mobility of a nanoparticle.Eeffis the effective electric field,md,rd,andνmdare the mass,radius and momentum loss frequency of the nanoparticle,respectively,andkTis the thermal conductivity.vthrepresents the average thermal velocity ofC2H2andvsthe mean ion velocity.bcis the collection parameter andπb/2is the impact parameter,whose deflection angle is π/2,Γ is the Coulomb logarithm.
2.2.Aerosol dynamics model
The second stage of particle formation(coagulation)is described by an aerosol dynamics model[30],in which dust particles can grow quickly from several to tens of nanometers.The nanoparticle density in the volume range ofvtov+dv,n(v),can be calculated from the general dynamic equation [31],

In equation (5),the formation of nanoparticles in the volume range of(v,v+dv)is obtained from the first term on the righthand side,and the loss of nanoparticles is calculated from the second term,withβ(u,v) the coagulation frequency.The third term describes the formation of new particles through the nucleation model,which creates a self-consistent coupling between the multi-fluid model and the aerosol dynamics model.J0(v)is the formation rate of new particles,andδ(v−v0)=1.0whenv=v0.
In our calculation,the volume domain is divided logarithmically into 40 sections,and includes particles with diameters ranging from 1 to 50 nm.During each coagulation step,the transport and charge of each volume section are determined simultaneously.
2.3.Numerical method
In the plasma module,the plasma properties are solved selfconsistently by the particle continuity,momentum,electron energy,and the Poisson equations.The first stage of particle formation (nucleation) is implemented in the plasma module by a detailed chemical kinetics scheme.The times step is set at 7.4 × 10⁻¹²s.Since the masses of nanoparticles are much larger than those of ions,a larger time-step (7.4 × 10⁻⁸s) is introduced in the nanoparticle module,which includes the calculation of the growth,transport and charging of nanoparticles.Therefore,two separate calculation periods are used to describe dusty acetylene discharges.
An iterative process couples two calculation periods.Firstly,the discharge dynamics are calculated over a number of RF cycles,during which the nanoparticles are assumed to be immobile.Then in the second calculation period,the growth,charging and transport of nanoparticles are calculated by using the time-averaged electric field,positive ion and electron fluxes.The calculated densities of nanoparticles are coupled to Poisson equation.Finally,the convergence of the fluid model is achieved after 500 RF periods.
2.4.Boundary and initial conditions
The boundary conditions for this fluid model are given as follows:the electron flux at the electrodes and walls is defined asand the electron energy flux is given aswherevth,eis the electron thermal velocity,and the reflection coefficientΘ=0.25.The negative ion and nanoparticle fluxes at the electrodes and walls are set to zero,while the gradient of positive ion flux at the electrodes and walls is set to zero.
The initial conditions for this fluid model are given as follows: the primary particle density is set to 1.0 × 109cm−3and the quasi-neutral conditions are required,the particle velocity is set to zero,and the electron temperature is set to 3 eV.
3.Results and discussion
Atmospheric-pressureC2H2microplasmas are generated using an axisymmetric reactor (as shown figure 1),in which the upper electrode is connected to a voltageV=V0sinωt,and the lower electrode is grounded.The voltage amplitudeV0=100 V,and the frequencyf=13.56 MHz.The neutral gas flows in/out through the gap between the upper/lower electrode and the wall.The neutral gas and ion temperatures are set to 300 K,and the total pressure is 100 Torr.Our primary concern in this work is the effects of the type of dilution gas (Ar or He) and its percentage on properties of C2H2microplasmas and nanoparticle growth.The percentage of dilution gas varies from 0% to 90%.
In a capacitively-coupled radio-frequency discharge,the secondary electrons are not considered,so the results are limited to drift-ambipolar (DA) operation regime and α regime,this is an effective assumption for the conditions considered[32].Note that,DA regime plays a leading role in sustaining the discharges in atmospheric-pressure electronegative plasmas,since the electronegativity is increased as a function of pressure due to enhanced electron attachment.DA regime presents a strong drift electric field in the discharge center and an ambipolar field at the sheath edges.
3.1.Influence of Ar
Figure 2 shows the spatial distributions of the electron density for different dilution gas percentages.We observe that,in pureC2H2microplasmas,the electron density exhibits two peaks of 5.0 × 1011cm−3near the presheaths,while a much lower value of 2.5 × 1011cm−3is observed in the bulk plasma,owing to the strong drift electric field in the discharge center.As the dilution gas percentage increases,the discharge is maintained in a mixed discharge mode with both α regime and DA regime(DA/α).We can see that the electron density near the presheaths decrease sharply from2.7× 1011to 3.5 × 1010cm−3as the dilution gas percentage increases from 40%to 60%.This implies that a mode transition from DA/α regime into α regime occurs,which is accompanied by a sudden decrease in electron density near the presheaths.The decrease of electron density significantly weakens the electron attachment,thereby reducing the electronegativity of plasma.Thus,DA regime is suppressed while α regime is enhanced as the dilution gas percentage increases.It is also observed that,the electron density profile changes from being high at the edge to being high in the center as the dilution gas percentage increases,which confirm that the mode transition occurs.Good uniformity can be observed at a dilution gas percentage of 90%,as is expected based on the definition of the nonuniformity degree for the particle density [33].
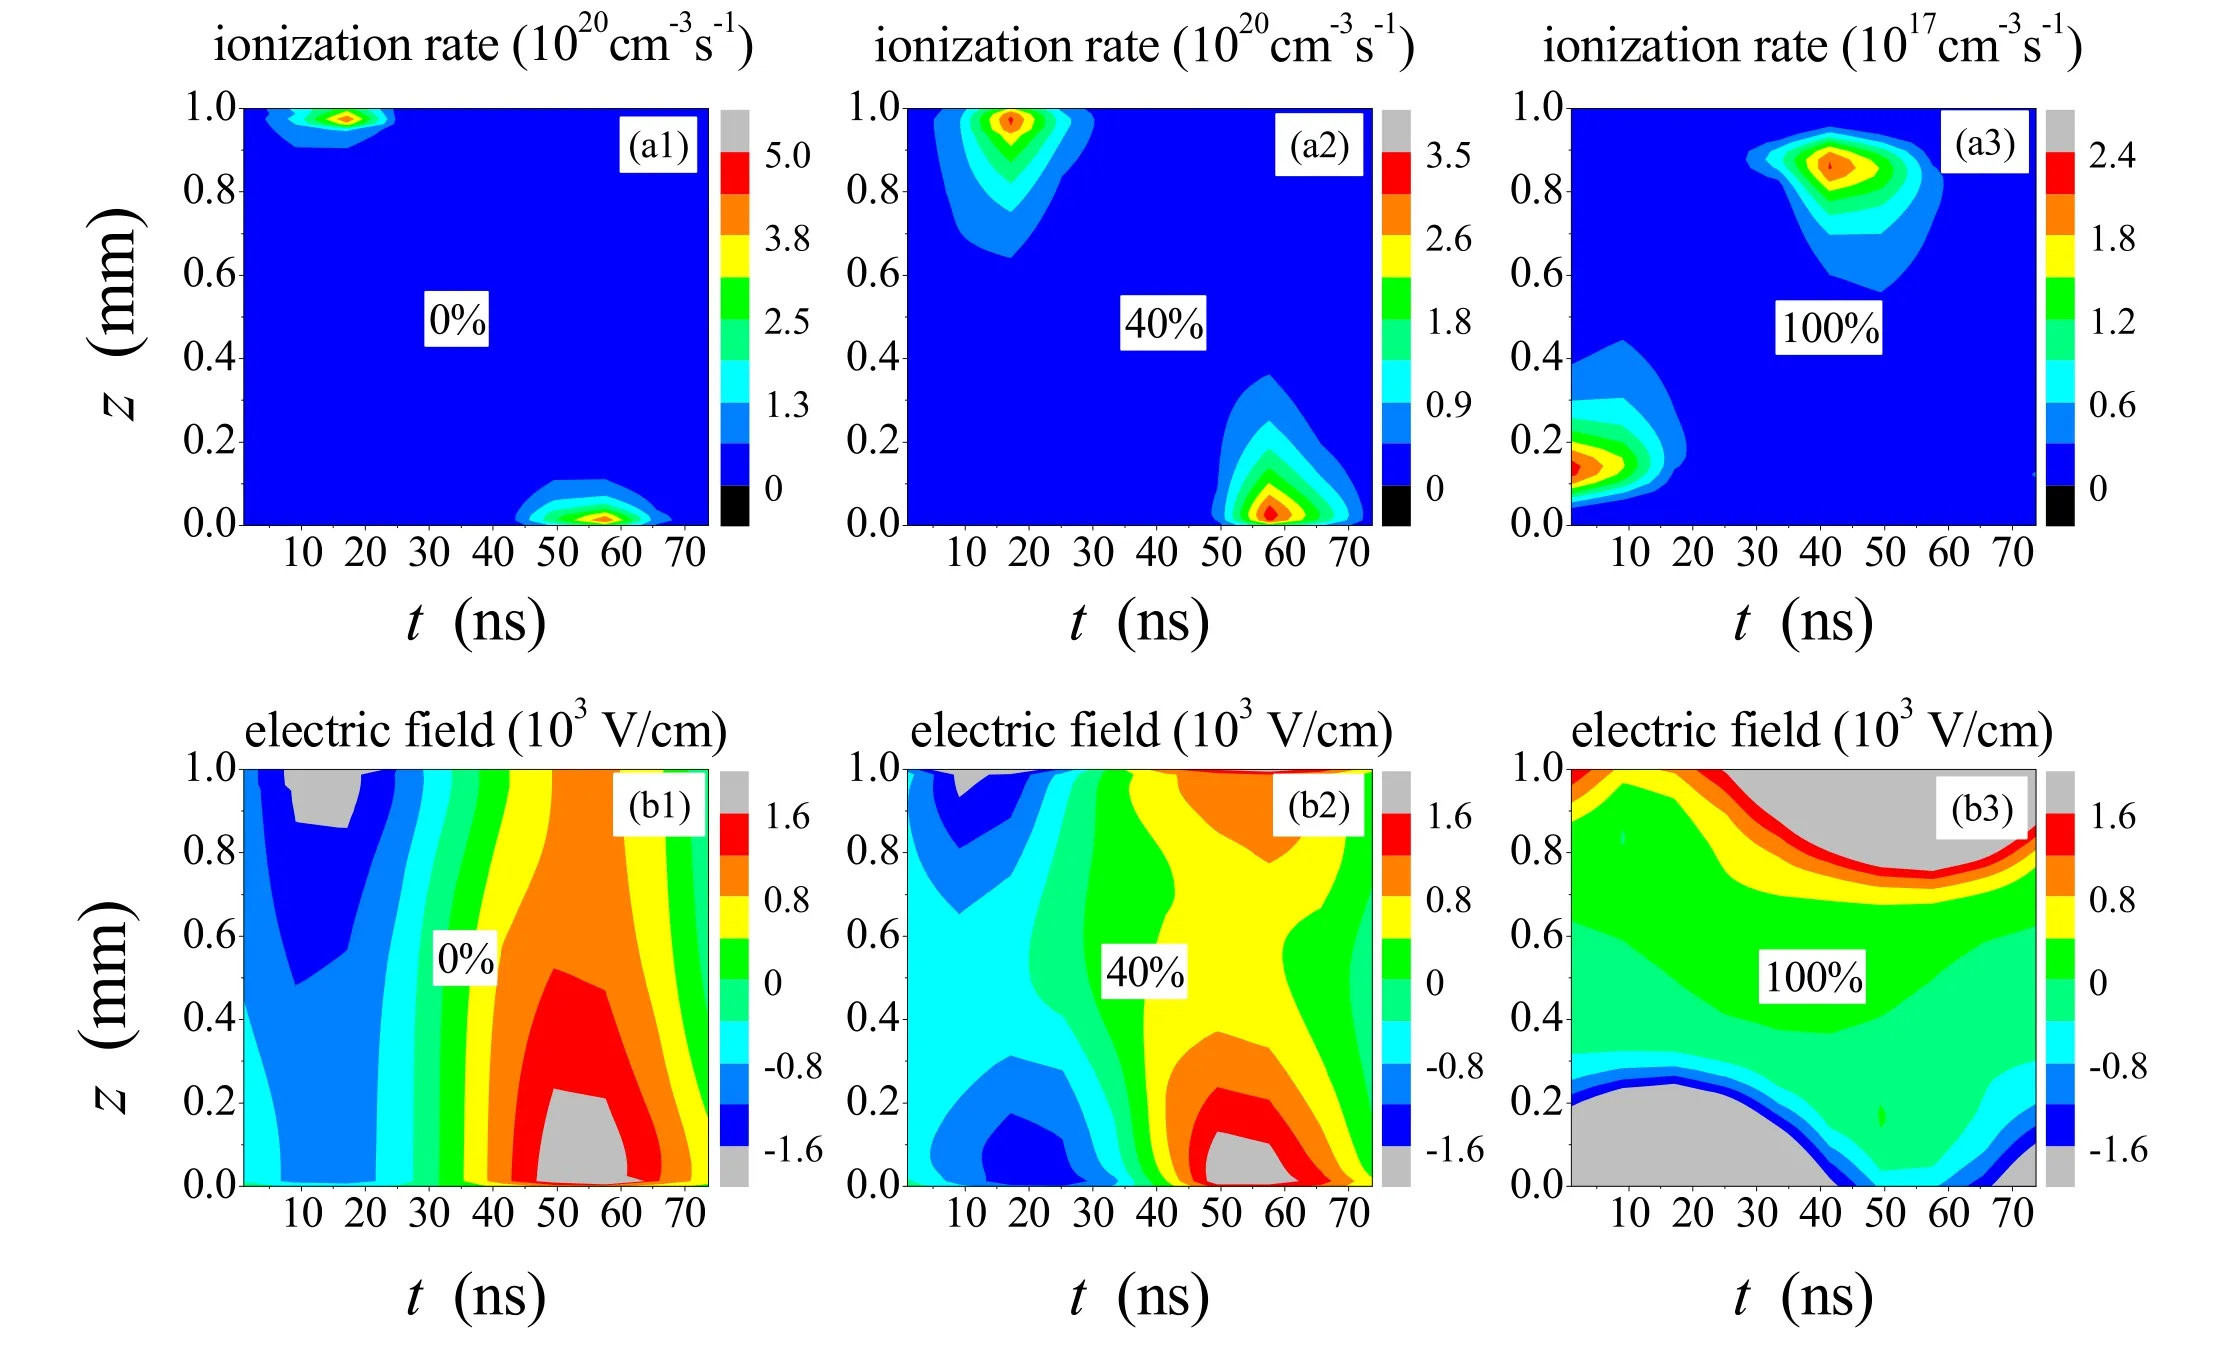
Figure 3.The spatiotemporal distributions of ionization rate (a) and electric field (b) for different dilution gas percentages.
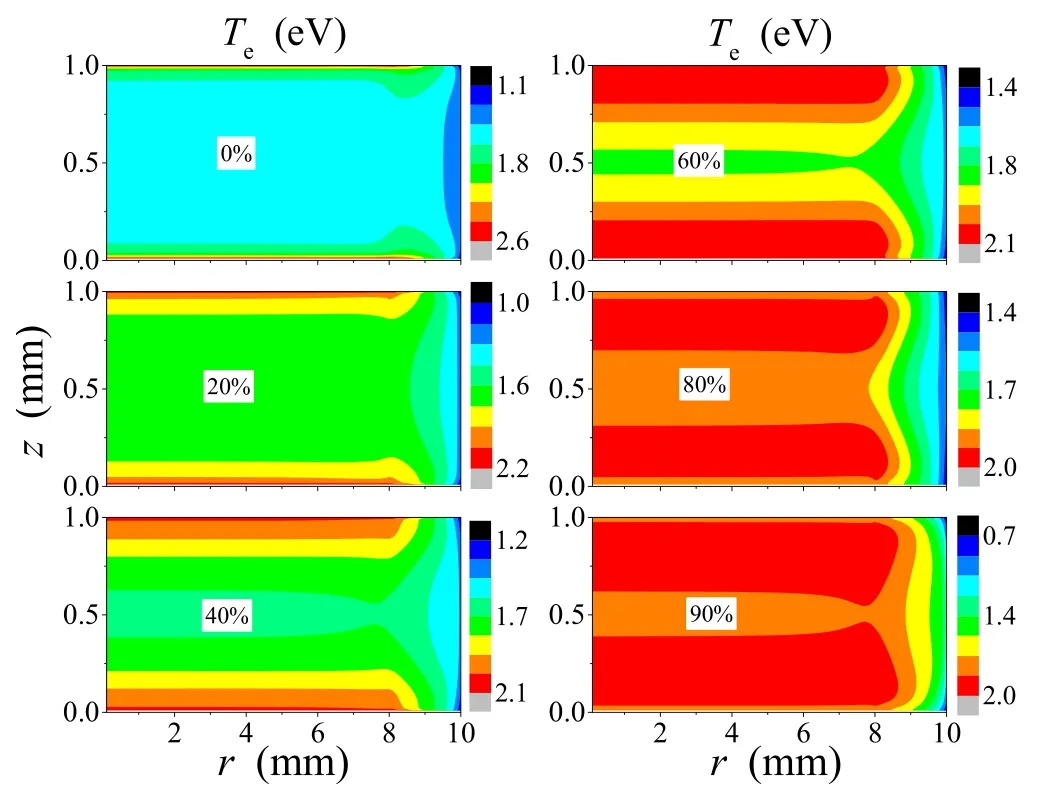
Figure 4.The spatial distributions of electron temperature averaged over one RF cycle for different dilution gas percentages.
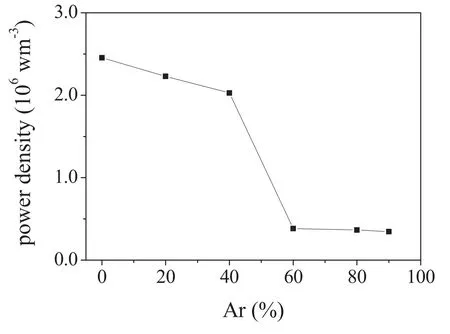
Figure 5.The power density as a function of the dilution gas percentage.
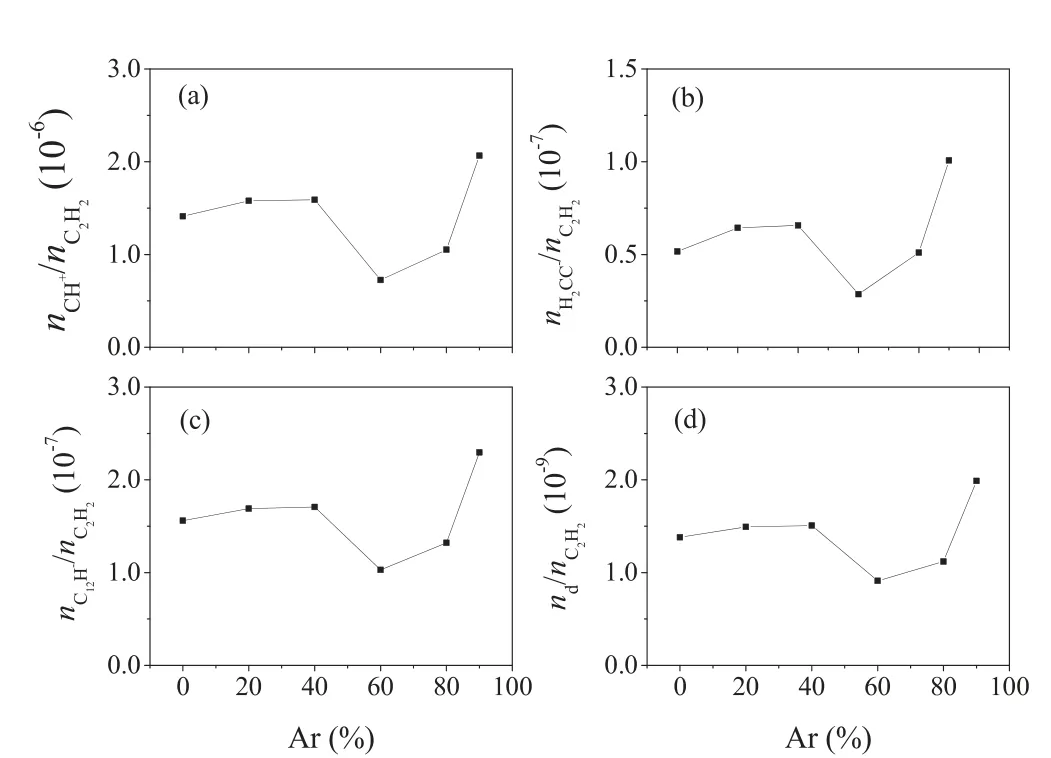
Figure 6.The dependence of number density ratios of (a) CH+,(b) H2 C C−,(c) C12H −and (d) nanoparticle toC 2 H2 on the dilution gas percentage.
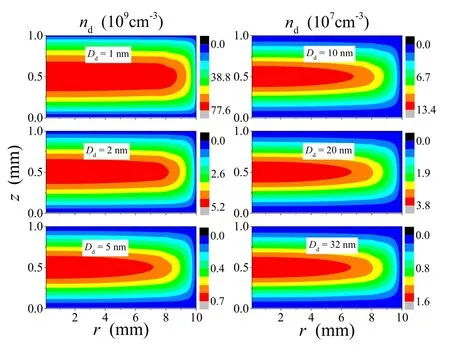
Figure 7.The spatial distribution of nanoparticle density averaged over one RF cycle for different diameters,with the dilution gas percentage of 90%.
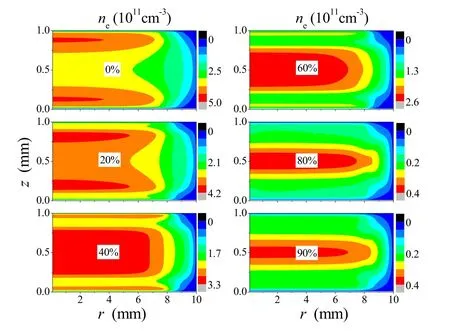
Figure 8.The spatial distributions of electron density averaged over one RF cycle for different dilution gas (He) percentages.
To better understand the mode transition phenomenon,the spatiotemporal distributions of electric field and ionization rate at the dilution gas percentages of 0%,40%,and 100%are shown in figure 3,which corresponds to three different regimes.As we can see from the first column of figure 3,the sheath thickness is very small,the strong drift and ambipolar electric field is presented in the discharge center in pureC2H2microplasmas,showing the characteristics of DA regime.By increasing the dilution gas percentage,the drift and ambipolar electric field in the discharge center decreases.Under the effect of drift and ambipolar electric field,the ionzation rate is high in the bulk plasma in pureC2H2microplasmas,and it moves towards the opposite electrode with the increase of dilution gas percentage.Thus,the mode transition from a pure DA regime to a hybrid combination of DA and α regime is firstly induced,and then the mode transition from DA/α regime into α regime occurs.We can also observe that the ionization rate inC2H2discharge is three orders higher than that in Ar discharge.This is because the local ionization rate is presented in the first and second column of figure 3,where the electron density and temperature are highest.On the other hand,C2H2is a reactive gas,the ionization rate inC2H2discharge is much higher than that in Ar discharge.
The spatial distributions of electron temperature for different dilution gas percentages are shown in figure 4.We can see that the dilution gas percentage has a dominant effect on the electron temperature profile.In pure acetylene discharges,a higher electron temperature is observed at the upper and lower electrodes,while a much lower value is seen in the bulk plasma,showing once again the characteristics of DA regime.As the dilution gas percentage increases,the peak of electron temperature gradually moves to the bulk plasma,which also reduces the electron temperature at the electrodes.Note that the electron temperature in the bulk plasma increases only slightly when the dilution gas percentage is less than 40%,then experiences a sudden increase from 1.6 to 1.87 eV when the dilution gas percentage increases from 40% to 60%,and finally remains around 1.9 eV.Thus,the mode transition is also associated with a sudden increase in the electron temperature in the bulk plasma.
To better understand the effect of the dilution gas percentage on the transition point,the power density as a function of the dilution gas percentage is shown in figure 5.It can clearly be seen that the power density decreases linearly with the dilution gas percentage for percentages of less than 40%.When the dilution gas percentage increases to 60%,the power density decreases sharply from 2× 10⁶to3.5× 105W m−3,which leads to a sudden decrease in the electron density.Eventually,for dilution gas percentages exceeding 60%,the power density becomes almost constant,resulting in a slight decrease in the electron density.
To assess the role of the dilution gas percentage in the properties of theC2H2microplasma and the behavior of nanoparticles,figure 6 shows the dependence of the number density ratios of CH+,H2CC−,C12H−,and nanoparticles to acetylene on the dilution gas percentage,for a particle diameter of 5 nm.CH+and H2C C−are the primary positive and negative ions,C12H−is the largest anion in the nanoparticle nucleation process,and nanoparticles of 5 nm are chosen as the example for the coagulation process.As we can see,the lowest number density ratios of CH+,H2CC−,C12H−and dust particle to acetylene are observed at the transition point(60%),while the highest number density ratios are seen at a dilution gas percentage of 90%.These findings imply that choosing an appropriate dilution gas percentage can dramatically increase the rate of electron impact ionization and dissociation attachment for acetylene,thereby promoting the nucleation of nanoparticle,and ultimately accelerating the coagulation of the nanoparticles,especially when the dilution gas percentage is 90%.The transition point has a crucial influence on materials processing,and should be avoided to obtain more nanoparticles during hydrogenated amorphous carbon thin film deposition.In some other microelectronics applications,the transition point should be used to reduce contamination with dust particles.
Finally,the nanoparticle number density grows by coagulation at a dilution gas percentage of 90%,which corresponds to the largest number density ratio,as seen in figure 7.As we can see,the nanoparticles density is mainly distributed in the bulk plasma.The nanoparticle transport is mainly affected by the ion drag force and the electrostatic force,since the gas temperature is assumed to be a constant and no thermophoretic force is applied.When the particle size is small,the electric field force plays a dominant role,forcing nanoparticles into the plasma region.As the nanoparticle size grows,the axial distribution of nanoparticle density gets narrower and the radial distribution becomes non-uniform.This is because more particles with higher negative charges move to the bulk plasma under the action of the electric field.Similar to experimental observations [34],coagulation leads to a sharp decrease in the nanoparticle density,which decreases from 7.8 × 1010cm−3at a diameter of 1 nm to 1.6 × 107cm−3at 32 nm.
3.2.Influence of He
The effect of another dilution gas (He) on the properties of C2H2microplasma and the behavior of nanoparticles is also investigated.Figure 8 shows the spatial distribution of the electron density at different dilution gas percentages,with the same voltage as that in theC2H2/Ar microplasmas.We note that the electron density is mainly distributed in the presheaths when the dilution gas percentage is 0%.For larger percentages,more electrons shift to the bulk plasma,and the profile shows a high density at the center.This is because the discharge is maintained in DA regime in pureC2H2plasmas,and the discharge is maintained in a mixed discharge mode with both α regime and DA regime as dilution gas percentage increases.When the dilution gas percentage increased continuously,a mode transition from DA/α regime into α regime is observed,which is associated with a sharp decrease in the electron density near the presheaths.However,the transition point occurs at a percentage of 80% in this case.This is because the ionization potential (24.6 eV) of He is much larger than that of Ar (15.8 eV) [29],and thus the transition point moves to a larger dilution gas percentage.
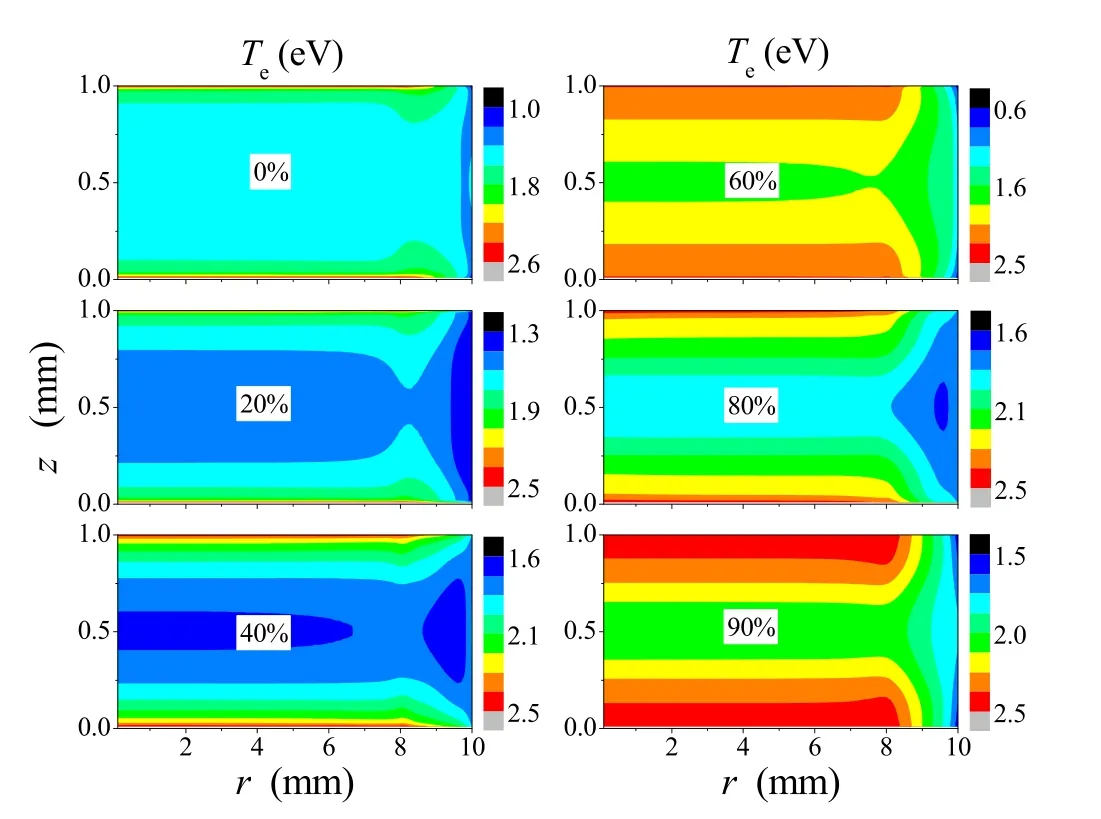
Figure 9.The spatial distributions of electron temperature averaged over one RF cycle for different dilution gas (He) percentages.
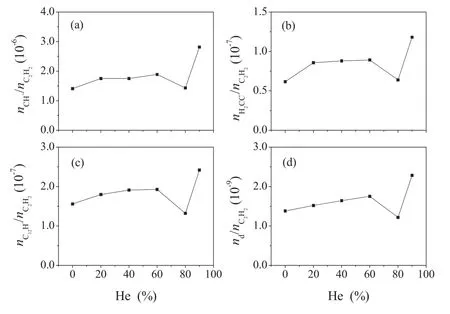
Figure 10.The number density ratios of (a) CH+,(b) H2 C C−,(c) C12H −and (d) nanoparticle toC 2 H2 as a function of He percentage.
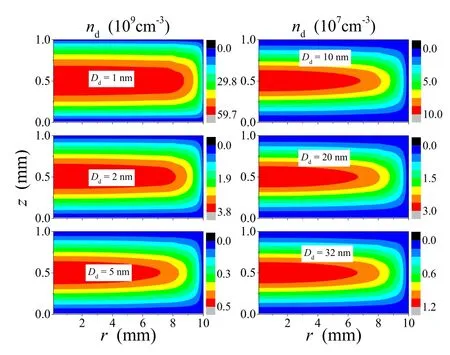
Figure 11.The spatial distributions of nanoparticle density averaged over one RF cycle for different diameters,with the dilution gas percentage of 90%.
The spatial distributions of the electron temperature for different dilution gas percentages are shown in figure 9.We can see that the electron temperature shows two prominent peaks in the sheaths because of electric field effects,and a much lower value is observed in the bulk plasma.In pure C2H2microplasmas,the sheath regions are much narrower,and they become wider as the dilution gas percentage increases.Meanwhile,the electron temperature in the bulk plasma increases quickly from 1.6 to 1.9 eV,when the dilution gas percentage increases from 60% to 80%.This once again confirms that the mode transition from DA/α regime into α regime is accompanied by a sudden decrease in the electron density near the presheaths and an increase in the electron temperature in the bulk plasma.
The number density ratios of CH+,H2CC−,C12H−and nanoparticle to acetylene as a function of the dilution gas percentage are shown in figure 10,for a particle diameter of 5 nm.C12H−and nanoparticle of 5 nm are highlighted to demonstrate the process of nanoparticle nucleation and coagulation.Similar to the case for theC2H2/Ar microplasmas,the number density ratios of CH+,H2CC−,C12H−and nanoparticle to acetylene first increase with the dilution gas percentage,then quickly drop to their lowest points,which correspond to the discharge transition points (at 80%).Finally,the ratios rise rapidly to their highest values(at 90%).That is to say,when the dilution gas percentage is 90%,the production rates of CH+,H2CC−,C12H−and nanoparticles are at their highest,which causes more effective nucleation and coagulation of the nanoparticles.These results show that controlling the dilution gas percentage is a good method with which to improve the nanoparticle production rate.
Figure 11 shows the spatial distributions of nanoparticles density grown by coagulation,for a dilution gas percentage of 90%.As we can see,the nanoparticle density decreases sharply from 6 ×10¹⁰to 1.2 × 107cm−3during the coagulation phase,which is lower than that in theC2H2/Ar microplasmas.At this dilution percentage,the main portion of the energy is dissipated by the ionization of helium,whose ionization energy potential is much larger than that of argon.Therefore,the electron density,and the rates of acetylene dissociation attachment and nanoparticle coagulation are lower than those inC2H2/Ar microplasmas.
4.Conclusions
Using two-dimensional multi-fluid and general dynamic equations,the formation of nanoparticles inC2H2microplasmas,diluted with Ar and He has been studied.The effects of the type and percentage of dilution gas on theC2H2microplasma properties and the behavior of dust particles have been carefully investigated,and the results are as follows.
The dilution gas percentage has a significant impact on the spatial distribution of electron density and temperature in C2H2/Ar andC2H2/He microplasmas.As the dilution gas percentage increases,the peaks of electron density and temperature in the sheaths gradually move to the bulk plasma.
A mode transition from DA/α regime into α regime occurs as the dilution gas percentage increases,which is accompanied by a sudden decrease in the electron density near the presheaths and an increase in the electron temperature in the bulk plasma.Furthermore,the lowest number density ratios of CH+,H2CC−,C12H−and nanoparticle to acetylene are observed at the mode transition point,while the highest ratios are seen at a dilution gas percentage of 90%.Therefore,an appropriate selection of the dilution gas percentage can provide a significant increase in the nanoparticle production rate.
Due to the great difference of ionization potential for argon and helium,the mode transition points in these C2H2/Ar andC2H2/He microplasmas are quite different,and it has a great influence on materials processing.
In the coagulation stage,the nanoparticle density seems to decrease by about four orders of magnitude when the particle diameter grows from 1 to 32 nm.Their axial distribution gets narrow and the radial distribution becomes nonuniform as the nanoparticles grow.The particles densities in C2H2/Ar microplasmas are higher than those inC2H2/He microplasmas.
Acknowledgments
This work is supported by the Fundamental Research Funds in Heilongjiang Provincial Universities of China (No.135509124),National Natural Science Foundation of China(No.11805107),and the Graduate Innovation Foundation of Qiqihar University,China (No.YJSCX2021017).
杂志排行
Plasma Science and Technology的其它文章
- Study of a 105 GHz short-pulse dummy load for the electron cyclotron resonance heating system with the quasi-optical method
- Cleaning of nitrogen-containing carbon contamination by atmospheric pressure plasma jet
- Impacts of laser pulse width and target thickness on laser micro-propulsion performance
- The effect of nitrogen concentration on the properties of N-DLC prepared by helicon wave plasma chemical vapor deposition
- Development of low power non-thermal plasma jet and optimization of operational parameters for treating dyes and emerging contaminants
- A comparison of power measurement techniques and electrical characterization of an atmospheric pressure plasma jet
