Adaptive semi-empirical model for non-contact atomic force microscopy
2022-08-31XiChen陈曦JunKaiTong童君开andZhiXinHu胡智鑫
Xi Chen(陈曦) Jun-Kai Tong(童君开) and Zhi-Xin Hu(胡智鑫)
1Center for Joint Quantum Studies and Department of Physics,Institute of Science,Tianjin University,Tianjin 300350,China
2State Key Laboratory of Precision Measuring Technology and Instruments,Tianjin University,Tianjin 300072,China
Keywords: semi-empirical model,atomic force microscopy,density functional theory,functionalized tips
1. Introduction
The invention of atomic force microscopy(AFM)opened a new way to detect the surface geometry of solids.[1]The submolecular resolution of organic molecules was achieved by using CO-functionalized tip and qPlus technique.[2,3]The high performance of topography imaging enables its application in atomic recognition,[4,5]surface manipulation,[6,7]bond order recognition,[8–10]self-assembly,[11]and tracing reactions on surfaces.[12]The terminating CO molecule is chemically inert,which reduces the manipulation or bonding with the sample molecule. As the CO molecule is weakly attached to the tip apex, it could be deflected laterally when approaching the sample. The deflection of tip termination causes the distorted image for organic molecules, such as the shifted C–C bond length for the top ring of C60molecule,[13]the enlargement of fluorinated carbon ring,[14]and the asymmetric image for a CO molecule.[15]The tip of non-contact AFM(nc-AFM)can also be functionalized by picking up Cl,Br,Xe or O atoms,[16–19]in which the chemical reactivity and the structural stability of the tip apex is responsible for the performance of imaging.
Theoretical simulations are needed to explain the contrast mechanism of nc-AFM.The interaction between tip and sample contains the short-range Pauli repulsion and the long-range attractions including electrostatic and van der Waals (vdW)forces. The former is responsible for the sub-molecular resolution while the later is dominant in the cases with long or medium tip-sample distances.[20–22]Density functional theory calculation is reliable to estimate the force between tip and sample,but the computational cost is not affordable for reproducing a high-resolution image. In order to reduce the cost,Mollet al.proposed a simple model in which a power law relation is assumed between the Pauli repulsion and the sample charge density.[23]The model works well for repulsive tip apex such as CO-functionalized tips,but the tip bending and attractive forces are absent. Hapalaet al. introduced tip relaxation to the simulation and successfully reproduced the sharp submolecular contrast in nc-AFM observation.[24]Another way to accelerate the simulation is adding approximations to the DFT calculation, which could be achieved by implement of pseudopotential[25,26]or an efficient approach called frozen density embedding theories.[27,28]There are also methods that can simulate AFM images, such as Fourier expansion,[29]higher harmonic methods,[30]virtual tip methods,[31]and the method that can only be applied with graphene and graphite characterization.[32]The previous methods give results qualitatively similar to the experiment with affordable computational effort. The estimated tip-sample interaction still quantitatively differs from full DFT calculations.
In the present work,we develop an approach called force assisted simulation tool for atomic force microscopy (FASTAFM)that combines a semi-empirical model with DFT calculation. The estimated tip-sample interaction forces are quantitatively comparable to DFT calculation, but the cost is much lower. This tool is applied to simulate the nc-AFM images of pentacene molecule on Cu(111)with CuCO,Cu,CuCl and CuOxtips. The tool shows robust performance for all considered tips. It also achieves clear element identification while simulating the image of 4-bromo-3′′-iodo-p-terphenyl (BrITP)molecule on Cu(111)and dicoronylene(DCLN)molecule on Cu(110).
2. Model and method of calculation
2.1. Formulation of the FAST-AFM
The force between tip and sample is contributed by different types of interaction, such as Pauli repulsion, coulomb interaction, bonding effect, van der Waals interactions. To make the model simple, we divide the force into the repulsive part and attractive part. The repulsive part is described with a modified Moll model, while the attractive part is proportional to the power of tip-sample distance. The Moll model uses the double atom system to describe the Pauli repulsion between tip and sample.[23]The kinetic energy decreases almost exponentially with tip-sample distances. The increase of kinetic energy is approximated to a simple model with two parameters and the sample charge density ∆Ekin(R)=Aρs(R)B.The Pauli repulsion energy is given by the increase of kinetic energy,in which fitting parametersiandjcan be estimated from a less accurate charge density mesh. Combine Eqs.(2)–(4),the total force can be expressed as
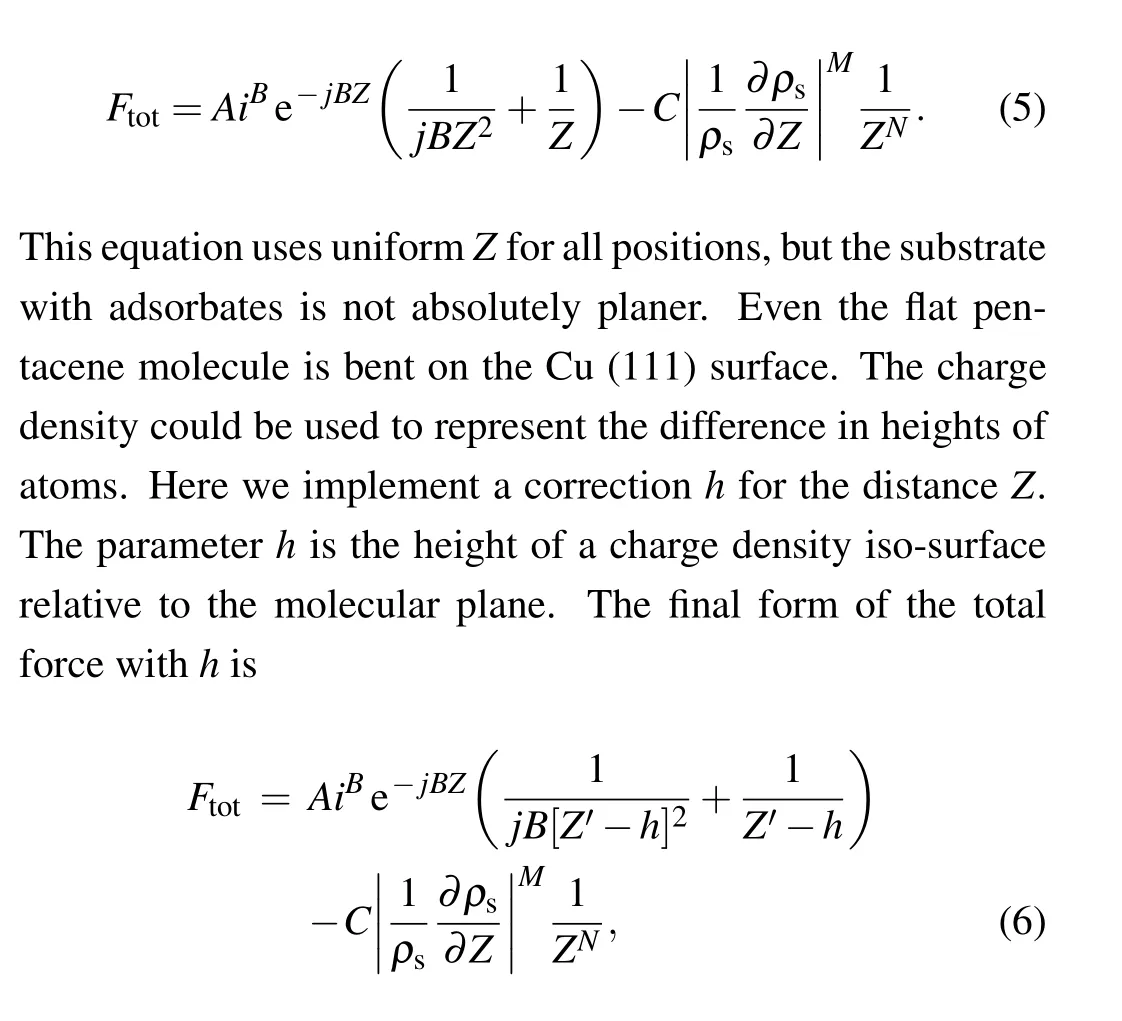
whereZ′shifts the height that makesZ′−hequal to the tipmolecule distance in the molecular region. The implementation ofhis essential to better reproduce the force,the necessity will be discussed in the next section.
The values forBandhare tested to get the best performance. It is found that settingBto 0.83 and the charge density iso-surface forhto 0.016e/˚A3is proper in the simulation.Other global parameters are optimized with the DFT calculated force curves.
The steps of simulation using this model are as follows:
(1)Get the sample charge density with DFT calculations.Build a tip model and calculate the force between tip and sample for several positions on the plane, which is used as the input force curve for the model.
(2) Functionalizing charge density using Eq. (4), get parametersi,j,hfor each point.
(3)Fit Eq.(6)to theF(Z)data acquired in step(1). Get global parametersA,C,M,andN.
(4)Build a mesh grid for the 2D contour of AFM simulation. Forces at each grid point can be calculated using Eq.(6).
We have programmed a toolbox to complete steps(2)–(4).What the user needs to do is running the initial DFT calculations and set a few tags. They are the charge density exponentB(can set to 0.83), the level of iso-surfaceρ(can set to 0.016e/˚A3), tip sample distanceZ(can use multiple values if not sure), resonance frequency of the tipf0(according to the experiment set up),force constant inzdirection,k0,(from Hessian matrix or references),and the lateral force constantk(from Hessian matrix or references).
2.2. Density function theory calculations
The DFT simulations were performed with the Viennaab initiosimulation package (VASP) code with the Perdew–Burke–Ernzerhof (PBE) approximation for the exchange and correlation functional.[33]The dispersion correction was implemented using the DFT-D3 method.[34]Wavefunctions were described with a plane wave basis and the projector augmented wave method.[35]The cutoff energy for the plane wave basis was set as 400 eV. The first Brillouin zone was sampled by gamma point only for structural relaxation and force calculation,verified by a 2×3×1k-mesh. The charge density is calculated with the 2×3×1k-mesh for all systems,the 2×3×1 mesh for the pentacene/Cu(111) system, and it is reduced to gamma-only sampling for DCLN and BrI-TP systems. For the sample system,a 4-layer slab model was built to simulate the substrate with a vacuum space of 35 ˚A. The size of the supercell is chosen to ensure 6 ˚A spacing between adsorbed molecules. The tip model was built with a tetrahedra cluster containing about 20 atoms. All atoms except for the bottom two layers of tip and substrate were fully relaxed until the residual force is less than 0.02 eV/˚A per atom. Static calculations were performed to obtain the force curve. The charge density file is generated with the energy convergence set to 10−8eV.
3. Results and discussion
The pentacene molecule adsorbed on the Cu(111)surface is a well-studied system in experiments. It contains the most common elements in organic molecules and various bonds such asσandπbonds. Two sides of the molecule are slightly lifted up after the adsorption [Fig. S4(a)], making both sides slightly brighter than the middle in the AFM image. With this model,we first simulate the frequency shift image of the system and made a comparison with the experimental observation.
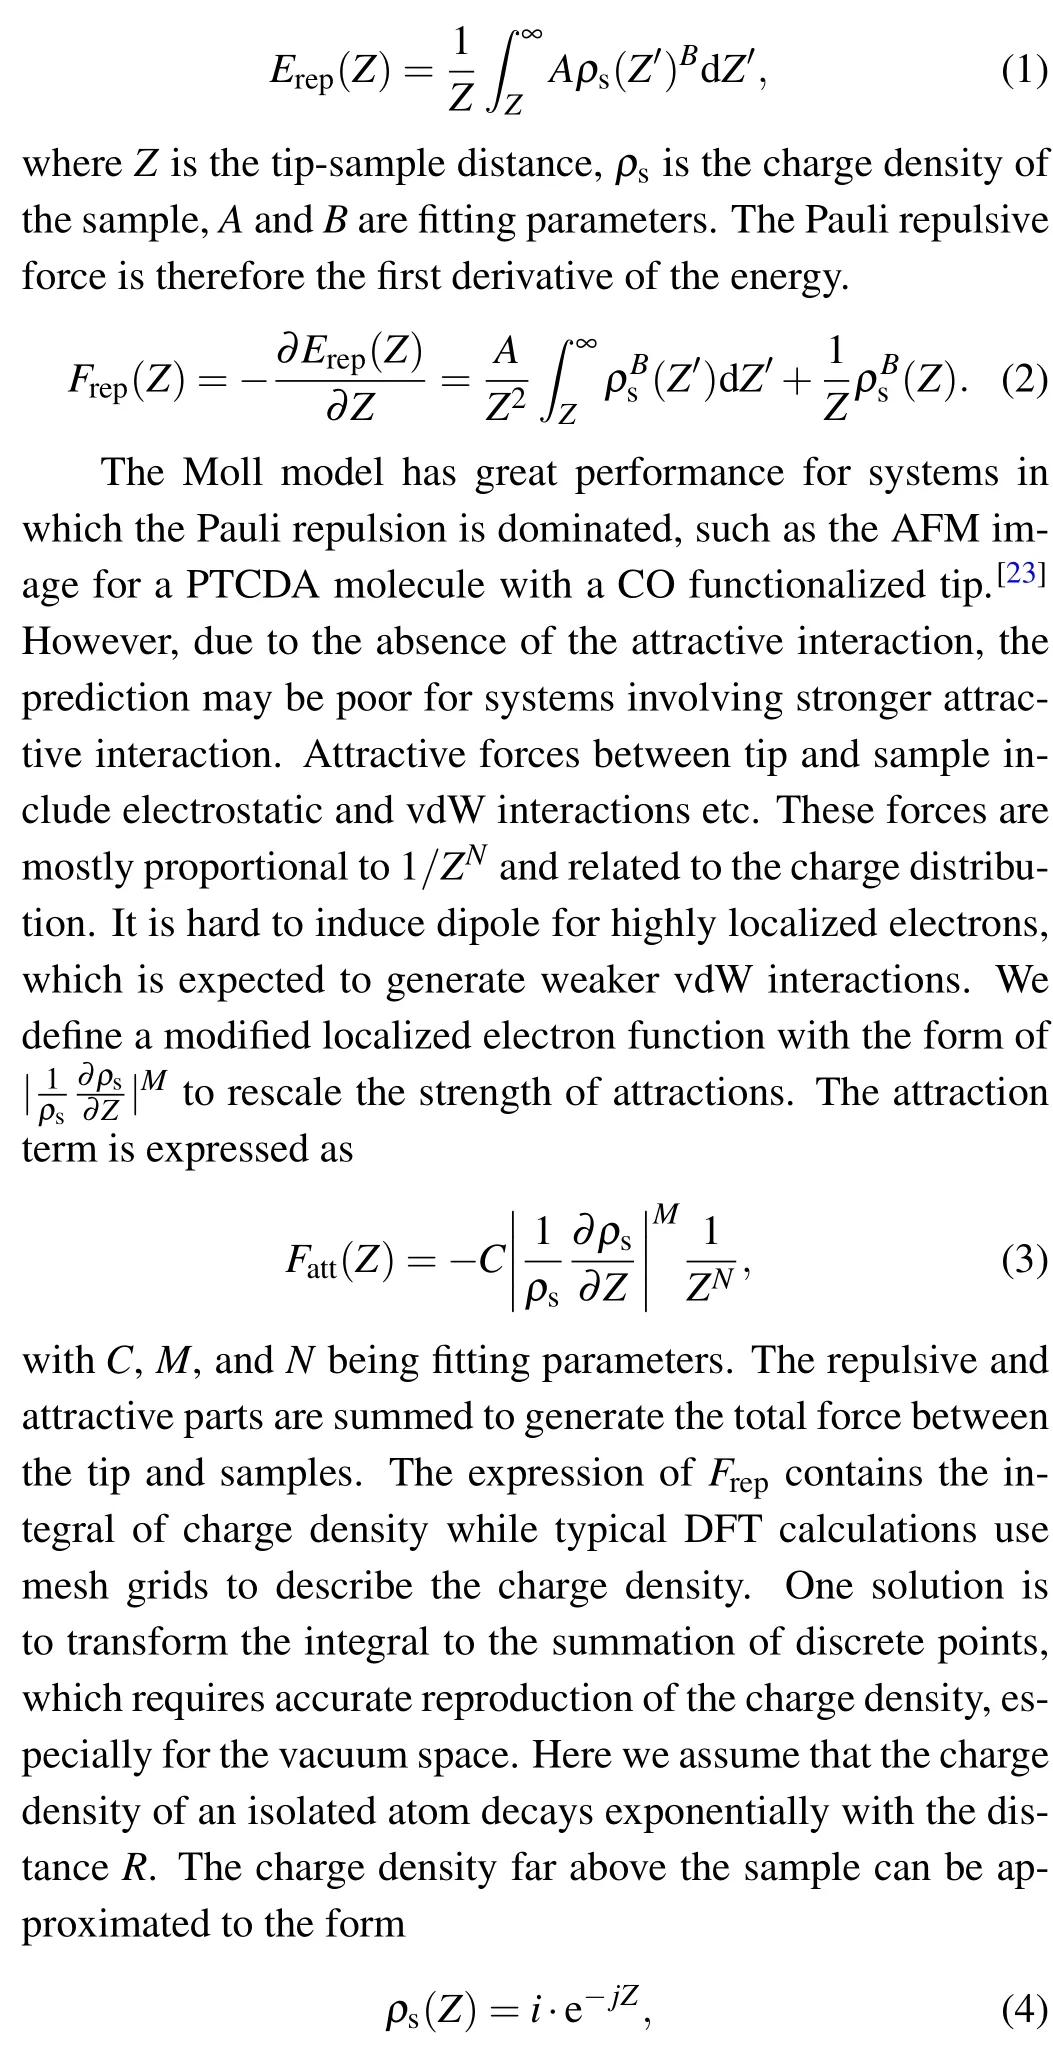
DFT calculations can produce a mesh grid of charge density. Figure 1(a) is the 2D map of sample charge density for the plane 3.2 ˚A above the molecule. The charge density plot has a dumbbell-shaped appearance due to the bending of the molecule. As mentioned in the method section, the charge density distribution is functionalized to an exponential form to ease the calculation. Some crucial positions such as C-top,Chollow,H-top,and substrate were selected to judge the performance of the approximation,as shown in Fig.1(b). It is clear that the exponential approximation fits the calculated charge density well for every curve. The detailed values ofiandjare listed in Table S1.
The parameterhis introduced to consider the fluctuation of the sample surface. The pentacene/Cu(111)system is used again to run the test. Figure 2(a) shows the distribution ofhwith the iso-surface valueρ=0.016e/˚A3. The tip-sample interaction forces are calculated for a 2×3 mesh with DFT.The tip is modeled by a tetrahedra-shaped Cu cluster with CO on the termination, as shown in Fig.2(b). The fitted force curve for the model using Eq. (5) and (6) is shown in Fig. 3. The curves do not fit the DFT results well for points 4–6 without parameterhwhile the error is greatly reduced after addinghto the equation. This comparison proves the necessity of considering the surface fluctuation in the model.
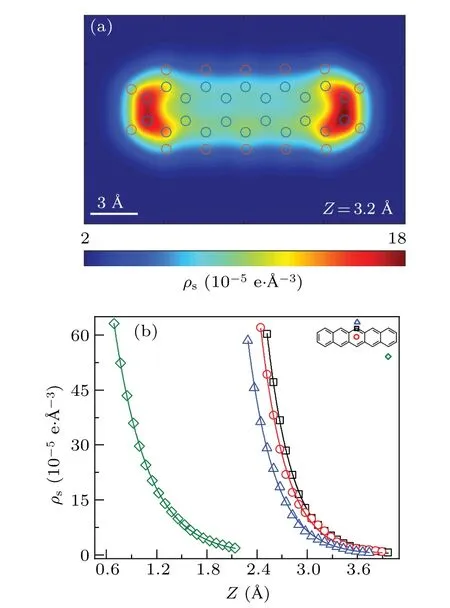
Fig. 1. Charge density for the pentacene molecule. (a) Twodimensional map of the DFT calculated charge density above the pentacene molecule. The circles are the positions of atoms. (b) Charge density curves at crucial positions.The red circle,black square,blue triangle,and green diamond indicate the DFT results for C-top,C-hollow,H-top, and substrate, respectively. Solid lines are corresponding the functionalized values.
Fig.2. The h profile and atomic structure of the tip-sample model. (a)Topand side-view for the distribution of parameter h. The black line shows the cleaved slice of the side-view. (b)Atomic structure and the distribution for the 2×3 mesh used in the simulation. The orange,gray,red and white balls are copper, carbon, oxygen and hydrogen atoms, respectively. Points 1–3 of the mesh are away from the molecule while points 4–6 are within the molecular region.
The tip termination can be functionalized to get better performance in AFM observation. Pure metal tips made by Cu, Ag, and Au are too reactive for imaging organic molecules.[16,36]The tip apex becomes chemically inert by attaching a CO molecule to the termination, which gives a better resolution of the atomic structure. However, the observed structure could be distorted as the terminating CO molecule is easily displaced by lateral forces.[13,14]Using halogen atoms to functionalize the tip can reduce the lateral distortion.[16]However, the resolution is worse than the COfunctionalized tip. Another good candidate for the functionalized tip is the oxidized copper tip. Harryet al.found that the CuOxtip gives a clear backbone of aromatic molecules without distortion.[19,37]The diversity of tip terminations is a great challenge for AFM simulation.The FAST-AFM uses the DFT calculated force to optimize the parameters,which helps to adapt different tips.
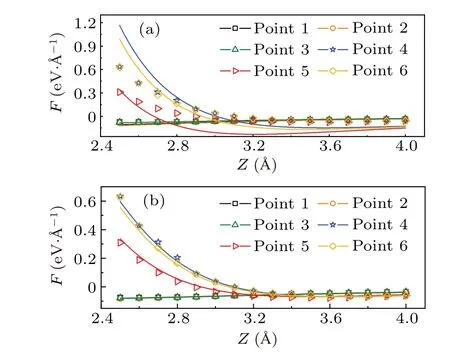
Fig. 3. DFT calculated forces (dots) and the simulated forces (curve)between CuCO tip and the pentacene/Cu(111). (a)Forces are simulated using Eq.(5). (b)Forces are simulated using Eq.(6). Black square,orange circle, green triangle, blue star, red triangle, and yellow rhombus indicates the 1-6 points,respectively.
First, we use FAST-AFM to reproduce the AFM image of pentacene/Cu(111) with the CuCO tip. The structural model and selected positions for DFT calculation are shown in Fig. 2(b). The optimized parameters are listed in Table 1.Figure 4 gives the simulated frequency shift image. The tip height is set as 3.8 ˚A to meet the range in the experiment. The simulated image shows clear carbon rings of the pentacene molecule. Two sides of the molecule are brighter than the middle due to the bending. The upper half of the middle ring is slightly darker than the lower half. The molecule is surrounded by a dark halo, which is thought to be caused by a diffuse attractive potential above the molecule.[16]As the CO molecule is loosely attached to the tip termination,it could be displaced laterally while probing the sample.[13–15]We modify the simulated image with a tip tilting correction,as shown in Fig.4(c). The lateral force constant of the tip termination is set ask=0.5 N/m.[8,24,38]Compared with the image without correction, the skeleton of the molecule becomes more sharp and bright elongation appears at C–H bonds. All of these features are consistent with the experimental observation shown in Fig. 4(b). These parameters in the equation are optimized using the DFT calculated forces for 2×3 mesh marked in Fig. 2(b). They are used without any further optimization to estimate force curves for crucial positions including C-top,Chollow,H-top,and substrate. It is amazing that the estimated forces are almost identical to the DFT calculation. Relative errors are shown in Table S2. Values for the two terms on the right side of Eq. (6) are plotted in Fig. S1 in the Supplementary information. Both terms quickly decay with the distance.It needs to clarify that they are not equal to real repulsive or attractive forces, as the FAST-AFM is only a semi-empirical model with its parameters optimized by total forces from DFT calculation.
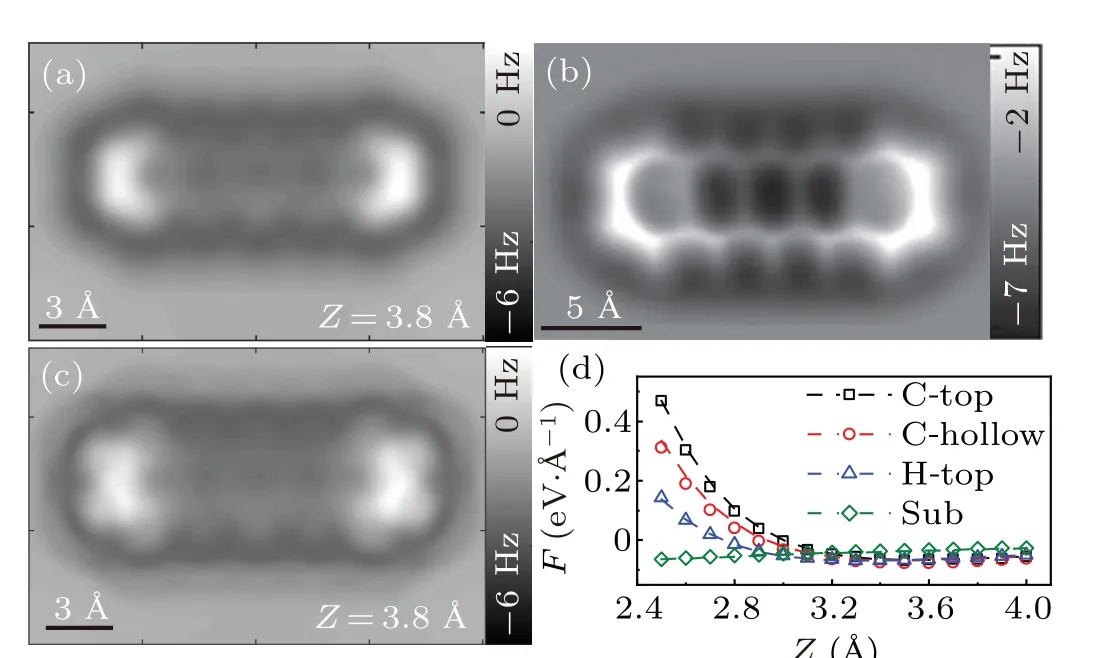
Fig.4. FAST-AFM simulations for pentacene/Cu(111)with CuCO tip.(a) Simulated frequency shift image without tilting correction. Tip height is 3.8 ˚A.(b)Experimental image with CO-functionalized tip.[16](c)Simulated frequency shift image with tilting correction at Z=3.8 ˚A.(d)Simulated force curves(dashed lines)verses DFT calculations(dots)at crucial positions.
The FAST-AFM simulations were also applied to other tips including Cu, CuCl, and CuOx. The frequency shift image for the Cu tip is calculated at a tip height of 5 ˚A,as shown in Fig.5(a). Metal tips are too reactive to distinguish the inner structure of the pentacene molecule.The simulated image only gives a dark outline of the molecule,similar to the experimental observation using Ag tip(Fig.5(b)). The reversed contrast of molecule and substrate indicates that the tip–sample interaction is attraction dominated. Successful reproduction of the attractive interaction is ascribed to the second term of Eq.(6),which is a reasonable supplement to the Moll model. For the CuCl tip,the 3p orbitals of the terminating Cl atom are almost filled after charge redistribution, making the CuCl tip less attractive than the pure Cu tip. The simulated AFM image in Fig.5(c)is similar to that with the CuCO tip. The Cl atom is more tolerant to the lateral force due to strong Cu–Cl interaction. Less distortion is found in both the simulated image and the experimental image(Fig.5(d)).The CuOxtip is reported to have the submolecular resolution for organic molecules.[37,39]
Here we compare the simulated image to the AFM image of dicoronylene/Cu(110),as shown in Figs.5(e)and 5(f).The adsorption structure of the DCLN/Cu(110)system and the sampling sites for force curves are shown in Fig. S2. The DCLN is also an aromatic molecule with multiple carbon rings. The backbone of the molecule is bolder than the image produced by the CuCO tip. The negative frequency shift proves the attractive interaction between the CuOxtip and the molecule. The simulated image reproduced the backbone of the molecule,while the brightness of the edge is different from the AFM image. The inconsisitence is ascribed to the optimized structure in which not all edge atoms are lifted up.
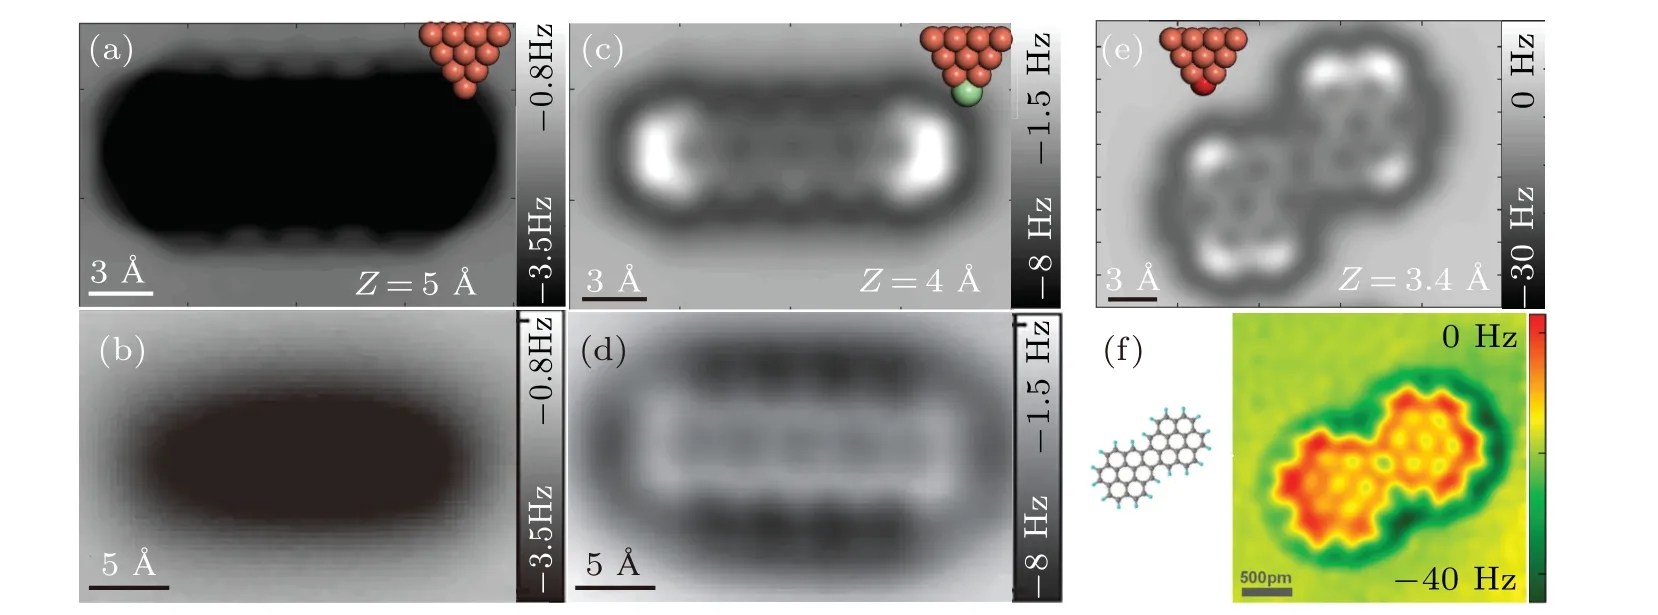
Fig.5. FAST-AFM simulations with other tips. (a)–(d)Images of the pentacene molecule. (a)Simulated image for the Cu tip. (b)The nc-AFM image with Ag tip.[16](c)Simulated image for the CuCl tip. (d)The nc-AFM image for pentacene/NaCl with CuCl tip.[16](e)Simulated image for DCLN/Cu(110)with CuOx tip. (f)The nc-AFM image for DCLN/Cu(110)with CuOx tip.[37] The atomic models of corresponding tips are inserted to panels(a),(c)and(e).
The model is also applied to another molecule to test the performance for other elements.The nc-AFM images of the 4-bromo-3′′-iodo-p-terphenyl(BrI-TP)molecule on the Cu(111)substrate are simulated using this model, as shown in Fig. 6.The CuCO tip is selected according to the experiment. The triphenyl group is slightly distorted due to the steric hindrance between H atoms, which leads to asymmetric brightness of benzene rings.[40]The Br atom is slightly higher than the I atom in the simulated image,while in the nc-AFM image they have almost identical brightness. This deviation is ascribed to the higher position of the Br atom in the relaxed structure of BrI-TP(Fig.S4(b)).

Fig. 6. FAST-AFM simulation and the experimental images for the BrITP/Cu(111)with CuCO tip.(a)Simulated image with Z=3.95 ˚A.(b)Experimental image and the structure of BrI-TP molecule.[41] The purple,brown,gray,and white balls are I,Br,C,and H atoms,respectively. The 2×2 mesh is settled according to the shape of supercell.
The fitting parametersA,C,MandNfor the previous simulation are listed in Table 1.AandCare scaling parameters for the repulsive and attractive terms,respectively.Larger value ofA/Cis related to a repulsive interaction between tip and sample. In our simulation theA/Cvalues for CuCO tip, CuCl tip,and Cu tip are 48.28,25.68,20.09 respectively,showing a transition from repulsive dominating to attractive dominating.For pentacene, the CuOxtip is abnormal with anA/Cvalue of 16.59, showing a strong attractive regime. However, the imaging performance of the CuOxtip is much better than the attractive Cu tip,the simulation image is shown in Fig.S5.The reason could be the high electronegativity of the oxygen atom,which creates a negatively charged termination and achieves the intramolecular resolution of the organic molecule.[37]The parametersMfor all tips are around−3.This indicates that the effect of the modified localized electron function does not vary much with the choice of tips. The last parameterNdecides the decay of attractive forces with the distance.A smaller value ofNmeans that the attractive force is close to electrostatic interaction, while larger values mean that the attraction is mainly contributed by other vdW interactions such as dipole interaction etc. The simulation for the BrI-TP molecule is also applied with the CuCO tip,which givesA/Cvalue similar to the pentacene case. As the charge distribution of halogen atoms is different from carbon or hydrogen atoms,the optimized values ofMandNdeviate from those for pentacene.
In FAST-AFM the parameters are optimized using the DFT calculated force curves as they are thought to have good accuracy. It is also easy to determine tip positions in DFT calculation. The small standard deviations between our model and DFT calculated force curves proves that our model has the potential to achieve accuracy similar to DFT calculations.However, the DFT calculated results differ from experiment for many reasons. The simulated structures of tip terminations or the adsorbates are not identical to the real system. Tip vibration is ignored in the DFT calculated force. The calculated force may be inaccurate according to the selection of exchange-correlation functional and other calculation tags.All of these problems could cause the difference between the simulated image and the experimental observation.
The FAST-AFM method avoids the direct calculation of massive data points in the 2D map with anab initioapproach.The cost of this method can be divided into the DFT calculation and the parameter optimization. In this work, it only needs to calculate six force curves with DFT. The simulated forces are very close to DFT calculation at positions away from the selected mesh,even if the number of sampling force curves is reduced to 3(Fig.S3).Taking the simulation for pentacene/Cu(111)as an example,which contains 228 atoms.The DFT calculation is conducted with 80 cores. It needs about two hours to get the charge density and 22 hours to get six force curves(15 min for each energy point). Then the FASTAFM generates the simulated image of 280×180 dots within several minutes. On the other hand, in a full DFT calculation at least three energy points are needed to estimate the frequency shift for each position. The estimated time would be 280×180×3×15 min≈37800 hours. The cost could be even higher if the tip-sample distance is unknown.
4. Conclusions
We have developed the FAST-AFM method to simulate nc-AFM images for organic molecules with limited cost and accuracy comparable to DFT calculations. This method is based on a semi-empirical model which describes repulsive and attractive interactions with the sample charge density. The parameters(A,C,M,N)are optimized with force curves from DFT calculation. By testing it on the pentacene/Cu(111)system, we find that the simulated images are highly consistent with the experiment for different functionalized tips,including the repulsive CuCO tip,less repulsive CuCl and CuOxtips,and even the attractive pure Cu tip.This simulation tool also shows good elemental identification for the imaging of the more complicated molecule BrI-TP. The high accuracy and wide-range adaption of FAST-AFM make it a reliable method to conduct nc-AFM simulations for various systems.
Acknowledgements
Project supported by the National Nature Science Foundation of China (Grant No. 11804247). VASP Calculations were performed at the High-Performance Computing Platform from Center for Joint Quantum Studies of Tianjin University.
猜你喜欢
杂志排行

Chinese Physics B的其它文章
- Magnetic properties of oxides and silicon single crystals
- Non-universal Fermi polaron in quasi two-dimensional quantum gases
- Purification in entanglement distribution with deep quantum neural network
- New insight into the mechanism of DNA polymerase I revealed by single-molecule FRET studies of Klenow fragment
- A 4×4 metal-semiconductor-metal rectangular deep-ultraviolet detector array of Ga2O3 photoconductor with high photo response
- Wake-up effect in Hf0.4Zr0.6O2 ferroelectric thin-film capacitors under a cycling electric field