How graph features decipher the soot assisted pigmental energy transport in leaves? A laser-assisted thermal lens study in nanobiophotonics
2022-08-31Sankararaman
S Sankararaman
Department of Optoelectronics,University of Kerala,Trivandrum,695581,Kerala,India
Keywords: nanobiophotonics,thermal lens,soot,pigmental energy transfer,graph theory
1. Introduction
The prevalence of complexity from microcosm to macrocosm has captivated the attention of human beings. Untangling these complex hidden features has always been of great interest to the scientific society.The progressive developments in the field of complex network in a short period have proved their ability to characterize and solve many intricate natural processes and systems. The graph theory put forward by Euler in 1736 is one of the latest widely employed mathematical tool for representing complex systems in terms of nodes and edges.[1–3]The graph theory/complex network-based methodologies find a wide range of applications in studying biological systems.A special interdisciplinary branch named network biology has emerged by integrating the principles of network theory,statistical tools,and life science. It helps to understand the interactions between the biological systems such as genes,neurons, metabolites, and proteins.[1,4,5]The real-time networks generated from time-series data of complex processes contain many nodes (vertices) and links (edges), making the analysis using conventional techniques a cumbersome task.This difficulty is overcome by extracting certain topological features that inherit the traits of the original system using various methods. Graph-based theoretical analysis is carried out by finding correlation coefficients,mutual information,visibility, and recurrence relations.[1,6]These methods are based on the connectivity,strength,and number of edges or the distance of separation of nodes in the system. These characteristics in a network are defined in terms of topological features like degree, network density, centrality, transitivity, diameter, number of components, and page rank.[3,7]The simplest method for creating a complex graph is finding the correlation coefficient among the nodes in a network.Among the three methods for finding the correlation—Pearson,Spearman,and Kendall rank — the nonparametric Spearman correlation test, which is insensitive to the distribution of variables, gives more reliable results for nonlinear dynamical biosystems.[8,9]Though the graph theory-based methods are widely used to analyze biosignals and ecological studies,investigations on plants and their related phenomena have not received proper attention.[2]
Photosynthesis taking place in the leaves of plants involves complex biochemical reactions that probe the curiosity in researchers to improve the yield of crops and enhance the efficiency of solar cells by mimicking plants. Since the analysis of delicate biological samples is challenging, laserbased non-destructive evaluation techniques like photothermal radiometry, photothermal beam deflection, photothermal lens spectroscopy, photoacoustics, and photothermal calorimetry,are popularly used.[10–13]Among them,the photothermal lens technique capable of detecting a temperature difference of about 10−4◦C to 10−6◦C is based on the transient heat propagation, thermal-induced refractive index variations, and creation of a thermal lens(TL)effect in the medium.[12,14–17]The momentousness of the TL signal is that it reflects only the contributions of absorbed photons giving high signal to noise ratio making it a potential non-destructive technique for biological applications.[18,19]
Recently, our group has reported the soot-assisted intrapigmental energy transport in leaves and seed matter using TL technique. The hidden information of particle dynamics in the medium contained in the TL signal has also been unwrapped through the nonlinear time series and fractalysis.[17,20–22]However, to the best of our knowledge, graph theory is seldom applied in the interdisciplinary branch of applied science— nanobiophotonics.[23,24]For the first time, the paper expounds the generation of a complex network and the extraction of its topological features from the TL signal to unveil the soot-assisted energy tranport in leaves.
2. Materials and methods
The thermal lens signal required for the complex network analysis is recorded using the most simplest single beam TL setup displayed in Fig. 1. The study comprises the following four steps: (i) collection of soot, (ii) preparation of the nanofluids from the leaves, (iii) recording of the TL signal,and(iv) graph theoretical analysis of the recorded time series TL signal.
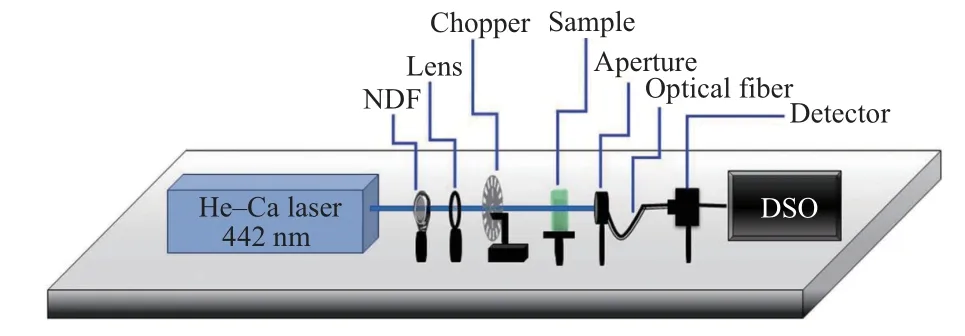
Fig.1. Experimental setup for recording the TL signal.
Initially,the soot is collected from the exhaust pipe of the public transport vehicles and purified by the liquid-phase oxidation method as described in one of our previous work.[17]
The purified soot particles, rich in various nanocarbon allotropes,[25–27]are used for preparing the soot nanofluids.First,the carbon nanoparticles(CNPs)are mixed with distilled water in different proportions to prepare soot nanofluids of concentrations 0.20, 0.60, 1.25, 2.50, 4.00, and 5.00 g/l. The soot nanofluids in various concentrations are then sprayed on the leaves of a plant in the bean family,Lablab purpureus(L)sweet and let to grow in natural conditions for ten days. After that, leaves are collected from a control set without CNPs and also from each category of CNP concentrations sprayed.The collected leaves are used for preparing leaf extracts using acetone,corresponding to soot concentrations 0.20,0.60,1.25,2.50,4.00,and 5.00 g/l,by the procedure followed by Yoshidaet al.[28]The nanofluid solutions for the CNP concentrations 0.20,0.60,1.25,2.50,4.00,and 5.00 g/l are designated as P1,P2, P3, P4, P5, and P6, respectively. The leaf extract of the control set is denoted as P0. Finally, all the nanofluid samples are subjected to the ultra-violet-visible(UV-Vis)absorption spectrum analysis(UV/VIS/NIR—PerkinElmer Lambda 950) to study the contribution to absorbance by various leaf pigments.
The nanofluids prepared are then subjected to TL study.The Gaussian mode helium–cadmium laser having a maximum power of 80 mW and wavelength 442 nm is used as the excitation source. A neutral density filter (NDF) is used for reducing the power of the laser source to 40 mW.The laser beam is then focussed using a convex lens(20-cm focal length)and intensity-modulated using an optical chopper(SRS 540)at 1 Hz. The focussed modulated beam is allowed to fall on the nanofluid taken in a cuvette,and the laser coming out from the sample after passing through an aperture is collected by an optical fibre. The fibre output,the required TL signal,is fed to a sensitive photodetector(Thorlabs).A sensitive 500-MHz digital storage oscilloscope(DSO–Teledyne Wavesurfer)displays the TL signal.
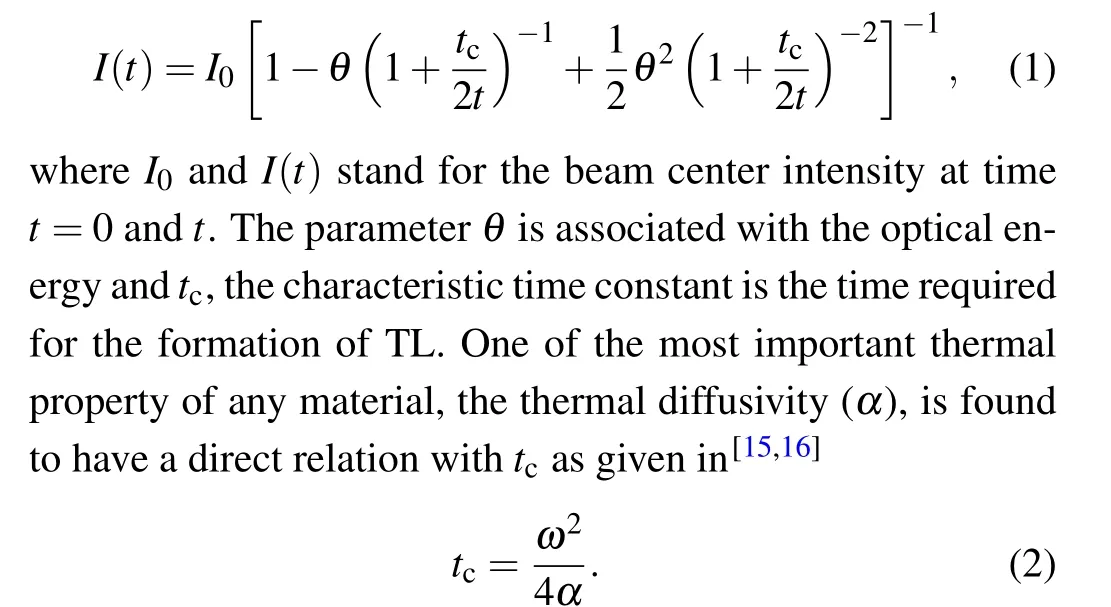
The intensity-modulated focussed laser beam falling on the nanofluids produces a lens-like effect within the medium called TL.Based on the sign of the rate of change of refractive index, we get a concave or convex lens-like effect. In liquids and gases,it is mostly negative,and hence a diverging effect is observed. The beam center intensity of the TL signal is given by[15,16,29]
The next step in the present study is constructing a complex network from the TL decay signal captured in the DSO and its analysis. The construction of a graph based on the correlation method needs to define two factors: (i) the value of correlation coefficient and (ii) the length of the segment.The Spearman correlation coefficient (ρ) is ideal for finding the strength and direction of correlation existing between two variables having a monotonic relationship. It is not affected by the abnormal nature of distributions in the system and the size of the data,which is a drawback of the Pearson correlation coefficient.[9,30]For two nodes,xandyhaving ranksrxandry,the value ofρis given by
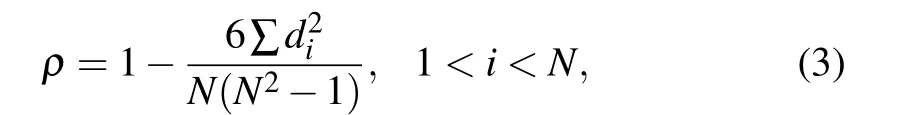
where the number of vertices in the graph isNanddi=rx −ry.Depending on the sign ofρ, the direction of correlation can also be understood. In the present study,the network is generated from the time series TL signal, recorded in the DSO,by setting the lower limit ofρas 0.8 and the length of the segment(node)as 27 data points. An edge will be formed between any two nodesxandy, if the value ofρis greater than 0.8. If a graph containsNnodes andEedges, an adjacency matrix(Axy) is created by finding the value ofρsuch thatρ ≥0.8;Axy=1,andρ<0.8;Axy=0.[3,31]This is executed using the‘igraph’package in the RStudio software. Therefore a single TL signal of nanofluids, consisting of about 2×10⁴data, is segmented into∼740 segments(nodes),and its correlation coefficient is found to establish a connection between each node in the series. The visual representation of the generated graph is obtained by loading the output file from RStudio in Gephi 0.9.2, a graph visualization software. The formation of clusters, number, density, and percentage of clusters can be understood very clearly from the graph of the signal. The graph analysis is effective only if we find its topological features reflecting many of the underlying dynamics of the system under study.[7]The most fundamental network feature of a complex structure is the degree of a vertex,which is simply the number of edges in a network represented asEgiven in
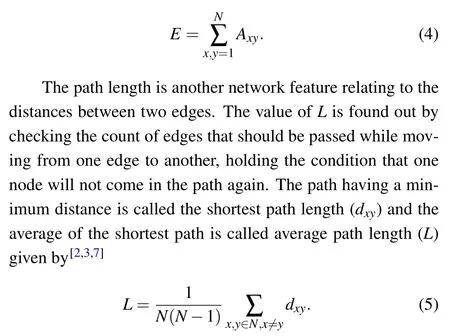
Ifxandyare two nodes having the greatest distance,then the shortest distance between them is defined as the network diameter(D). After determining the shortest path length in the whole network,the maximum among them givesD.[7]
The metric used for indicating the connectedness of all nodes in a network is called network density(ND). A higher value ofNDin a complex system tells that the number of total connections is high,allowing faster information flow. The value ofNDfor an undirected graph is given by[7]

A characteristic feature of the network with uncorrelated components can be better analyzed by noting the number of components(NC)derived from the graph. A graph with fully connected edges will have only one component, and each uncorrelated node in it is considered as a component.[7]The estimation of these network measures from the TL signals of the chlorophyll extracts containing CNPs helps us to analyze the dynamics during photosynthesis in leaves.
3. Results and discussion
Out of the total solar energy coming from the sun, only 42% to 43% lies in the photosynthetically active range and is absorbed by the light-absorbing molecules in the plant pigments. The 3% to 5% of solar energy falls in the UV region absorbed by protein molecules in the plants. The chloroplasts in leaves are the location for photosynthesis, where the process of energy transfer and exchange happens among the pigments in the thylakoids and grana. The leaf pigments like chlorophyll a, chlorophyll b, carotene, and lutein are found to absorb the wavelength regions 400 nm–700 nm of the electromagnetic spectrum.[33]Each pigment absorbs a particular wavelength and reflects others. The energy absorbed by the proteins and leaf pigments is transferred from one pigment molecule to another pigment molecule to make carbohydrates.The trapped energy in the pigments is getting transferred from chlorophyll b to chlorophyll a, which is the reaction center in a leaf.[34,35]Hence, understanding about the constituent molecules taking part in the photosynthetic absorption process is essential.[17,34–36]The ultra-violet-visible(UV-Vis)absorption spectrum of the samples extracted from the leaves sprayed with and without CNPs are recorded in a range of 300 nm–800 nm and is displayed in Fig.2.
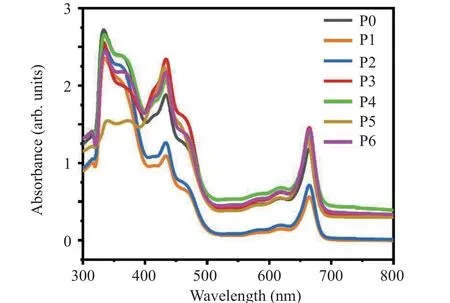
Fig.2. The UV-Vis absorption spectrum of samples P0–P6.
The spectrum shows peaks at 334 nm, 369 nm, 413 nm,434 nm,464 nm,617 nm,and 665 nm.The absorption peak in the UV region is due to the protein matrix in the thylakoid,and the major peaks in the visible region at 413 nm,434 nm,and 665 nm is due to the combined contribution by chlorophyll a and b molecules. The other peaks at 464 nm and 617 nm are attributed to the joint absorbance by carotene,lutein,zeaxanthin, phycocyanin, and beta carotene. It can be seen that for samples P1 and P2,the absorbance is below that of the control sample P0,and after that,it increases in samples P3–P6. The absorbance is maximum for the CNP concentration of 1.25 g/l(sample P3) and decreases and saturates after that. This is in good agreement with our studies on the role of CNPs in assisting the energy transport mechanism in leaves in the visible and UV region.[17,36]The significance of the CNPs present in soot on various leaf pigments is evident from the UV-Vis spectral analysis.
The present work introduces a novel methodology based on graph theory for analyzing the CNP-chlorophyll system and associated energy transfer process.Primarily,the complex networks are generated from the time-varying TL signals of each samples P0–P6 by finding the Spearman correlation coefficient between the nodes. The potentiality of the TL decay signal,formed during the ON time of the electromechanical chopper,in unveiling the thermo-optic properties of the nanofluids along with the molecular/particle dynamics has already been reported in some of our earlier studies.[21,37]A representative TL signal captured in the DSO for the nanofluid sample P0,without CNPs,and sample P6,with the highest CNP concentration,is shown in Fig.3. The attempt to reveal the complexities involved during the formation of the TL signal is carried out by constructing a graph from them. The graph of the TL signal of all the samples P0–P7 is displayed in Fig.4.
All the graphs show complex nature with uncorrelated nodes and many edges between the nodes to form clusters.From Fig.4,it can be observed that there is a variation in the clusters,cluster density,and the number of uncorrelated nodes from samples P0 to P6. From Fig. 2, as the CNP concentration increases from 0 g/l–0.60 g/l,the absorption in the visible region decreases below the control sample and increases thereafter. The optical absorption is related to the enthalpy of the system,i.e., the greater the absorption, the greater is the enthalpy of the system. The reason for the initial decrease of the optical absorption can be viewed as the absorption and emission by the CNPs sprayed on the leaf surface, as detailed in our earlier work.[17]As the CNP concentration sprayed over the leaf increases, the probability of diffusion of CNPs into the chloroplast also increases,as evidenced by the increase of absorption in the visible region for the samples P3–P6. Thus,the UV-Vis analysis points to a lowering of system enthalpy up to P3 and increases after that. We have already reported that[17]the thermal diffusivity of the sample also shows an initial increase up to P3 and a decrease thereafter,indicating the modification in the system’s thermal behaviour from heat dissipation to heat trap. This trapping of energy by the CNPs in the soot has also been found to enhance the intra-pigmental energy transfer and thereby the photosynthesis.

Fig.4. Graph constructed from the TL signal of samples P0–P6.
The CNP induced modifications in optical absorption and thermal diffusivity,as reported,can also be expounded through the graph constructed from the TL signals, as displayed in Fig.4. The graph features likeE,D,ND,C,andNCare also estimated from the graph using RStudio and its variation with the concentration of CNPs is shown in Figs.5 and 6.The analysis of Figs.5 and 6 shows that all the plots show two distinct regions (R1 and R2), based on which the analysis can effectively be made.The CNP concentration of 1.25 g/l(sample P3)seems to be critical for graph features.The CNP concentration<1.25 g/l and>1.25 g/l are denoted as R1 and R2, respectively. All the graph features exceptNCshow similar behavior with the increase in CNP concentration. The decrease in the values of graph features in R1 is followed by an increase and a saturation in R2.
The simplest but essential metric that provides sufficient information about a graph’s complexity and nature is the count of edges (E). The quantity which tells what fraction of the maximum possible edges are originally realized in a graph is theND, whose value lies between 0 and 1. The mean value of the distance between a pair of nodes as well as the longest among the shortest distance in a network is also two features of the graph named average path length and diameter.[3,38]The value ofCmeasures the farness from the other nodes in a network, which is the reciprocal ofL. The analysis of the graph (Fig. 4) and the variation of the graph features(Figs. 5 and 6) with CNP concentration can be understood using Fig. 2. As mentioned earlier, as the optical absorption increases, the enthalpy of the system also increases. Thus,sample P3 shows maximum enthalpy, which gets reflected in the graph as an increase of the number of unconnected nodes represented through the graph featureNC.

Fig.5. Soot concentration-dependent variation of(a)number of edges,(b)diameter,and(c)graph density.
This point is verified by analyzing a theoretically fitted(using Eq.(1),to minimize the fluctuations and to get a proper inference for comparing with the experimental curve) typical TL signal of acetone(Fig.7(a))having two regions: (i)initial rapid fall and(ii)a near-steady state(separated by a dotted line in Fig. 7(a)). As the TL signal forms during the ON state of the chopper,the photothermal energy(enthalpy)deposition in the nanofluid medium increases during the ON state. But the nature of variation of enthalpy is not linear. It increases in a short interval of time and gradually gets saturated,depending on the sample’s nature. The graph plotted from the TL signal data of acetone for the two regions is shown in Figs.7(b)and 7(c), as the leaf pigments are extracted using acetone. The values ofE,ND,CandNC,in the first region of Fig.7,is obtained as 16121,0.415,0.469,and 2,respectively,whereas in the second region,the values are 2476,0.007,0.0004,and 418 respectively. From the graph, it can be seen that the value ofE,ND,andC,are high in the first region.In the second region,
where the system’s enthalpy has attained a near maximum,the number of uncorrelated nodes is also maximum. This clearly reveals that the increase of system enthalpy gets reflected as the increased number of uncorrelated nodes or lower values forE,ND, andC. Figure 4 can be explained in light of the inference drawn from Fig.7.

Fig. 6. Soot concentration-dependent variation of (a) number of components and(b)closeness centrality.
In R1 of Figs.5 and 6,the graph featuresE,D,ND,andCdecrease. From our earlier report in this region,the thermal diffusivity of the medium is increasing,which is explained as the energy flow due to the thermal imbalance created by the CNP coating on the leaf surface. At low concentration, the CNP does not diffuse into the chloroplast but acts as centers of absorption and re-emission. Hence, it does not contribute to the intra-pigmental energy transfer. When we move to R2,due to the increase of concentration, the CNPs get diffused into the chloroplast of the leaves and hence the increase in the optical absorption is due to the combined effect of CNPs and leaf pigments. The reported lowering of thermal diffusivity in this region points to the heat trap. The trapped energy by the CNPs facilitates the intra-pigmental energy transfer and hence enhances the photosynthetic activities. This energy trap or increase of enthalpy in the system from that of sample P3 is reflected in the graph as a decrease in the value of NC and increase in the values ofE,D,ND, andC. These results are also in agreement with the inference from the reference graph shown in Fig. 7. The R2 shows an increase in the value of graph features except forNC,followed by a saturation,which is attributed to the saturated enthalpy of the system.In this portion,an increase in the soot concentration does not have a significant effect on the energy transport process. The CNPs exchange a portion of the absorbed energy to the leaf pigments,and the excess energy is dissipated out. Thus the analysis of the graph and its features help us in defining an optimum CNP concentration that can facilitate intra-pigmental energy transport in leaves,enhancing the photosynthetic activity.When the concentration below the optimum value does not influence the photosynthetic activity, a concentration much higher than the optimum value though take part in the energy transport mechanism, it can cause adverse effect as well. This suggests that the optimum CNP concentration in the chloroplast is good for enhanced photosynthesis and improved yield.

Fig.7. (a)Experimental and theoretically fitted thermal lens signal,graphs of(b)initial rapid fall and(c)near-steady state of acetone.
4. Conclusion
The study deciphers soot-assisted intra-pigmental energy transport in leaves through the graph features of TL signal.The soot particles, rich in various carbon allotropes, are prepared at different concentrations and sprayed onto the Lablab purpureus(L)sweet’s leaf surface. After a period of ten days,leaves are collected, and extracts are prepared corresponding to soot concentrations 0.20,0.60,1.25,2.50,4.00,and 5.00 g/l.The UV-Vis spectroscopic analysis of these samples is carried out to understand the role of CNPs in modifying the absorption property of the leaf pigments. The nanofluid samples are then subjected to the sensitive and non-destructive TL technique,and the time-varying TL signals of all samples are recorded to perform graph theoretical analysis. The network constructed from the TL signal of all the samples after finding the nonparametric Spearman correlation coefficient shows a complex nature comprising of unconnected nodes,number of edges and clusters. However, a variation in the complexity is observed in the graphs, which can be explained in the light of optical absorption and the thermal energy flow through the nanofluid samples. The topological graph featuresE,D,ND,NC, andCcomputed from each graph show a similar variation in congruence with the absorbance shown by the samples. The absorbance spectrum shows that as CNP concentration increases from 0 g/l–0.60 g/l, the optical absorption decreases below the control sample and increases after that. The sample P3 with CNP concentration 1.25 g/l is found to have maximum absorbance and hence maximum enthalpy reflected as the increased number of uncorrelated nodes (NC) in the graph. To verify the relation of unconnected node formation with the system enthalpy,a TL signal of acetone is theoretically fitted,and its graph is constructed in two regions — falling region and near steady-state region. The analysis reveals that the increase in the value ofE,ND, andCin the first region is due to the increased photothermal energy deposition in the medium(enthalpy)during the ON state of the chopper.A highNCvalue in the second region clearly indicates that the system’s enthalpy has attained a near maximum. When analyzed in regions R1 and R2, the graph features with CNP concentration show an initial decrease in R1 and an increase followed by saturation in R2.On comparing with our previous report,it is understood that at lower concentrations,the CNPs on leaf surface absorb and re-emits the energy rather than diffusing into the chloroplast and exchanging the energy with the pigments. However,as the soot concentration increases,the diffusion of CNPs get initiated,favoring the intra-pigmental energy transfer and contributing positively to photosynthesis.
Further increase in CNP may not significantly affect the intra-pigmental energy transfer due to the saturated enthalpy of the system. The sample P3 with maximum enthalpy is found to have the least value for the parametersE,D,ND,andC. Thus, the analysis of the graph features shows not only a transformation from a heat-trapping state to a heat dissipation state but also suggests an optimum concentration of 1.25 g/l as suitable for intra-pigmental energy transfer and improved photosynthesis.Hence,the graph-based theoretical analysis opens up a new methodology in the field of nanobiophotonics.
杂志排行

Chinese Physics B的其它文章
- Direct measurement of two-qubit phononic entangled states via optomechanical interactions
- Inertial focusing and rotating characteristics of elliptical and rectangular particle pairs in channel flow
- Achieving ultracold Bose–Fermi mixture of 87Rb and 40K with dual dark magnetic-optical-trap
- New experimental measurement of natSe(n,γ)cross section between 1 eV to 1 keV at the CSNS Back-n facility
- Oscillation properties of matter–wave bright solitons in harmonic potentials
- Synchronously scrambled diffuse image encryption method based on a new cosine chaotic map