基于MAVEN 卫星的火星逃逸面温度研究:日变化与太阳活动性变化
2022-08-19曹雨田李子川付梦昊孙铭阳中山大学大气科学学院行星环境与宜居性研究实验室珠海5908中国科学院国家天文台北京000中国科学院地质与地球物理研究所地球与行星物理学重点实验室北京0009
顾 浩,曹雨田,李子川,付梦昊,黄 旭,孙铭阳 中山大学大气科学学院 行星环境与宜居性研究实验室,珠海 5908 中国科学院国家天文台,北京 000 中国科学院地质与地球物理研究所 地球与行星物理学重点实验室,北京 0009
0 Introduction
Planetary atmospheres are the Rosetta stones of planetary evolution and habitability. The atmosphere of Mars, our sister planet, mainly comprises CO, with small fractions of O, N, CO, O, Ar, and other minor species (e.g., Nier and McElroy, 1976, 1977; Bougher et al., 2015). Over the past several decades, the structure and dynamics of the upper Martian atmosphere have been widely explored using various projects,ranging from the Vikings 1 and 2 spacecraft to the Mars Global Surveyor, Mars Odyssey, and Mars Express (e.g., Nier and McElroy, 1976, 1977; Angelats i Coll et al., 2004; Bertaux et al., 2006; Withers,2006; Forget et al., 2009). Since 2014, extensive measurements performed using the Neutral Gas and Ion Mass Spectrometer (NGIMS) (Mahaffy et al., 2015a)onboard the Mars Atmosphere and Volatile Evolution(MAVEN) (Jakosky et al., 2015) spacecraft have afforded comprehensive and systematic observations of the composition and structure of the upper Martian atmosphere, that is, between 120 and 250 km from the planet's surface (e.g., Mahaffy et al., 2015b; Stone et al., 2018). More recently, the ExoMars Trace Gas Orbiter was established with the aim of exploring atmospheric regions above ~60 km on Mars and addressing several interesting issues (López-Valverde et al., 2018). Throughout these explorations, atmospheric escape has garnered considerable interest among scientists, because it is crucial for controlling the long-term evolution and habitability of Mars (e.g.,Lammer et al., 2013; Lillis et al., 2015; Jakosky et al.,2018).
The upper boundary of the Martian atmosphere,namely, the exobase (Chamberlain, 1963), is a key concept for understanding the escape process from Mars. The exobase is an imaginary interface above which a neutral particle ejected upward is subjected to,on an average, one collision at a higher altitude. This altitude is equivalent to the location where the mean free path of the particle is equal to the neutral density scale height of the background species, under the assumption of a thin atmosphere (Johnson et al., 2008).In reality, the exobase reflects an extended transition region, from highly collisional to collision-free areas;however, the concept of an ideal exobase has been widely used in previous studies because it represents the boundary above which atmospheric escape occurs(Chaufray, 2021). For Mars, the exobase altitude is typically assumed to remain constant at ~200 km (e.g.,Chaffin et al., 2014; Qin, 2020, 2021). Recently, using NGIMS neutral density data, Fu et al. (2020) studied the exobase altitudes for CO, O, N, and CO on Mars and derived a range of exobase altitudes under different internal and external conditions. However, the temperatures of the Martian exobase have not been studied thoroughly, and previous investigations were limited to ultraviolet spectrum observations (Qin,2020, 2021). To address this shortcoming of existing literature, in this study, with the aid of NGIMS level 2 data, we determined the exobase temperatures for four relatively abundant neutral species: CO, O, N, and CO; these exobase temperatures were then used to systematically investigate the variations in the Martian exobase temperatures with respect to the local time and solar extreme ultraviolet (EUV) flux.
The remainder of this paper is organized as follows. Section 1 describes the data and method used in this study. In Section 2, the distributions of the exobase temperatures for CO, O, N, and CO are presented. Subsequently, in Section 3, the diurnal and solar cycle variations in the exobase temperature are discussed. Finally, the conclusions of this work are presented in Section 4.
1 Data and method
1.1 Data description
The analysis presented herein relies mainly on the neutral density data collected by the MAVEN NGIMS.The NGIMS is a quadrupole mass spectrometer capable of measuring the densities of reactive and nonreactive neutral species in the open- and closed-source modes, respectively (Mahaffy et al., 2015a). It can also measure the densities of various species in an ambient atmosphere over a mass range of 2~150 Da, with a resolution of 1 Da (Mahaffy et al., 2015a). In this study, we used the NGIMS level 2 data product, which provides information pertaining to the densities of neutral species in the closed-source mode. As a metric for the solar EUV flux, the level 3 solar spectral model of Mars, constructed via the Flare Irradiance Spectral Model–Mars and calibrated with MAVEN Extreme Ultraviolet Monitor (EUVM) band irradiance data(Thiemann et al., 2017), was utilized and integrated over the wavelength range of 0.5~90 nm.
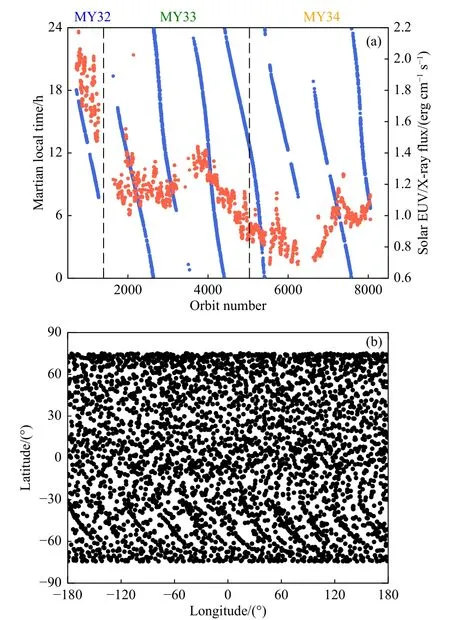
We used more than four years of in situ data measured using the MAVEN NGIMS, that is, from October 18, 2014 to November 15, 2018, spanning three Martian years (32~34). Only measurements performed at altitudes below 300 km were included, from a total of approximately 6 000 MAVEN orbits. It should be noted that only the inbound portion of each MAVEN orbit was analyzed to avoid possible contamination by the adsorption or heterogeneous chemistry occurring at the NGIMS antechamber walls(e.g., Mahaffy et al., 2015a; Stone et al., 2018). Fig. 1 presents the distribution of the MAVEN observations used in this study in terms of the Martian local time and integrated solar EUV flux (left panel) and also in terms of the longitude and latitude (right panel). The aforementioned parameters refer to the COexobase altitude for each orbit, as obtained from the work of Fu et al. (2020). Furthermore, as indicated in Fig. 1, the sample covers a wide time range and a large solar EUV flux range, and is distributed nearly uniformly on a significant portion of the Martian surface. This enables the exploration of the variations in the exobase temperature with respect to both the local time and solar EUV flux.

Fig. 1 (a) Sample distribution with respect to Martian local time and integrated solar flux at 0.5~90 nm, referred to as the CO2 exobase altitude, both as a function of the MAVEN orbit number. The observations used in this study spanned three Marian years, from MY32 to MY34, as indicated in the figure legend; (b) Global distribution of the MAVEN observations used in this study with respect to the longitude and latitude, also referred to as the CO2 exobase altitude
1.2 Calculation of exobase temperature


z
is the altitude,n
is the number density of speciesj
, and σis the cross-section for binary collisions between speciesi
andj
, as adapted from Lillis et al. (2017). Below the highest altitude at which NGIMS data are available, the measured NGIMS densities are directly input into equation 1; by contrast, above this altitude, an isothermal, thin atmosphere is assumed with a constant density scale height, obtained via barometric fitting to the data gathered within the highest 50 km altitude interval at which these data are available.After determining the exobase altitude, we further calculated the temperature profile via downward integration of the diffusive equilibrium equation in the form of:


2 Results
In this study, we calculated the exobase temperatures of CO, O, N, and CO on Mars during the inbound portion of each MAVEN orbit. In Fig. 2, we present the exobase temperatures of the four species as a function of the exobase altitude; the black dashed lines indicate the respective median trends along with the standard deviations within the predefined altitude bins. Further, the red solid stars represent the respective median exobase altitudes and temperatures, combining all the measurements involved in this study.Fig. 2 also highlights several interesting features of the exobase temperatures of various species.

Fig. 2 Exobase temperatures of CO2, O, N2, and CO as a function of the exobase altitude on Mars. The black dashed lines indicate the median trends along with the standard deviations within the predefined altitude bins, whereas the red solid stars correspond to the median exobase altitude and temperature of all MAVEN measurements considered in this study
First, the figure suggests a large range of exobase altitudes from 150 to 300 km, which is in good agreement with previous results (Fu et al., 2020). Moreover,the figure reveals an even larger range of exobase temperatures from 100 to 400 K, as compared with the range of 130~350 K derived from ultraviolet spectrum observations (e.g., Forbes et al., 2008; Qin,2021). This is likely associated with the omnipresence of gravity waves in the upper Martian atmosphere(England et al., 2017) because the altitude range over which the exobase temperature was extracted in this study is comparable to typical vertical wavelengths(Siddle et al., 2019).
Second, despite the large scattering among different orbits, the figure indicates an apparent trend in which the exobase temperatures of each of the four species increased systematically with the exobase altitude. This trend can be reasonably interpreted based on the fact that the Martian exobase increases when the upper atmosphere is heated by enhanced solar radiation (Forbes et al., 2008; Fu et al., 2020), which would also elevate the exobase temperature. Such a scenario may also be supported by the exobase temperature variations with respect to solar flux, which are discussed in Section 4.
Third, the exobase temperatures varied among the different species. The median exobase temperatures of CO, O, N, and CO were 173, 152, 195, and 194 K,respectively. For a comparison, the corresponding exobase altitudes were 221, 202, 217, and 217 km for these four species, respectively (Fu et al., 2020). The lowest exobase temperature was noted for O, which also had the lowest exobase altitude; this possibly indicates that the temperature increases with the altitude,as noted above. However, this does not fully account for the comparison between the remaining three species with similar exobase altitudes but considerably different exobase temperatures. In particular, the highest exobase altitude was noted for CO, with an exobase temperature that is approximately 50 K lower than those of Nand CO. It remains to be investigated whether this is an actual effect or related to instrumental influences such as the underestimation of COdensities at high altitudes owing to the inappropriate subtraction of residual signals in mass channel 44.
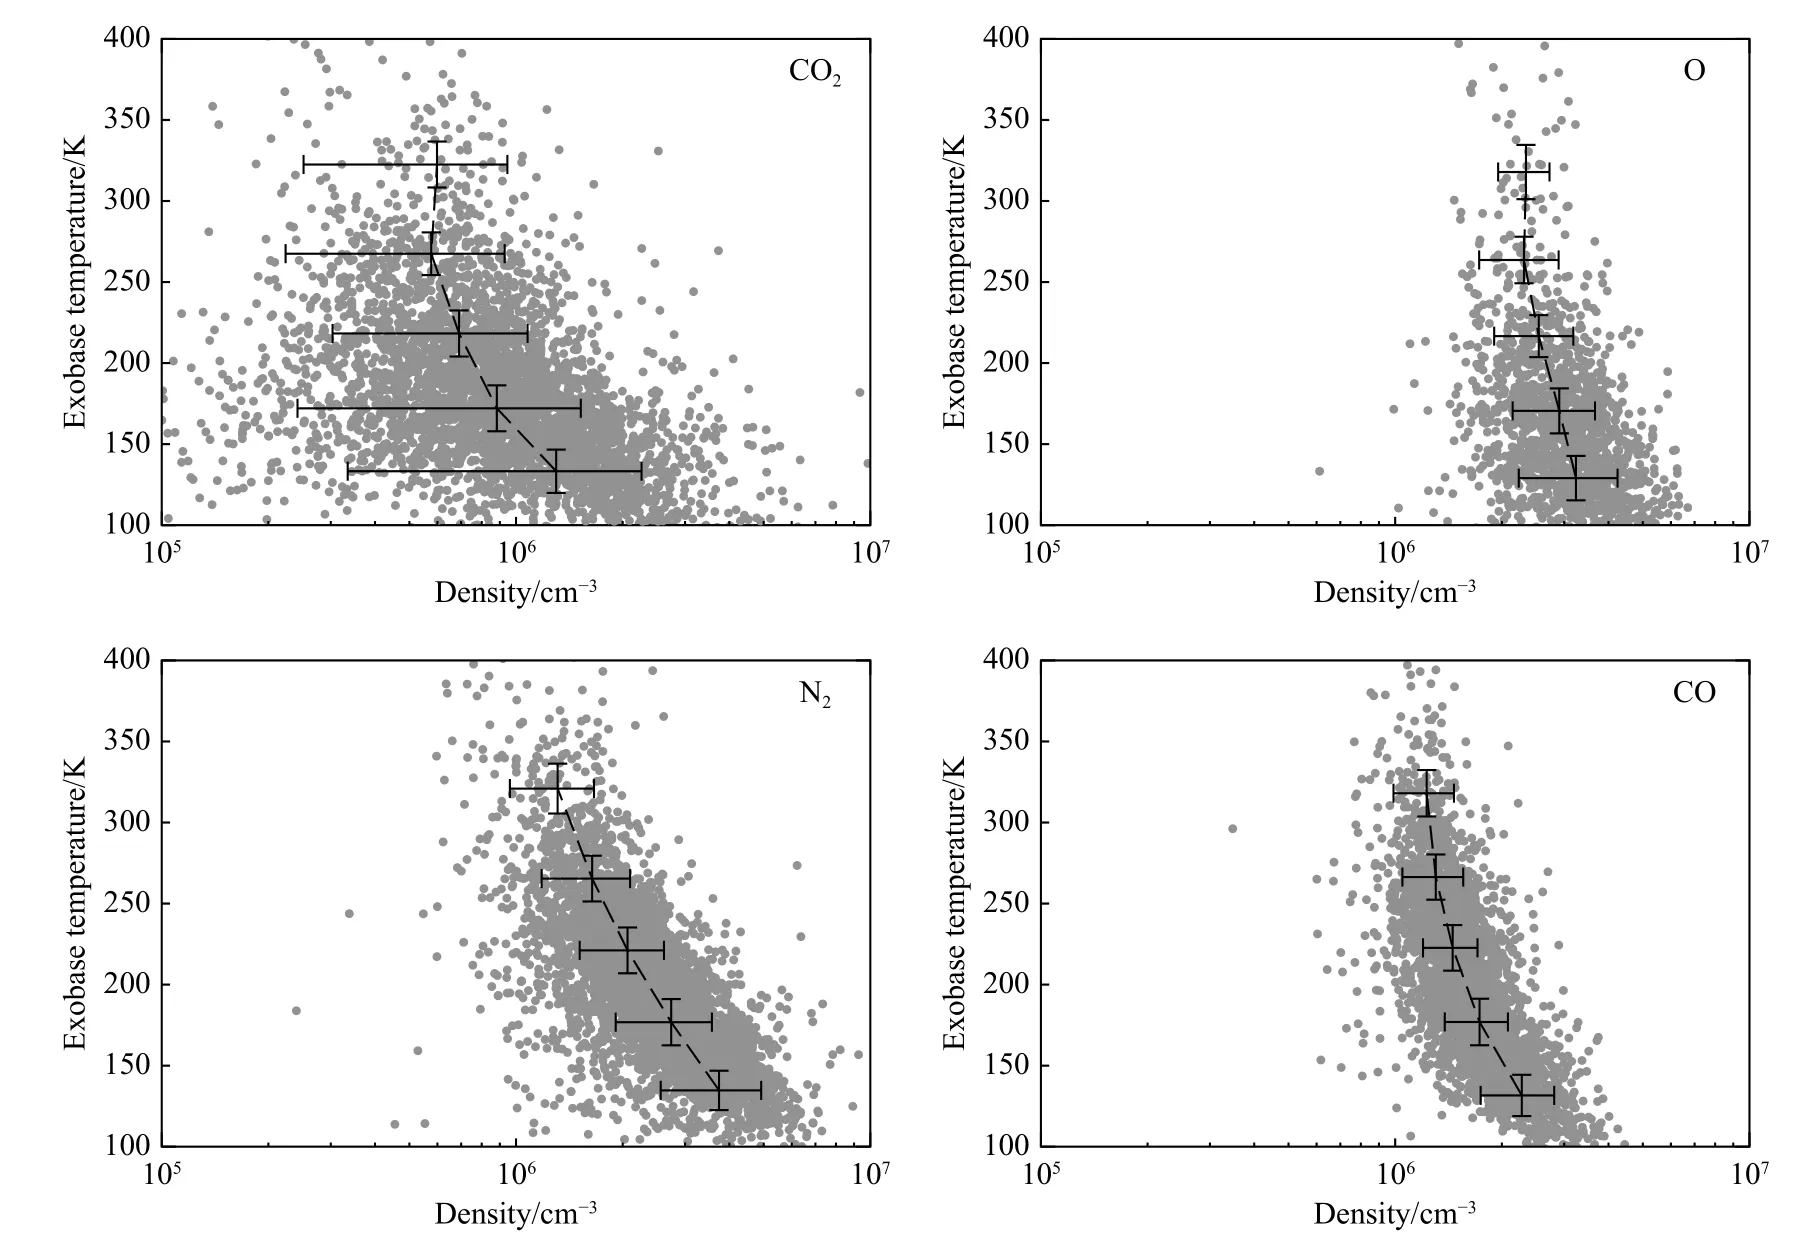
Based on equation 1, it is evident that the exobase altitude corresponds to the location where the vertical column density of a given species remains constant(Johnson et al., 2008). This also implies that the exobase pressure, which counterbalances the vertical column weight at higher altitudes, remains constant, or equivalently, the exobase temperature varies inversely with the exobase density, according to the ideal gas law. Such an inverse relation is presented in Fig. 3 as a reference, which fully supports our expectations.
3 Variations in exobase temperature
This section focuses on the exobase temperature variations of CO, O, N, and CO on Mars. Previous studies have reported clear solar zenith angle variations and dawn-dusk asymmetry in the upper Martian atmosphere in terms of both density and temperature structures (e.g., Bougher et al., 2009, 2017; Stone et al., 2018; Gupta et al., 2019; Cui et al., 2020). Motivated by these findings, we aimed to examine the diurnal variations in the exobase temperature. Furthermore,as mentioned in Section 3, the exobase temperature may vary extensively with solar radiation (e.g., Forbes et al., 2008; Bougher et al., 2009; Qin, 2021), as discussed below.

Fig. 3 Similar to Fig. 2 but for exobase temperatures of CO2, O, N2, and CO as a function of the exobase density on Mars
The exobase temperatures of CO, O, N, and CO on Mars are displayed in Fig. 4 as a function of the Martian local time. In this figure, the black dashed lines represent the respective median trends along with the standard deviations within the predefined local time bins. The exobase temperatures of the various species exhibited similar variations. Despite the large scattering among the different MAVEN orbits, the median trends for the four species clearly indicated that the exobase temperatures varied systematically with the solar illumination conditions. Specifically, a maximum COexobase temperature of 184 K was observed near the local time of 15 h, whereas a minimum exobase temperature of 144 K was observed near the local time of 2 h. Such a trend is analogous to the diurnal variations in the neutral temperature in the upper Martian atmosphere, as predicted by the Mars Global Ionosphere-Thermosphere Model (M-GITM)(e.g., Bougher et al., 2015). A similar trend was also suggested by MAVEN NGIMS measurements in terms of the exobase altitude or density in the upper Martian atmosphere (e.g., Gupta et al., 2019; Fu et al., 2020).
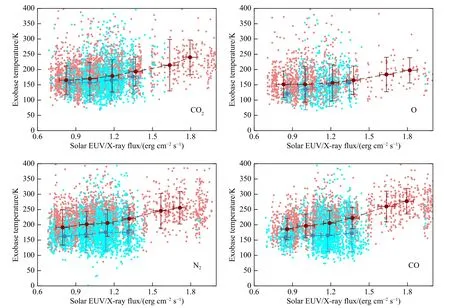
Fig. 5 presents the 157 exobase temperatures of CO, O, N, and CO on Mars as a function of the integrated EUV flux over 0.5~90 nm, which is the primary heating source for the upper Martian atmosphere(Gu et al., 2020). To exclude the impact of diurnal variations, we divided the calculated exobase temperatures into day side (red dots) and night side (blue dots)values. In Fig. 4, the median trend along with the standard deviations is marked in each panel. Furthermore,Fig. 5 clearly indicates that the day side exobase temperatures of the four species increased with the solar EUV flux. For instance, the exobase temperature of COincreased by 75 K when the integrated solar flux increased from 0.7 to 1.8 erg/cm/s. This trend is analogous to the solar cycle variations in temperature in the upper Martian atmosphere, as predicted by the MGITM (Bougher et al., 2015) and confirmed via IUVS observations (e.g., Forbes et al., 2008; Qin, 2021).However, this trend is not significant on the night side,according to Fig. 5. The variations in the exobase temperatures with respect to the local time and solar EUV flux, as outlined above, are the natural results of enhanced upper atmospheric heating on Mars in response to the enhanced solar EUV inputs (e.g.,Bougher et al., 2009, 2017; Gu et al., 2020). However,with regard to the night side results, this effect is considerably diminished; this is likely because precipitating solar wind electrons or atmospheric chemistry, at least partly, contribute toward the heating source on the night side of the upper Martian atmosphere (e.g.,Stone et al., 2018; Niu et al., 2021).

Fig. 4 Similar to Fig. 2 but for exobase temperatures of CO2, O, N2, and CO as a function of the Martian local time

Fig. 5 Exobase temperatures of CO2, O, N2, and CO on the day side (red dots) and night side (blue dots) as a function of the integrated solar flux at 0.5~90 nm on Mars. The black dashed lines represent the median trend along with the standard deviations within the predefined integrated solar flux bins
4 Summary
The exobase, an idealized interface above which atmospheric particles are lost to space, is a key concept for understanding the escape processes from solar system bodies (Johnson et al., 2008). With the aid of neutral density data measured by the MAVEN NGIMS from nearly 6 000 orbits, we calculated the exobase temperatures of the four most abundant species on Mars: CO, O, N, and CO. Our calculations indicate that the exobase temperatures are highly variable, with median temperatures of 175, 152, 195, and 194 K for CO, O, N, and CO, respectively. The exobase temperatures of all the four species increased systematically with an increase in the exobase altitude or a decrease in the exobase density.
Combining the MAVEN NGIMS and EUVM observations, we further examined the diurnal and solar cycle variations in the exobase temperatures of CO, O, N, and CO. Our analyses showed that the median exobase temperatures of the four species varied systematically with the solar illumination conditions, revealing a maximum temperature of ~184 K near the local time of 14 h and a minimum temperature of ~144 K near the local time of 2 h. Furthermore,we also found that the exobase temperatures of the four species increased with the solar EUV flux, a feature that was restricted to the day side and absent on the night side, where non-solar energy inputs are likely important. These variations in the exobase temperatures with the local time and solar EUV flux are the natural results of enhanced upper atmospheric heating on Mars in response to the enhanced solar EUV inputs(e.g., Bougher et al., 2009, 2017; Gu et al., 2020).Numerous studies have shown that the exobase temperature is crucial for controlling thermal escape from Mars, especially for light species such as H and H(Chaffin et al., 2014; Chaufray, 2021; Qin, 2021). The results reported here clarify the intensity of such a process and, consequently, the long-term evolution of habitability on Mars.
Data availability
The dataset used in this study is publicly available at the MAVEN Science Data Center (http://lasp.colorado.edu/maven/sdc/public/).
Acknowledgements
Gu H acknowledges the support from the National Natural Science Foundation of China,through grant 42105120.
