ANGPT: Angiopoietin; VEGFA: Vascular endothelial growth factor; PGF: Placental growth factor; AFP: Alpha-fetoprotein; IQR: Interquartile range; SD:Standard deviation, SE: Standard error.
2022-08-13YanDongMiaoXiaoLongTangJiangTaoWangDengHaiMi
Yan-Dong Miao, Xiao-Long Tang,Jiang-Tao Wang,Deng-Hai Mi
Abstract The expression of angiopoietin (ANGPT) 1, ANGPT2, vascular endothelial growth factor (VEGF) A, VEGFB, VEGFC, VEGFD, and placental growth factor (PGF) is significantly higher in tumor tissues than in normal tissues in both unpaired and paired hepatocellular carcinoma (HCC) samples. ANGPT2, VEGFB, VEGFC, and PGF are primarily involved in regulating the activation of the epithelialmesenchymal transition pathway; ANGPT1 is primarily involved in regulating the activation of the RAS/mitogen-activated protein kinase and receptor tyrosine kinase (RTK) pathways; VEGFA is engaged in regulating the RTK activation pathway; and VEGFD is mainly involved in regulating the activation of the tuberous sclerosis protein/mammalian target of rapamycin pathway. There is a significant difference in overall survival between HCC patients with high and low expression of ANGPT2, PGF, VEGFA, and VEGFD. Disease free survival (DFS) is significantly shorter in HCC patients with high ANGPT2, PGF, and VEGFA expression than in those with low ANGPT2, PGF, and VEGFA expression.
Key Words: Hepatocellular carcinoma; Angiogenesis; Marker; Bioinformatics analysis;Pathway
TO THE EDlTOR
We read with read interest the article by Choiet al[1], in which they initially evaluated plasma levels of angiogenesis biomarkers in hepatocellular carcinoma (HCC) patients, and then assessed their roles in forecasting overall survival (OS) and progression-free survival (PFS), indicating that the plasma level of angiopoietin (ANGPT) 2 was related to tumor stage, liver function, and cancer invasiveness, and that ANGPT2 performed better in predicting OS and PFS than alpha-fetoprotein (AFP), ANGPT1, and vascular endothelial growth factor (VEGF).
We appreciate the authors’ unique perspective in exploring the prognostic role of plasma levels of ANGPT1, ANGPT2, and VEGF in HCC. However, there are some errors in the original text that may cause confusion for readers. For example, the survival curve in figure 3B in the original article should have represented the survival curve between the high and low ANGPT2 expression subgroups, which the authors incorrectly labeled as ANGPT1. Second, it is well known that the VEGF family includes VEGFA, VEGFB, VEGFC, VEGFD, VEGFE, and placental growth factor (PGF)[2,3], so to which VEGF do the authors refer in the text? Usually, VEGF refers to VEGFA, but the authors should have clarified it in the text.
Moreover, it might make the results more significant if the authors could improve the outcome by demonstrating the differential expression of ANGPT1, ANGPT2, and VEGF in normal tissues and HCC tissues as a whole, for example, the analysis of HCC samples in the Cancer Genome Atlas database using bioinformatics. We found that the expression of ANGPT1, ANGPT2, VEGFA, VEGFB, VEGFC,VEGFD, and PGF was significantly higher in cancer samples than in corresponding normal samples in both unpaired and paired HCC samples (Figures 1A and B). Detailed statistical results are reported in Tables 1 and 2.
We also found that ANGPT2, VEGFB, VEGFC, and PGF are mainly involved in regulating the activation of the EMT pathway; ANGPT1 is prominently involved in regulating the activation of the RAS/mitogen-activated protein kinase and receptor tyrosine kinase (RTK) pathways; VEGFA is engaged in regulating the activation of the RTK pathway; and VEGFD is mainly involved in regulating the activation of the tuberous sclerosis protein/mammalian target of rapamycin pathway (Figure 1C).These results are consistent with those of previously reported studies[4-7]. Our findings could be a supplement to Choiet al’s study[1]. In the future, the roles of ANGPT1, ANGPT2, and VEGF in the development of HCC should be further explored.
Choiet al[1] found that OS was significantly shorter in the high ANGPT2 and high AFP subgroups than in the low ANGPT2 and AFP subgroups, respectively, though the differences in OS rates were not significant between the high and low ANGPT1 subgroups or between the high and low VEGF subgroups. Our study found that OS was significantly shorter in patients with high ANGPT2, PGF,VEGFA, or VEGFD expression than in those with low expression, respectively (Figures 2A-D;P< 0.05).However, there was no significant difference in survival time between patients with high and low expression of ANGPT1, VEGFB, VEGFC, and AFP (Figures 2E-H;P> 0.05). Prognostic data for HCC came from Liuet al[8].
In addition, we also analyzed the differences in disease free survival (DFS) between patients with high and low angiogenesis marker expression. We found that DFS was significantly shorter in the high ANGPT2, PGF, and VEGFA groups than in the low ANGPT2, PGF, and VEGFA groups, respectively(Figures 3A, B and C;P< 0.05). However, there was no significantly difference in DFS between groups with high and low expression of AFP, ANGPT1, VEGFB, VEGFC, and VEGFD (Figures 3D-H;P> 0.05).The above results confirm that the study performed by Choiet al[1] is of great value and that our discovery could be a supplement to their research.
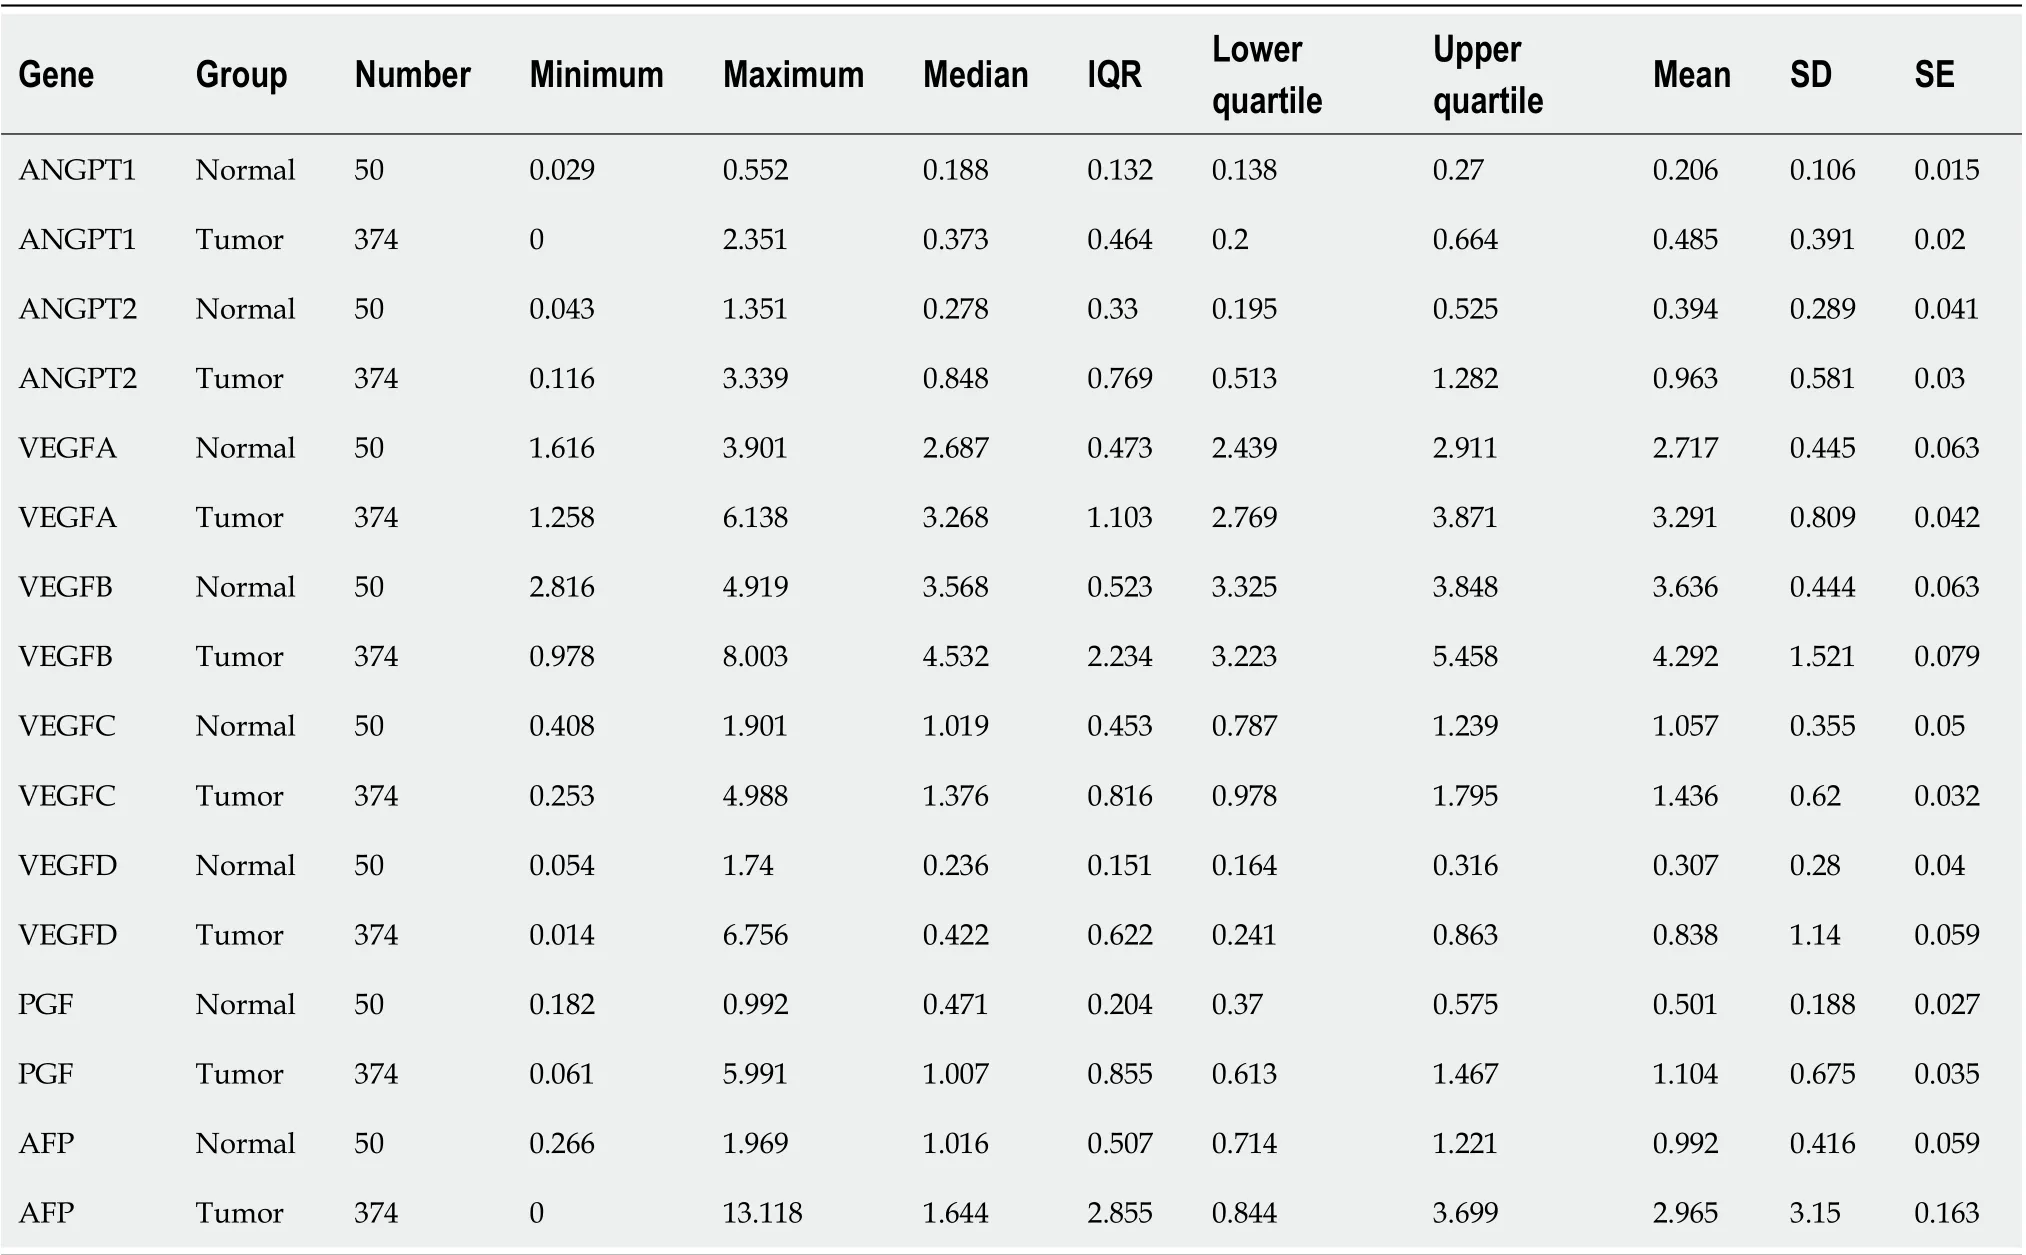
Table 1 Detailed statistical results of differential expression analysis of angiogenesis markers in hepatocellular carcinoma
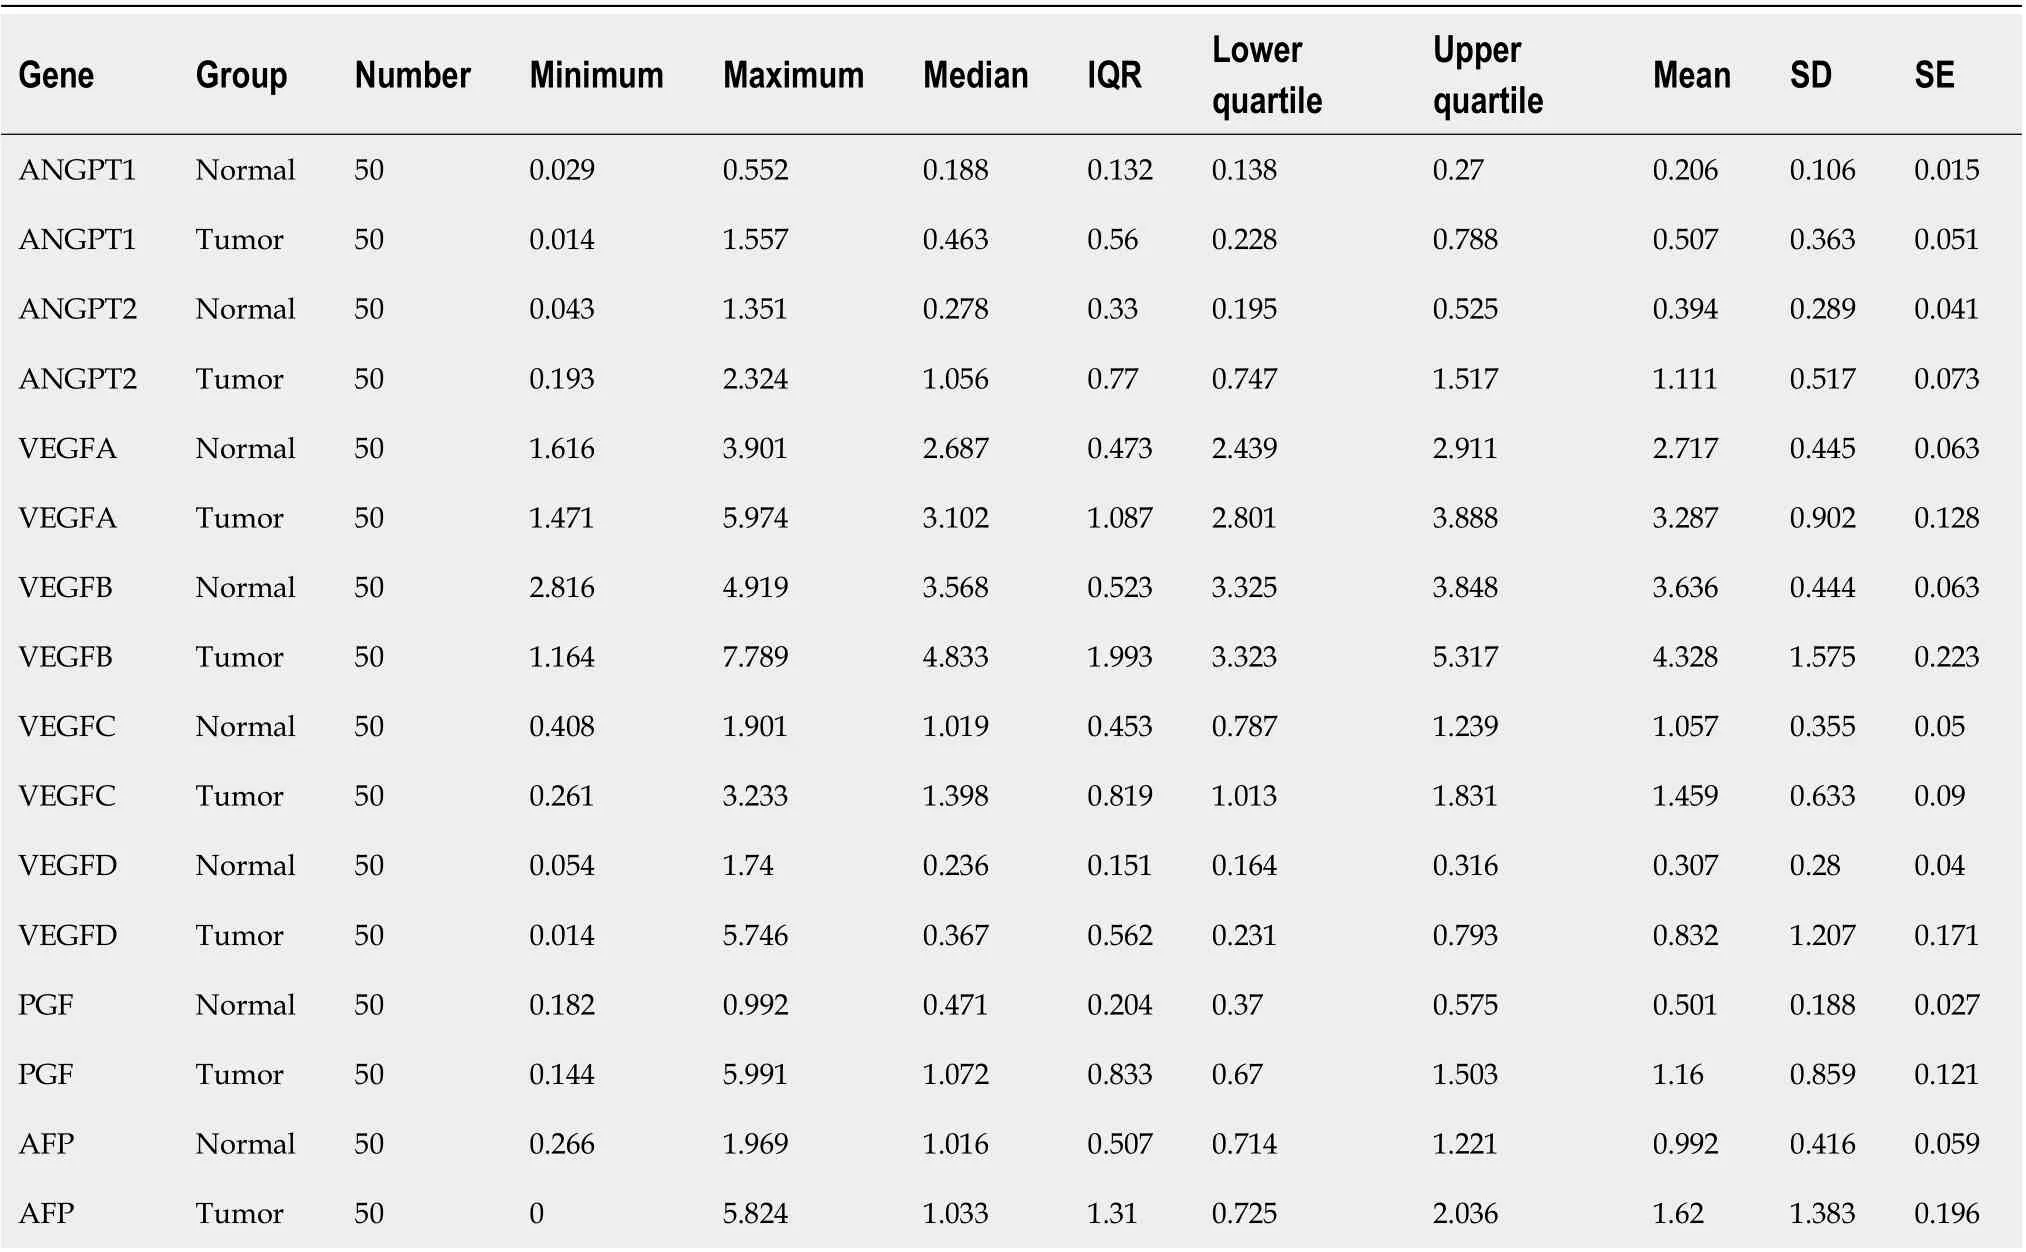
Table 2 Detailed statistical results of differential expression analysis of angiogenesis markers in paired samples of hepatocellular carcinoma
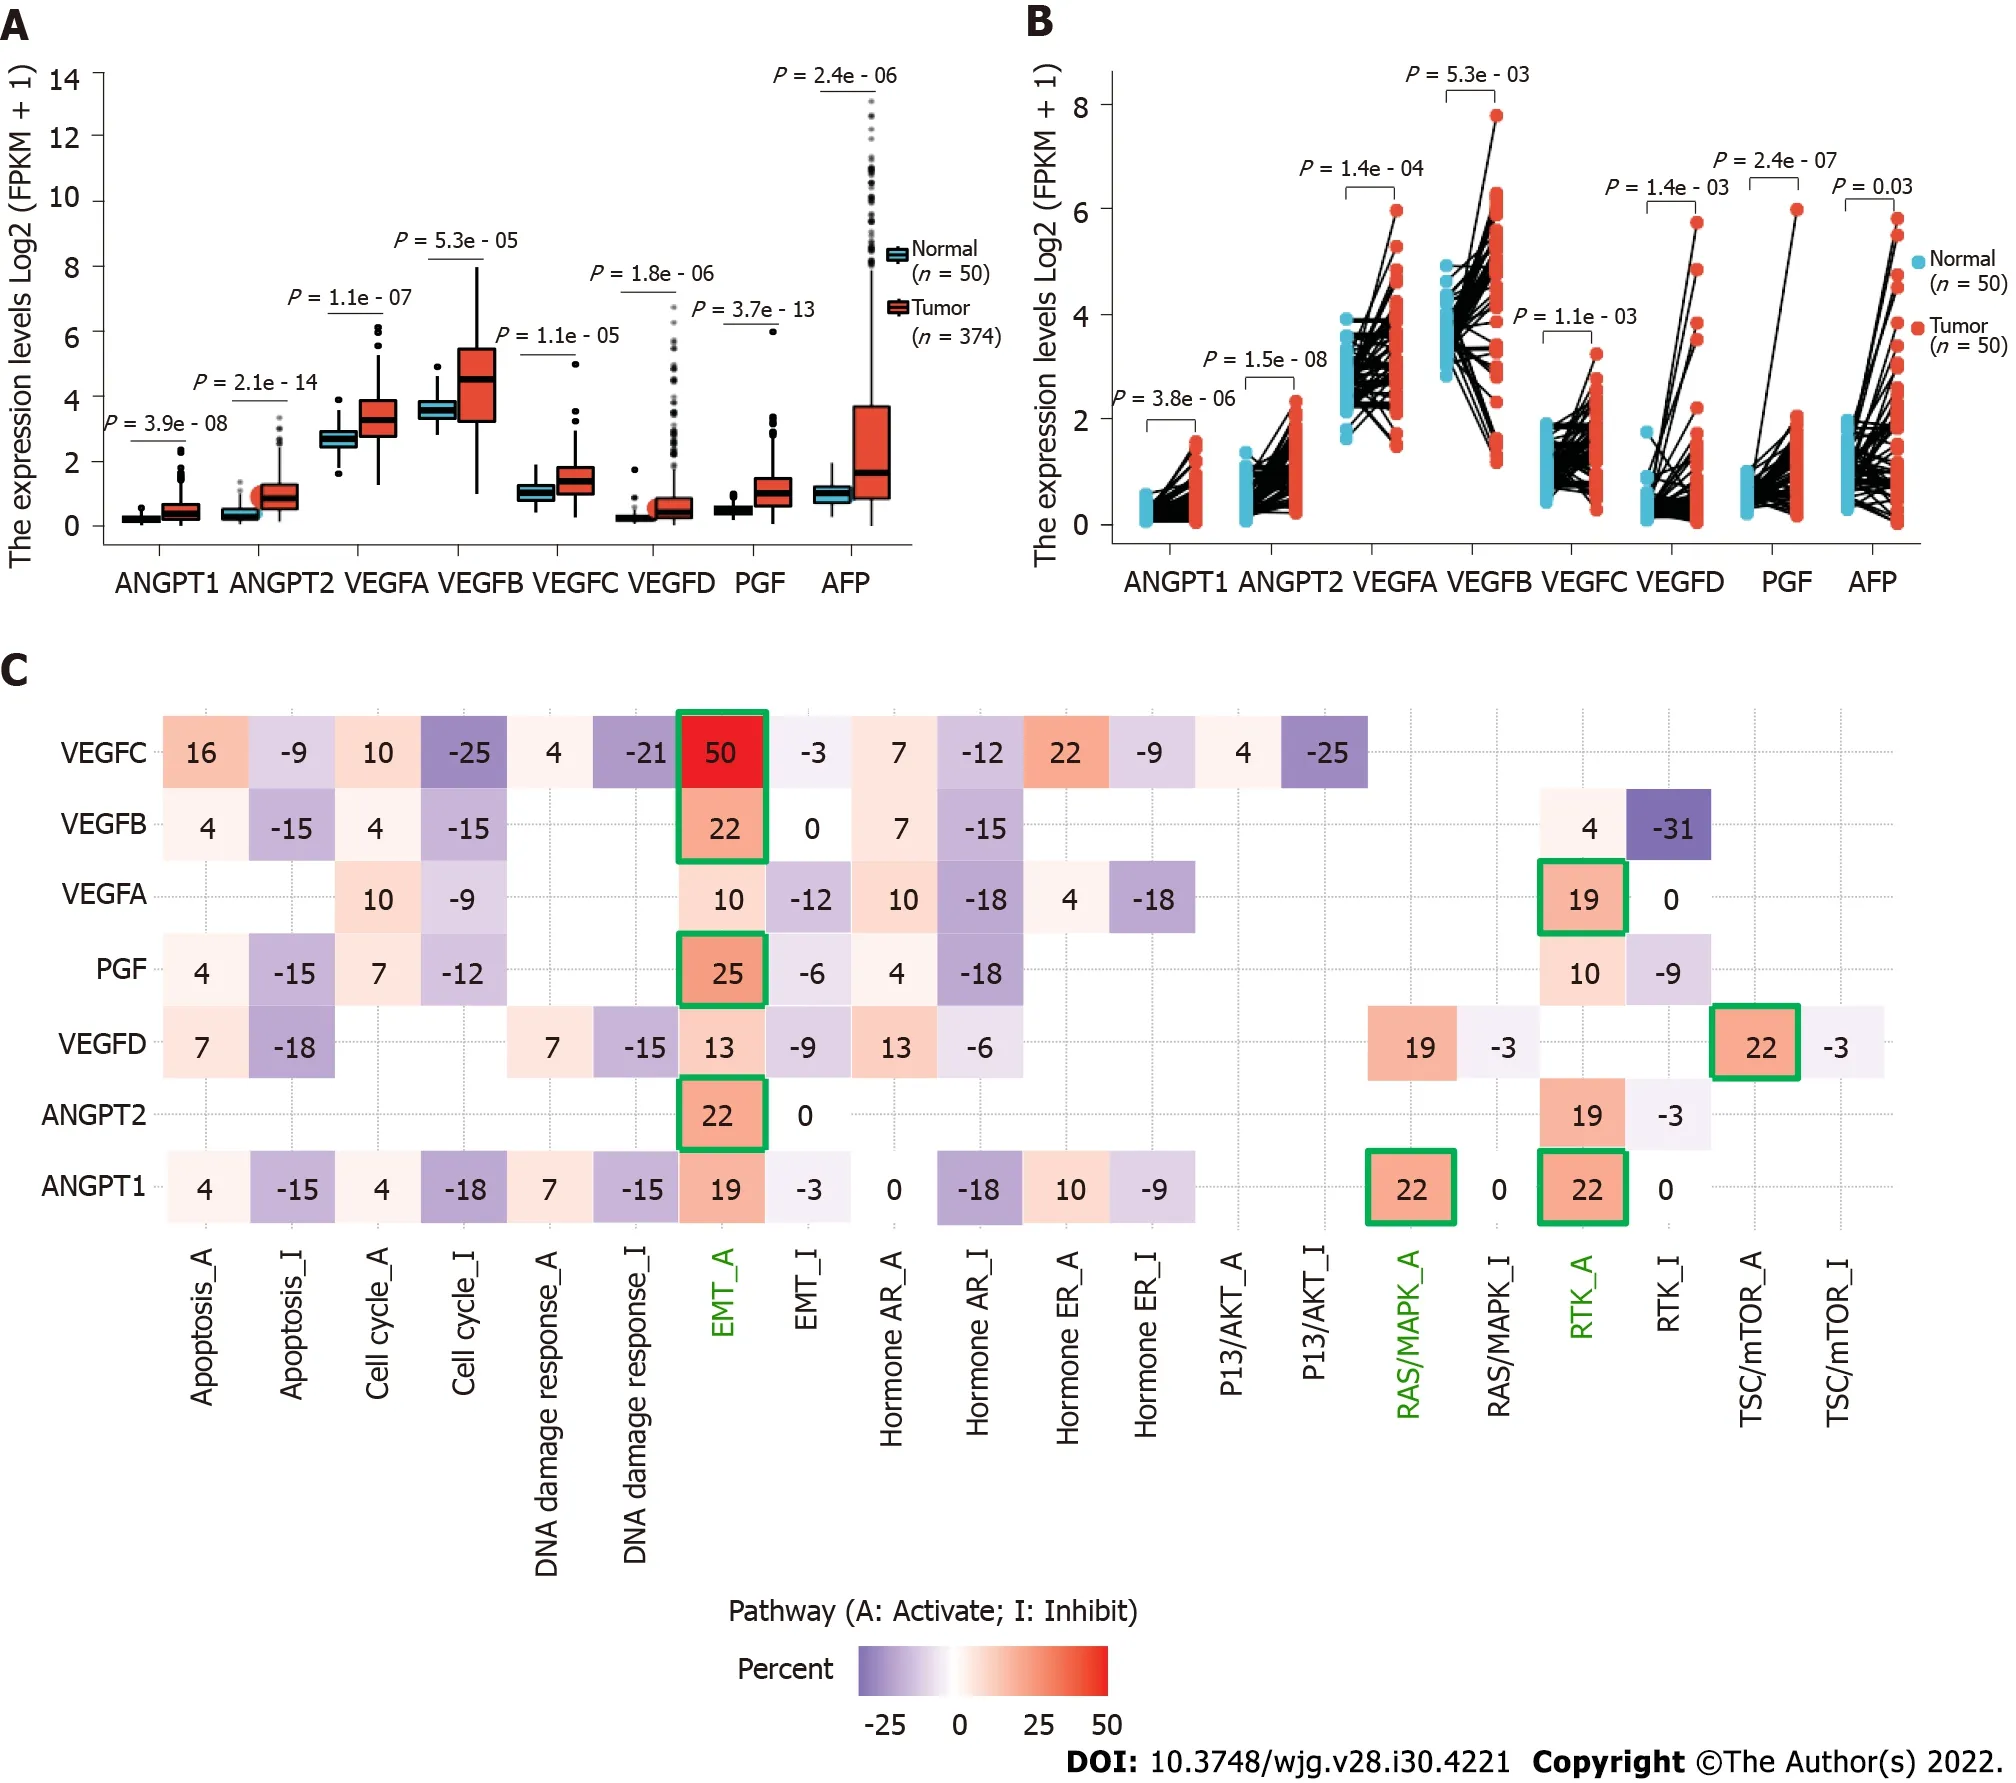
Figure 1 Roles of angiopoietins 1 and 2, vascular endothelial growth factors A-D, and placental growth factor in development of hepatocellular carcinoma. Data source: UCSC XENA (https://xenabrowser.net/datapages/) mRNA-Seq data of TPM format for GTEx and TCGA processed uniformly via the Toil process[11]. Liver hepatocellular carcinoma tissue data from TCGA and corresponding normal tissue data from GTEx were used. A: Differential expression of angiopoietin (ANGPT) 1, ANGPT2, vascular endothelial growth factor (VEGF) A, VEGFB, VEGFC, VEGFD, and placental growth factor (PGF) in hepatocellular carcinoma (HCC) and normal tissue samples; B: Differential expression of ANGPT1, ANGPT2, VEGFA, VEGFB, VEGFC, VEGFD, and PGF in paired HCC and normal samples. The expression in cancer tissues is represented in orange, and that in normal tissues is displayed in blue; C: Pathway analysis for ANGPT1, ANGPT2, VEGFA, VEGFB, VEGFC, VEGFD, and PGF in HCC. ANGPT: Angiopoietin; PGF: Placental growth factor; VEGF: Vascular endothelial growth factor; AFP: Alpha-fetoprotein; EMT: Epithelial-mesenchymal transition; AR: Androgen receptor; ER: Estrogen receptor; P13K/AKT: Phosphatidylinositol 3 kinase/AKT;RAS/MAPK: RAS/mitogen-activated protein kinase; RTK: Receptor tyrosine kinase; TSC/mTOR: TSC/mammalian target of rapamycin.
Statistical analysis
We utilized R (version 4.0.3) to perform statistical analyses and display the results. The differential expression analysis of angiogenesis markers between HCC tissues and corresponding normal tissues was performed using the Wilcoxon rank-sum test, and the results are presented by using R-package“ggplot2”[9]. Survival analysis was completed through log-rank test and COX regression. Pathway analysis was performed based on the online database GSCALite (http://bioinfo.life.hust.edu.cn/web/GSCALite/)[10].
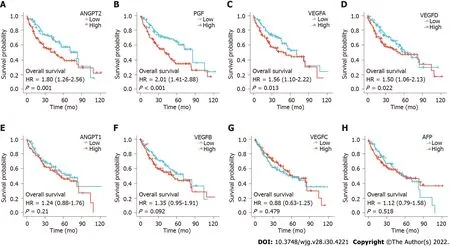
Figure 2 Overall survival by angiogenesis marker expression in hepatocellular carcinoma. A: Angiopoietin (ANGPT) 2; B: Placental growth factor; C:Vascular endothelial growth factor (VEGF) A; D: VEGFD; E: ANGPT1; F: VEGFB; G: VEGFC; H: Alpha-fetoprotein. The red and blue lines indicate the survival curves of the high and low angiogenesis marker expression groups, respectively. ANGPT: Angiopoietin; PGF: Placental growth factor; VEGF: Vascular endothelial growth factor; AFP: Alpha-fetoprotein; HR: Hazard ratio.
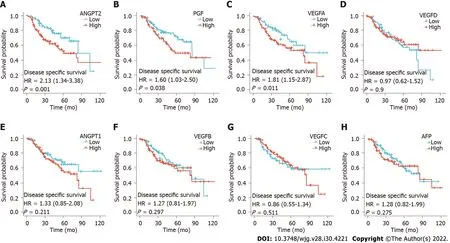
Figure 3 Disease free survival by angiogenesis marker expression in hepatocellular carcinoma. A: Angiopoietin (ANGPT) 2; B: Placental growth factor; C: Vascular endothelial growth factor (VEGF) A; D: Alpha-fetoprotein; E: ANGPT1; F: VEGFB; G: VEGFC; H: VEGFD. The red and blue lines indicate the survival curves of the high and low angiogenesis marker expression groups, respectively. ANGPT: Angiopoietin; PGF: Placental growth factor; VEGF: Vascular endothelial growth factor; AFP: Alpha-fetoprotein; HR: Hazard ratio.
ACKNOWLEDGEMENTS
We are grateful to the professors at the School of Foreign Languages of Lanzhou University for their help in the language polish of this manuscript.
FOOTNOTES
Author contributions:Mi DH and Miao YD designed the research; Miao YD wrote this comment; Miao YD and Tang XL performed data analysis and prepared the tables and figures; Wang JT downloaded the data; Mi DH reviewed the manuscript; Miao YD and Tang XL contributed equally to this work; and all authors approved the final manuscript.
Supported bythe Special Plan for Condition Construction of Gansu Provincial Scientific Research Institutes, No.20JR10RA432.
Conflict-of-interest statement:All the authors report no relevant conflicts of interest for this article.
Open-Access:This article is an open-access article that was selected by an in-house editor and fully peer-reviewed by external reviewers. It is distributed in accordance with the Creative Commons Attribution NonCommercial (CC BYNC 4.0) license, which permits others to distribute, remix, adapt, build upon this work non-commercially, and license their derivative works on different terms, provided the original work is properly cited and the use is noncommercial. See: https://creativecommons.org/Licenses/by-nc/4.0/
Country/Territory of origin:China
ORClD number:Yan-Dong Miao 0000-0002-1429-8915; Xiao-Long Tang 0000-0001-9229-6424; Jiang-Tao Wang 0000-0002-1222-164X; Deng-Hai Mi 0000-0002-8643-4496.
S-Editor:Wang JJ
L-Editor:Wang TQ
P-Editor:Wang JJ
杂志排行

World Journal of Gastroenterology的其它文章
- Role of one-step nucleic acid amplification in colorectal cancer lymph node metastases detection
- Current perspectives on the role of liver transplantation for Langerhans cell histiocytosis: A narrative review
- Gut microbiota, inflammatory bowel disease and colorectal cancer
- Thrombocytopenia in chronic liver disease: Physiopathology and new therapeutic strategies before invasive procedures
- P2X7 receptor blockade decreases inflammation, apoptosis, and enteric neuron loss during Clostridioides difficile toxin A-induced ileitis in mice
- Serological profiling of Crohn’s disease and ulcerative colitis patients reveals anti-microbial antibody signatures