Large aperture phase-coded diffractive lens for achromatic and 16°field-of-view imaging with high efficiency
2022-08-01GuMa马顾PengLeiZheng郑鹏磊ZhengWenHu胡正文SuoDongMa马锁冬FengXu许峰DongLinPu浦东林andQinHuaWang王钦华
Gu Ma(马顾), Peng-Lei Zheng(郑鹏磊), Zheng-Wen Hu(胡正文), Suo-Dong Ma(马锁冬),3,Feng Xu(许峰),†, Dong-Lin Pu(浦东林), and Qin-Hua Wang(王钦华),‡
1School of Optoelectronic Science and Engineering and Collaborative Innovation Center of Suzhou Nano Science and Technology,Soochow University,Suzhou 215006,China
2Key Laboratory of Advanced Optical Manufacturing Technologies of Jiangsu Province and Key Laboratory of Modern Optical Technologies of Education Ministry of China,Soochow University,Suzhou 215006,China
3CAS Key Laboratory of Space Precision Measurement Technology,Xi’an 710119,China
Keywords: achromatic imaging,diffractive lens,phase coding,large aperture,high efficiency
1. Introduction
Diffractive optical elements(DOEs)have been applied to many modern optical systems, such as ultra-large space telescope primaries,[1]spectroscopy,[2]x-ray microscopy,[3,4]and extreme ultra violet(EUV)lithography,[5]due to their unique characteristics of light weight and compact size. As typical DOEs, amplitude-type diffractive lens (DL), such as Fresnel zone plates and photon sieves, can be used for optical imaging. Fresnel zone plate is the earliest amplitude DL,which is composed of a series of concentric transmissive and opaque annular zones. The photon sieve, which is evolved from the Fresnel zone plate,was proposed by Kippet al. in 2001[6]as a new class of DOE.Unlike the Fresnel zone plate,the photon sieve uses a large number of pinholes of different sizes to replace the transmissive annular zones of the Fresnel zone plate,which is superior to the Fresnel zone plate in that it possesses higher resolution and more flexible design. In 2005, Andersen proposed and fabricated a photon sieve, whose working wavelength is at 532 nm and effective working FOV is±0.5°.[7]However, as typical DOEs, amplitude-type DL suffers severe chromatic aberration and off-axis aberration, and therefore, it can work only at the designed wavelength and on-axis FOV (i.e.near-zero FOV), which significantly limits the applications of conventional amplitude-type DL in optical imaging. In 2007,Andersen and Tullson further proposed a broadband telescope system with a photon sieve as its primary mirror,[8]in which the bandwidth of the system is extended to 40 nm with a set of complicated correction lenses.In the same year, Furlanet al.[9]fabricated and tested fractal zone plates (FraZPs) which can be used in white-light imaging. The physical mechanism of the FraZPs is that it produces a series of subsidiary foci around each major focus. These subsidiary foci provide an extended depth of focus for each wavelength that partially overlaps with each other, producing an overall extended depth of focus that is less sensitive to chromatic aberration. However,the price paid to reduce the chromatic aberration of FraZPs is a reduced resolution, low energy efficiency, and strong background stray light. In 2015,Zhaoet al.[10]proposed and demonstrated an achromatic photon sieve based on the phase coding technology, in which a separated bulk aspheric phase element is placed in front of a conventional photon sieve to reduce the sensitivity of photon sieve to incident wavelengths. In 2016,Zhaoet al.[11]further proposed a wavefront coded photon sieve, in which the pinholes in the photon sieve are directly coded (i.e.positions of each pinhole are re-organized), and thus generating equal focusing power in a wide range of operating wavelength with a single thin-film element without any other auxiliary elements.The experimental results show that the working bandwidth of the wavefront coded photon sieve reaches 28 nm at the central wavelength of 632.8 nm. In the same year,Zhaoet al.[12]also found that a wide FOV imaging with a photon sieve can be achieved by coding the positions of pinholes of the photon sieve. The experimental results show that the FOV of the phase-coded photon sieve reaches±4°. In 2017,Sunet al.[13]proposed a fully transparent photon sieve that has 100%transmission efficiency. However,the proposed transparent photon sieve can work only at a single designed wavelength and very small FOV.In 2018,Liet al.[14]proposed a harmonic diffraction wavefront coded photon sieve that can be used in multispectral imaging. However,the energy efficiencies of all those amplitude-type DLs are limited to~20%because the opaque areas block at least half of the incident radiation.
Phase-type DL is an improvement over the amplitudetype DL in terms of energy efficiency since a 2πphase shift is introduced by varying the thickness of the transmitting lens material, replacing the alternative transmissive and opaque zones in the amplitude-type one. Physically, the working principle of a phase-type DL is essentially the same as that of amplitude-type DL so that conventional phase-type DL can also work only at a designed single wavelength and onaxis FOV.Recently,the direct-binary-search algorithm is used to optimize the surface microstructure of achromatic DL. In 2018,Mohammadet al.[15]designed and fabricated two achromatic DLs with the direct-binary-search algorithm,which can work in a visible band from 450 nm to 750 nm. However,the larger one of their diameters is only~0.36 mm, and the higher one of their average focusing efficiencies is only~40%, where their defined focusing efficiencies refer to the power inside a circle of diameter equal to 3 times the size of the corresponding diffraction-limited spot. In 2020,Meemet al.[16]created a large-area multi-level DL with a diameter of 4.13 mm,a bandwidth of~35 nm,and transmission efficiency of~90%by using the direct-binary-search algorithm. However,the transmission efficiency refers to the power circled by the spot of radius~10×full width at half-maximum(FWHM)and the provided figure shows that the relative encircled power in 3×FWHM is only~40%. In the same year, Doskolovichet al.[17]proposed a method of designing spectral diffractive lenses having a fixed focus position at several discrete wavelengths. The experimental results show that the efficiency values of a spectral diffractive lens with a diameter of 8 mm at 450,500,540,580,and 620 nm are only 24.6%,8.7%,9.3%,16.1%,and 23.3%respectively. On the one hand,it is difficult to design a large aperture DL for achromatic imaging with the optimal algorithm,which is limited by the computation cost of optimization. On the other hand, these achromatic DLs optimized by algorithms usually show low efficiency in the experiment,which makes it difficult for them to obtain clear images due to noise.
In this paper,a novel PCDL for achromatic imaging with a large aperture and high efficiency is proposed and demonstrated experimentally,in which the phase distribution is coded by a cubic phase function based on the conventional Fresnel diffractive lens. Owing to the introduction of the cubic term,the proposed PCDL shows spectrally and spatially invariant PSFs without using the optimization algorithm,which enables the imaging of PCDL both in a wide wavelength range and a wide FOV.A PCDL with a diameter of 10 mm,a focal length of 100 mm is designed and fabricated. Both simulation results and experimental results indicate that the proposed PCDL can show diffraction-limited imaging simultaneously in a wavelength range of 50 nm and an FOV of 16°without any complicated auxiliary optical system. Further experiments show that the PCDL has a high tolerance of ring width error which reduces significantly the difficulty in fabricating. Furthermore,the focusing efficiency of the fabricated PCDL can reach 80%under both 50-nm bandwidth illumination and 16°FOV. The proposed PCDL provides a novel idea about large aperture and achromatic diffractive lens with high focusing efficiency,which has great potential applications in large space telescopes and other imaging systems.
2. Theory of phase-coded DL
For a conventional phase-type DL(CDL),due to the characteristic that its focal length is inversely proportional to the wavelength, its chromatic aberration is essentially a defocusing phenomenon caused by different focal positions at different wavelengths. The wavefront coding technology is proposed by Dowski and Cathey in 1995 to extend the depth of focus,with a cubic phase mask used in the optical system.[18]The one-dimensional PSFh(x,W20) of the wavefront coding system can be approximated by the stationary phase method,which can be described as[19]

wherexis the one-dimensional coordinate,W20is the traditional defocusing aberration constant in the unit of wavelength,kis the wavenumber, andαis a phase coding parameter. As can be seen from the term (kW20)2+6παxand the term 3α±2|kW20|,the influence ofW20on the PSFh(x,W20)is weakened byα,which means that the PSF of the wavefront coding system is tolerant to the defocusing aberration.The traditional defocusing aberration constantW20can be described as follows:

whereDis the diameter of the imaging system,fis the focal length of the designed wavelength of the imaging system,and Δfis the distance out of focus. For a CDL, the relation between the wavelength and the corresponding focal length can be written as

whereλis the designed wavelength, Δλis the wavelength drift,fis the focal length ofλ, and Δfis the distance from focus. Therefore,for a CDL,the relation betweenW20and Δλcan be related by

It can be seen from Eq.(4)that the defocusing aberration constantW20is proportional to the wavelength drift Δλ, which means that the influence of the wavelength drift Δλon the PSFh(x,W20)can also be reduced byα. Therefore,the wavefront coding technology can be used to eliminate the chromatic aberration of a CDL.
Besides, Zhaoet al. also found that the wavefront coding technology can help the incident light in different FOVs gain equal focusing power.[12]Here, instead of inserting any auxiliary elements into the optical system,a cubic term is introduced into the phase function of CDL in our design to eliminate the chromatic and off-axis aberration, which can also avoid huge computation cost of optimization and enable the design of large aperture DL.In the wavefront coding system,the occupied energy of the triangled PSF area is about 100%of that of the image plane,[19]hence the proposed PCDL can achieve high focusing efficiency.
The phase distribution of a CDL can be described as

where (x,y) is the position in the plane,λis the designed wavelength,fis the designed focal length of the CDL, andkis the integer used to ensure thatφis between 0 and 2π.The phase distribution of the PCDL is coded by a cubic phase function based on CDL as follows:

whereαis a phase coding parameter,Ris the radius of the PCDL, other parameters remain the same definition as those in Eq. (5). When a large aperture PCDL is designed, its microstructure can be predicted by Eq.(6),which can avoid huge optimization cost.

Fig.1. Phase distribution of(a)CDL and(b)PCDL.Sectional phase profile along y=x of(c)CDL and(d)PCDL.
Figures 1(a) and 1(b) show the phase distribution of the CDL and PCDL with the same diameter and focal length,which are calculated from Eqs. (5) and (6) respectively. It is seen in Fig. 1(b), compared with the rotationally symmetric phase distribution of CDL shown in Fig. 1(a), the symmetrical axis of the phase distribution of PCDL is alongy=x,which clearly shows the distribution change due to the coding effect. Figures 1(c)and 1(d)show the sectional profile of the CDL and PCDL alongy=x. Compared with the achromatic DLs optimized by algorithms,[15–17]the coded micro-rings of PCDL can greatly reduce the difficulty in designing.
3. Simulation
3.1. Achromatic imaging with PCDL
A PCDL with an aperture of 10 mm, focal length of 100 mm, designed wavelength of 650 nm, and phase coding parameterα=30πis designed and simulated. After trying different values ofα,it is found that ifαis less than 30π,the consistency of the MTFs at different operating wavelengths is not good enough. Ifαcontinues to increase from 30π, the MTFs of the PCDL will become lower, which will result in noise enhancement after deconvolution.[20]Therefore,a phase coding parameter of 30πis chosen and used in our design. As a comparison,a CDL(i.e.,α=0)with the same lens parameters as the PCDL is also simulated. For the CDL,the annular microstructures are rotationally symmetric around the optical axis and the number of annular microstructures is calculated to be 192 within the lens aperture. For the PCDL, the microstructure is not rotationally symmetric and the numbers of microstructures in different directions are different. The number of microstructures in the positivexdirection is 177 and the number in the negativeydirection is 207. Figures 2(a)and 2(b)show the point spread function(PSF)of the CDL and the PCDL,respectively,at different incident wavelengths fromλ=625 nm to 675 nm. As expected, the CDL suffers large chromatic aberration due to the high wavelength dependence.The PSF of the CDL is diffused when the incident light deviates from the designed wavelength of 650 nm [Fig. 2(a)]. In contrast, the PSF of the PCDL remains unchanged within a wide range of wavelengths fromλ=625 nm to 675 nm. The PSF of the PCDL outside the wavelength range of 625 nm–675 nm shows deviation from the triangled shape. The bandwidth between 625 nm and 675 nm can thus be considered as an effective working bandwidth of the PCDL with a phase coding parameter ofα=30π.

Fig.2. PSFs of(a)CDLand(b)PCDLat different incident wavelengths from λ =625 nm to 675 nm. (a)CDL,(b)PCDL.

Fig.3. Normalized three-dimensional MTFs of(a)CDL and(b)PCDLat different incident wavelengths from λ =650 nm to 675 nm.
Figures 3(a) and 3(b) show the normalized threedimensional modulation transfer functions(MTFs)of the CDL and their comparisons with the PCDL at the incident wavelengths from 650 nm to 675 nm. It can be seen from Fig.3(b)that the MTF of the PCDL is similar to that of the traditional wavefront coding system.[21]Figure 4 shows the normalized MTFs along the positivexaxis of the CDL in Fig.1 and their comparisons with the PCDL at the incident wavelengths from 65 nm to 675 nm. When the incident wavelength deviates from the designed wavelength, the MTF of the CDL drops sharply and zeros appear (dashed line), resulting in the loss of spatial frequency in the image. In contrast,the MTFs of the PCDL remain unchanged within the wavelength range fromλ=625 nm to 675 nm. All the spatial frequency information is preserved because there are no zero points appearing in the MTFs from high to low frequency, which means that all the intermediate blurred images can be restored by a fixed digital filter,and therefore,the working bandwidth of the PCDL can be significantly broadened.
Figure 5(a) shows the simulated imaging results of the CDL at different incident wavelengths fromλ=615 nm to 685 nm. When the incident wavelength deviates from the designed wavelength, the image of the CDL becomes more and more blurred because of its wavelength dependence. The bandwidth of the CDL can be quantified by Δλ=±2λ2f/D2,which is about±0.85 nm in our case.[8]Figure 5(b) shows the intermediate blurred images of the PCDL. All simulated sensor images include Gaussian noise,of which the mean and variance are 4 and 5. It is seen that all the blurred images are the same at different incident wavelengths fromλ=625 nm to 675 nm, which suggests that these images can be restored with a fixed digital image filter. Figure 5(c)shows the restored images of the PCDL in which the PSF at the designed wavelength is employed as the digital filter.As seen in Fig.5(c),the intermediate blurred images (λ=625 nm to 675 nm) can be well restored and the resolutions of all restored images are almost the same as those of the CDL at the designed wavelength,i.e.650 nm.

Fig.4. Normalized MTFs along positive x axis of the designed CDL and designed PCDL in Fig.1 at different incident wavelengths from λ =650 nm to 675 nm.

Fig. 5. Simulated results of (a) imaging with (a) CDL, (b) intermediate imaging with the PCDL, and (c) restored imaging with PCDL at different wavelengths from λ =615 nm to 685 nm.
3.2. 16° FOV imaging with PCDL
The CDL and PCDL also show different imaging characteristics in FOV. Figures 6(a) and 6(b) show the PSFs of the CDL and the PCDL with the same parameters as those in Fig. 2 at different FOVs from-8°to 8°. As expected, the PSFs of the CDL are diffused with the increase of FOV deviation from the 0°FOV(i.e.on-axis)[Fig.6(a)],which means that the CDL can work only at the near-0°FOV. In contrast,the PSFs of the PCDL remain unchanged within a wide range of FOV from-8°to 8°. The PSFs of the PCDL outside the FOV range of-8°to 8°show deviations from the triangled shape. The FOV between-8°to 8°can thus be considered as an effective working FOV of the PCDL with a phase coding parameter ofα=30π, which is a significant extension compared with the CDL.
Figure 7 shows the normalized MTFs along the positivexaxis of the CDL in Fig. 1 and their comparisons with the PCDL at different FOV from-8°to 8°. The MTFs of the CDL drop significantly when the FOV deviates from the onaxis. In contrast, the MTFs of the PCDL remain unchanged in a range of FOV from 0°to 8°. The spatial frequency information is preserved because there are no zero points appearing in the MTFs from high to low frequency,which means that all the intermediate blurred images can be restored,and therefore,the working FOV of the PCDL can be significantly broadened.

Fig.6. PSFs of(a)CDL and(b)PCDL at different FOVs from-8° to 8°.
Figure 8(a) shows the simulated imaging results of the CDL at different FOVs from-8°to 8°. It is seen that when the FOV deviates from the 0°FOV (on-axis), the image of the CDL becomes more and more blurred. Figure 8(b)shows the intermediate blurred images of the PCDL,from which it is seen that all the blurred images are the same at different FOVs from-8°to 8°.Figure 8(c)displays the restored images of the PCDL in which the PSF at the 0°FOV is employed as a digital filter. From Fig.8(c),we can see that all the intermediate blurred images can be well restored.

Fig. 7. Normalized MTFs along positive x axis of CDL and the PCDL in Fig.1 at different FOVs from 0° to 8°.
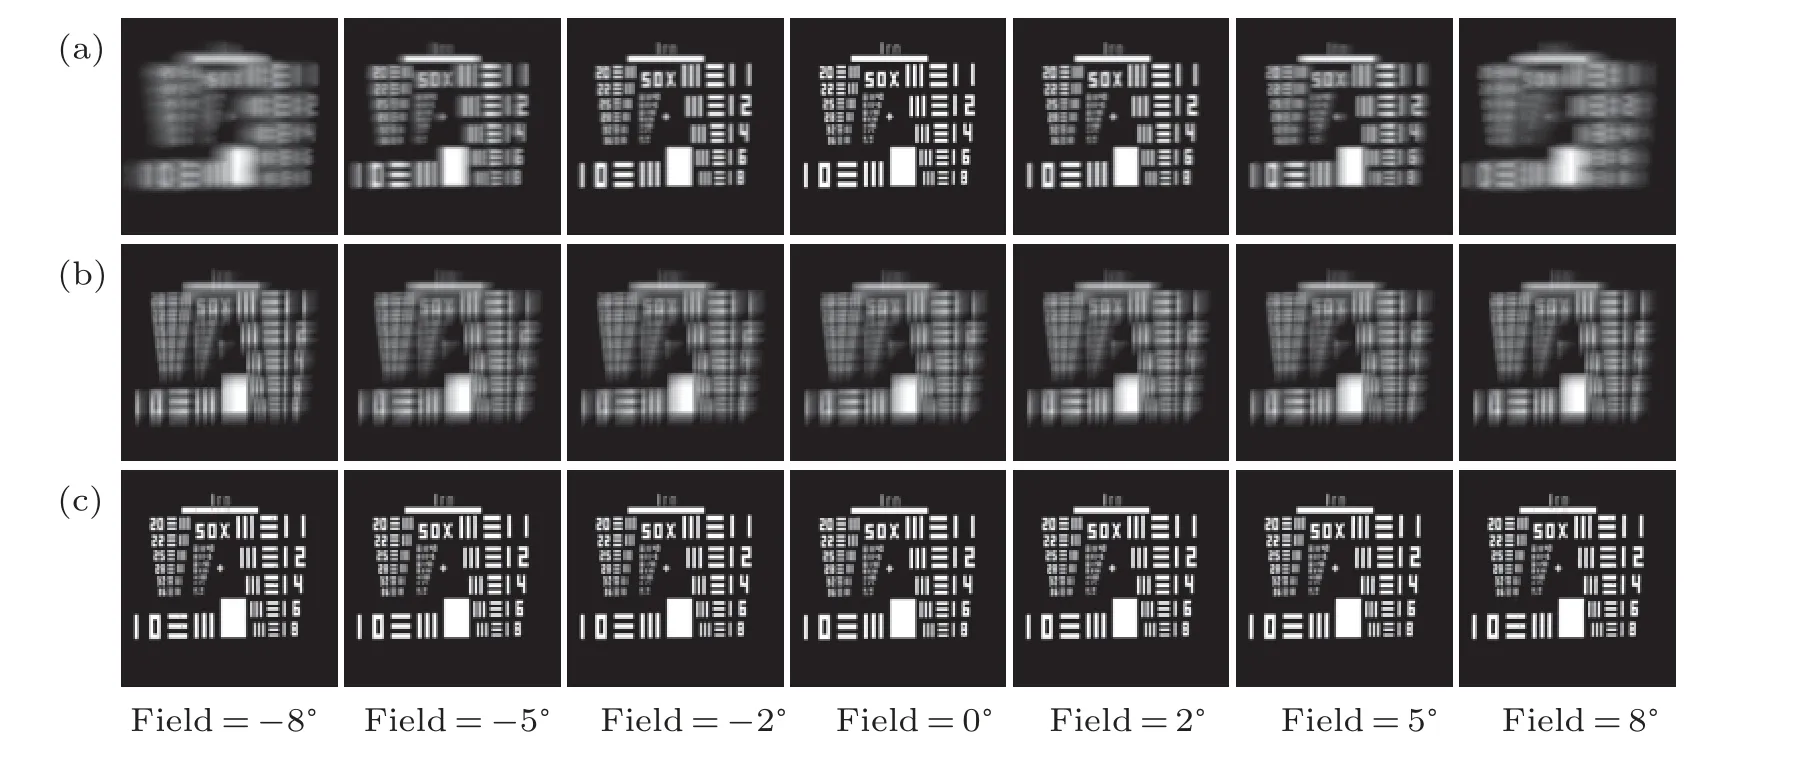
Fig.8. Simulated results of(a)images produced by CDL,(b)intermediate blurred images produced by PCDL,and(c)restored images of intermediate blurred images produced by PCDL,at different FOV from-8° to 8°.
3.3. Tolerance of ring width error
Fabrication errors pose a great influence on the imaging quality of DOEs.The proposed PCDL can significantly loosen the fabrication errors compared with conventional DLs which usually require very stringent control of fabrication. Figure 9 shows the sectional phase profiles in the central portion of the DL with(red line and blue line)and without(black line)ring width error. The ring width error is defined as
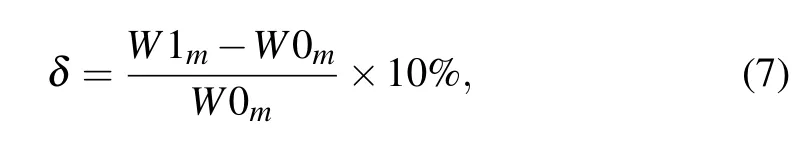
whereW1mis the width of them-th ring zone of the fabricated PCDL,W0mis the width of them-th ring zone of the designed DL,δ >0 means that the ring width of the actually fabricated DL is larger than the designed value. The red line in Fig. 8 representsδ <0,and the blue line refers toδ >0.
Figures 10(a) and 10(b) show the PSFs of the CDL and the PCDL at the designed wavelength after introducing different errors of ring width. The PSF of the CDL is diffused when the ring width errorδ >0.1%, which means that the CDL is sensitive to ring width error. As a comparison, the PSFs of the PCDL remain unchanged in a wide range ofδfrom-2.5% to 2.5%. The PSFs of the PCDL outside theδrange from-2.5% to 2.5% show the deviations from the triangled shape. Theδbetween-2.5% and 2.5% can thus be considered as a tolerance range of ring width error of the PCDL with a phase coding parameter ofα=30π,which shows a feature of significant extension of the tolerance of the ring width error compared with that of the CDL(-0.1%≤δ ≤0.1%).
Figure 11 shows the normalized MTFs along the positivexaxis of the CDL in Fig. 1 and their comparisons with the PCDL at different values ofδfrom-2.5%to 2.5%. It is seen that MTFs of the CDL drop significantly when the ring width errorδ >0.1%. In contrast, the MTFs of the PCDL remain unchanged within a range ofδfrom-2.5%to 2.5%. This result indicates that the PCDL is insensitive to ring width error,which greatly reduces the difficulty in fabricating.

Fig. 9. Sectional profiles in central portion of DL with and without ring width error.
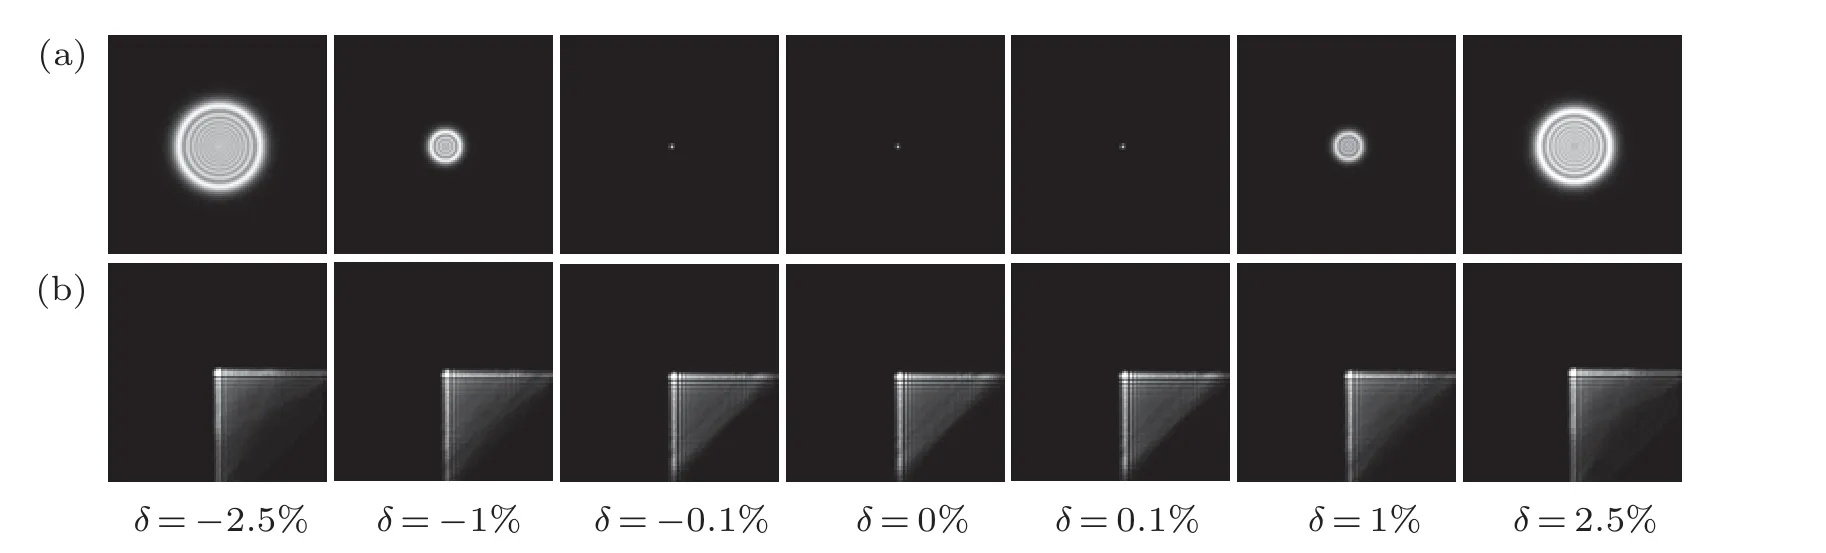
Fig.10. PSFs of(a)CDL and(b)PCDLwith different ring width errors.

Fig.11.Normalized MTFs along positive x axis of CDL and PCDL in Fig.1 with different errors of ring width.
4. Experiments
4.1. Fabrication of a PCDL and broadband achromatic imaging
A PCDL (coding parameterα=30π) and a CDL, both with the same diameter of 10 mm and the same focal length of 100 mm at designed wavelength 650 nm,are fabricated by the grey-scale laser direct writing. Figure 12(a) shows the photograph of the fabricated CDL (left circle) and the fabricated PCDL (right circle). Figures 12(b) and 12(c) show the sectional surface distribution and the line scan of the fabricated PCDL respectively, which are well consistent with the designed surface pattern.
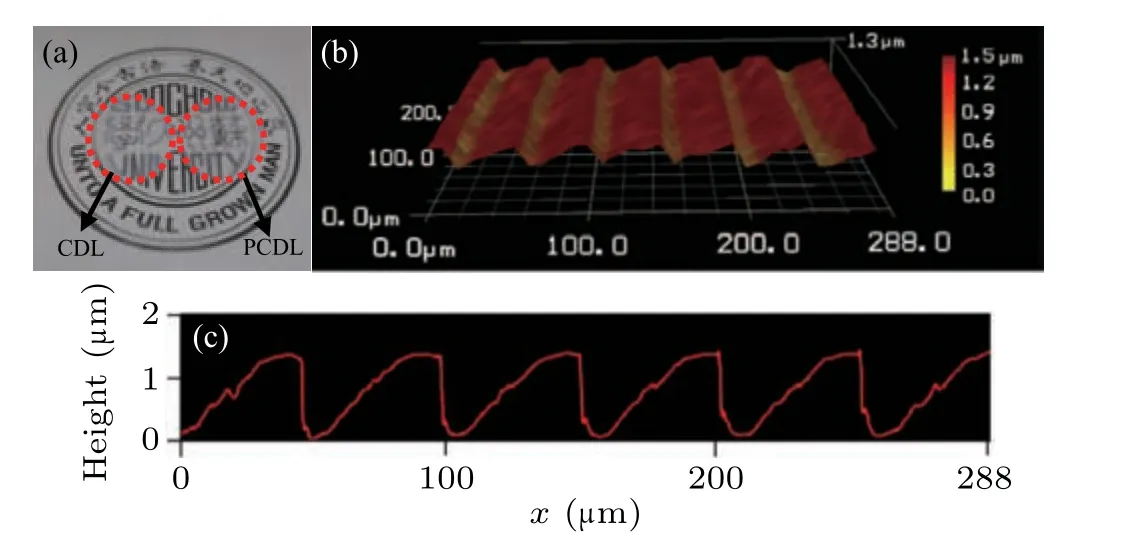
Fig. 12. (a) Photograph of the fabricated DLs (CDL and PCDL are fabricated on the same transparent substrate); (b) three-dimensional stereogram of surface near the center of PCDL,and(c)sectional view of panel(b).
Achromatic imaging of the PCDL and its comparison with the CDL are conducted. Figures 13(a) and 13(b) show the illustrations of the experimental setups under different bandwidths of illumination, which consist of a switchable monochrome light source (laser,λ= 650 nm) and a compound light source (tungsten lamp, THORLABS, SLS201L).The bandwidth of the tungsten lamp can be adjusted by a bandpass filter. In the experiment,a collimator with a diameter of 55 mm and a focal length of 550 mm is used to generate a collimated beam. The resolution target of USAF1951 is used as an objective. A CCD with a pixel size of 3.69 μm(GS3-PGE-91S6M-C)is placed at the focal length behind the DL.

Fig.13. Experimental setup of DL imaging system under illumination at(a)650-nm bandwidth and(b)30-nm bandwidth or 50-nm bandwidth.
Figure 14 shows the experimental PSFs and the imaging results of the fabricated CDL under different spectral bandwidths. The diameter of the theoretical airy spot of CDL with an aperture of 10 mm, focal length of 100 mm at a designed wavelength of 650 nm is 15.86 μm. Theoretical limit resolution of the CDL measured by a collimator can be calculated from the following formula:[22]

where res is the theoretical limit resolution of the CDL measured by a collimator,DDLis the diameter of the CDL,λis the designed wavelength of the CDL,fDLis the designed focal length of the CDL,andfcollimatoris the focal length of the collimator. When the resolution of a DL with a diameter of 10 mm and a focal length of 100 mm is measured by a collimator with a focal length of 550 mm and a diameter of 55 mm,its equivalent limit resolution is 22.92 lp/mm.
Firstly,the performance of the CDL under illumination at a designed wavelength of 650 nm is evaluated. The left column of Fig. 14 shows that the optical resolution of the CDL is about 20.16 lp/mm (i.e., the 3rd element in the 4th group of the resolution target can be distinguished), which is very close to the diffraction limit resolution calculated above. To evaluate the imaging quality after restoration,the imaging result of the CDL at the designed wavelength is restored with the corresponding PSF by using a non-blind deconvolution algorithm. The total variation (TV)-based deconvolution is a classic and useful non-blind deconvolution, which recovers images from blurry observations with TV regularization. In order to recover the blurry images more quickly, the Fast total variation deconvolution(FTVD),which is a fast algorithm for TV-based deconvolution, is used here to reconstruct the captured image.[23]The restored image of the CDL at the designed wavelength shows almost the same resolution as that of the CDL imaging at the designed wavelength 650 nm. Secondly, the performance of the CDL under the illumination of a broadband light source with a bandwidth of 30 nm and that of 50 nm, respectively, are evaluated. The middle column of Fig. 14 shows the PSF, the imaging result, and the restored image of the CDL under the illumination of a broadband light source with a bandwidth of 30 nm (λ= 635 nm–665 nm).The right column in Fig. 14 shows the PSF, the imaging result, and the restored image of the CDL under the illumination of a broadband light source with a bandwidth of 50 nm(λ=625 nm–675 nm). It can be seen from Fig. 14(b) that the wider the bandwidth of the incident light,the more blurred the imaging result will be. Besides, as shown in Fig. 14(c),after restoration, the optical resolution of the restored image under the illumination of 30-nm bandwidth and 50-nm bandwidth are 11.30 lp/mm and 10.10 lp/mm respectively, which drop seriously compared with that of the CDL imaging at the design wavelength. Besides, the wider the bandwidth of the incident light,the more severe the noise of the restored image is. The CDL suffers large chromatic aberration and can work well only at a designed single wavelength, which extremely limits the applications of the CDL.
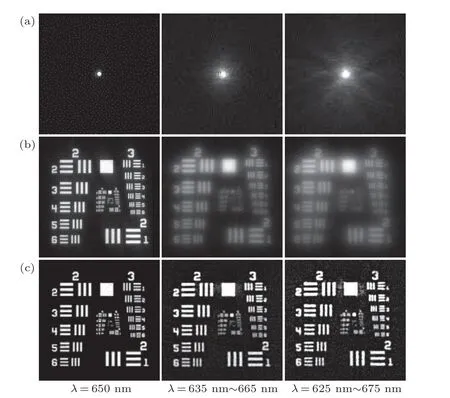
Fig.14.(a)Experimental PSFs of CDL under different bandwidths of illumination;(b)aging results of PCDL under different bandwidths of illumination;(c)restored images of PCDL under different bandwidths of illumination.
The PSFs and imaging results of the fabricated PCDL with a coding parameterα=30πare obtained under the same experimental conditions as those in Fig.13. Figure 15 shows the measured PSFs and the imaging results of the PCDL under different bandwidths of illumination. Figure 15(a) shows the measured PSFs of the PCDL under different bandwidths of illumination. It can be seen that the experimentally measured PSFs are the same as those predicted in the simulation shown in Fig.2(b). Figure 15(b)shows the intermediate blurred images, which are directly taken by the CCD. Although the intermediate images are blurred, they can be restored with the measured PSFs. The restored images are shown in Fig.15(c).It can be seen that the intermediate blurred image can be well restored and the restored images of broadband wavelength illumination show almost the same resolution as that of the CDL imaging at the designed wavelength 650 nm. Therefore,it can be concluded that the CDL can work well only at a single designed wavelength, but the PCDL with a coding parameterα=30πcan work under illumination with up to 50-nm bandwidth.

Fig. 15. (a) Measured PSFs of PCDL under different bandwidths of illumination;(b)intermediate blurred images produced by PCDL under different bandwidths of illumination;(c)restored image of PCDL under different bandwidths of illumination.
The focusing efficiency of the fabricated DL is measured using the experimental setup shown in Fig. 13, in which the CCD is replaced by an optical power meter. The focusing efficiency is defined as the ratio of the power over the triangled PSF area to that over the lens aperture. The experimental results show that the focusing efficiency of the PCDL reaches up to 83.5%at 0°FOV in a working band with 50-nm bandwidth centered at 650 nm.
4.2. 16° FOV imaging with PCDL
As is well known, the CDL imaging suffers severe offaxis aberration, and therefore, it can work only at the near-0°FOV,which significantly limits the applications of CDL in imaging.However,the introduction of the cubic term modifies the orientation of phase distribution of DL, and thus changing the wavefront of the transmitted focusing light so that the incident light with a wide range of FOV gains equal focusing power. The proposed wide FOV imaging at the designed single wavelength with a single PCDL is experimentally validated and compared with a CDL with the same parameters. In the experimental setup (Fig. 13), the rotation stage is used to change the incident angle of the incident light.
We first evaluate the performance of the fabricated CDL with FOV from-8°to 8°at the designed wavelength of 650 nm. Figures 16(a)and 16(b)show the measured PSFs and target images generated by the CDL.The PSFs and images of the CDL are diffused with the increase of FOV deviation from the 0°FOV(on-axis).
As a comparison,figure 17 shows the measured PSFs and images of the fabricated PCDL at different FOVs from-8°to 8°at the designed wavelength 650 nm. Figure 17(a)shows the experimentally measured PSFs. The PSF distribution of the PCDL remains almost unchanged in a wide range of FOV from-8°to 8°. Figure 17(b)shows the intermediate blurred images produced by the PCDL at different FOVs from-8°to 8°, which are almost identically blurred due to the almost unchanged PSFs.
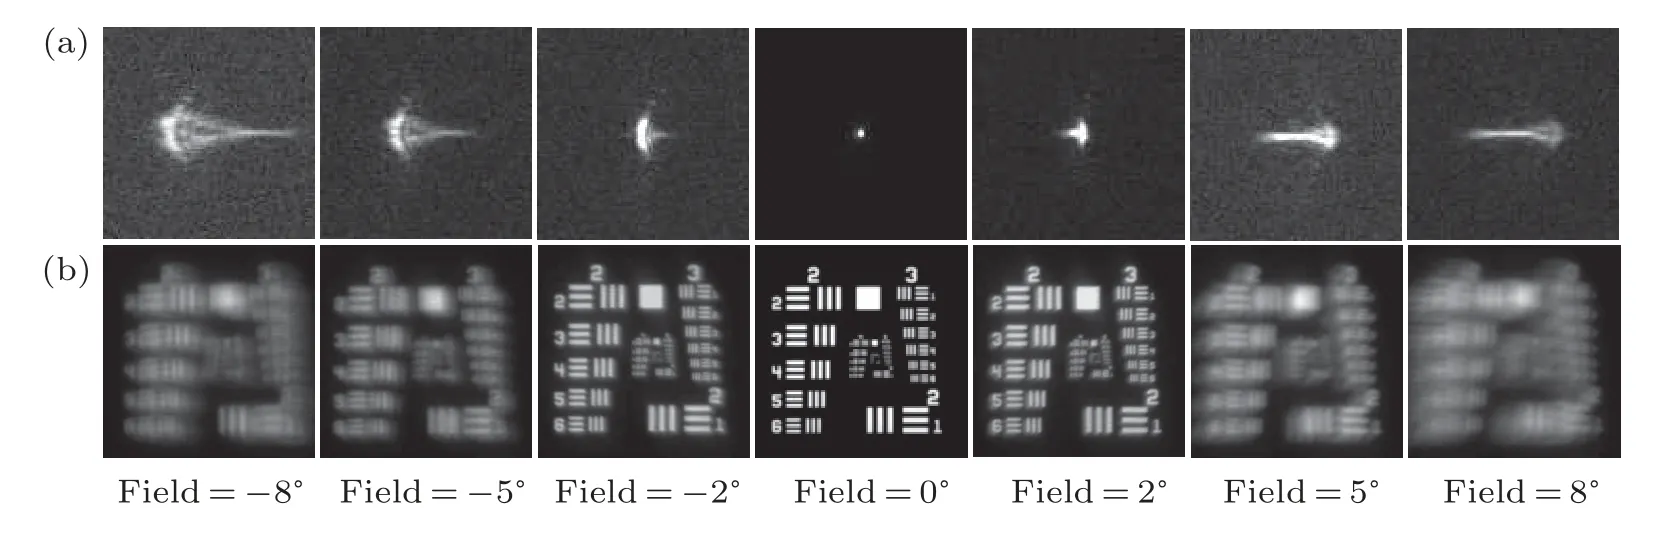
Fig.16. Measured(a)PSFs and(b)images of CDL at different FOVs under designed wavelength.
The blurred images of the CDL and the PCDL at the designed wavelength are, respectively, restored by using their own PSF at 0°FOV. Figure 18(a) shows the restored images of the CDL at different FOVs from-8°to 8°, which shows that the restored images suffer increasingly severe artifacts with the increase of FOV deviation from 0°FOV.Figure 18(b)shows that the intermediate blurred images of the PCDL at different FOVs can be well restored by using the PSF at 0°FOV,and the restored images at different FOVs from-8°to 8°show almost the same resolution as that of the CDL on-axis imaging at the designed wavelength 650 nm. It can be concluded that compared with the CDL,the PCDL can greatly broaden the FOV at the designed wavelength.
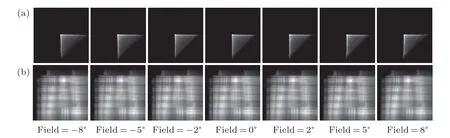
Fig.17. Measured(a)PSFs and(b)intermediate blurred images of the PCDL at different FOVs under designed wavelength.

Fig.18. Restored images of(a)fabricated CDL and(b)fabricated PCDL at different FOVs under designed wavelength.
4.3. Achromatic and 16° FOV imaging with PCDL
In this subsection, whether the PCDL has the ability to implement both achromatic imaging and off-axis imaging simultaneously is demonstrated.The fabricated CDL and PCDL are used and compared. The bandwidth of the illumination centered at 650 nm is set to be at 50 nm. The performance of the CDL with FOVs from-8°to 8°in a bandwidth of 50-nm illumination is first evaluated. Figures 19(a) and 19(b)show,respectively,the measured PSFs and the target images of the CDL.As expected,under the illumination of 50-nm bandwidth,the CDL cannot image clearly even at the near-0°FOV because of the severe effect of chromatic aberration.

Fig.19. Measured(a)PSFs and(b)images of fabricated CDL at different FOVs under illumination of 50-nm bandwidth centered at 650 nm.
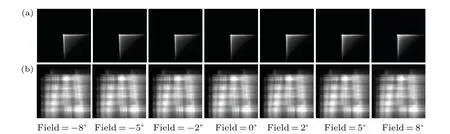
Fig.20. Measured(a)PSFs and(b)intermediate blurred images of the PCDL at different FOVs under illumination with 50-nm bandwidth centered at 650 nm.
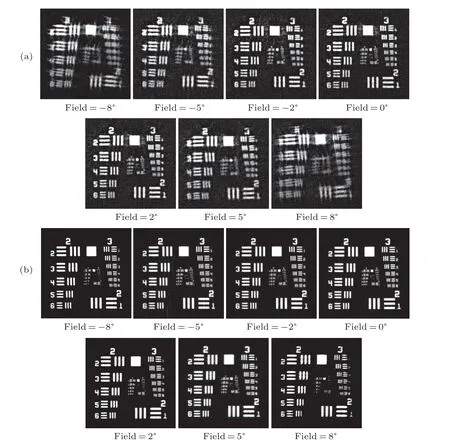
Fig.21. Restored images of(a)fabricated CDL and(b)fabricated PCDL at different FOVs under illumination of 50-nm bandwidth.
As a comparison,figure 20 shows the measured PSFs and the images of the fabricated PCDL at different FOVs from-8°to 8°in a 50-nm bandwidth centered at 650 nm. Figure 20(a)shows the experimentally measured PSFs. The PSF distribution of the PCDL remains almost unchanged within a wide range of FOVs from-8°to 8°in the working band. Figure 20(b)shows the intermediate blurred images produced by the PCDL,which are almost identically blurred due to the almost unchanged PSFs.
The blurred images of the CDL and the PCDL under illumination with 50-nm bandwidth are, respectively, restored by using their own PSF at 0°FOV.Figure 21(a)shows the restored images of the fabricated CDL at different FOVs from-8°to 8°, which shows that the restored images are still diffused and suffer increasingly severe effects of noise with the increase of FOV deviation from the 0°FOV. Figure 21(b)shows that the intermediate blurred images of the fabricated PCDL at different FOVs can be well restored by using the PSF of 0°FOV and the restored images at different FOVs from-8°to 8°show almost the same resolution as that of the CDL onaxis imaging at the designed wavelength 650 nm. It can be concluded that compared with the CDL,the PCDL can greatly broaden the FOV under illumination with 50-nm bandwidth centered at 650 nm.
Besides,the measured focusing efficiency of PCDL at different FOVs from-8°to 8°are all over 80% as shown in Fig.22. The results clearly show that the PCDL can work simultaneously under both 50-nm bandwidth illumination and 16°FOV with high focusing efficiency.
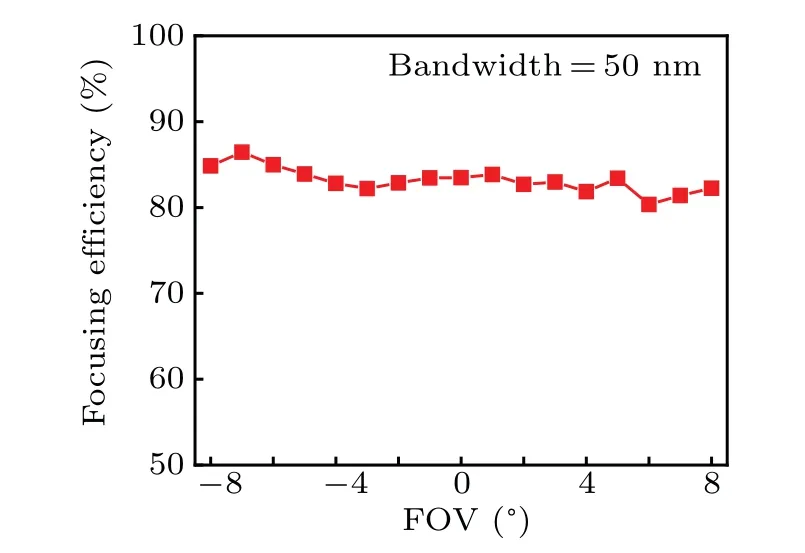
Fig.22. Measured focusing efficiency of PCDL at different FOVs in a 50-nm bandwidth centered at 650 nm.
5. Conclusions
We proposed and experimentally demonstrated a novel method to broaden the working bandwidth and the FOV of large-aperture DL with high efficiency. The orientation of phase distribution of a DL with a diameter of 10 mm is phasecoded, and thus generating equal focusing power for 50-nm bandwidth and 16°FOV with over 80% focusing efficiency.Experimental validation is performed by using a PCDL fabricated with the laser direct writing of a grey-scale pattern.The results show that the working bandwidth of the PCDL reaches 50 nm compared with 1.69 nm in CDL. The experimental results are in good agreement with the theoretical simulations. Further experiments show that the introduction of the cubic phase term can expand the FOV of the DL,in which the FOV of the PCDL reaches 16°compared with almost 0°in the CDL. It should be noted that the image quality can be further improved when optimized restoration algorithms are applied or the coding parameterαis further optimized. In addition, the PCDL shows high tolerance to errors of the ring width which reduces significantly the difficulty in fabricating.The proposed method of coding the phase distribution of a DL opens a new way of designing large-aperture diffractive phasetype lenses for achromatic and wide FOV imaging with high efficiency.
Acknowledgements
Project supported by the National Natural Science Foundation of China (Grant No. 61775154), the Natural Science Foundation of the Jiangsu Higher Education Institutions,China(Grant No.18KJB140015),the Priority Academic Program Development of Jiangsu Higher Education Institutions,China, and the Open Research Fund of CAS Key Laboratory of Space Precision Measurement Technology, China (Grant No.SPMT2021001).
猜你喜欢
杂志排行

Chinese Physics B的其它文章
- Solutions of novel soliton molecules and their interactions of(2+1)-dimensional potential Boiti–Leon–Manna–Pempinelli equation
- Charge density wave states in phase-engineered monolayer VTe2
- High-pressure study of topological semimetals XCd2Sb2(X =Eu and Yb)
- Direct visualization of structural defects in 2D semiconductors
- Switchable down-,up-and dual-chirped microwave waveform generation with improved time–bandwidth product based on polarization modulation and phase encoding
- Machine learning potential aided structure search for low-lying candidates of Au clusters