Microwave method based on curve fitting method for high-precision collision frequency diagnosis
2022-08-01GeluMA马戈璐YanmingLIU刘彦明ChengweiZHAO赵成伟ChaoSUN孙超andWeiminBAO包为民
Gelu MA(马戈璐),Yanming LIU(刘彦明),∗,Chengwei ZHAO(赵成伟),Chao SUN(孙超) and Weimin BAO(包为民)
1 School of Aerospace Science and Technology,Xidian University,Xi’an 710071,People’s Republic of China
2 Key Laboratory of Information and Structure Efficiency in Extreme Environment,the Ministry of Education of China,Xi’an 710071,People’s Republic of China
Abstract In this work,the results of plasma microwave transmission diagnosis were analyzed.According to the attenuation and phase shift of the electromagnetic wave propagating in the plasma,the electron density and collision frequency of the plasma can be diagnosed.Since part of the electromagnetic wave is reflected or diffracted when propagating in the plasma,and is not absorbed by the plasma,and this part of the attenuation is still included in the measured attenuation,the attenuation is distorted.Therefore,a curve fitting method is proposed to remove the attenuation caused by the plasma reflection,thereby improving the accuracy of the diagnosis of the collision frequency.The calibration effect of this method on plasmas with different electron densities and collision frequencies is analyzed,and a diagnostic frequency band with good calibration results is given.The curve fitting method is verified by experiment and simulation.After adopting the newly proposed method,the diagnosis accuracy of collision frequency can be increased by 30%.This method can be widely used in various types of plasma diagnosis and provides a new idea for plasma diagnosis.
Keywords:microwave diagnosis,attenuation calibration,curve fitting,high-precision
1.Introduction
When a hypersonic vehicle is flying in the atmosphere,it interacts with the atmosphere and forms a bow-shaped shock wave on the head of the vehicle.The air temperature rises sharply,causing the atmosphere to dissociate and ionize,and a plasma sheath is generated around the aircraft,which affects the communication between the aircraft and the ground measurement and control system.This phenomenon is called a black barrier[1–5].In order to fully understand the interaction mechanism between plasma and electromagnetic waves and solve the black barrier problem,inductively coupled plasma(ICP)is generated by a ground simulation device,and the plasma parameters are diagnosed.The main parameters of plasma that affect the transmission of electromagnetic waves are its electron density and collision frequency[6],so the diagnosis of these two parameters is of great significance.Microwave diagnosis[7–11],laser interference diagnosis[12],probe diagnosis[13–15],and spectrum diagnosis are all commonly used plasma diagnosis methods[16].
Langmuir probe diagnosis is the most basic diagnosis method for plasma parameters[17].The probe with applied voltage is situated deep in the plasma,and the relationship between the current and the voltage of the probe is measured,and the volt-ampere(V-A)characteristic curve of the probe can be obtained[18].According to the special points on the curve,the plasma density,electron temperature,plasma potential and floating potential can be calculated.In addition,H Kokuraet alstudied the plasma absorption probe(PAP)[19],which is based on the characteristics of resonant absorption of surface waves excited by the probe head.Even when the probe is affected by plasma,it can still be used for the diagnosis of plasma electron density.Since the probe needs to go deep into the plasma,when the plasma temperature is high,the probe will be burnt out.Therefore,in the research of high-temperature plasma,probe diagnosis is not appropriate,and noncontact diagnosis methods are generally used.
Laser interference diagnosis is a commonly used noncontact diagnosis method.This method regards plasma as a medium.When the laser is transmitted in the plasma,the refractive index of the plasma is related to its electron density.Therefore,the electron density can be obtained by measuring the refractive index of the plasma[20].Due to the high frequency of lasers,laser interferometric diagnosis is generally used to diagnose plasma with high electron density.Laser interference diagnosis cannot obtain the collision frequency of plasma,and the laser itself has a high frequency,which has a great error in diagnosing plasma with low electron density,so laser diagnosis is not used in this work.
Microwave diagnosis is also a commonly used noncontact diagnosis method,which regards plasma as a medium with a constant dielectric constant.The principle of microwave diagnosis is simple,with little interference to plasma,low cost,and wide application.Microwave diagnosis can be divided into reflection diagnosis and transmission diagnosis[21–23].Microwave reflection diagnosis can calculate the electron density at different positions of the plasma based on the reflection phase,so as to diagnose the spatial distribution of the electron density.Microwave transmission diagnosis can diagnose electron density and collision frequency based on the attenuation and phase shift caused by plasma absorption when electromagnetic waves are transmitted in plasma.
In this work,microwave transmission diagnosis is used in the diagnosis of ICP and the diagnosis error is analyzed.ICP has the characteristics of long duration,high temperature,high electron density and uniform parameter distribution.During the transmission of electromagnetic waves in the plasma,in addition to the attenuation caused by absorption by the plasma,there is also attenuation caused by reflection and diffraction,which leads to large errors in the diagnosis of the collision frequency of the plasma,making the diagnosis difficult.Therefore,a curve fitting method for the attenuation of distortion is proposed to reduce the attenuation caused by reflection,so as to calibrate the collision frequency for diagnosis.
The paper is arranged as follows.In section 2,the theory of microwave transmission method diagnosis and the theoretical basis of the curve fitting method are introduced.In section 3,the curve fitting method is introduced for parameter diagnosis of plasma with different electron densities and collision frequencies.The description of the microwave diagnostic system and the diagnosis of the measured attenuation are given in section 4.The conclusion is given in section 5.
2.Theoretical analysis
2.1.Theoretical analysis of plasma microwave transmission diagnosis
Plasma is considered to be a conductive dispersive medium with uniform dielectric constant in the microwave transmission diagnosis.The electrodynamic equation is used to describe the movement of charged particles in the plasma,and the dielectric constant and conductivity of the plasma are derived.
Combining the electrodynamic equation and the parameter characteristics of the plasma,the equivalent dielectric constant of the plasma can be calculated as:

where ω is the angular frequency of the incident electromagnetic wave,veis the plasma collision frequency,ωpis the characteristic angular frequency of the plasma,and the expression of ωpis as follows:

According to Maxwell’s electromagnetic equations,the wave numberand the equivalent complex permittivitywhen the electromagnetic wave propagates in the plasma satisfy:

Therefore,the attenuation constant α and phase shift constant β of the electromagnetic wave can be obtained as:
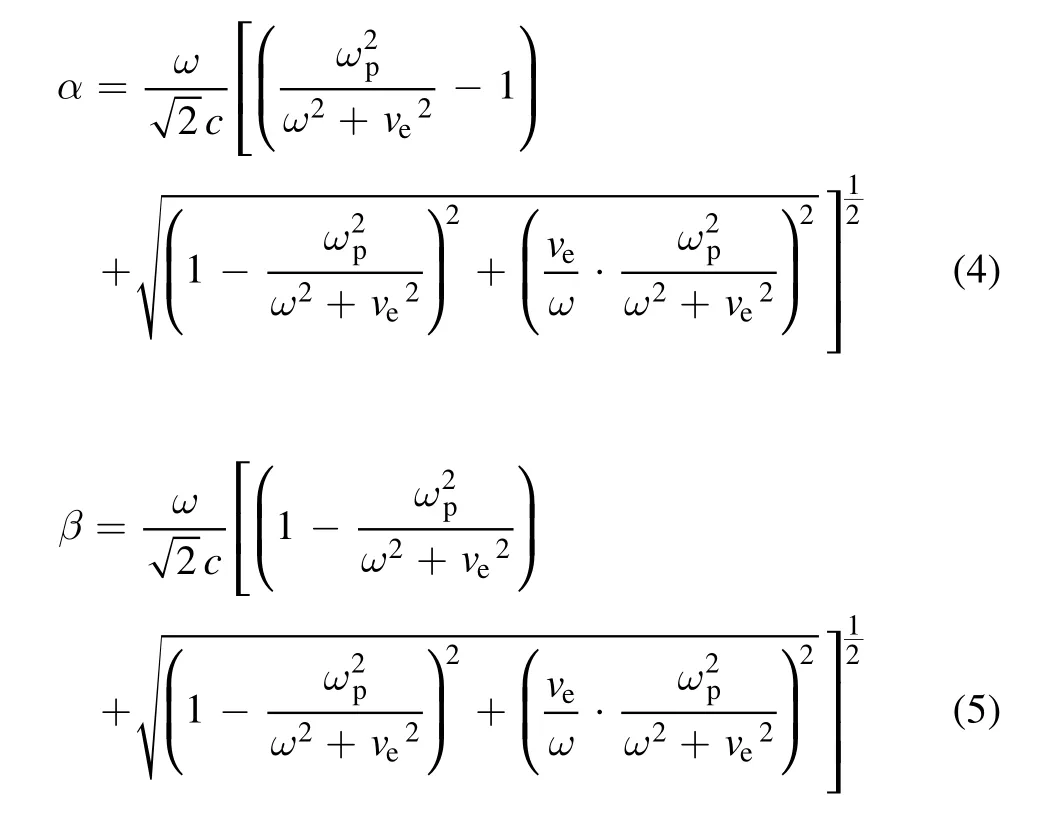
wherecis the velocity of light in the vacuum.According to the equations(1)–(5),the expressions of electron density and collision frequency are as follows:

wheremeis the electronic mass,eis the electronic charge.After the electromagnetic wave passes through the plasma of thicknessd,the attenuationAttand the phase shift φ are respectively:

where φpis the phase in which the electromagnetic wave propagates in the plasma,φ0is the phase in which the electromagnetic wave propagates in free space,β0is the phase constant of the electromagnetic wave in the free space.It can be seen from equations(8)and(9)that the attenuation and phase shift of electromagnetic waves are related to electron densityne,collision frequency νe,plasma thicknessd,and incident electromagnetic wave angular frequency ω.It should be noted that both attenuation and phase shift are relative to the case without plasma.The vector network measurement obtains the transmission coefficientS21and the reflection coefficientS11,thenAtt=the amplitude ofS21(with plasma)minus the amplitude ofS21(without plasma).Φ=S21phase(with plasma)minusS21phase(without plasma).The reflection attenuation and phase shift can be obtained in the same way.
As a consequence,the electron density and collision frequency can be diagnosed by measuring the attenuation and phase shift of electromagnetic waves as they propagate in the plasma with a vector net.In the Computer Simulation Technology(CST)software,the plasma model has a set electron densityne0and collision frequency νe0.Through the simulation of the diagnosis system,the attenuation and phase shift of electromagnetic wave transmission in the plasma can be obtained,and the diagnosed electron densityne1and collision frequency νe1can be obtained.Comparing the two parameters,the diagnosis error can be obtained.
For plasmas with different electron densities,the attenuation of electromagnetic waves transmitted in them is shown in figure 1.
It can be seen from figure 1 that when the frequency of the incident electromagnetic wave is close to the characteristic frequency of the plasma,the attenuation increases sharply,indicating that the microwave transmission diagnosis can only diagnose the plasma with the characteristic frequency lower than the incident frequency.
In 2021,Chengwei Zhao studied the diagnostic accuracy of microwave transmission method[24].In section 4.3 of that article,the parameters of plasma are diagnosed by simulation,and the diagnosis accuracy is given.The diagnostic accuracy of electron density is more than 90%,while the diagnostic accuracy of collision frequency is much lower than that of electron density.Since the simulation environment of the two articles is the same,it can be considered that the conclusion is also applicable to this paper.
2.2.Relationship between attenuation and collision frequency


Set the electron densityne=1.0×10¹⁹m−3,and the collision frequency νe=1.5 GHz.The relationship between the partial derivative of the attenuation constant α and the phase shift constant β to the collision frequency and the normalized frequency is shown in figure 2.
It can be seen from figure 2 that when the incident frequency is greater than the characteristic frequency,the attenuation is mainly related to the collision frequency.Therefore,the following conclusions can be drawn:the error of the collision frequency diagnosis is mainly caused by the attenuation distortion,and the key to calibrating the collision frequency of the diagnosis is to calibrate the attenuation.
3.Calibration of collision frequency
Because part of the electromagnetic wave is reflected or diffracted when propagating in the plasma,and is not absorbed by the plasma,and this part of the attenuation is still included in the measured attenuation,the attenuation is distorted.It is necessary to remove the attenuation of electromagnetic wave reflection and diffraction from the measured attenuation,and obtain the attenuation caused only by plasma absorption.
3.1.Calibration using focusing lens antennas
A focusing lens antenna with a working frequency of 26.5–40 GHz is used to reduce the diffraction of electromagnetic waves[25].The focal length of the antenna is 350 mm,and the lens resolution is smaller than 30 mm.Since the dielectric material used in the lens is quartz,it can withstand a high temperature of 1000 °C.The electric field intensity along the transmission direction of the electromagnetic wave was tested in a microwave anechoic chamber.The structure and focusing effect of the antenna are shown in figure 3.The simulated and measured electric field in CST is shown in figure 3(b).It can be seen from figure 3(b)that the antenna has a good focusing performance,and measurement and simulation are in good agreement.
3.2.Calibration using curve fitting method
The working frequency of the focusing lens antenna is 26–40 GHz,the electron density of plasmane=1.0×10¹⁹m−3,and the collision frequency νe=1.5 GHz,and the relationship between attenuation and normalized frequency is shown in figure 4.
It can be seen from figure 4 that the attenuation curve with frequency is in the form of a rational function.
When the frequency of the incident electromagnetic wave is close to the characteristic frequency ωpof the plasma(ωp<ω<1.05ωp),the attenuation changes extremely fast.During this time period,it is difficult for the electromagnetic wave to pass through the plasma.Almost all electromagnetic waves are reflected,and the attenuation caused by the reflection is very large.The amplitude of the reflection coefficientS11measured by the vector network can be approximated as the attenuation caused by the plasma reflection.As a consequence,the amplitude difference betweenS21andS11is the attenuation caused by plasma absorption in this frequency band.
When the frequency of the incident electromagnetic wave is high(ω>1.2ωp),the attenuation is basically unchanged.In this frequency band,the electromagnetic wave completely penetrates the plasma,and the part reflected by the plasma is approximately zero,so the amplitude ofS21is the attenuation caused by plasma absorption.
As a result,the attenuation of these two frequency bands can be used as a reference,and curve fitting can be performed in the form of a rational function,so as to restore the plasma attenuation of electromagnetic wave transmission.Generally,in the frequency band near the characteristic frequency of the plasma,the selection standard of the curve fitting benchmark is that the attenuation is in the range of 10–40 dB,and the selection standard in the high frequency band is that the attenuation is less than 3 dB.
4.Analysis of diagnostic accuracy
The experiment on microwave transmission plasma is simulated in CST software,and the collision frequency of plasma is diagnosed with the obtained attenuation and phase shift.The above conclusions are verified by comparing the diagnosis results before and after treatment with the curve fitting method.
4.1.Diagnosis of plasmas with different electron densities
The calibration method can be divided into three types according to the different electron density of the plasma.The electron densities(ne)of the plasma are 0.75×10¹⁹m−3,1.0×1019m−3,1.5×1019m−3respectively,and the collision frequency is 1.5 GHz.In CST,the microwave transmission plasma experiments with electron densities of 0.75×10¹⁹m−3,1.0×1019m−3,1.5×1019m−3were simulated respectively,and the simulated attenuation was obtained.The curve fitting method is used to calibrate the simulated attenuation to obtain the calibrated attenuation.At the same time,the theoretical attenuation calculated by equations(4)and(8)is used as the reference value,which is used as the standard to measure the attenuation error.Figure 5 shows the comparison of the calibrated attenuation with the theoretical attenuation and the simulated attenuation.

Figure 1.Attenuation of electromagnetic waves at different electron densities.
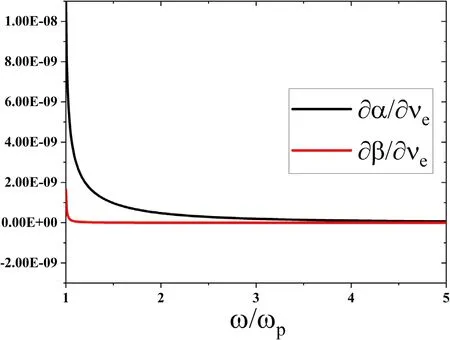
Figure 2.Partial derivative of α and β to the collision frequency.

Figure 3.(a)Prototype of the antenna,(b)simulation and measured axial electric field intensity[25].John Wiley &Sons.©2019 Wiley Periodicals,Inc.
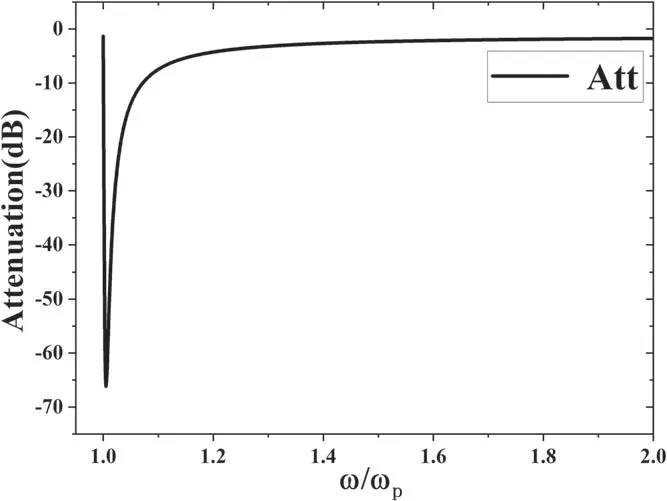
Figure 4.Relationship between attenuation and normalized frequency.
(1)ne=0.75×10¹⁹m−3.The corresponding characteristic frequency is 24.6 GHz,which is not in the diagnostic frequency band,so only the high frequency attenuation is used for curve fitting,and the attenuation function obtained by curve fitting is:

The calibration effect of the curve fitting method is shown in figure 5(a).
(2)ne=1.0×10¹⁹m−3.The corresponding characteristic frequency is 28.4 GHz,which is within the diagnostic frequency band.According to the theory proposed in section 3,the attenuation corresponding to the frequency close to the characteristic frequency of the plasma and the attenuation corresponding to the high frequency can be used for curve fitting.The attenuation function obtained by curve fitting is:

The calibration effect of the curve fitting method is shown in figure 5(b).
(3)ne=1.5×10¹⁹m−3.The corresponding characteristic frequency is 34.8 GHz,which is within the diagnostic frequency band.According to the theory proposed in section 3,the attenuation corresponding to the frequency close to the characteristic frequency of the plasma and the attenuation corresponding to the high frequency can be used for curve fitting.The attenuation function obtained by curve fitting is:

The calibration effect of the curve fitting method is shown in figure 5(c).
It can be seen from figure 5 that compared with the measured attenuation,the attenuation calibrated by the curve fitting method is closer to the theoretical attenuation.In the high frequency bands,the theoretical attenuation is in good agreement with the calibrated attenuation.The calibration effect on the collision frequency is shown in table 1.
Table 1 demonstrates that the calibrated attenuation matches the theoretical attenuation better than the measured attenuation,and the calibrated collision frequency matches the set collision frequency well.

Table 1.Diagnostic calibration of plasma with electron densities of 0.75×10¹⁹ m−3,1.0×1019 m−3 and 1.5×10¹⁹ m−3.

Table 2.Diagnostic calibration of plasma with electron densities of 0.75×10¹⁹ m−3,1.0×1019 m−3 and 1.5×10¹⁹ m−3.
4.2.Diagnosis of plasmas with different collision frequencies
The calibration effect of the curve fitting method on the attenuation is different depending on the collision frequency of the plasma.In this part,the calibration effect of the curve fitting method on the attenuation is studied when the collision frequencies of the plasma are 1 GHz,3 GHz,and 5 GHz,respectively.Figure 6 shows the comparison of the calibrated attenuation with the theoretical attenuation and the simulated attenuation.

Figure 5.Calibration of the attenuation of plasma with electron density of(a)0.75×10¹⁹ m−3,(b)1.0×10¹⁹ m−3 and(c)1.5×10¹⁹ m−3.

Figure 6.Calibration of the attenuation of plasma with collision frequencies of(a)1 GHz,(b)3 GHz and(c)5 GHz.

Figure 7.Plasma microwave transmission diagnostic system.
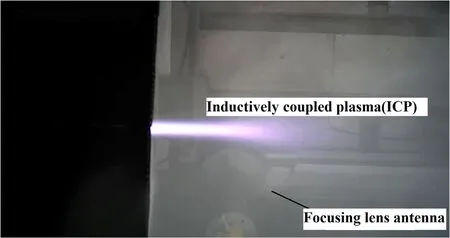
Figure 8.Attenuation of electromagnetic waves at different electron densities.
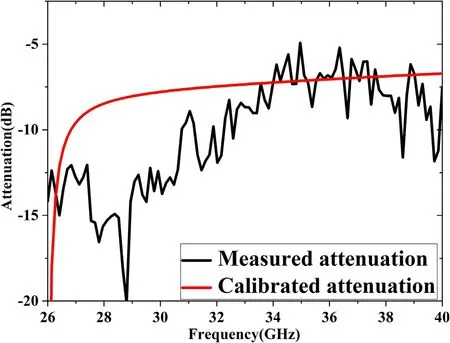
Figure 9.Measured attenuation and calibrated attenuation.
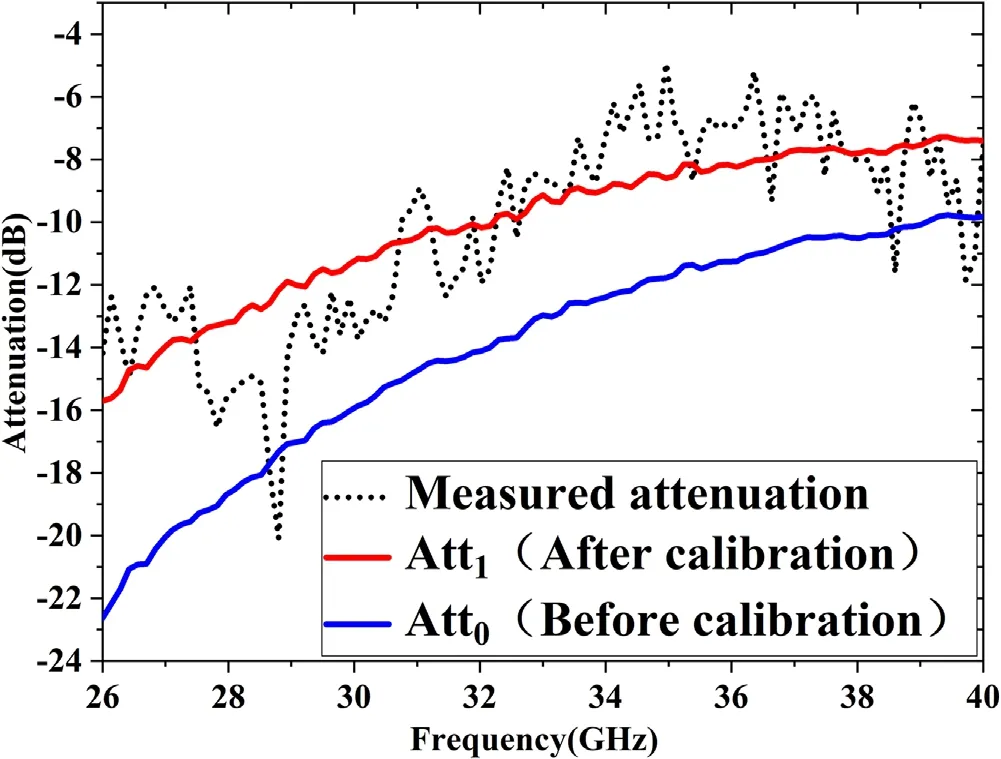
Figure 10.Att0, Att1 and the measured attenuation.
(1)νe=1 GHz.The attenuation function obtained by curve fitting is:

The calibration effect of the curve fitting method is shown in figure 6(a).
(2)νe=3 GHz.The attenuation function obtained by curve fitting is:

The calibration effect of the curve fitting method is shown in figure 6(b).
(3)νe=5 GHz.The attenuation function obtained by curve fitting is:

The calibration effect of the curve fitting method is shown in figure 6(c).
It can be seen from figure 6 that compared with the measured attenuation,the attenuation calibrated by the curvefitting method is closer to the theoretical attenuation.The calibration effect on the collision frequency is shown in table 2.
It can be seen from table 2 that for the plasma whose collision frequency is in the range of 1–10 GHz,the curve fitting method has a good calibration effect on attenuation.As the collision frequency increases,the calibration effect becomes worse.Beyond an order of magnitude of the collision frequency range,there is almost no calibration effect.
5.Diagnosis test and analysis
5.1.Erection of the experimental device
In the plasma generating device,the plasma is generated by inductive coupling,and is ejected into the vacuum microwave anechoic chamber through a circular nozzle with a diameter of 200 mm[26,27].The plasma microwave transmission diagnosis system mainly includes a vector network analyzer,focusing lens antennas,coaxial cables,sealing flanges and antenna brackets.The specific connections between the various parts are shown in figure 7.The functions of each device are as follows.The vector network analyzer contains a microwave transmitter and a microwave receiver,which are responsible for receiving and sending microwave signals.The transceiver antenna radiates microwave signals into free space.The coaxial cable is used to connect the vector network and the transmitting and receiving antennas for the transmission of microwave signals.A coaxial adapter device is installed on the sealing flange to connect the transmission of microwave signals inside and outside the vacuum chamber.The antenna bracket supports the antenna and can adjust the height of the antenna.
The diagnostic frequency band is 26–40 GHz,the voltage is 10 kV,and the air pressure in the vacuum chamber is maintained at 300 Pa.The distance between the center of the lens and the nozzle is 160 mm,and the distance between the transmitting and receiving antennas is 1100 mm.The vector network analyzer is used to collect five sets of data(amplitude and phase ofS21)for the experiments with and without plasma respectively,the attenuation and phase shift are obtained,and the average value is taken.The state of the plasma is shown in figure 8.
5.2.Analysis of experimental data
The measured attenuation and the calibrated attenuation obtained from the experiment are shown in figure 9.
According to the measured phase shift,it can be diagnosed that the electron density of the plasma is 4.15×10¹⁸m−3,and the corresponding characteristic frequency is 18.3 GHz.It can be seen from figure 9 that the characteristic frequency is lower than the diagnostic frequency band,but the measured attenuation is similar to the case(2)in section 4.1.This is because the electron density distribution of ICP is ‘high in the middle-low around the periphery’,which is not uniformly distributed like the simulated plasma.When the electromagnetic wave propagates in the plasma,it has been cut off at the central plasma(with high electron density),but it can still be transmitted in the surrounding plasma(with low electron density),which causes the measurement attenuation similar to the case(2)in section 4.1.
At the same time,it can be seen from figure 9 that the measured attenuation curve has a lot of jitters.This is due to the fact that some electromagnetic waves are reflected and refracted at the lens,and electromagnetic waves transmitted in different directions are superimposed on each other.Multiple sets of data at different times are collected,and the average value is calculated,which can reduce jitter to a certain extent.
The calibrated attenuation is obtained through a curve fitting method.Due to the lack of research on the diagnosis of collision frequency,there is no diagnostic result that it can be compared with.As a consequence,a method for verifying the calibration effect of the curve fitting method is proposed.The measured attenuation and the calibrated attenuation are respectively used to diagnose the collision frequency of the plasma,which are set as νe0and νe1,and the values are assigned to the plasma model of CST,and the microwave transmission plasma experiment is simulated to obtainAtt0andAtt1.Comparing them with the measured attenuation,ifAtt1(corresponding to the attenuation after calibration)is closer to the measured attenuation,it means that the curve fitting method has a good calibration effect for the diagnosis of collision frequency.On the contrary,ifAtt0(corresponding to the uncalibrated attenuation)is closer to the measured attenuation,it means that the curve fitting method has no diagnostic effect.The comparison ofAtt0,Att1and the measured attenuation is shown in figure 10.
It can be seen from figure 10 that compared toAtt0,Att1is more consistent with the measured attenuation,which shows that the curve fitting method has a good calibration effect for the diagnosis of collision frequency.Since the true value of the collision frequency cannot be obtained,the diagnosis accuracy of the collision frequency cannot be given directly.However,the attenuation error can be obtained from figure 10.Taking the measured attenuation as a standard,the error ofAtt1is in the range of 0%–30%with a mean of 15.9%,while the error ofAtt0is about 20%–80%with a mean of 44.0%.It can be seen from the diagnosis results that the actual collision frequency should be between 1 GHz and 3 GHz.Taking the simulation results in chapter 4 as a reference,the collision frequency accuracy diagnosed byAtt0is about 40%–60%,while the collision frequency accuracy diagnosed byAtt1is about 80%–90%;the curve fitting method can improve the diagnostic accuracy of collision frequency by about 40%.
6.Conclusion
In this work,the microwave transmission diagnosis is used to obtain the collision frequency of the plasma,and the error of the diagnosis is analyzed.As part of the electromagnetic waves are reflected or diffracted,the measurement attenuation is distorted,and the diagnosis error of the collision frequency is large.In order to solve this problem and reduce the diagnostic error of collision frequency,a curve fitting method is proposed.For plasmas with different electron densities and collision frequencies,the diagnosis errors of collision frequency,before and after calibration with the curve fitting method,were studied and compared.The results of simulation and experiment are used to verify the effectiveness of the curve fitting method.At the same time,experiments show that the curve fitting method is also suitable for plasma with a nonuniform distribution of electron density.
Acknowledgments
This work was supported in part by National Natural Science Foundation of China(Nos.61627901,61601353,61801343,and 61901321).
ORCID iDs
杂志排行
Plasma Science and Technology的其它文章
- Special issue on selected papers from CEPC 2021
- Highly efficient γ-ray generation by 10 PWclass lasers irradiating heavy-ion plasmas
- Surface properties of Al-doped ZnO thin film before and after CF4/Ar plasma etching
- Photoexcited carrier dynamics in a GaAs photoconductive switch under nJ excitation
- Molecular mechanism study of Astragalus adsurgens Pall synergistically induced by plasma and plasma-activated water
- Inverse synthetic aperture radar range profile compensation of plasma-sheathenveloped reentry object
