Linear hybrid simulations of low-frequency fishbone instability driven by energetic passing particles in tokamak plasmas
2022-07-13JixingYANG杨吉星GuoyongFU傅国勇WeiSHEN申伟andMinyouYE叶民友
Jixing YANG (杨吉星),Guoyong FU (傅国勇),Wei SHEN (申伟)and Minyou YE (叶民友),∗
1 School of Nuclear Science and Technology,University of Science and Technology of China,Hefei 230026,People’s Republic of China
2 Institute for Fusion Theory and Simulation and Department of Physics,Zhejiang University,Hangzhou 310027,People’s Republic of China
3 Institute of Plasma Physics,Chinese Academy of Sciences,Hefei 230031,People’s Republic of China
Abstract A linear simulation study of energetic passing particle-driven low-frequency fishbone instability in tokamak plasmas has been carried out using the global kinetic-MHD(magnetohydrodynamics) hybrid code M3D-K.This work is focused on the interaction of energetic passing beam ions and n=1 mode with a monotonic safety factor q profile and q0<1.Specifically,the stability and mode frequency as well as mode structure of the n=1 mode are calculated for scans of parameter values of beam ion beta,beam ion injection energy,beam ion orbit width,beam ion beta profile,as well as background plasma beta.The excited modes are identified as a low-frequency fishbone with the corresponding resonance of ωφ+ωθ=ω,whereωφ is the beam ion toroidal transit frequency andωθ is the beam ion poloidal transit frequency.The simulated mode frequency is approximately proportional to the beam ion injection energy and beam ion orbit width.The mode structure is similar to that of internal kink mode.These simulation results are similar to the analytic theory of Yu et al.
Keywords: fishbone,energetic particle,hybrid simulations,tokamak
1.Introduction
Energetic particle physics is a key issue for burning plasmas of magnetic fusion reactors such as ITER.In a burning plasma,fusion product alpha particles can resonantly destabilize shear Alfven waves that in turn can lead to redistribution and losses of alpha particles themselves.As a consequence,these alpha-driven instabilities may degrade alpha particle heating and even damage the reactor’s first wall.Therefore,it is important to study energetic particledriven instabilities in tokamak plasmas.
In this work,we focus on the energetic particle-driven fishbone,particularly the fishbone driven by co-passing energetic beam ions in tokamak plasmas.It is well known that energetic trapped particles can excite the (n,m)=(1,1)fishbone instabilities in a tokamak plasma with a monotonic safety factor q profile and central q value less than unity[1-3].The fishbone can be intrinsically an energetic particle mode (EPM) with mode frequency comparable to precession drift frequencyωd,hof energetic trapped particles [2].The fishbone can be destabilized when the energetic particle density exceeds a threshold.On the other hand,there is also another type of fishbone whose mode frequency is comparable to the diamagnetic drift frequency *ω,iof thermal ions.This fishbone instability,the so-called *ω,ibranch,can also be resonantly destabilized by energetic trapped particles [3].Further work has shown that energetic passing particles can also excite fishbone instabilities [4-6].Betti et al found that theω*,ifishbone can be destabilized by passing energetic particles when the effect of finite orbit width of the energetic particles is taken into account [4].The corresponding wave particle resonance isω=k‖v‖withk‖~being the parallel wave number of the (1,1) mode.More recently,Yu showed that an EPM branch of fishbone can be destabilized by energetic passing particles with mode frequency determined by the wave particle resonanceω=k‖v‖when*ω,iis neglected [5].Finally,Wang showed analytically that energetic passing particles can excite another EPM-type fishbone at a much higher mode frequency [6] satisfying the wave particle resonance ofω=ωφwhereis the toroidal transit frequency of energetic passing particles.
In this work,energetic co-passing particle-driven n=1 internal modes in tokamak plasmas are investigated numerically using the global kinetic-MHD(magnetohydrodynamics)hybrid simulation code M3D-K [7].The energetic particles are introduced by neutral beam injection(NBI)heating.The q profile monotonically increases with radius with central valueq0<1.A systematic study of key parameter dependence has been carried out.Parameter values of beam ion beta,injection energy and beam ion orbit width are scanned.Our results show that all beam ion-driven modes are low-frequency fishbone modes driven by the wave particle resonanceωφ+ωθ=ω.The simulation results of mode structure,mode frequency and stability are similar to Yu’s theory [5].
This article is organized as follows.Section 2 gives a brief introduction to the M3D-K code and parameters and profiles used in our simulation studies.In section 3,simulation results are presented.Section 4 provides discussion on comparison between simulation results and analytic theory.Finally,conclusions are reached in section 5.
2.Simulation model and parameter setup
In this work,we use the global kinetic-MHD hybrid code M3D-K [7],in which a particle/MHD hybrid model is used to describe the interaction of energetic particles and MHD waves.In this model,the thermal plasma is treated as a single fluid while the energetic particles are described by the driftkinetic equation.The drift-kinetic equation is solved by the particle-in-cell method [7].The M3D-K code has been successfully applied to study energetic particle-driven instabilities,such as fishbone and energetic particle effects on MHD modes [7-15].
In our simulations,parameters and profiles similar to those of HL-2A tokamak plasmas are used.The main parameters include major radiusR0=1.6 m,minor radius=a0.4 m,magnetic field at magnetic axisB=1.34 T,0 central electron densityne0=1.3 ×10¹⁹m-3,Alfven speedvA==5.56 ×10⁶ms-1,Alfven timeτA==2.88 ×10⁻⁷s and Alfven frequencyωA==3.7 ×10⁶s-1.Both thermal ion species and energetic ion species are deuterium ion.The thermal plasma and energetic particle beta profile are respectivelyβthermal=βthermal0(1-)2andβhot=βhot0expwith= 0.11 where=(ψ-ψmin) (ψmax-ψmin)is the normalized poloidal magnetic flux function varying from= 0 at the magnetic axis to= 1 at the edge of the plasma.Figure 1 shows these two beta profiles.The q profile is given byq=0.85 +2r2,where r is the normalized minor radius,as shown in figure 2.
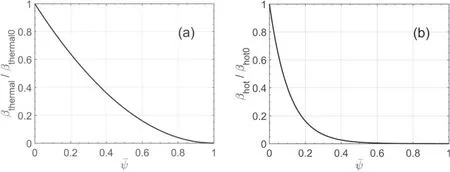
Figure 1.Normalized thermal plasma beta (a) and energetic particle beta (b) as a function of the normalized poloidal flux.
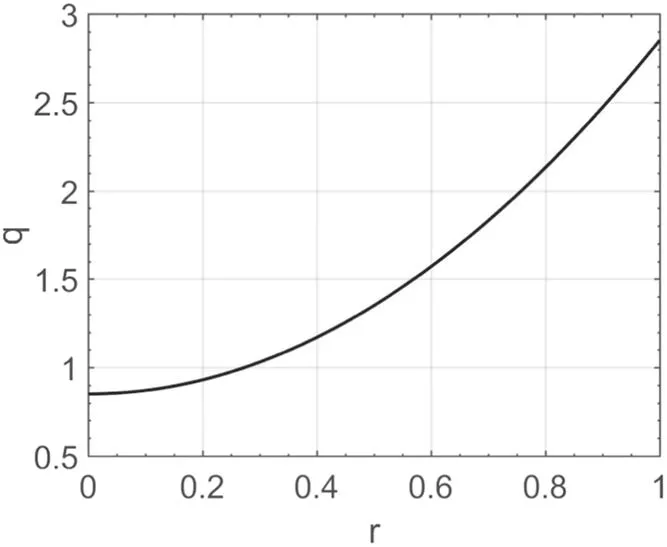
Figure 2.Safety factor as a function of the minor radius.
For the energetic beam ions,a slowing-down distribution in velocity is used along with a peaked distribution in pitch angle for deeply co-passing particles.The beam ion distribution F is given by,

wherecnis an overall normalization coefficient andn0is the central density of particles.,F2(v)andF3(Λ,v)are the distribution in space〈ψ〉,velocityvand pitch angle parameter Λ,respectively.Here,Λ =withμbeing the magnetic moment and E being the energy.is given by,
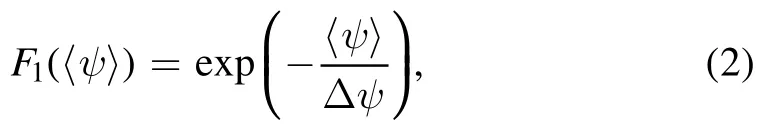
where〈ψ〉 is the orbit-averaged value of the normalized poloidal flux defined bywithPφ=eψ+mv‖Rbeing the toroidal canonical angular momentum.Δψ= 0.11 is the width of radial distribution and is the same as in the energetic ion beta profile.F2(v)is given by,
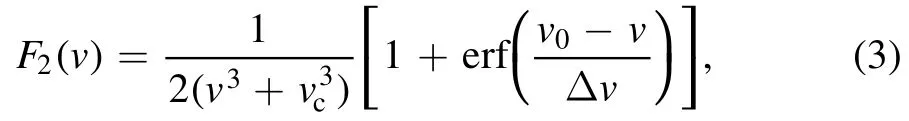
wherev0is the injection speed of NBI,vc=is the critical velocity,Δv=0.1v0represents the width of the distribution near the injection speed,and erf is the error function.F3(Λ,v)is given by,
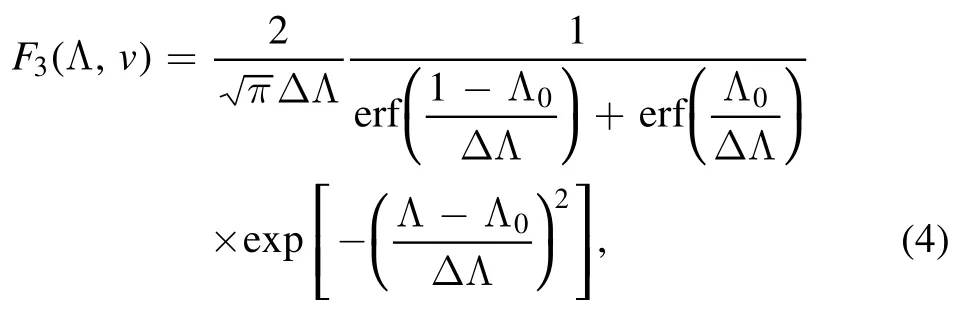
where Λ0= 0is the central pitch angle parameter and ΔΛ = 0.2 is the width of pitch angle distribution,which is fixed.
For simplicity,the energetic particle pressure is assumed to be isotropic in the equilibrium calculation with the profile given by the energetic particle beta profile,as prescribed above.The equilibria are calculated using the VMEC code[16]with the prescribed total pressure profile and safety factor q profile together with the prescribed plasma boundary shape(circular in this study).The results of the equilibrium calculations are used as initial conditions for the M3D-K simulation.It should be noted that the q profile can be prescribed exactly in the VMEC calculations independent of pressure profile.
3.Simulation results
In this section,we present the simulation results of the n=1 mode driven by energetic co-passing beam ions.Key beam ion parameters of beta,injection energy E0and orbit width are varied in our simulation study in order to investigate the dependence of the fishbone instability on key parameters.The simulated linear mode frequencies and growth rates are compared with the analytic theory of Yu et al [5].The analytic results of mode frequencies and growth rates are obtained from the dispersion relation of Yu non-perturbatively without assumption of growth rate being much smaller than mode frequency.
3.1.Simulation results of the baseline case at q0=0.85,E0=90 keV
Here,we present the baseline simulation case with parametersq0=0.85,E0=90 keV,βthermal0= 2.13%,βhot0= 2.13%,andΔΛ = 0.2.Figures 3(a) and (b) show the evolution of kinetic energy associated with fluid velocity,and the evolution of mode phase at r/a=0.3,respectively.The results indicate that the mode grows linearly at a growth rate of γ=0.0184ωA.The mode frequency is quite low and is estimated to be ω=0.0195ωAbased on the phase evolution.
Figure 3(c) shows the mode structure of the plasma velocity’s stream function U (The black circle is the radial position of the q=1 surface).As a comparison,figure 3(d)shows the mode structure of the MHD internal kink mode obtained for the corresponding case without energetic particles.We observe that the mode structure of the baseline case with beam ions is similar to that of the (1,1) internal kink mode,although there is a small but finite m=2 component outside the q=1 surface.
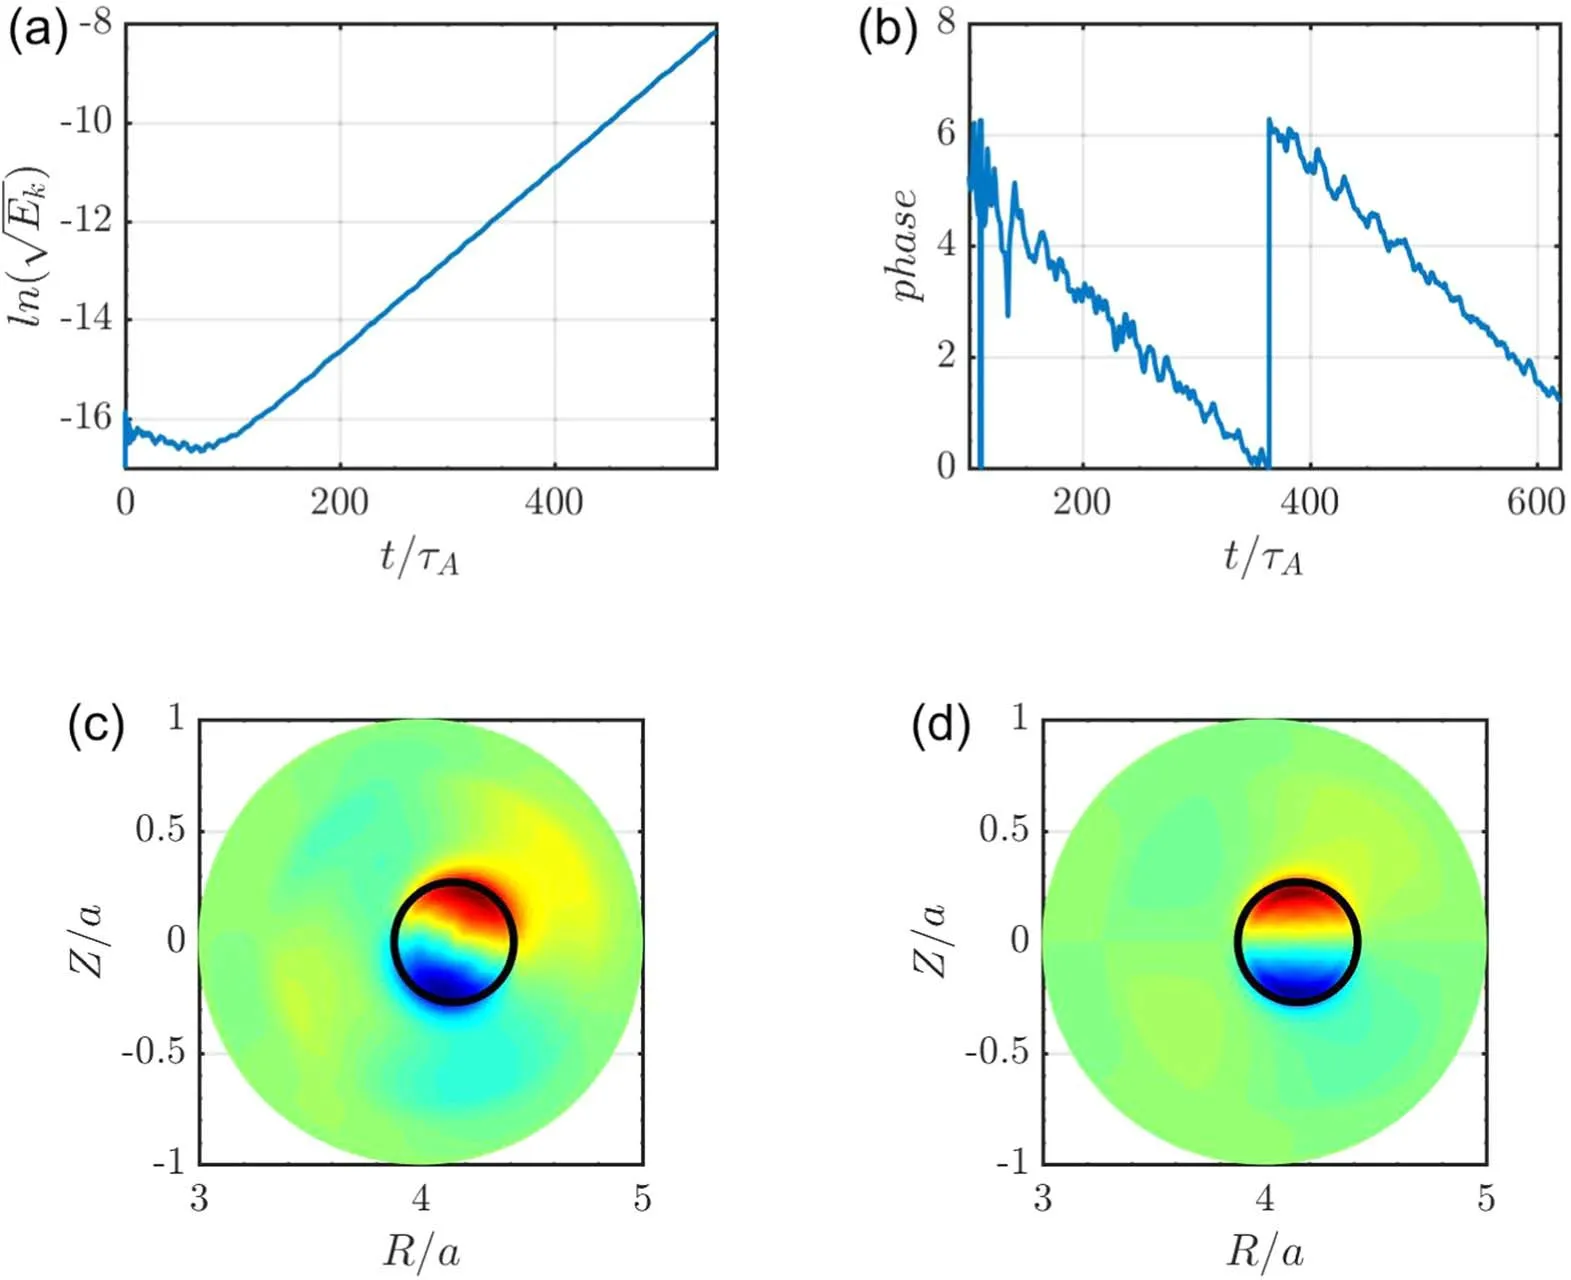
Figure 3.(a)Evolution of kinetic energy Ek,(b)evolution of mode phase,(c)the mode structure of the plasma velocity’s stream function U for the baseline case and (d) the corresponding mode structure of the internal kink mode at zero energetic particle beta.
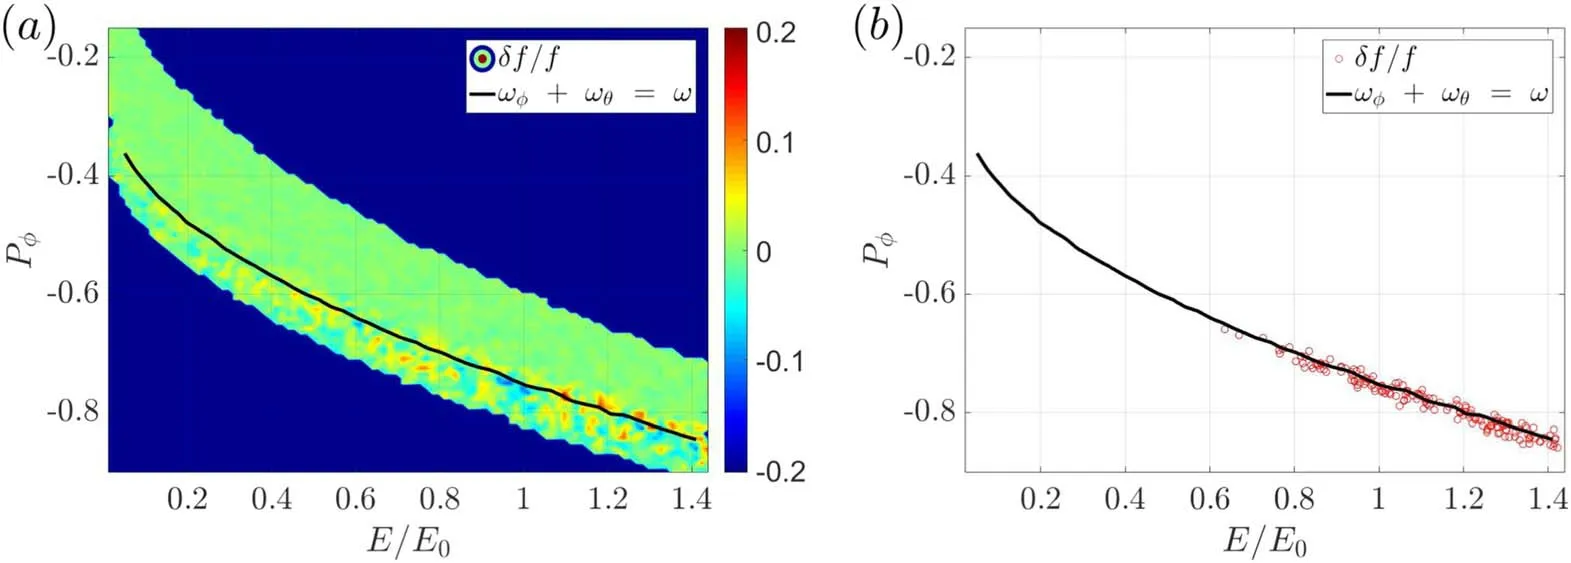
Figure 4.(a)Contour of the normalized perturbed energetic particle distribution in the phase space,(b)locations of simulation markers with the largest values of particle weight (red circles).Black line represents the p=1 resonance line in the phase space.
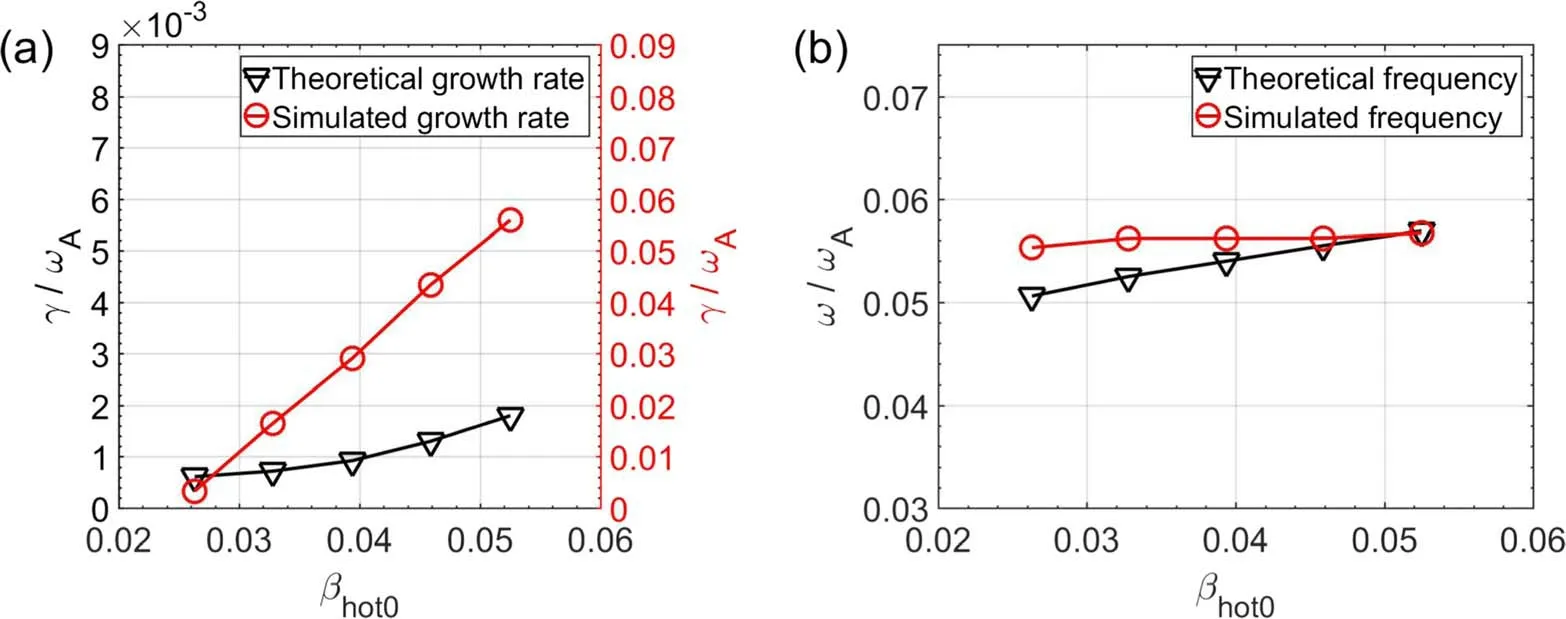
Figure 5.Comparison between simulation results (red line) and analytic results (black line) of (a) growth rate and (b) mode frequency as a function of beam ion beta.
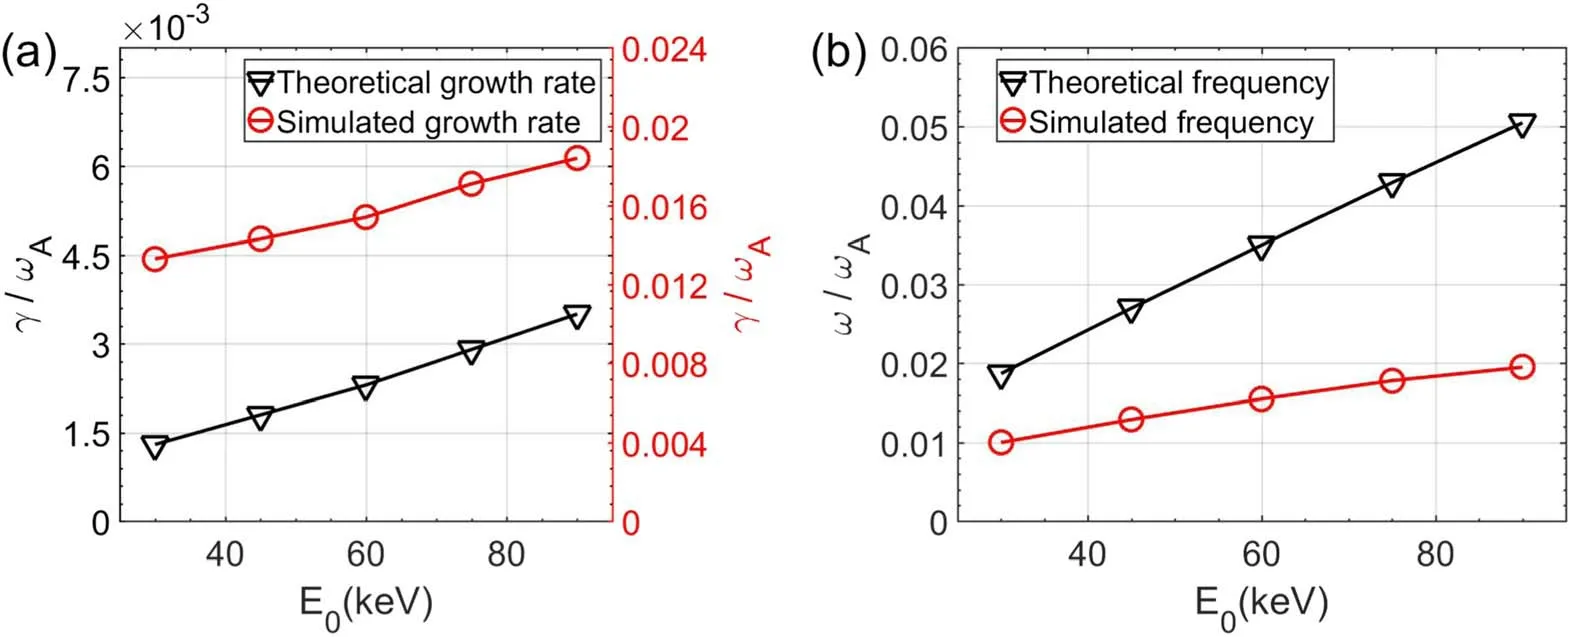
Figure 6.Comparison between simulation results (red line) and analytic results (black line) of (a) growth rate and (b) mode frequency as a function of beam ion injection energyE 0.
Now,we consider the main wave particle resonance responsible for driving the mode.In general,the wave particle resonant condition is given by [17],

where n is the toroidal mode number (n=1 in this study),p is an integer denoting the poloidal harmonic,ωis the mode frequency,ωθ≡is the poloidal transit frequency of beam ions andωφ≡is the toroidal transit frequency.
In order to identify the main wave particle resonance,we plot both the contour of the normalized perturbed distribution(figure 4(a)) and the locations of simulation markers with the largest values of particle weightw=(figure 4(b))in the phase space of(Pφ,E)whereδfis the perturbed distribution function of energetic beam ions.We observe that both the contour of the perturbed distribution and the locations of simulation markers with largest values of particle weight are aligned with the p=1 resonant line.This is expected since resonant particles usually have the largest values of particle weight due to secular changes of perturbed distribution function at the resonance.These results indicate that the unstable mode is driven by the p=1 resonance in agreement with the analytic theory of Yu et al [5].It should be pointed out that in this study the beam ions are co-passing particles with negativeωφand positiveωθin the M3D-K convention.Furthermore,the simulated mode frequencyωis negative,indicating that the mode rotates toroidally in the direction of the plasma current.Therefore,it can be shown that our p=1 resonance ofωφ+ωθ=ωis equivalent to the p=−1 resonance ofωφ-ωθ=ωof Yuet al[5]where the values ofωφ,ωθandωare all positive.
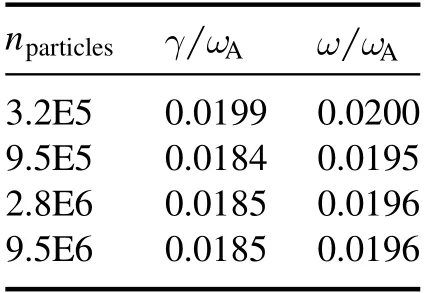
Table 1.Convergence in number of simulation markers.
The above results and most other simulation results in this work are obtained with the following numerical resolutions:time step sizedt=0.01τA,100 radial grid points,400 poloidal grid points at the plasma edge and about one million simulation markers.A systematic convergence study shows that this set of resolutions is sufficient for obtaining accurate results.In particular,table 1 gives values of the growth rate and mode frequency for several simulation markers.The results indicate that about one million simulation markers are adequate for obtaining accurate results.
3.2.Dependence on beam ion beta
Figure 5 shows the simulation results(red lines)of(a)growth rate and(b)mode frequency as a function of central beam ion beta at the fixed value of thermal ion betaβthermal0= 0.135%.All other parameters are the same as in the baseline case.We observe that the mode becomes unstable when beam ion beta exceeds the threshold and the growth rate increases with beam ion betaβhot0.The mode frequency also increases gradually with increasingβhot0.This indicates that the unstable mode is driven by beam ions.The finite mode frequency is due to the kinetic effect of wave particle resonant interaction and beam ion diamagnetic effect.For comparison,the analytic results(black lines)from the fishbone dispersion relation of Yu et al[5] are also plotted.The analytic results are obtained by solving the dispersion relation of Yu non-perturbatively without assuming smallness of growth rate.The comparison indicates that the simulated frequency is close to the analytic results in this case.However,the simulated growth rates are much larger than the analytic values.
3.3.Dependence on beam ion injection energy
Here,simulations are carried out to study the dependence of fishbone on beam ion injection energy ranging from 30-90 keV.Other parameters and profiles are fixed and the same as those of the baseline case.In particular,the beam ion beta value is fixed in this scan.This means that the beam ion density physically decreases as the beam ion injection energy increases.Figure 6 shows the comparison between the simulation results(red lines)and analytic results(black lines)of the linear growth rate and frequency.We observe that both the mode frequency and growth rate increase as the beam energy increases.The simulation results agree with analytic theory trend.In particular,the simulated mode frequency increases almost linearly with beam energy,which is consistent with the analytic prediction,although the values are different.It should be noted that,in this case,the thermal beta value ofβthermal0= 2.13%is much larger than that of figure 5.Our simulation results indicate that typically the simulated mode frequencies become closer to the analytic results as the thermal beta becomes smaller.At beam energy of 60 keV,the corresponding mode structure of the instability is shown in figure 7(a) while the contour of the normalized perturbed distribution in phase space is plotted in figure 7(b).We observe that the simulated mode structure is similar to that of the baseline simulation case with dominating(1,1)mode.We also see that the contour of the perturbed distribution is roughly aligned with the p=1 resonance line.This indicates that the main resonance is again given by the p=1 resonance ofω=ωφ+ωθin agreement with the analytic theory.
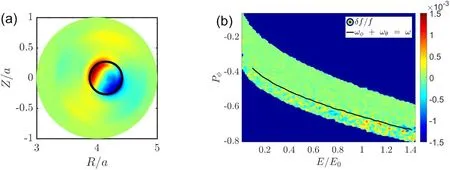
Figure 7.(a)Linear mode structure at E0=60 keV and(b)locations of resonant particles(red circles)and the p=1 resonance line(black)in the phase space.
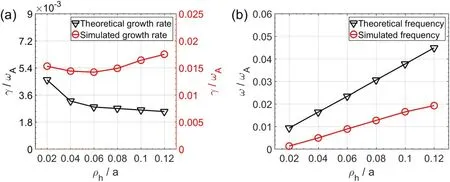
Figure 8.Comparison between simulation results (red line) and analytic results (black line) of (a) growth rate and (b) mode frequency as a function of beam ion orbit width parameterρ h.
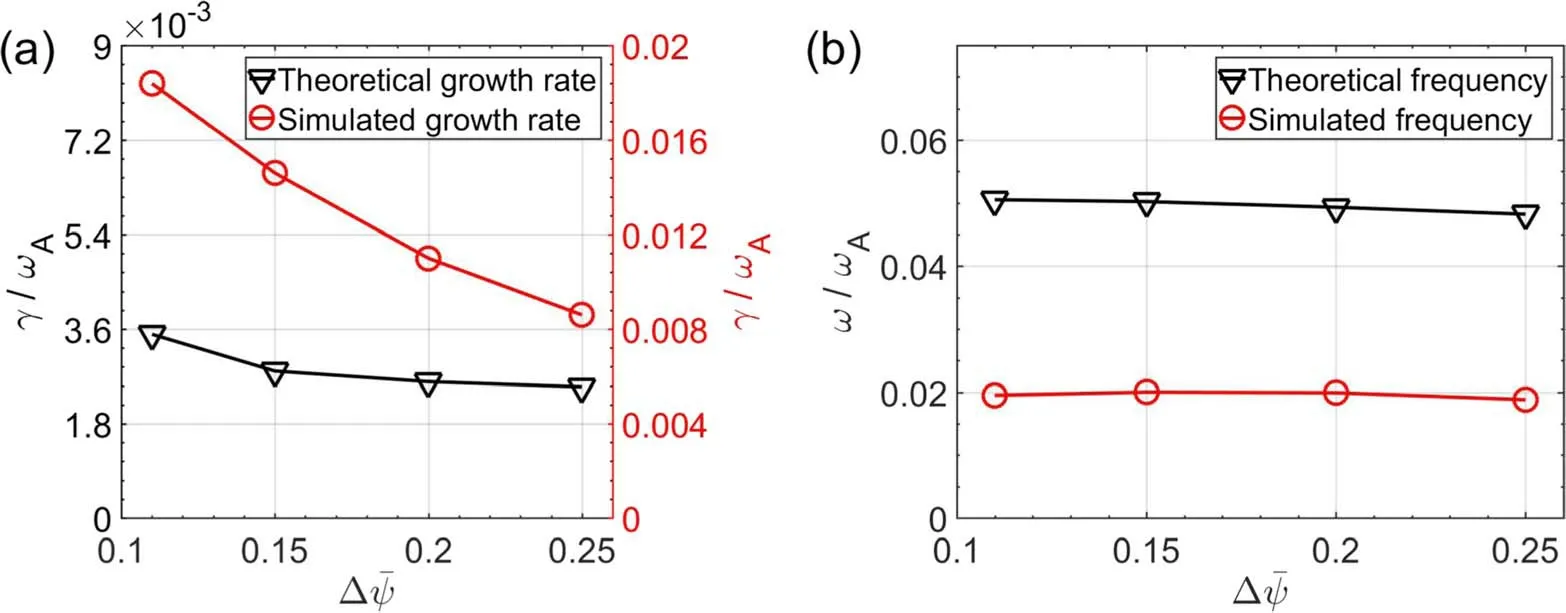
Figure 9.Comparison between simulation results (red line) and analytic results (black line) of (a) growth rate and (b) mode frequency as a function of beam ion radial profile width Δ.
3.4.Dependence on beam ion orbit width
According to the theory of Betti [4] and Yu [5],the lowfrequency fishbone dispersion relation is sensitively dependent on the beam ion orbit width.Therefore,here we fix the ratio of=0.45and scan the beam ion orbit width parameterwhereωhis the cyclotron frequency.This scan is done by varying beam ion mass and beam ion injection energy proportionally at the fixed beam ion injection speed.Figure 8 shows the comparison between the simulation results and analytic theory of the mode growth rate and frequency.The black line represents the theoretical values and the red line the simulated values.We observe that,as above,the simulated frequency increases almost linearly withρhin qualitative agreement with the analytic theory,while the growth rates are much larger than those of analytic theory.
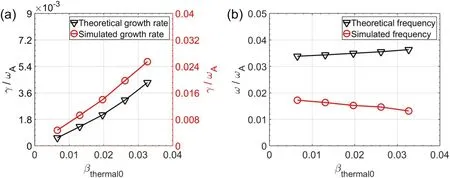
Figure 10.Comparison between simulation results(red line)and analytic results(black line)of(a)growth rate and(b)mode frequency as a function of thermal plasma beta.
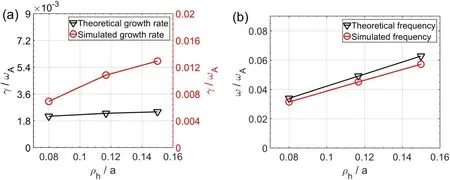
Figure 11.Comparison between simulation results(red line)and analytic results(black line)of(a)growth rate and(b)mode frequency as a function of beam ion orbit width parameterρ h.
3.5.Dependence on beam ion radial profile
Figure 9 shows the dependence of (a) simulated growth rate(red line) and (b) mode frequency (red line) on the beam ion radial profile width Δ.For comparison,the analytic results(black lines) are also plotted.The results show that the simulated mode frequency is not sensitive to the profile width,which is similar to that of analytic theory.
3.6.Dependence on thermal plasma beta
Finally,we study the dependence on thermal plasma beta at the fixed value of beam ion betaβhot0= 2.13%and the beam energyE0=60 keV.Figure 10 shows the simulation results(red circles)and analytic results (black triangles)of(a)mode growth rates and (b) mode frequency.We observe that the simulation results are consistent with analytic theory trend.First,the growth rates increase linearly with thermal beta.Second,the mode frequencies are not sensitive to thermal beta.
3.7.Results with smaller ΔΛ and larger aspect ratio
In order to explore the influence of the inverse aspect ratio and the width of pitch angle distribution on the fishbone,here we consider a larger aspect ratio of=10.Figure 11 gives the comparison between simulation results and analytical results as a function of beam ion orbit width at=0.53,=10,βhot0= 0.8%andβthermal0=0.008%.From the results shown in figure 11,the simulated frequencies agree quite well with analytical theory,while the growth rates are much larger than the analytical values.It should be pointed out that the good quantitative agreement between the frequencies is mainly due to the small value of thermal plasma beta rather than the larger value of=10,as will be discussed in section 4.
We also consider the effects of the pitch angle distribution.Figure 12 shows the simulated growth rates and frequencies as a function of beam ion beta for two values ofΔΛ:ΔΛ = 0.1 (blue line) andΔΛ = 0.2 (red line).We observe that the results are nearly independent ofΔΛ.
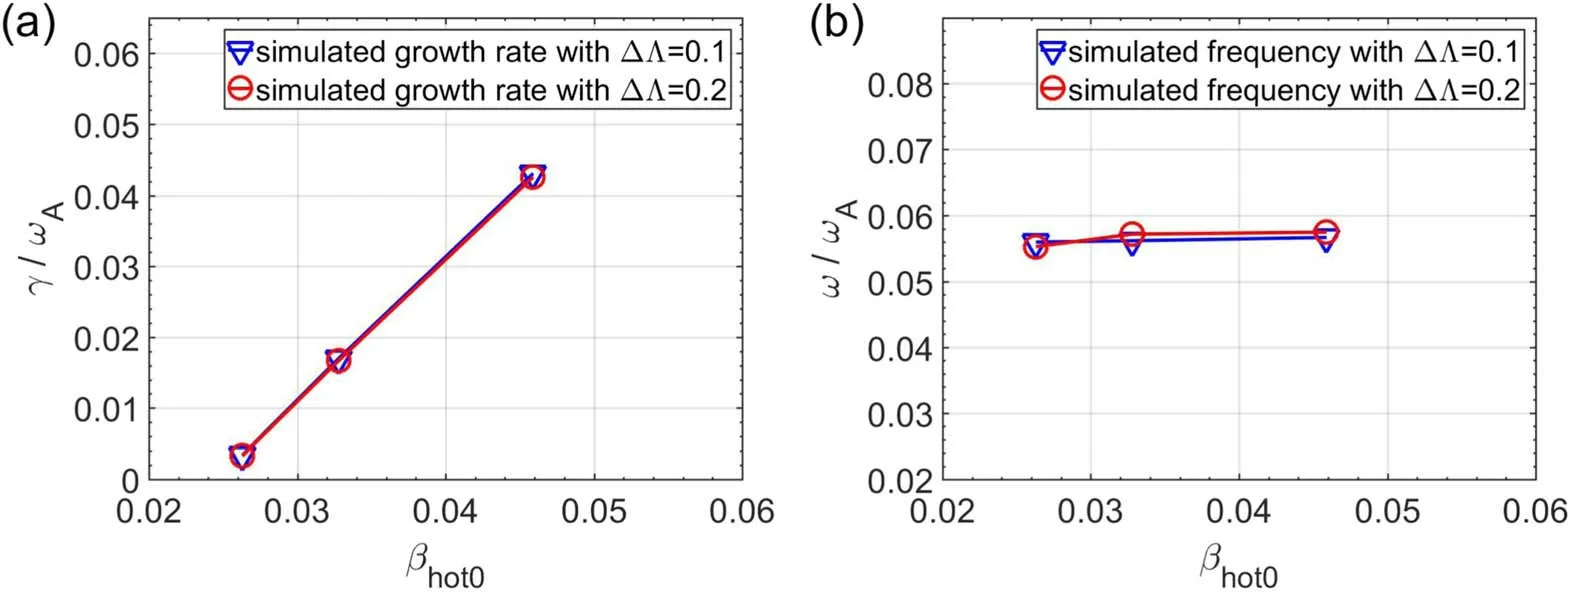
Figure 12.Comparison between simulation results with fixed ΔΛ = 0.2 (red line)and simulation results with fixed ΔΛ = 0.1(blue line)of(a) growth rate and (b) mode frequency as a function of beam ion beta.
4.Discussion
In the above sections,simulation results are presented for energetic co-passing beam ion-driven n=1 mode in tokamak plasmas with a monotonic q profile andq0<1.The linear simulation results show that a low-frequency EPM-type fishbone is driven unstable by energetic co-passing particles via the wave particle resonance ofωφ+ωθ=ω.Our numerical results are similar to the analytic theory of Yu et al[5]with respect to mode structure and mode frequency as well as the wave particle resonance responsible for the low-frequency fishbone.Specifically,the simulated mode structure is similar to that of the(1,1)internal kink mode.The simulated unstable mode is driven by energetic beam ions via the p=1 wave particle resonance ofωφ+ωθ=ω.The calculated mode frequency increases almost linearly with beam ion energy and beam ion orbit width.To our knowledge,this work is the first numerical demonstration of energetic co-passing particle-driven low-frequency fishbone with mode features similar to those of the analytic theory of Yu et al.
It should be pointed out there are quantitative differences between the simulation results and Yu’s theory.Specifically,the simulated mode frequencies are typically lower than those of analytic theory at finite values of thermal plasma beta,although the agreement in mode frequency is quite good at low thermal plasma beta values.The simulated growth rates are much larger than those of analytic theory.The simulated mode has a finite extension beyond the q=1 radius.These discrepancies may come from the simple approximations used in deriving the analytic dispersion relation of the low-frequency fishbone.In particular,the analytic theory assumes that the mode is a pure (1,1) harmonic whereas our simulation results show a finite m=2 component beyond the q=1 surface.Second,the analytic theory assumes large aspect ratio tokamak equilibria with low plasma beta whereas our simulations use numerical equilibria with finite beta and finite aspect ratio.We have carried out simulations to investigate the effect of finite aspect ratio.Our simulation results show that a larger value of aspect ratio=10 does reduce the frequency discrepancy somewhat,but it is not enough to explain the frequency discrepancy at finite values of thermal ion beta.For example,we have carried out simulations for parameters ofβthermal0= 0.6%,βhot0= 0.8%,=10,=0.15and=0.53.The simulated mode frequency is= 0.037,which is still lower than the analytic value of 0.062.
Finally,we note that for the parameters and profiles considered in this work,only the low-frequency fishbone is found.The energetic passing particle-driven high-frequency fishbone of Wang [6] is not found in our simulations.Future work will investigate the reasons for the absence of the high-frequency fishbone and results will be reported elsewhere.Nonlinear dynamics of the low-frequency fishbone will also be investigated in future work.
5.Conclusion
A linear simulation study of the energetic passing particle-driven fishbone instability in tokamak plasmas has been carried out using the global kinetic-MHD hybrid code M3D-K.Key beam ion parameters of beta,injection energy and orbit width are varied to investigate the dependence of mode properties on them.The results show that a low-frequency fishbone is excited when the energetic particle beta exceeds a critical value.The mode structure is similar to that of the(1,1)internal kink mode.The main resonance is found to beωφ+ωθ=ω.The mode frequency is approximately proportional to the beam ion injection energy and beam ion orbit width.These simulation results are similar to the recent analytic theory of passing energetic particle-driven low-frequency fishbone of Yu et al [5].
Acknowledgments
We thank Dr Feng Wang for useful discussions and for help with the use of the M3D-K code.This work is supported by the National MCF Energy R&D Program of China (Nos.2019YFE03030004 and 2019YFE03050001) and National Natural Science Foundation of China (Nos.11975232 and 11975270).Numerical simulations were carried out using the CFETR Integration Design Platform (CIDP) with the support of the Supercomputing Center of the University of Science and Technology of China.Part of the numerical simulations were carried out using the Qilin supercomputer #2 of the Institute for Fusion Theory and Simulation,Zhejiang University.
ORCID iDs
杂志排行

Plasma Science and Technology的其它文章
- Recent progress on the J-TEXT three-wave polarimeter-interferometer
- Design of the stripping unit and the electromagnetic analysis unit for the E//B NPA on HL-2A/2M tokamak
- Space-resolved vacuum-ultraviolet spectroscopy for measuring impurity emission from divertor region of EAST tokamak
- Development of a combined interferometer using millimeter wave solid state source and a far infrared laser on ENN’s XuanLong-50(EXL-50)
- Bench test of interferometer measurement for the Keda Reconnection eXperiment device (KRX)
- Neutron yield measurement system of HL-2A tokamak