Research on the Calculation Method for the Parameters of Underground Dual-Mass Disturbance Zones∗
2022-06-08DONGDonghuiCHENGXiangmingZHANGZhenjunWANGJianchengMAOWei
DONG Dong-hui CHENG Xiang-ming ZHANG Zhen-jun WANG Jian-cheng MAO Wei
(1 Yunnan Observatories,Chinese Academy of Sciences,Kunming 650216)
(2 University of Chinese Academy of Sciences,Beijing 100049)
(3 Key Laboratory for the Structure and Evolution of Celestial Objects,Chinese Academy of Sciences,Kunming 650216)
(4 Engineering Laboratory on Applied Astronomical Technology of Yunnan,Kunming 650216)
(5 School of Computer Science&Information Engineering,Anyang Institute of Technology,Anyang 455000)
ABSTRACT The classic astrometric instruments can measure the local astronomical longitude and latitude by using plumb line as a reference,where the variation of local plumb line can be gotten.The deflection of the local plumb line implies the change of the gravitational field around the station.It is often related to the redistribution of subsurface matter,and could be helpful for knowing the situation of underground materials.A dual-mass model is developed to find the relationship between local PLV(Plumb Line Variation)and subsurface mass change.3480 sets of cases are considered which containing positive and negative mass variations(relative to the geological background)in the range of 97◦E–107◦E(E denotes east longitude)and 21◦N–29◦N(N denotes north latitude).The relevant problem is solved by the DE(Differential Evolutionary)algorithm.The resulting error of position is about 1 meter and error of mass is less than 1011 kg,which are improved in comparison to the previous treatments.
Key words astrometry,methods:numerical:DE(Differential Evolutionary)algorithm,PLV(Plumb Line Variation),underground mass disturbance
1 Introduction
Astrometry aims to measure the position,distance and other parameters of celestial bodies accurately.The ground-based astrometry can provide information about the gravity field of earth[1–2]because of the plumb-line-based measurement method.Thus,some astrometric technologies were developed,such as the photographic zenith tube[3]and the multifunctional theodolite[4].
The multifunctional theodolite developed by Yunnan Astronomical Observatories(YNAO)can detect the variation of local plumb line by measuring local astronomical longitudeλand latitudeϕwith high precision[5].The principle of its measurement is as follows:
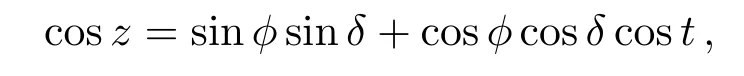
wheret=S−α+λ;Sis the Greenwich sidereal time at the observed instant.αandδare the apparent right ascension and apparent declination of observed star,andzis the zenith distance.We can solve the equations and get the local astronomical latitude and longitude by observing several stars.In practice,the following formula will be used for solving∆λcosϕand∆ϕwhich denote the disturbance of longitude and latitude of the station respectively:

wherez0is the adopted value of the zenith distance and∆zrepresents its variation.t0=S−α+λ0,ϕ0andλ0are the adopted values of latitude and longitude of the station.The variation of time∆t=∆λ,if the error of the clock of station is considered to be negligible.
The plumb line is the normal line of the Geoid,and its direction will be deflected by surrounding gravitational field changes,and the observed results of the theodolite will be affected.After decreasing some influence from different errors[6],we can get higher precision results to detect smaller disturbances of the plumb line.
There are many factors to cause the variation of the Earth’s gravity field over time,including both tidal and non-tidal variations.The former has been studied in more detail[7].In this paper,we focus on the non-tidal temporal variation of the gravity field.This part mainly includes the effects of crustal deformation and subsurface material redistribution around the stations.
The variations of local gravity connected with earthquake were detected,such as the 1964 Niigata earthquake in Japan[8],the Alaska earthquake in the United States[9],the 1975 Haicheng earthquake and the 1976 Tangshan earthquake[10].Many scholars analyzed the gravity anomalies before and after the earthquakes in several earthquake zones and their surrounding areas[11–14],for supporting the case of Subsurface Mass Migration Theory.In addition,they have also tried to explain the specific forms of subsurface material migration or changes.
Zhang[15]speculated that the cause of the anomaly in Ref.[1]was groundwater activity,while Gu et al.[16]simulated the gravity variation in the studied area using the finite element method under certain assumptions.They suggested that the residual gravity variation in the region supports the possibility that the migrating material is subsurface fluid at crustal depth.
Because the complicated properties of subsurface materials cannot be detected directly at present,the models on subsurface materials related to local gravity changes are needed.
Based on the data of local gravity in Tangshan with a total of 46 periods from 1987 to 1998,Li et al.[17]and Yang et al.[18]presented that the subsurface material could be disturbed under two earthquakes through explaining the local gravity anomalies.
A single-mass model connecting subsurface material to gravity change obtained by local PLV(Plumb Line Variation)was proposed by Wang et al.[4],in which the subsurface material was simplified as a mass with abnormal massM.The deflection angle of local PLVθcaused by subsurface material is given by
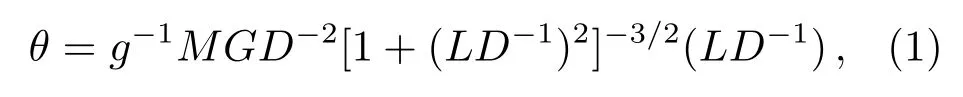
whereDandLare the vertical component and the horizontal component of the distance between the center of mass and observational station,respectively.gis the normal gravity acceleration at observational station andGis the gravitational constant.A schematic diagram of the single-mass model is shown by Fig.1 andg′is the new gravity acceleration of the station after the deflection.

Fig.1 The deflection angle of local PLV caused by subsurface material.a is the gravitational acceleration between the mass and the station.
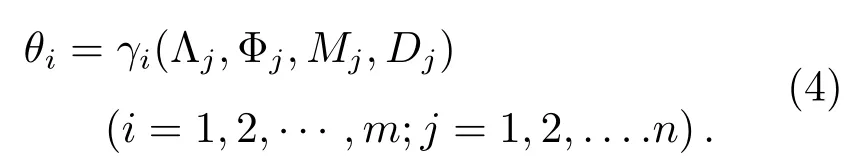
For real cases,the subsurface material could contain more than one mass,in which the abnormal masses could be positive for the aggregation of material or negative for the dissipation of material.The deflection of the local PLV will contain the contribution of multiple masses,and the above model is not applied.In this paper,we establish a dual-mass model based on the single-mass model to solve the parameters of two subsurface masses that exist simultaneously.The essence of the problem is to solve a set of nonlinear equations.
The solutions of nonlinear equations are often difficult to be obtained in analytic form,so we use numerical methods to solve them and it is transformed into the optimization problem.Traditional numerical solution methods such as Gradient Descent(GD)and Newton’s method have the advantage of fast convergence,but the location of the mass is unknown to cause large range of latitude and longitude intervals and low efficiency for the problem solution.The differential evolutionary algorithm is used as the core method in this paper because of its advantages of not relying on the initial value,not requiring the optimization function to be differentiable and derivable,and having a better global search capability.
2 Introduction to Differential Evolutionary Algorithm
DE(Differential Evolutionary)is an evolutionary computing technology which is firstly invented by Storn[19]for solving the Chebyshev polynomial problems.It has been found that DE shows an excellent capability in solving complex optimization problems[20].
The classic DE bases on population evolution and uses real number encoding.The algorithm solves the optimization problem by the competition and cooperation between different individuals of population.Let’s take a minimum problem for example,and there is an objective function
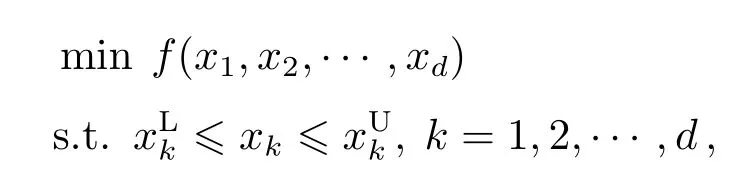
where minfmeans minimizing the objective functionf,dis the dimension of the solution space,andare the lower and upper limits of thekthcomponentx k.The main flow is as follows[21]:
1.Initializing:
(a)initialized part of parameters.
(b)initialized population:initial population
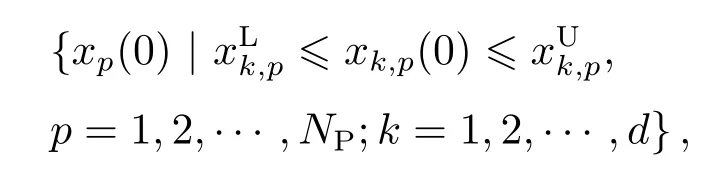
generate randomly:
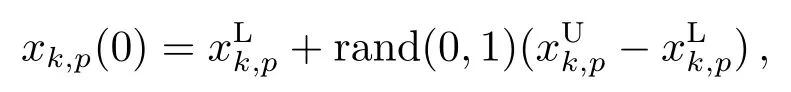
x p(0)represents thepthindividual in the 0thgeneration,andx k,p(0)represents thekthgene of thepthindividual.NPstands for the size of population,rand(0,1)indicates that gets a random value from 0 to 1.
2.Mutation.Differential,the first word of DE,is the way how individual mutate.A normal way is that choosing two different individuals from population randomly and compounding their difference-vectors and the individual prepared to mutate,then we get the midindividualv p(s+1)as follow:

whereFis scaling factor,andx r1,x r2,···,x rindexdenote individuals randomly selected from the population,andr1,r2,···,rindexare their indexes respectively which belong to the set of natural numbers.x p(s)represents thepthindividual of thesthgeneration.Midindividuals,p=1,2,···,N P;k=1,2,···,d}.v k,p(s+1)represents thekthgene of thepthmid-individual in thes+1thgeneration,andare the lower and upper limits,respectively.
The mutation operation may result in the creation of genes in the individual that exceed the boundary conditions.In this case,it is necessary to repair the genes that exceed the limit to ensure the validity of the solution in the evolutionary process.In this paper,we use the random-repair method,which replaces the overrun genes with a random set of values that satisfy the boundary conditions.
3.Crossover.Do crossover operation on thesthgeneration populationx p(s)and the midindividualsv p(s+1)
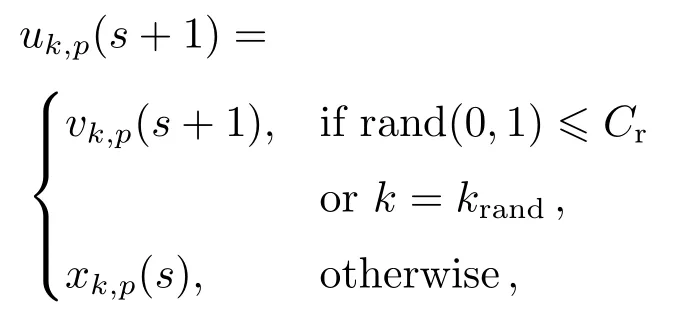
whereCris the crossover rate,krandis a value randomly selected from the range ofk.u k,p(s+1)is thekthgene of thepthmidindividual,ands+1 means it will be selected into the next generation.
4.Selection.Greed algorithm will be followed when selecting individuals for next generation.
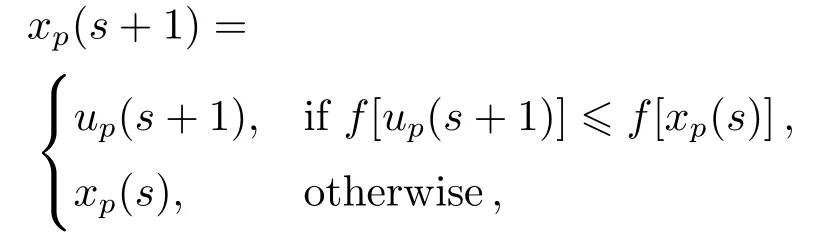
whereu p(s+1)is the individual obtained in crossover operation.Since the aim is to minimize the objective functionf,the individual with a smaller value offwill be selected fromu p(s+1)andx p(s)in this step.
Pseudocode is as Algorithm 1[22]:
The statement above shows a classical DE strategy and it can be marked as DE/rand/1/bin.And the explanation of general form DE/a/b/c is as follows:DE is obviously the abbreviation of DE algorithm.Letter“a”represents the mutation type of the individual.Letter“b”is the number of difference-vector we used.Letter“c”shows the strategy of crossover operation.Table 1 shows several variant DE we used commonly.
The basic DE program we used is provided by Geatpy toolbox1Jazzbin.Geatpy:the Genetic and Evolutionary Algorithm Toolbox with High Performance in Python.2020.
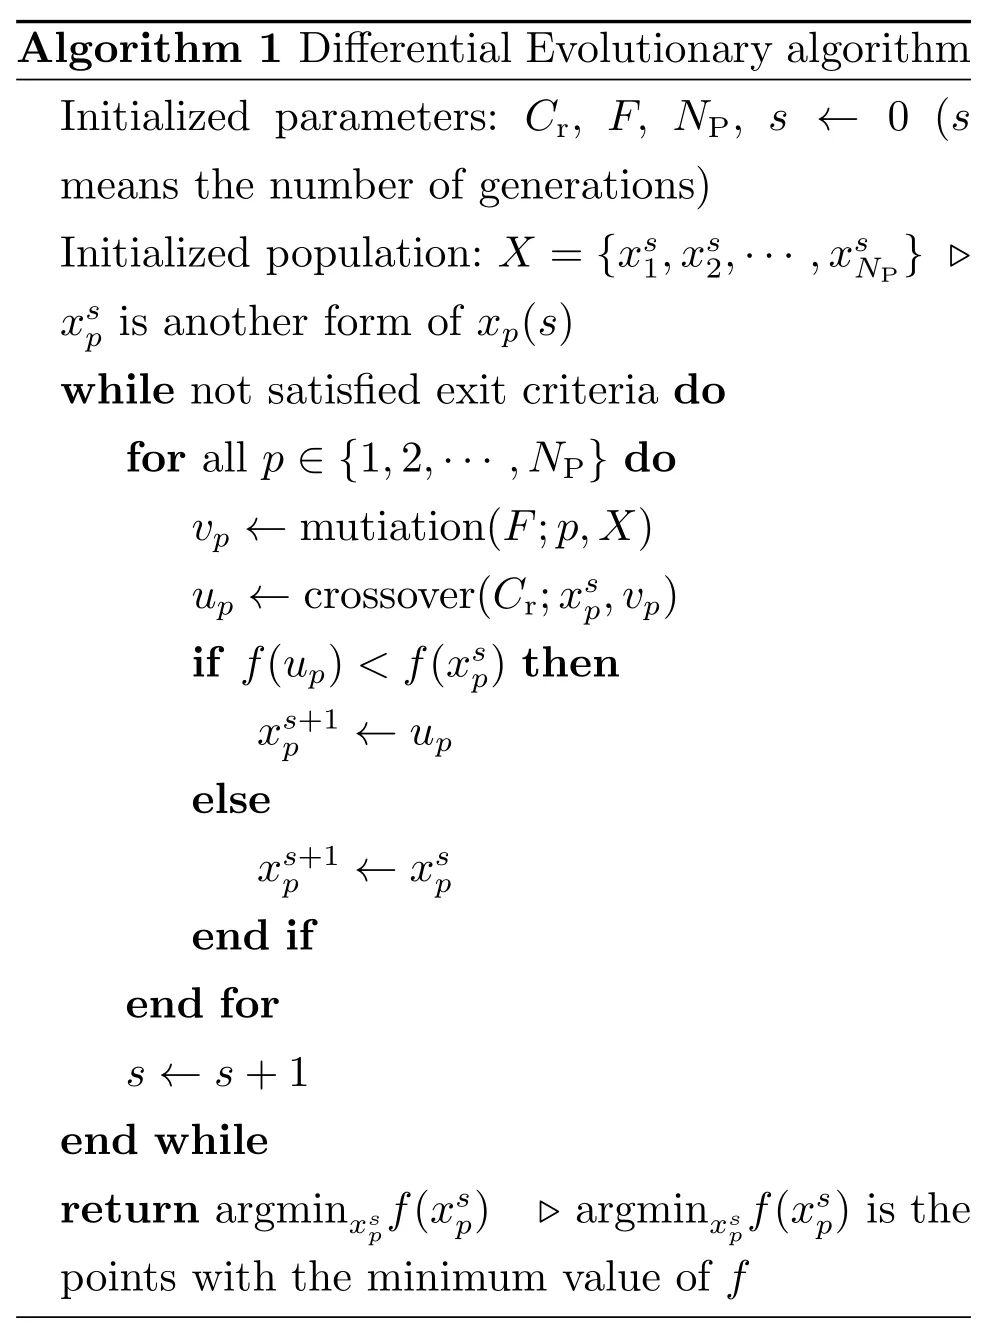
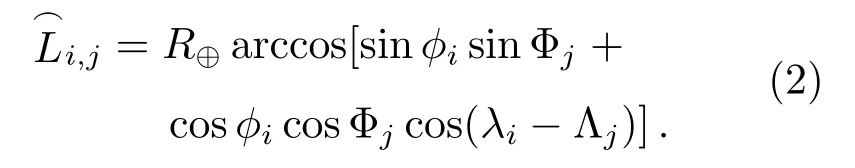
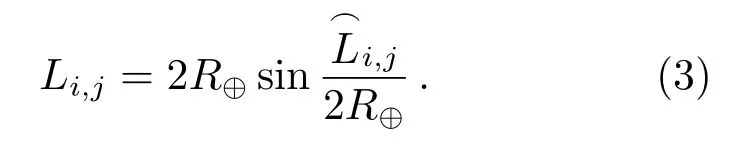
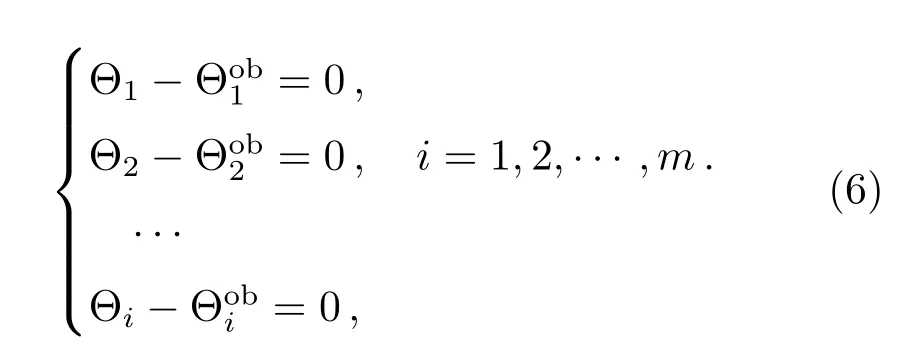
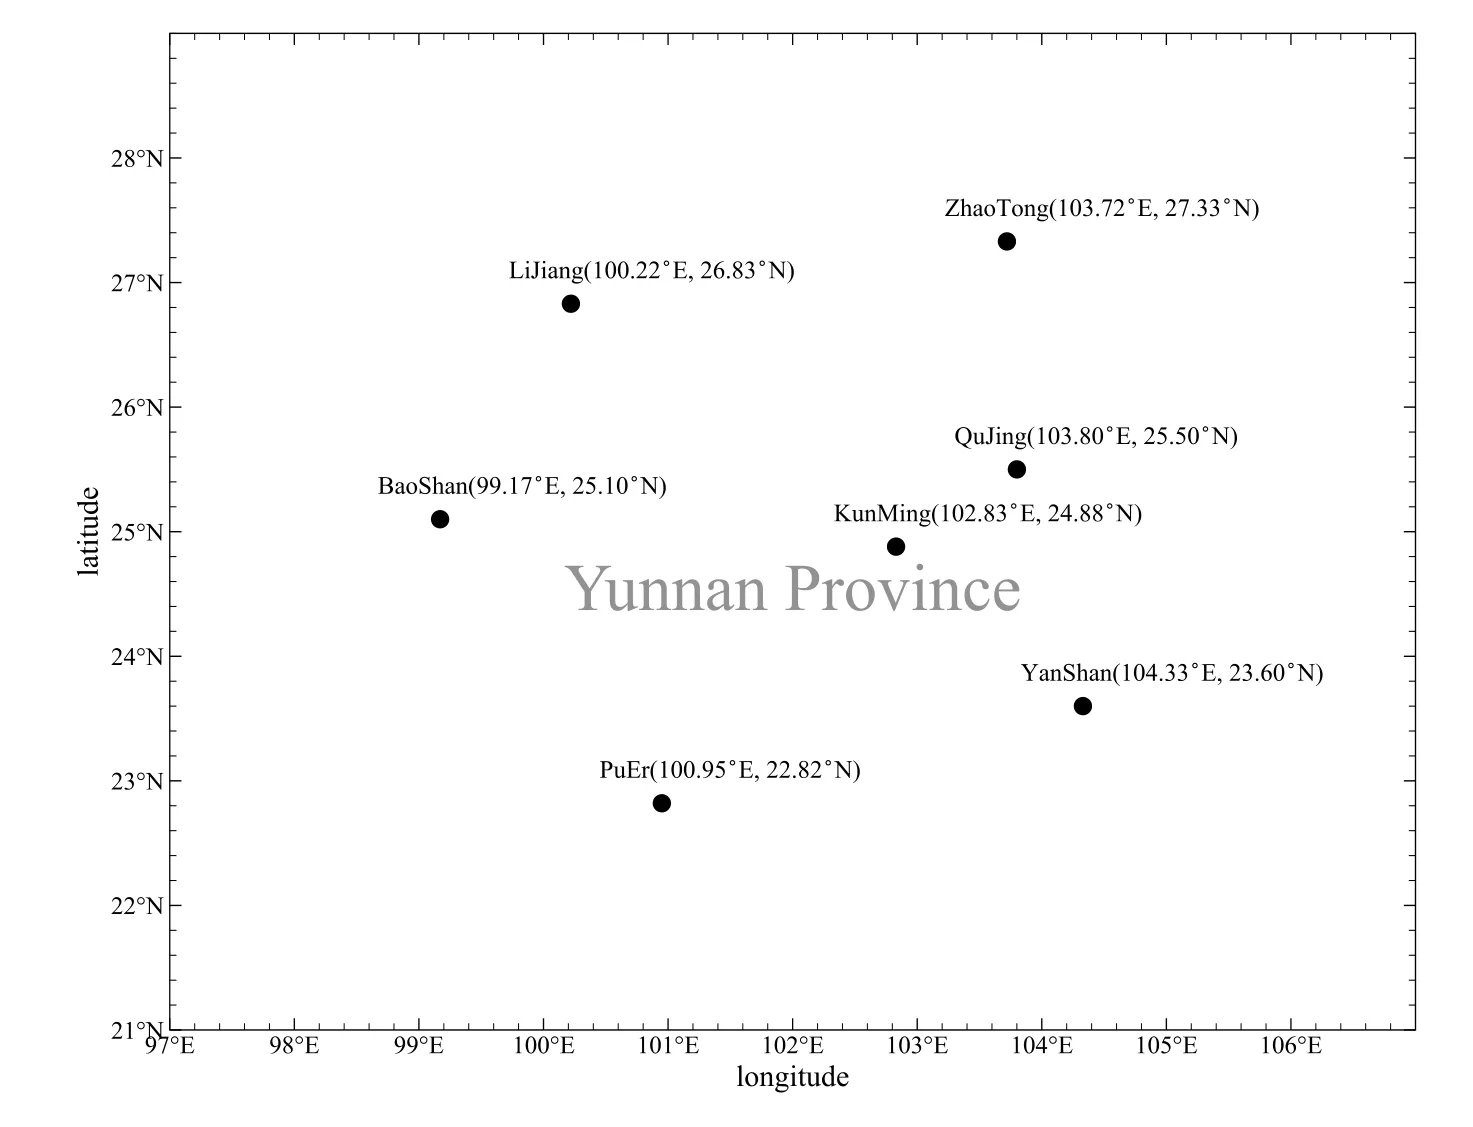
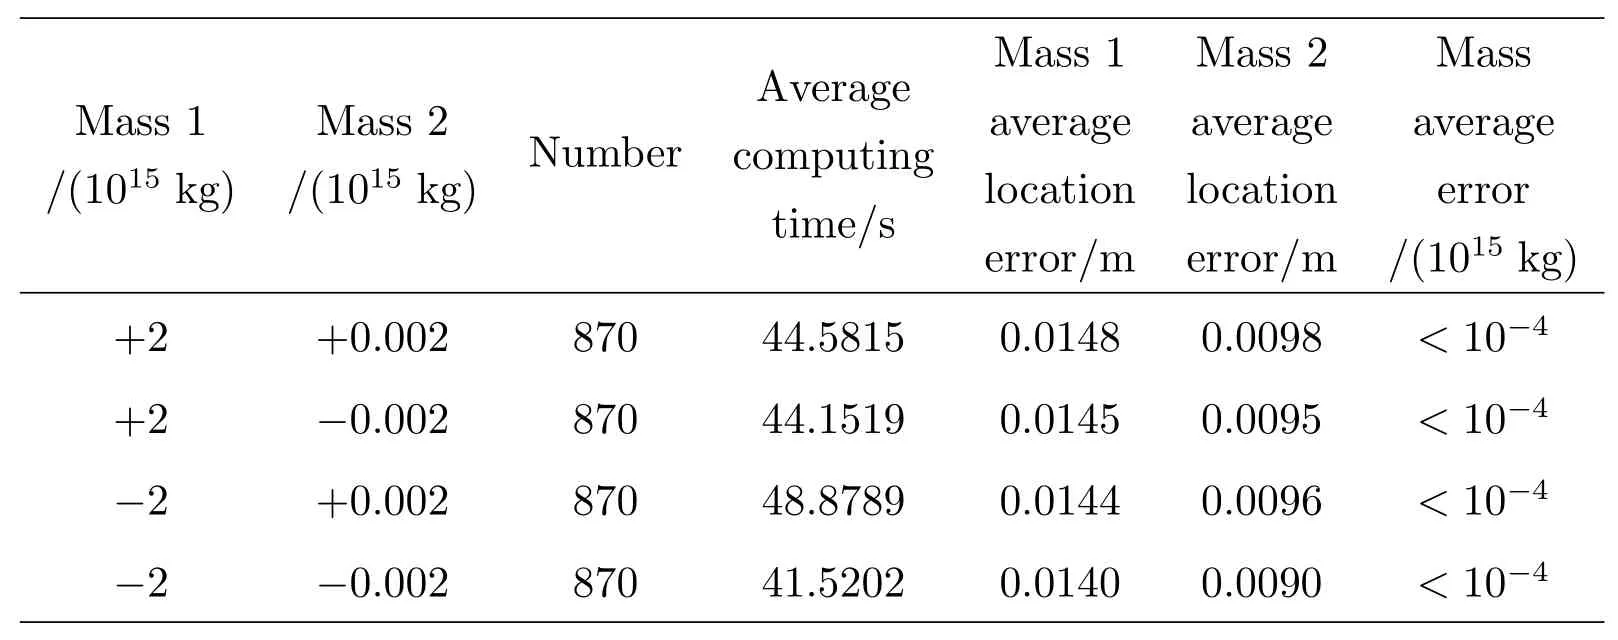
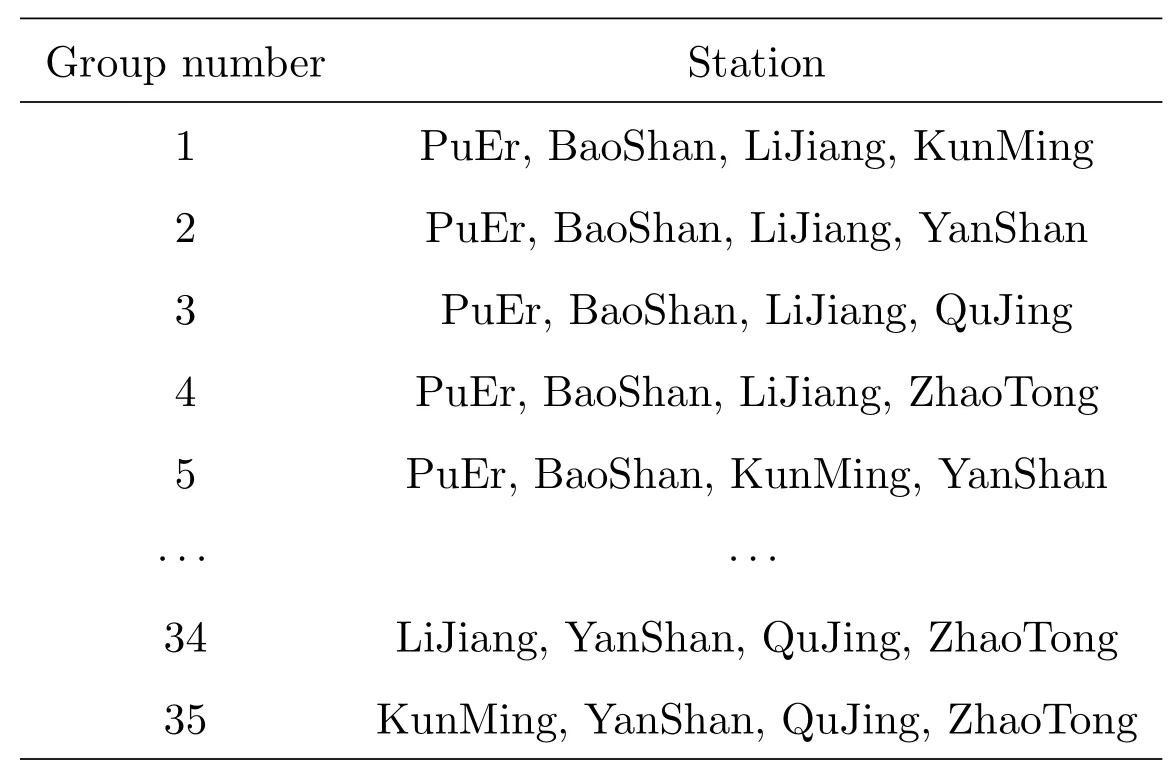
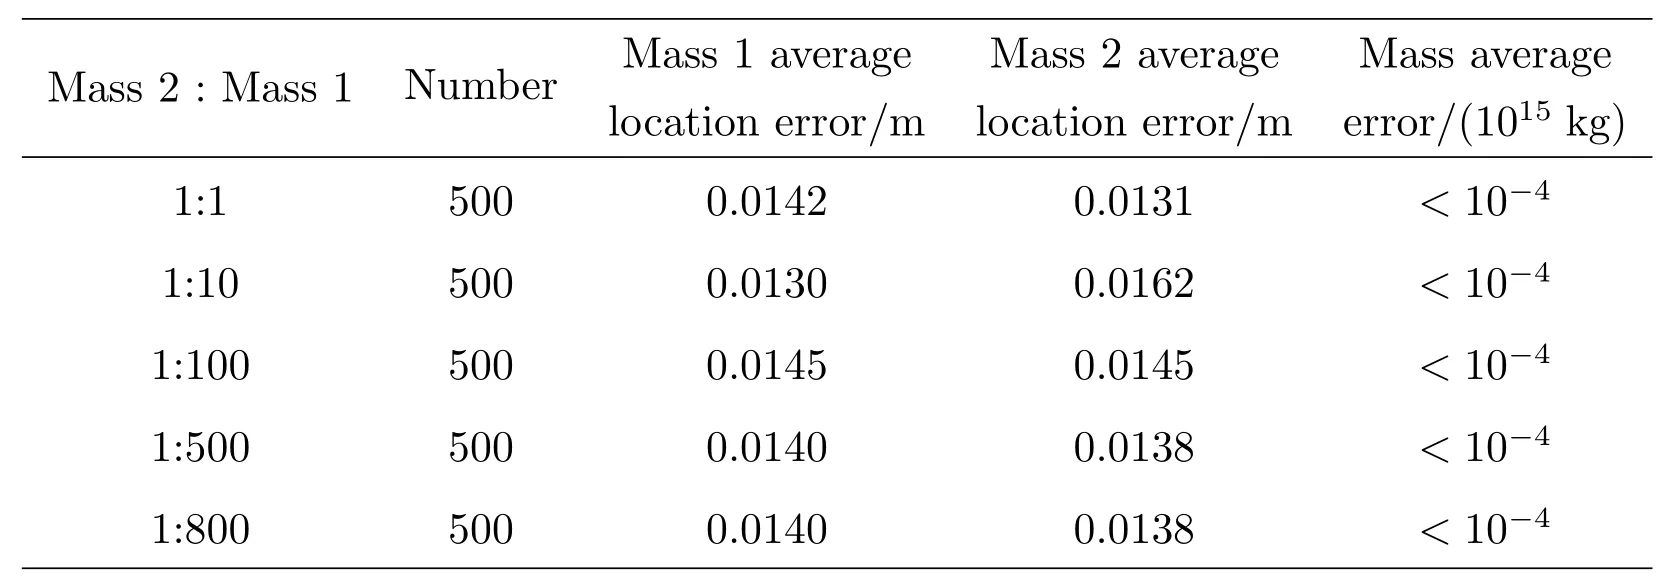
Algorithm 1 Differential Evolutionary algorithm Initialized parameters:C r,F,N P,s←0(s means the number of generations)Initialized population:X={x s1,x s2,···,x sN P}▷x sp is another form of x p(s)while not satisfied exit criteria do for all p∈{1,2,···,N P}do v p←mutiation(F;p,X)u p←crossover(C r;x sp,v p)if f(u p) Table 1 Several DEs It is supposed that a mass anomaly variation zone is relative to the background in the subsurface region of the station(λi,ϕi)(i=1,2,···,m),whereλi,ϕiare the station longitude and latitude respectively,andiis the station number.The parameters of the center of mass are(Λj,Φj,M j,D j)(j=1,2,···,n),wherejis the number of the mass,andΛj,Φj,M j,D jare the longitude,latitude,mass and depth of the mass respectively.We simplify the Earth as a sphere and take the mean radius of the Earth asR⊕.Then,on the large circle of the Earth,the arc length between the station and the projection of the center of mass on the ground︵L i,jcan be obtained from the spherical triangle formula The length of stringL i,jcorresponding to the arcis the distance between station and mass After replacing theLin Eq.(1)with the expression ofL i,jin Eqs.(2)and(3),we can get the relationγbetween the longitude,latitude,depth,mass of thejthmass and the PLV angleθof theithstation Finally,we could get a total PLV angleΘiof theithstation by adding PLV angle vectors from different masses together.In the case of dual-mass model,m=2,and the complete relationΓibetween the parameters of two masses and stations can be obtained If there is an observatory net which makes up withmstations measuring at the same time,we could get a set of nonlinear equations about two mass parameters and the observation data Actually,each equation in Eq.(6)still includes two equations about longitude componentX iand latitude componentY i.has two components too.If considering the depth as a constant andD1=D2,we only need to solve six unknown parameters which include two masses(M1,M2)and two positions(Λ1,Φ1,Λ2,Φ2).In conclusion,we need more than three stations to solve this set of equations. Station simulation:seven virtual stations are set in Yunnan Province which range from 97◦E–107◦E and 21◦N–29◦N as Fig.2 shows.In order to deal with different position distribution of the mass disturbance,we divide 7 stations into 35 groups by way of combination.In other words,the program will use 4 stations in one calculation and the results will be replaced by other groups when they are bad. Fig.2 Stations location map Mass simulation:in the range of Yunnan Province(97◦E–107◦E and 21◦N–29◦N),we start at(97◦E,21◦N)and draw lines every 2◦until reach(107◦E,29◦N).Thus,we can get 30 points of intersection.The 30 nodes will be locations where the two mass disturbances occur.A simple test is conducted and gives some information about masses with different parameters.In this test,several masses are set with different cross section radii,vertical lengths and densities(be written as∆ρ),and the gravity disturbances caused by the center of masses on the ground are calculated as Table 2 shows.The mass with a radius of 100 km not only has a large active range but also can let us to get a proper amount of example.So,after considering the accuracy of instrument and the possible size of mass,we take the 2◦(≈220 km)which is close to the sum of radius of two adjacent masses as the side length of the cell.As for the masses which have a smaller cross section radius,it can also help us to test the model with more subtle masses considering a higher accuracy of instrument.But this is only feasible when we have more computing power or use more efficient algorithms. The mass and mass ratio of the two masses are referenced from the relation between earthquake magnitude and mass disturbance order given by Wang et al.[4].One massM1=±2×10¹⁵kg corresponds to magnitude-8 earthquake,another oneM2=±2×10¹²kg corresponds to magnitude-6 earthquake. Table 2 The information of several masses According to the distribution of underground masses from the gravity data[23–24],the depth of the two masses is set to be 15 km.After getting rid of the overlapping masses pairs,we get 3480 examples for calculation.Then we simulate the databy substituting the examples into Eq.(5)and solve the Eq.(6)with DE. The calculation flow chart is shown in Fig.3. In the initial calculation,the mass ratio of the two masses was set to 1:1000 based on the assumption of correlation between the magnitude of the earthquake and the changing mass of the subsurface material,considering the extremely low possibility of two simultaneous high-magnitude earthquakes in the local area.Table 3 shows the average computing time of different mass combinations and the average errors on location and mass. The results show that dual-mass model can be solved under the current conditions no matter the mass of particles is positive or negative,and the errors of location and mass can be ignored in this work.Actually,some examples have the error to be 0.0947 m.After analyzing,we find that the error is a truncation error from computation.The error corresponds to about 10−8radian or 0.002′′.A specific situation for stations used in computation is as follows:the seven virtual stations including PuEr,BaoEhan,LiJiang,KunMing,YanShan,QuJing and ZhaoTong are divided into 35 groups by the way of combination,and specific situation is shown in Table 4. We do another computation for further research after completing the solution of all 3480 examples.In the computation,we select 500 examples each time and change the mass ratio to be 1:1,1:10,1:100,1:500,1:800 respectively.Both location average errors and mass average errors are calculated and shown in Table 5.Each 500-example group with a specific mass ratio shows that the results fit well with the input data. Table 3 The calculation results of the 3480 examples Table 4 Stations groups situation Table 5 The caculation results of different mass ratios This paper attempts to establish a dual-mass model to simulate the changes of subsurface material when the material aggregation and dissipation are considered,in which DE is used to perform global optimization of the model parameters.The obtained results are in good agreement with the predetermined values.It implies that the multifunctional theodolite we developed can detect the subsurface material migration using the plumb-line deflection under the instrument network observation.The masses under consideration are homogeneous and regular.To obtain further information on the variation of the subsurface material based on the PLV at the station,we need to improve the model: (1)Density distribution could vary with the depth and horizontal position relative to instrument; (2)The shape of the mass can also be combined using multiple regular geometries depending on the geological and geographical conditions of the studied area; (3)Both 1 and 2 are extended to the inhomogeneity and irregularity of the model,which also means that the calculation of a single mass parameter could not represent the location of the mass and its influence on the surrounding gravity field.Perhaps we should consider dividing the mass into regions and then calculate the center of mass separately in a combined manner in future. The above points are only some preliminary ideas to improve the model,and any changes are to describe the real changes of subsurface material accurately,so we still need actual data to verify and judge.At present,the astronomical survey network has not been established,there are still difficulties in obtaining data.We need to seek some help from the field of geology,to make up for the lack of data on astronomical methods. For a more complex model,more sophisticated algorithms are needed to solve it.When the model is modified in a three-dimensional,the simple calculations will be replaced by integration or superposition,regardless of whether the effect of the gravity field on the surrounding point is continuous or discrete,to cause a significant increase in computational effort.Astronomical instruments are capable of producing data every clear night,the speed of computation becomes a critical presentation of results.Therefore,we need to improve the current algorithm for the new model. AcknowledgementsWe deeply appreciate the reviewers for their meticulous considerations which make this paper more substantial and rigorous.We also thank the editor for the patience and carefulness.Thanks Dr.CHEN Dong for providing highperformance computer for us.Special thanks go to Dr.MAO Ji-rong for the attentive check on vocabulary and grammar.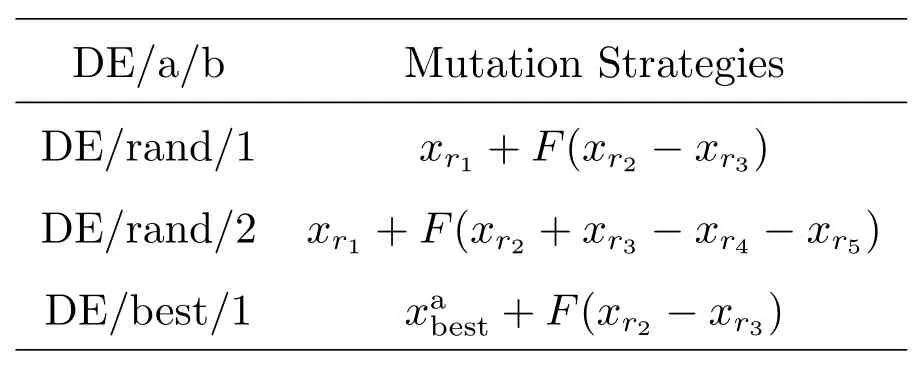
3 Dual-Mass Model


4 Result
5 Conclusion