FAST Continuum Mapping of the SNR VRO 42.05.01
2022-05-24LiXiaoMingZhuXiaoHuiSunPengJiangandChunSun
Li Xiao ,Ming Zhu ,Xiao-Hui Sun ,Peng Jiang ,and Chun Sun
1 National Astronomical Observatories,Chinese Academy of Sciences,Beijing 100101,China;xl@nao.cas.cn
2 CAS Key Laboratory of FAST,National Astronomical Observatories,Chinese Academy of Sciences,Beijing 100101,China
3 Department of Astronomy,Yunnan University,and Key Laboratory of Astroparticle Physics of Yunnan Province,Kunming 650091,China
Abstract The relativistic electrons rotate in the enhanced magnetic field of the supernova remnants and emit the synchrotron radio emission.We aim to use the Five-hundred-meter Aperture Spherical radio Telescope (FAST) to obtain a sensitive continuum map of the supernova remnant VRO 42.05.01 (G166.0+4.3) at 1240 MHz.The 500 MHz bandwidth is divided into low and high-frequency bands centered at 1085 and 1383 MHz to investigate the spectral index variations within the remnant,together with the Effelsberg 2695 MHz data.We obtained an integrated flux density of 6.2±0.4 Jy at 1240 MHz for VRO 42.05.01,consistent with previous results.The spectral index found from temperature-temperature plot (TT-plot) between 1240 and 2695 MHz agrees with previous values from 408 MHz up to 5 GHz.The three-band spectral index distribution shows a clear flatter value of α~-0.33 in the shell region and steeper index of α=-0.36 to -0.54 in the wing region.The flatter spectral index in the shell region could be attributed to a second-order Fermi process in the turbulent medium in the vicinity of the shock and/or a higher compression ratio of shock and a high post-shock density than that in elsewhere.
Key words:ISM:supernova remnants–radio continuum:ISM–methods:observational
1.Introduction
Supernova explosions inject in excess of 1050erg kinetic energy into the interstellar medium (ISM).The strong shock generated by supernova remnants (SNRs) heat and compress the surrounding gas medium.The shock accelerated relativistic particles rotate in the enhanced magnetic field to emit nonthermal radio/gamma-ray synchrotron radiation(Blandford&Eichler 1987;Park et al.2015).Therefore,continuum observations of SNRs are important to reveal the properties of the shocked ambient ISM and probe the acceleration process in different regions.
VRO 42.05.01 (G166.0+4.3) is a shell-type SNR with a peculiar morphology,consisting of a semicircular “shell”,and a triangular“wing”structure(denoted in Figure 5).It has been classified as a mixed-morphology supernova remnant,characteristic of center-filled thermal X-ray emission(Rho &Petre 1998),and extensively studied at various wavelengths(see Arias et al.2019a for a recent review).Its distance is reconfined to 1.0±0.4 kpc by molecular gas observations using the Galactic rotation curve(Arias et al.2019a).The age estimated from the X-ray spectra of ionizing plasma will be rescaled to about 7000 yr(Matsumura et al.2017;Leahy et al.2020).Though molecular line observations in the west and north regions show no sign of interaction with nearby molecular clouds,interaction probably happens in features in the wing shell as indicated by infrared emission(Arias et al.2019a).A dust sheet that crosses the SNR in the interface is probably responsible for the double shell-shaped morphology.
The radio continuum emission of VRO 42.05.01 has been observed from low frequency to high frequency(Leahy &Tian 2005;Gao et al.2011;Arias et al.2019b).The radio spectrum has a flat overall spectral index of α=-0.37(Kothes et al.2006).The spectral index between 408 and 1420 MHz shows a spatial variation that it is steeper in the wing region than elsewhere(Leahy &Tian 2005),indicating different compression ratio shock.The LOFAR observation also shows a curvature of steeper index in the low-frequency end of the radio spectrum for the bright“shell”and“wing”regions,while the diffuse “wing” regions present a roughly constant powerlaw behavior between 143 MHz and 2695 MHz(Arias et al.2019b).
In this paper,we present the continuum observations of VRO 42.05.01 with Five-hundred-meter Aperture Spherical radio Telescope (FAST) from 1050–1450 MHz.FAST is located at a geographic latitude of 25°39′106 with an observable maximum zenith angle of 40° (Jiang et al.2020)and has achieved scientific achievements in several areas(Qian et al.2020).The 19 beam receiver of the FAST with a wide band coverage of 500 MHz enables it powerful to investigate the variation of the spectral index both in space and in frequency with a good sensitivity.This paper organizes as follows.The observations and data reduction are described in detail in Section 2.The results of flux density and spectral index combined with Effelsberg 2695 MHz map are presentedin Section 3.In Section 4,we give discussions.Conclusions are summarized in Section 5.
2.Data Reduction
2.1.Observations and Imaging
The FAST continuum observations of VRO 42.05.01 were conducted twice using the 19 beam L-band receiver in 2020 April and 2021 February,respectively.We use multibeam onthe-fly mode to scan the target along either R.A.or decl.direction (R.A.+decl.direction at a time) with a telescope scan velocity of 15″s-1.The map is centered at α2000=with a size of 2°×2°.The pointing accuracy is better than 16″(Jiang et al.2019).3C138 is observed as the calibrator.The spectral backend with a 65,536 channel covering the 1000–1500 MHz band was used to collect data.Each channel has a bandwidth of 7.6 kHz.A sampling rate of one second is adopted.A noise signal with an amplitude of 10 K was injected under a period of two seconds for intensity calibration.Four pol data was also recorded and under analysis (in preparation).The observation parameters are summarized in Table 1.
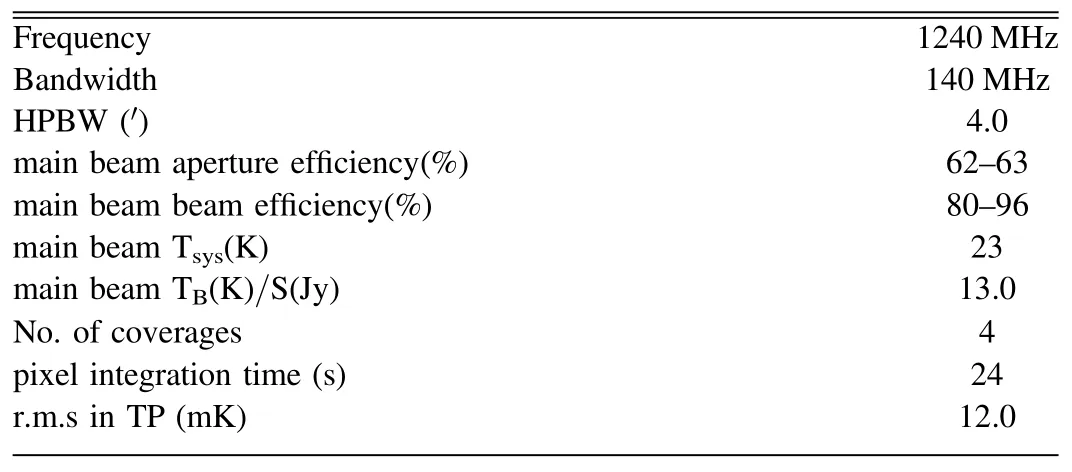
Table 1 Observational Parameters
After intensity calibration,the baselines for Stokes I were corrected by subtracting a linear fit of the edge of each scan to remove the smooth increase of background emission toward the Galactic plane.Bad data caused by the satellite(1160–1280 MHz)and other radio frequency interference(RFI)that cause bad baselines were masked.The actual useful bandwidth is approximately~140 MHz.The data were gridded with a Gaussian function kernel to produce a data cube(Mangum et al.2007).The half-power beamwidth(HPBW) of each channel decreases with the increase of frequency(Jiang et al.2020).To derive the main beam bright temperature,the value of each channel was corrected by dividing the main beam efficiency (ηb),which is calculated from the HPBW of the current channel(Sun et al.2021).Then channel maps at different frequencies were smoothed to a common 4′ angular resolution and averaged to form the combined map.These processes were mainly carried out by python codes and packages.
The in-band spectra toward two pixels are shown as examples in Figure 1,which are binned for every 20 channels with a bandwidth of 15.2 MHz per channel to lower the noise(for maps with a typical r.m.s of 500 mK).The binned FAST cube has been convolved to the same angular resolution of 4′.3 of Efflesberg 2695 MHz data,which is also plotted as a reference.The in-band spectra(the brightness temperature(Tb)versus the frequency (ν)) fit well to a power-law function.Accurate temperature spectral index after suppressing the scanning effects and adjusting baselevels of maps is presented in Section 3.
Finally,we suppressed scanning effects for the intensity maps (Stokes I) by applying the “unsharp masking” method described by(Sofue &Reich 1979).All four total intensity maps (2R.A.+2decl.) were combined together using the PLAIT-algorithm(Emerson&Graeve 1988).To derive the flux density,we use a relevant main beam gain of 13.3 K Jy-1at 1.24 GHz,scaled from the 16.0 K Jy-1to the 4′resolution(Jiang et al.2020).As the gain of each beam slightly varies and has a different linear relation versus frequency(Sun et al.2021),we calculated the standard deviation of the gains for 19 beams at each frequency,and adopt the maximum 5% at the highest frequency end as the error.
2.2.Comparison with the Effelsberg 21 cm Data
VRO 42.05.01 has been observed at 1408 MHz in the Effelsberg 21 cm Galactic plane survey in total intensity(Reich et al.1990).It has a bandwidth of 20 MHz and an angular resolution of 94.It has also been observed in CGPS 1420 MHz survey(Taylor et al.2003).VRO 42.05.01 presents a substantial amount of diffuse emission slightly larger than 1°scales in the wing region as shown in Figure 2.While the CGPS samples baselines correspond to scales of1420 MHz,we compare the FAST result with the Effelsberg 21 cm map.
To avoid the influence of lacking of data in the blank RFI zone,the FAST 500 MHz bandwidth is divided into two parts centered at 1085,1383 MHz,respectively.We smoothed each total intensity map to theresolution of the Effelsberg 21 cm map,and made a temperature—temperature plot (TT-plot)comparison of each pixel value(Figure 3).TT-plots of the two maps show the same slope,and the value in 1383 MHz agrees well with the Effelsberg 21 cm data along a diagnosis line.We also checked the positions and compared the flux density of the four bright extra-galactic point sources in the vicinity of VRO 42.05.01 with the NVSS catalog (Condon et al.1998).Their in-band spectral indices have values of 0.7–0.8,typical for extra-galactic sources.

Figure 1.The FAST in-band spectra toward two pixels as labeled in Figure 5 together with the Effelsberg 2695 MHz data.The binned cube has been convolved to the same angular resolution of 4 3 at 2695 MHz.
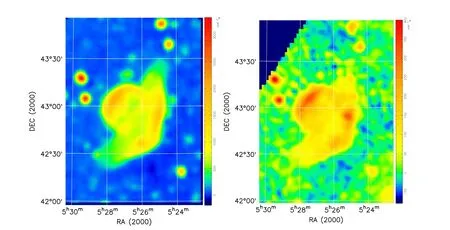
Figure 2.Left:The full bandwidth FAST total intensity map of VRO 42.05.01 at a central frequency of 1240 MHz.The image has an angular resolution of 4′.The semicircular“shell”and triangular“wing”structure are well defined.Right:The Effelsberg 2695 MHz total intensity map of VRO 42.05.01 with an angular resolution of 4 3.
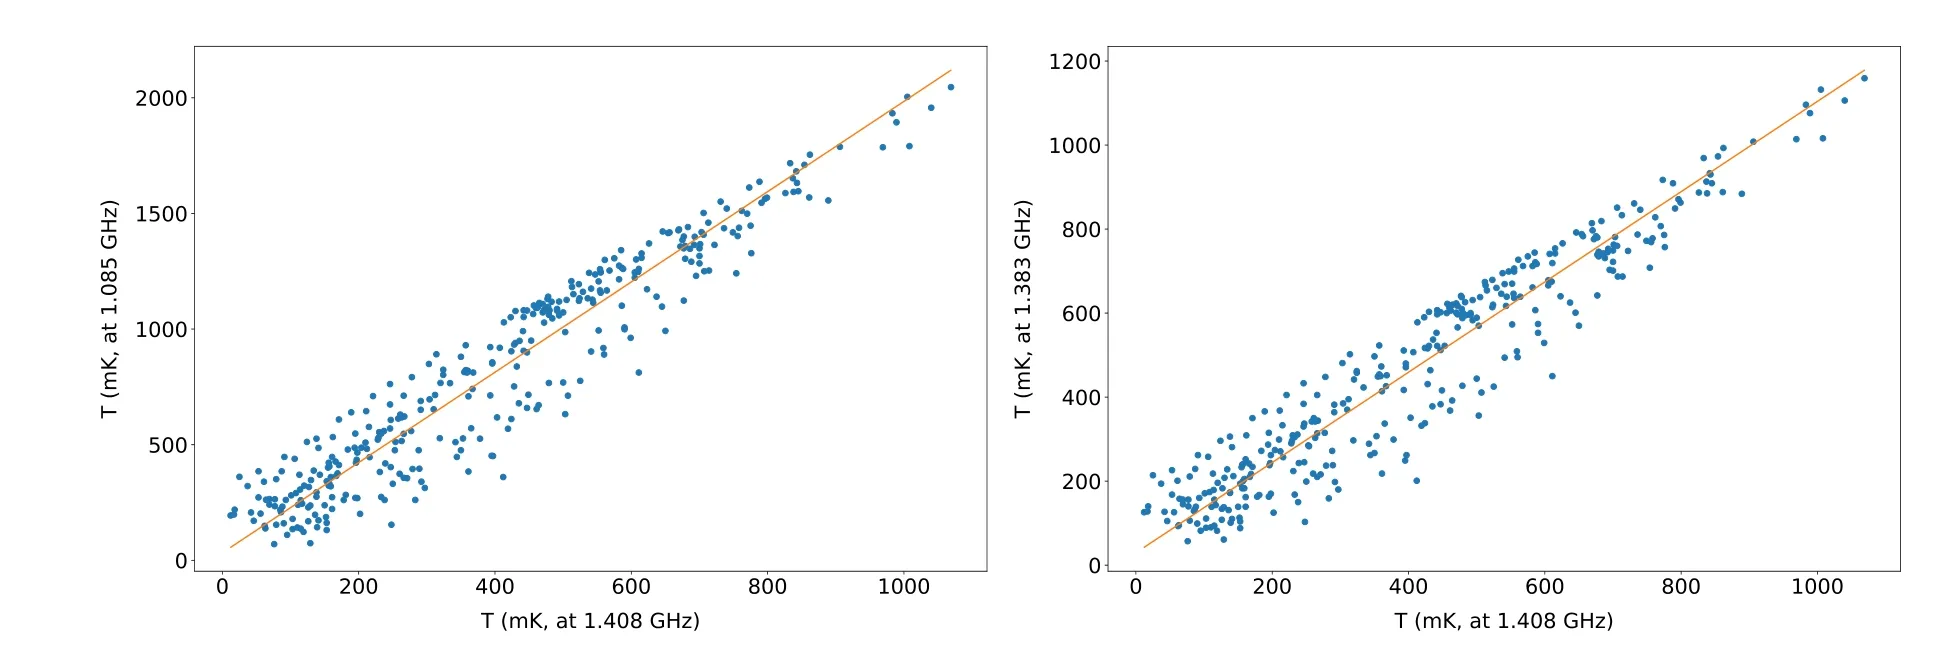
Figure 3.TT-plots of FAST total intensity map of VRO 42.05.01 centered at 1085 MHz and 1383 MHz with the Effelsberg 1408 MHz map.Both TT-plots show the same slope.The values at two frequencies in the right TT-plot agrees well along a diagnosis line.
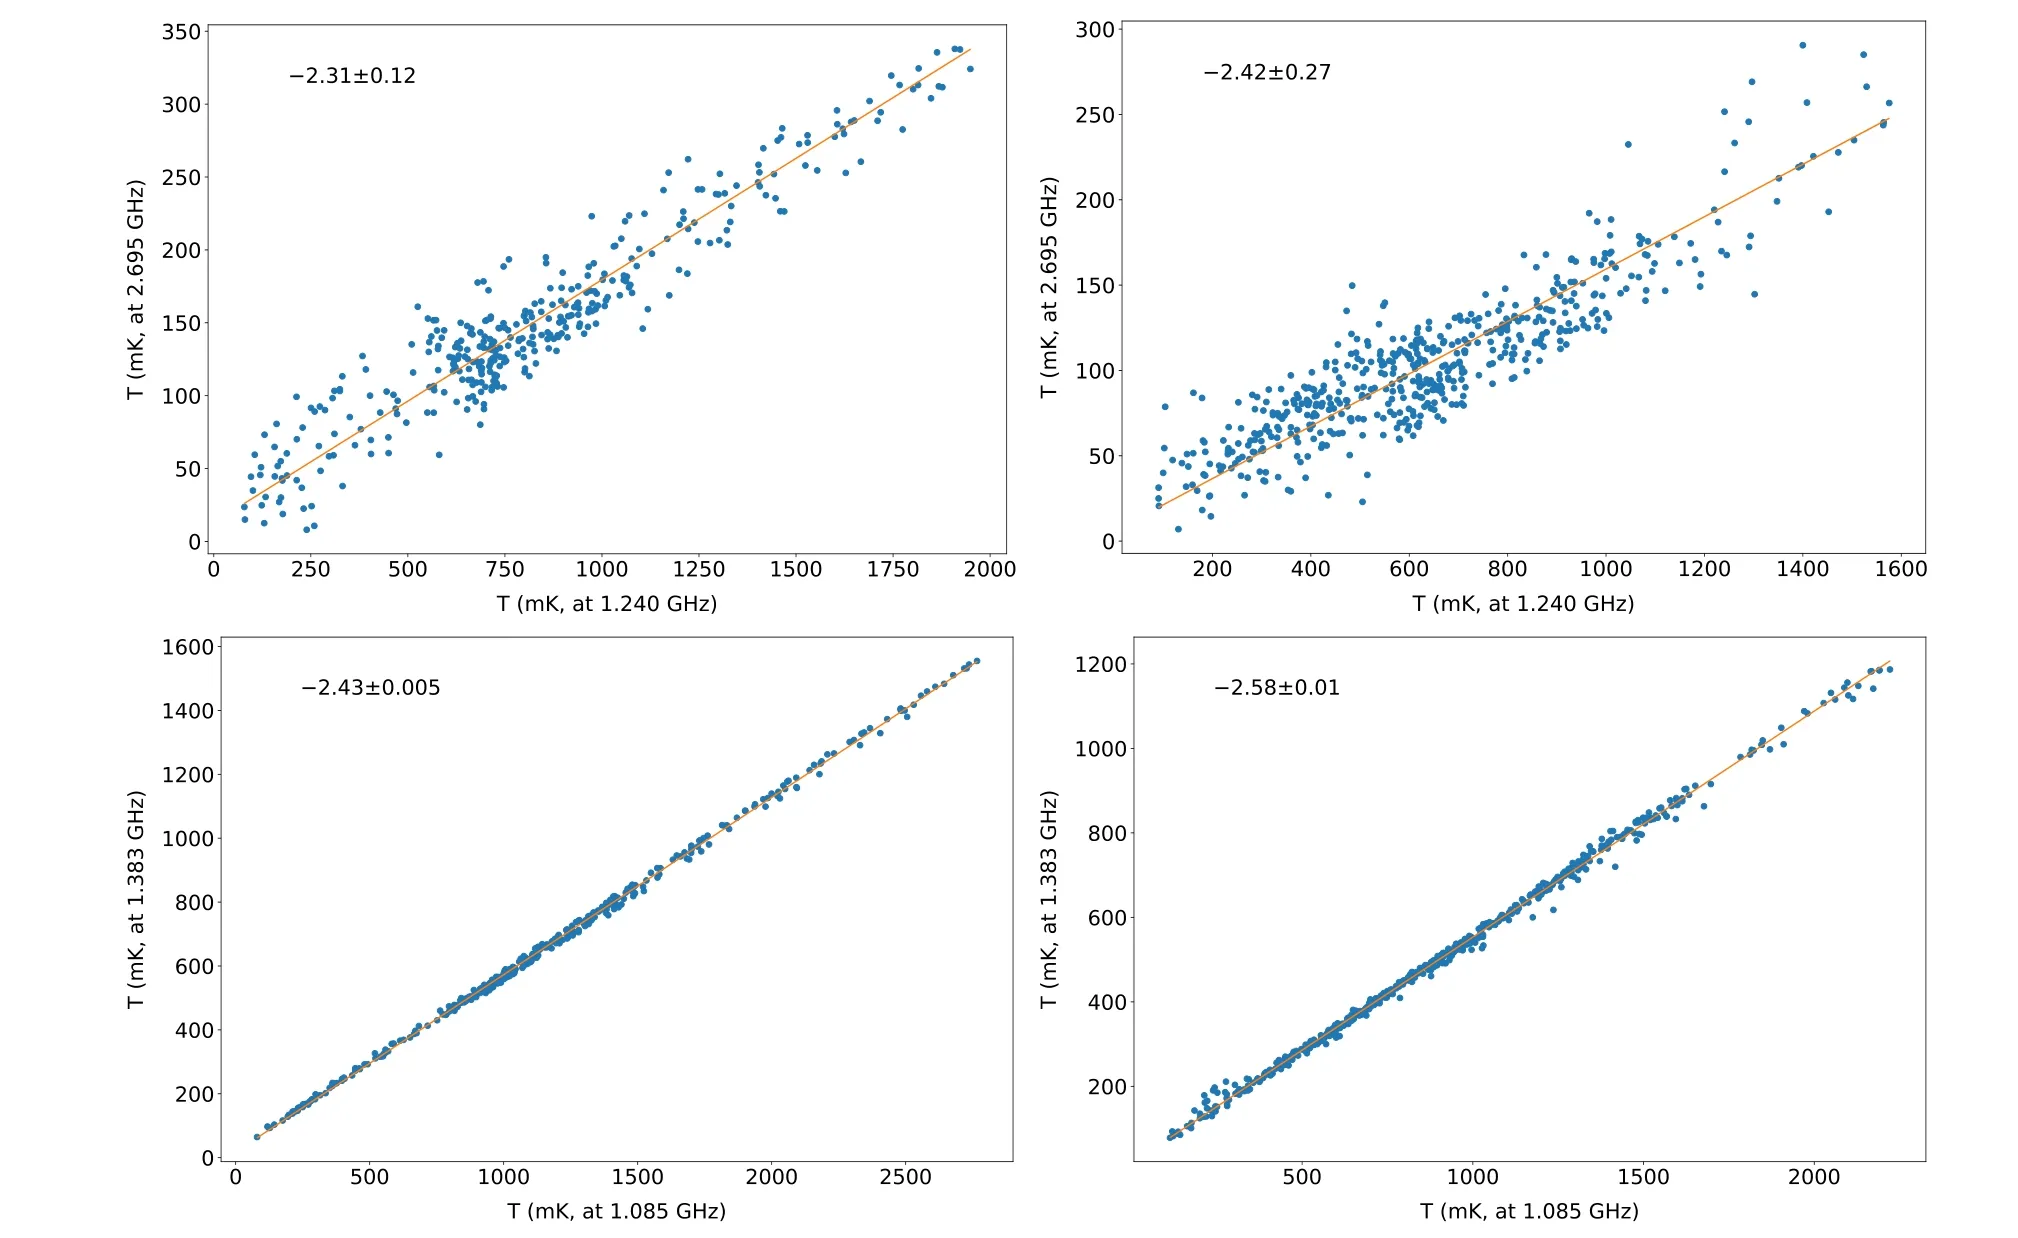
Figure 4.TT-plots for the shell (left) and the wing (right) region of VRO 42.05.01 between 1240 and 2695 MHz (upper panels),and between FAST 1085 and 1385 MHz (lower panels).
3.Results
3.1.Flux Density
The FAST full bandwidth total intensity map of VRO 42.05.01 is shown in Figure 2.The semicircular “shell”and triangular “wing” structure are well defined with extragalactic sources embedded in the diffuse emission.The r.m.snoise measured from no emission areas in the maps is 12.0 mK TB.
The large-scale background emission toward this region at 1240 MHz is adjusted by the TT-plot in Section 3.2(50 mK TB)and then subtracted.The integrated flux densities are directly obtained by setting polygons just outside the periphery of the SNR and integrating the emission enclosed.Then it is converted to the flux density by dividing an average main beam gain value of 13.3 K Jy-1at different frequencies.The variations of gain of each beam are considered into a 5%error.Four bright extra-galactic sources embedded in the wing area of the source are subtracted by comparison with the NVSS catalog.From variations outside the SNR,we estimate a remaining uncertainty in the base-level setting of 5 mK TB.With estimated 5% uncertainties in calibration,we obtained integrated flux densities of 6.2±0.4 Jy at 1240 MHz.The flux density is consistent with the value of 5.2 Jy(Leahy &Tian 2005) and 6.0 Jy at 1420 MHz(Landecker et al.1982).
3.2.TT-plot Spectral Analysis
We use the 2695 MHz map from the Effelsberg 11 cm survey in the direction of the Galactic anticenter(Fürst et al.1990) to investigate the spectral index variations within the SNR between two frequencies.The FAST total intensity map is smoothed to theresolution of the 11 cm Effelsberg map.The TT-plot method is used to investigate the spectrum of distinct emission structures independent of a consistent baselevel setting of both maps.
We applied this method for the shell and wing sections of VRO 42.05.01,respectively.The TT-plot results between the 1240 and 2695 MHz data are shown in Figure 4.The data is fitted twice,alternately taking the data of one of the two frequencies as the independent variable,to obtain the error.In order to reveal the distinct index properties of the two regions,TT-plot results between FAST low and high frequency 1083 MHz and 1385 MHz are also plotted.A clear temperature-temperature relation is seen in all cases.The temperature spectral index β (Sν∝να,α=β+2) found from fitting the slope is β21/11=-2.31±0.12 for the shell section andβ21/11=-2.42±0.27 for the wing section,respectively.The error of β of the diffuse western part of the wing region is large,probably due to its weak emission and confusion with weak unresolved background sources,which could not be subtracted.The spectral index in the wing section is steeper than that in the shell section,and is slightly larger than the spectral index of the integrated spectrum within the errors.Compared with previous TT-plot values,there is no variation of the indices in both shell and wing region in the frequency domain from 408 MHz up to 5 GHz (Table 2).
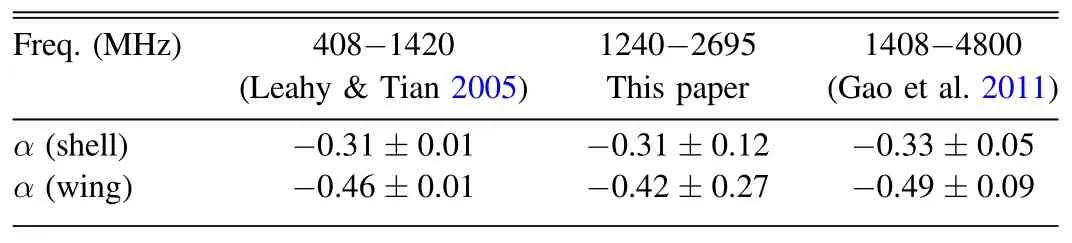
Table 2 TT-plot Spectral Index
3.3.Spectral Index Distribution
The low and high-frequency bands centered at 1085,1383 MHz has sufficient span in frequency.We used the brightness temperatures at these two frequencies and Effelsberg 2695 MHz data to calculate a three-band spectral index map by fitting a power law for each pixel of VRO 42.05.01 (Figure 5).The four extra-galactic sources embedded in the wing area of the source are also subtracted from both maps,and the large-scale background baselevels at 1085,1383 MHz are adjusted and subtracted by about 80,40 mK TB.While the background baselevels at 2695 MHz are twisted and added by 7 mK TB.The background emission outside the source is excluded from the fitting by setting a lower intensity limit.
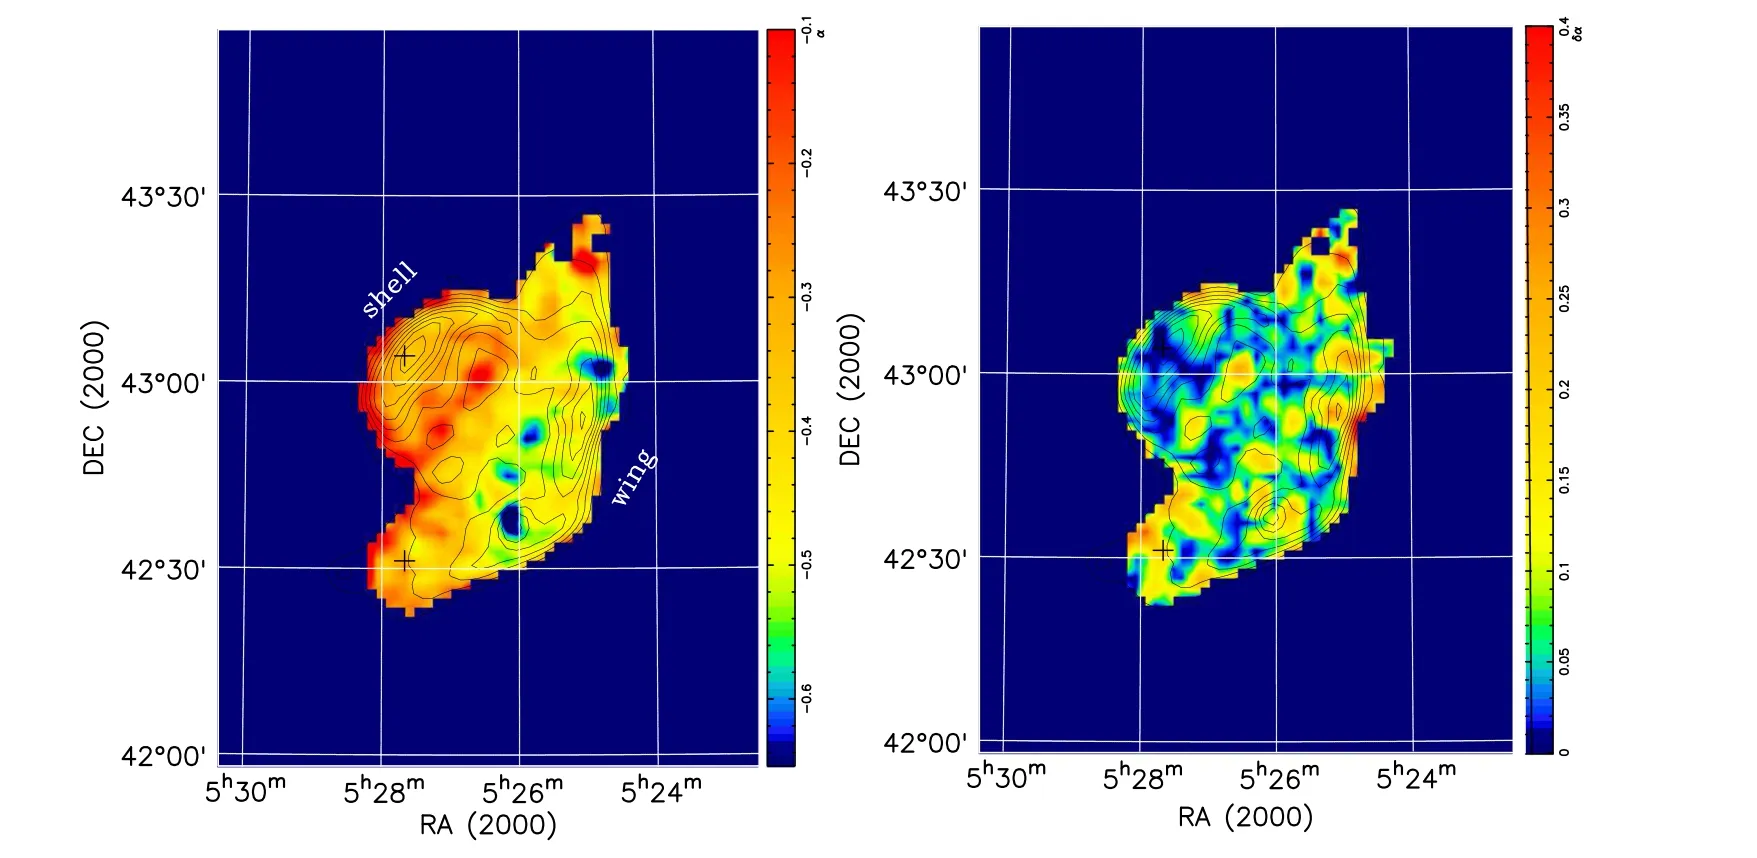
Figure 5.The three-band spectral index map (left) and error map (right) of VRO 42.05.01 (1085-1383-2695 MHz).The overlaid contours show total intensities at 1240 MHz.The pixels used to show the in-band spectra in Figure 1 are marked by pluses.
The spectral index map obtained with single-dish telescopes does not suffer from the missing flux problem.The different indices mainly distribute in three subregions.The semicircular shell region has a spectral index of α~-0.33,while the wing region shows a steeper spectrum of α=-0.36 to -0.54.This is consistent with the values obtained from TT-plots.Possible remaining variations of the base-levels at three bands cause a systematic uncertainty of the spectral indices of Δ α=0.06.The uncertainty is largest where the total intensity is small.The point-like variations correspond to the uncertainty of subtraction of extra-galactic sources.Besides,there is a spectral flattening toward the boundary of the shell and wing region of α~-0.18 with a relatively large error,which needs to be further confirmed.
4.Discussion
The variation of spectral index in SNRs is generally considered related with physical conditions changes with position.In this section,we briefly discussed possible explanations of the flat spectral index in the shell of VRO 42.05.01.
The linear diffusive shock acceleration (DSA) theory predicts that the electron energy index p only depends on the shock compression ratio χ (the ratio of postshock to preshock densities),and is independent of energy(Blandford&Eichler 1987).For a strong adiabatic shock,the compression ratio is χ=4,corresponding to a radio spectral index α of 0.5.Lower Mach number reduces the compression ratio and leads to steeper electron synchrotron spectra.
However,as reviewed in Onić (2013),there are several mechanisms to cause a flat radio spectra (<0.5) in SNRs.(1)Second-order Fermi (stochastic) acceleration.When the magnetized gas has an Alfvén speed non-negligible in comparison to the shock velocity,the second-order Fermi process in the turbulent medium can modify the energy spectrum of the particles and generate a flat particle distribution(Ostrowski 1999).For VRO 42.05.01,Onić(2013) has calculated that a low plasma value around 0.05 in the case of compression ratio of 3.9 and constant spatial diffusion coefficient can obtain an spectral indices of 0.33(Gao et al.2011).
(2)High compression ratios of shocks.When the remnant enter into the radiative phase,energy loss became significant.A high compression ratio can be achieved for an isothermal shock with modest Mach numbers as the square of the Mach number,χ=γM2,where γ is the ratio of specific heat of the medium(Draine 2011).It produces a flatter radio spectral index asThis scenario is favored to explain the spatial spectral index variation in Leahy &Tian (2005) and the steepening of spectral index of VRO 42.05.01 at low frequencies in Arias et al.(2019b).
(3)secondary electrons from the decay of neutral pions.For mixed-morphology supernova remnants,the re-acceleration of pre-existing cosmic-rays by DSA power the observed γ-ray emission through the decay of neutral pions,while the secondary electrons can create a flat-spectrum electron population and mainly contribute at lower radio frequencies(Uchiyama et al.2010).As no molecular gas has been found in the northern part(Arias et al.2019a),it remains to be checked for further molecular observations to cover other regions.
Various works suggested that VRO 42.05.01 has evolved into an inhomogeneous medium with different densities in the shell and wing region,which cause the peculiar morphology(Pineault et al.1987;Landecker et al.1989;Burrows &Guo 1994;Matsumura et al.2017).Though new H I observations show no clear shell features related with the remnant(Arias et al.2019b),the coincidence of the boundary of the shell and wing with the edge of a large polarized bubble structure(Kothes &Landecker 2004) gives a hint that such environment might have been affected by an old SNR.As the flat spectral index region appears to have excess optical Hαemission,delineating positions of cooling post-shock ISM gas,we suggest that scenarios (1) and (2) are both possible.
5.Summary
Summing up,we used the FAST radio telescope to obtain a sensitive continuum map of SNR VRO 42.05.01 at 1240 MHz.We obtained an integrated flux density of 6.2±0.4 Jy at 1240 MHz for VRO 42.05.01,consistent with previous results.The spectral index found from TT-plot with the Effelsberg 2695 MHz map is α21/11=-0.31±0.12 for the shell section and α21/11=-0.42±0.27 for the wing section,respectively,agrees with previous TT-plot values from 408 MHz up to 5 GHz.The three-band spectral index map made by maps centered at 1085,1383 and 2695 MHz shows a flatter index of α~-0.33 in the shell region and a steeper index of α=-0.36 to -0.54 in the wing region.The flatter spectral index in the shell region could be attributed to a second-order Fermi process in the turbulent medium in the vicinity of the shock and/or a higher compression ratio of shock and a high post-shock density than that in elsewhere.
Acknowledgments
We thank the anonymous journal referee for the valuable comments to improve the paper.We acknowledge support from the National Key R&D Program of China (2018YFE0202900)as well as the early science Project Program of the Key Laboratory of FAST.We thank Prof.Wang Jie for the open python code package of the data reduction pipeline for reference,and thank the help from FAST colleagues for using the server.
ORCID iDs
杂志排行
Research in Astronomy and Astrophysics的其它文章
- Estimation of HII Bubble Size Distribution from 21cm Power Spectrum with Artificial Neural Networks
- Influence of Megaregolith on the Thermal Evolution of Mercury’s SilicateShell
- Common Envelope to Explosion Delay time Distribution (CEEDTD) of Type Ia Supernovae
- V0644 Ser:An Active Ultrashort Period Contact Binary Star
- Hypercritical Accretion for Black Hole High Spin in Cygnus X-1
- Physical Properties of 29 sdB+dM Eclipsing Binaries in Zwicky Transient Facility