Development of a compact torus injection system for the Keda Torus eXperiment
2022-05-05ChenCHEN陈晨TaoLAN兰涛ChijinXIAO肖持进GeZHUANG庄革DefengKONG孔德峰ShoubiaoZHANG张寿彪SenZHANG张森WeixingDING丁卫星ZhengweiWU吴征威WenzheMAO毛文哲JieWU吴捷HangqiXU许航齐JiarenWU邬佳仁YimingZU祖一鸣DongZHANG张栋ZianWEI卫子安XiaohuiWEN温晓辉ChuZHOU周楚
Chen CHEN (陈晨), Tao LAN (兰涛), Chijin XIAO (肖持进),2,,Ge ZHUANG (庄革), Defeng KONG (孔德峰), Shoubiao ZHANG (张寿彪),Sen ZHANG (张森), Weixing DING (丁卫星), Zhengwei WU (吴征威),Wenzhe MAO (毛文哲), Jie WU (吴捷), Hangqi XU (许航齐), Jiaren WU (邬佳仁),Yiming ZU (祖一鸣), Dong ZHANG (张栋), Zian WEI (卫子安),Xiaohui WEN (温晓辉), Chu ZHOU (周楚), Ahdi LIU (刘阿娣), Jinlin XIE (谢锦林),Hong LI (李弘) and Wandong LIU (刘万东)
1 Department of Plasma Physics and Fusion Engineering,University of Science and Technology of China,Hefei 230026, People’s Republic of China
2 Department of Physics and Engineering Physics,University of Saskatchewan,Saskatoon SK S7N 5E2,Canada
3Institute of Plasma Physics, Chinese Academy of Sciences, Hefei 230031, People’s Republic of China
Abstract A compact torus injection system, KTX-CTI, has been developed for the planned injection experiments on the Keda Torus eXperiment(KTX)reversed field pinch(RFP)device to investigate the physics and engineering issues associated with interaction between a compact torus (CT)and RFP.The key interests include fueling directly into the reactor center, confinement improvement,and the injection of momentum and helicity into the RFP discharges.The CT velocity and mass have been measured using a multichannel optical fiber interferometer,and for the first time the time evolution of the CT density profile during CT propagation is obtained.The effects of discharge parameters on the number of injected particles,CT velocity and CT density have been characterized:the maximum hydrogen CT plasma mass, m CT ,is 50 μg, corresponding to 30% of the mass in a typical KTX plasma; the CT velocity exceeds 120 km s-1.It is observed for the first time that multiple CTs can be produced and emitted during a very short period(<100 μs)in one discharge,which is significant for the future study of repetitive CT injection,even with an ultra-high frequency.
Keywords: compact torus injection, central fueling, reversed field pinch
1.Introduction
A compact torus(CT)is a donut-shaped plasmoid confined by nested helical magnetic field lines surrounding the torus,similar to the field line structure in a spheromak plasma [1].The toroidal and poloidal magnetic field components of similar magnitudes are induced entirely by the helical plasma current flowing in the plasma itself.The CTs are usually formed in a magnetized coaxial Marshall gun, similar to the RACE device[2].Using CTs to directly fuel the magnetically confined fusion reactors was first proposed by Perkins et al[3] and Parks [4] in 1988 and demonstrated in the TdeV tokamak [5].The basic requirement for fueling a tokamak core can be expressed by the following expression
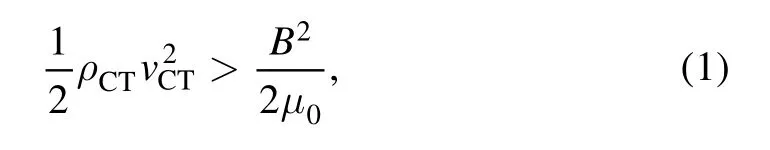
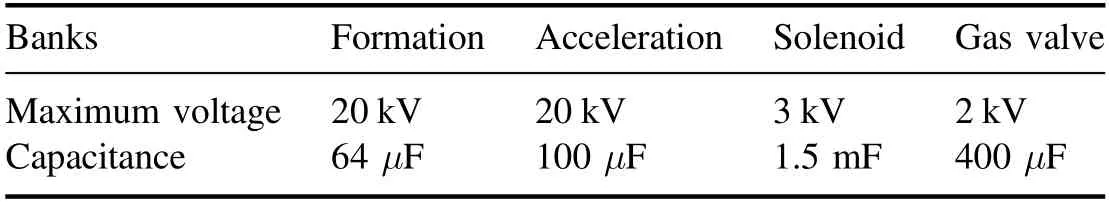
Table 1.List of capacitor bank parameters for formation, acceleration, solenoid and gas valve circuits.
whereρCT,vCTand B correspond to the CT mass density,velocity and tokamak magnetic strength at the desired CT penetration position.Since CT is a well confined and highdensity entity,it can be accelerated to a very high velocity in the range of hundreds of kilometers per second, and even up to 1000 km s-1.The CT velocity is one to two orders of magnitude higher than the speed of frozen pellets, the supersonic molecular beam or the expansion speed of gas injection based on current fueling technologies.It has been realized that those current technologies are suitable for the sizes of the tokamaks in operation at the present time.However, the future magnetically-confined fusion reactors will see a significant increase in sizes,magnetic fields,density and temperature, and the current fueling technologies mentioned above are unable to send the fuel directly into the reactor core.The plasma jet, with the same acceleration mechanism as CT,can also accelerate plasmoid to high speed[6], while the plasmoid mass is relatively small due to a lack of poloidal magnetic field.Directly fueling the reactor core has multiple advantages,including high fueling efficiency,the ability to tailor the density profile to optimize the bootstrap current drive.In particular, deep central fueling is crucial for the increase of the tritium burnup fraction and thus the tritium breeding ratio(TBR)by reducing tritium recycling.The TBR study is one of the key topics of China Fusion Engineering Test Reactor (CFETR)[7].Other potential advantages of CT injection fueling include current drive by CT helicity injection, as observed on the ENCORE tokamak [8], and momentum injection, as observed on the STOR-M tokamak by tangential CT injection[9].Improved plasma confinement has also been observed on the STOR-M tokamak following CT injection.The stabilization mechanism of micro-instabilities involving parallel flows was suggested to explain confinement improvement [10, 11].
Most of the CT injection experiments were performed on tokamak devices.Reports on interactions between CT and reversed field pinch (RFP)plasma are scarce.This paper describes a new compact torus injector(KTX-CTI)developed for the Keda Torus eXperiment (KTX)[12, 13].KTX is a medium-sized RFP device with a major radius of 1.4 m and a minor radius of 0.4 m.KTX can be operated in the RFP discharge as well as the tokamak discharge [12].The maximum toroidal field of KTX is 0.17 T, which is much lower than the values of similar-sized tokamak devices.Thus, the CT injection velocity does not need to be very high for nominal CT density.
Understanding magnetic helicity transport is essential for RFP plasma studies [14].Single helicity and three-dimensional RFP physics will be an important research topic for the KTX facility [13].In addition to upgrading KTX capability[13], it has been hypothesized that the CT injection might improve the plasma performance and facilitate a prolonged RFP state due to helicity and tangential momentum injections.
This paper reports on the design and bench test results of KTX-CTI.The design and structure of the injector are discussed in section 2.Section 3 describes bench-test setups and characterization methods.The main experimental results are discussed in section 4 followed by a summary in section 5.
2.KTX-CT injector design
Figure 1 shows the main components of the KTX-CTI device,including the formation section, precompressor, acceleration section and the terminal compressor.The design is similar to many other devices [5, 10, 15] with a coaxial configuration.The inner solenoid and the gas puffing ports are also shown in figure 1.The parameters of the capacitor banks for the solenoid, gas puffing driver, formation and acceleration power supplies are listed in table 1.Those capacitor banks are triggered sequentially by a preprogrammed pulse generator.Before initiation of the formation discharge, the solenoid is energized to induce bias magnetic field lines across the formation region.The field lines are tied to the front part of the inner and outer formation electrodes.The working gas is injected through the gas puffing valves well before the formation discharge to allow sufficient time for the working gas to uniformly diffuse into the formation region for the formation of a symmetric and stable CT.The formation capacitor bank discharge ionizes the working gas and forms a plasma between the electrodes.The discharge current flowing through the inner electrode of the formation region in the axial direction generates the toroidal fieldBtwhich is perpendicular to the radial discharge currentJrthrough the plasma.Thus, the Lorentz forceJr×Btpushes the plasma forward and stretches the bias field lines with the plasma.The stretched field lines eventually reconnect to become the poloidal fieldBpof the CT, forming a plasmoid confined by helical magnetic field lines.After the CT is formed, it is compressed through the compressor to a higher density and further accelerated by the following acceleration discharge to a high speed.Detailed device parameters and the associated power supplies will be described in more detail later.
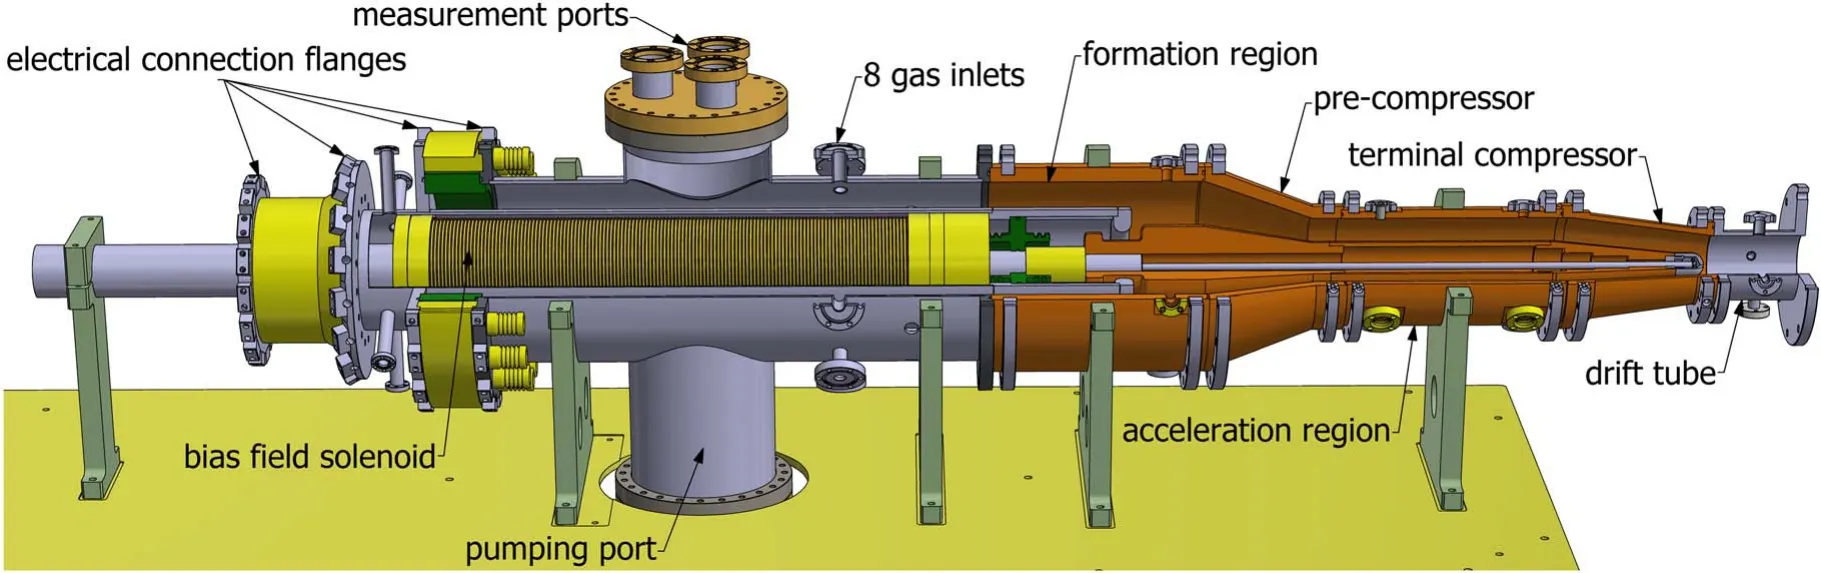
Figure 1.KTX-CTI schematics.
2.1.The structure of the KTX-CTI injector
The formation section uses the middle electrode as the cathode while the acceleration section uses the inner electrode as the cathode.All three coaxial tubular electrodes are electrically insulated from each other by several PTFE spacers.Circular flanges are used to connect to coaxial cables through the flanges leading to formation and acceleration capacitor banks.The 4 mm thick formation electrodes made of 304 stainless steel are thick enough to be considered conductive for ‘freezing’ the bias solenoid magnetic field line during the fast formation discharge timescale, and yet thin enough to allow solenoid magnetic field to penetrate through the electrodes during the slow solenoid discharge timescale.On the contrary, the compression and acceleration electrodes are thick and made of low-resistivity oxygen-free copper to conserve the magnetic field in CT while it is being compressed and accelerated between the electrodes.The surfaces of all electrodes will be coated with tungsten to reduce the impurities.However, during the initial test phase, the electrode surfaces are not coated.
Typically, the diameter of the formation region is relatively large so that it can be filled with an adequate amount of gas with an appropriate pressure for easy breakdown by formation discharge.Therefore, the chosen outer and inner diameters of the formation region are 250 and 170 mm,respectively.Due to the limitation of the 150 mm diameter of the largest port on the KTX device, the CT plasma must be compressed to match the port size.The precompressor reduces the inner and outer diameters of the acceleration electrodes to 140 and 70 mm, respectively.The tapered precompressor between the formation and acceleration regions has a cross-sectional area compression ratio of 2.3.The acceleration section can be directly connected to a middle-plane port on KTX for perpendicular injection.If tangential injection is desired,the CT can be further compressed using a terminal compressor which reduces the outer diameter of CT to 85 mm.The bottom port at the back of the formation region is used to connect to a pumping system capable of maintaining a 1 × 10⁻⁵Pa base vacuum pressure in the main chamber.Eight electromagnetic fast gas valves (FGVs),evenly spaced azimuthally, are mounted on the inlet ports to the right of the pump port as shown in figure 1.The valves are connected in parallel and powered by a single capacitor bank.This arrangement is advantageous to provide a uniform gas distribution in the annulus between the formation electrodes.
Based on the CT penetration condition expressed in equation (1), the directional kinetic energy density of CT is required to be larger than the magnetic energy density at the target plasma position.Typically, the CT number density is~1021m-3.The KTX core toroidal magnetic field is 0.17 T[12].Our calculations indicate that a hydrogen CT with a density of 2 ×10²¹m-3and velocity over 83 km s-1can be injected to the center of KTX.Therefore, only moderate CT speed and relatively short accelerator section are required.Thus, the length of acceleration electrodes was chosen to be 35 cm.This length is relatively short compared with other injectors with similar sizes [5, 15].The acceleration electrodes for KTX-CTI can be easily replaced with longer ones if higher injection velocity is necessary.
2.2.Bias field solenoid
The bias field solenoid (BFS)in the formation region is used to induce a divergent magnetic field at the end of the solenoid.The bias magnetic field defines an easy breakdown path when the formation bank discharges.During the CT formation process, the field lines will be frozen in the formed plasmoid and stretched by a Lorentz force exerted on the plasma.Eventually, the field lines will reconnect to become the poloidal field in CT.Magnetic reconnection is a crucial process which allows the formation of a free CT.The solenoid is mounted in the gap between the inner and middle electrodes and its surface is covered with insulating polyimide films.The solenoid chamber is pressurized with SF6gas to prevent arcing around the solenoid when the formation and acceleration discharge are initiated.The solenoid inductance is 3.4 mH.It is energized by a 1.5 mF capacitor discharge.The pulse period of the solenoid must be long enough for the solenoid bias field to penetrate the stainless-steel formation electrodes and to be quasi-static before CT is formed.The magnetic penetration time can be estimated from the magnetic diffusion equation,τ~μδ2/ηwhereμ,δ,andηare magnetic permeability, the thickness of the two formation electrodes,and stainless-steel resistivity.The diffusion time for our 4 mm thick electrodes is ~0.02 ms.The measured pulse width of the solenoid current is about 10 ms, which is almost three orders of magnitude larger than the magnetic diffusion time.The maximum voltage of the solenoid capacitor bank is 3 kV.The solenoid can generate a magnetic flux of up to 6 mWb.Figure 2 shows the voltage and current waveforms of the solenoid bank discharge when charged to 3 kV.
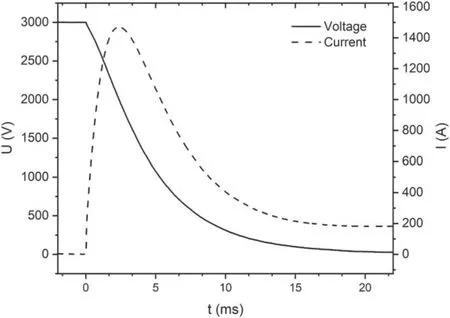
Figure 2.Voltage and current waveforms of a solenoid bank discharge.
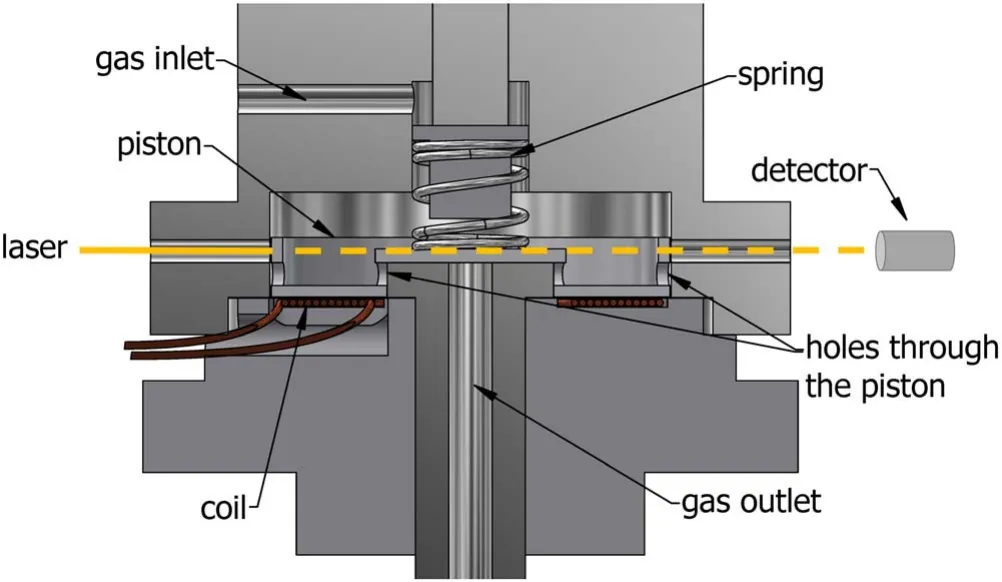
Figure 3.Schematic of the gas valve including a laser and detector system to evaluate the piston dynamics.
2.3.Fast gas valves
The CT penetration condition expressed in equation (1)indicates that a high density and high velocity CT is required.In order to achieve breakdown and form high density CTs,high gas pressure in the formation region is required.However, static high filling pressure will require a differential pumping system to accommodate different pressure requirements for CT and tokamak operation.Also, a static high gas pressure in the acceleration region will create dragging force on the CT being accelerated.One of the solutions is to maintain a lower base pressure and inject gas just before CT formation discharge so the gas is concentrated in the formation region only.Like other CT injectors,fast gas valves (FGV)driven by electromagnetic force are used for KTX-CTI.The main components for an FGV are shown in figure 3.A piston and an O-ring seal separate the KTX-CTI main vacuum chamber and the pressurized FGV gas storage chamber.When a pancake-like plane coil is energized by discharging a capacitor bank through the coil, the piston is lifted by the induced electromagnetic force and gas is puffed into the injector.When the current through the coil drops to certain level, the gas pressure pushes the piston back against the O-ring seal to stop gas injection.When the gas diffuses towards the formation region,the formation discharge is then initiated to form a CT.Eight FGVs are used for KTX-CTI.The pressure in all gas storage chambers is the same from a gas supply line and a single capacitor bank is used for all eight coils connected in parallel.In order to ensure that all valves inject the same amount of gas to form symmetric CTs,a spring is used for each FGV and can be adjusted individually to add an additional control of the puffed gas amount from each individual FGV.
In order to measure the motion of the piston,two aligned through-holes are drilled through the housing and another set of through-holes is drilled through the piston of a test FGV.A laser beam is aligned with the two through-holes on the housing.Normally,the piston is pressed against the seal,and the holes on the housing and on the piston are not aligned.Under this condition, no light will be detected.When the piston is activated by the pulsed current through the coil, the piston is lifted and the laser light will go through both sets of holes and the light will be detected.The waveform of the measured laser intensity during the operation of the FGV is an indication of the piston motion [16].Figure 4(a)shows the waveforms of the bank voltage and current through the coil of an FGV.For this test experiment, only four valves are connected to the power supply and the current through the single coil for the valve under investigation is displayed.The voltage and current waveforms indicate an over-damped LCR discharge.When the charging voltage is 1420 V, the peak current is about 850 A.Figure 4(b)shows the evolution of the laser intensity detected for different capacitor bank voltages.The opening time of the valve is in the range of 400-600 μs depending on the capacitor bank voltage in the range of 400-460 V.The laser intensity waveforms suggest that the displacement of the piston and the total opening time increase with the bank voltage as expected.
The amount of gas puffed and the diffusion time was measured in a test vacuum chamber using a fast ionization gauge after an FGV is activated.The volume of the test chamber is 0.12 m3.The pressure sensor is placed approximately 20 cm from the outlet of the FGV tested.Figure 5(a)shows the evolution of the gas pressure measured.For comparison, the coil current waveform is also plotted in figure 5(a).The bank voltage was 480 V for this particular case.During this test, the chamber is temporarily isolated from the pumping system.The measured pressure increases nearly exponentially and approaches the maximum in about 1 ms.The waveforms indicate that the gas diffusion time for this setup is longer than the valve opening duration (cf figure 4).The gas distribution time shown in figure 5(a)provides a guidance on trigger timing, with respect to the FGV triggering time, for the solenoid and formation discharges.Typically, the delay time between formation discharge and gas injection is set at ~400 μs for KTX-CTI,during which the gas front spreads over a 30 cm distance in the formation region (assuming a H2spread velocity of 1000 m s-1).For the KTX-CTI configuration, the distance between the gas valve outlet and the desired CT formation region is approximately 40 cm.Thus,most of the working gas is still in the formation region when the formation discharge is triggered.
The pressure in the test chamber eventually reaches a steady state after the FGV was triggered.The static pressure allows the calculation of the total molecule numbers puffed from FGV.Figure 5(b)shows the variation in static pressure in the test vacuum chamber as a function of bank voltages.It has been observed that a threshold voltage is necessary to activate the gas valve and the increase in pressure with the bank voltage is nonlinear.Conversion from the pressure to the puffed gas mass indicates that eight valves can supply over 100 μg of hydrogen into the formation chamber when the FGV storage chamber is pressurized at 2 atm and the bank voltage is 1500 V.
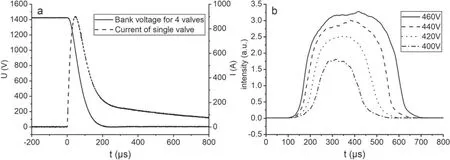
Figure 4.(a)Waveforms of voltage (solid line, left hand side vertical scale)and current (dash line, right hand side vertical scale)during a capacitor bank discharge through a coil, (b)waveforms of the laser intensity for four different bank voltages.
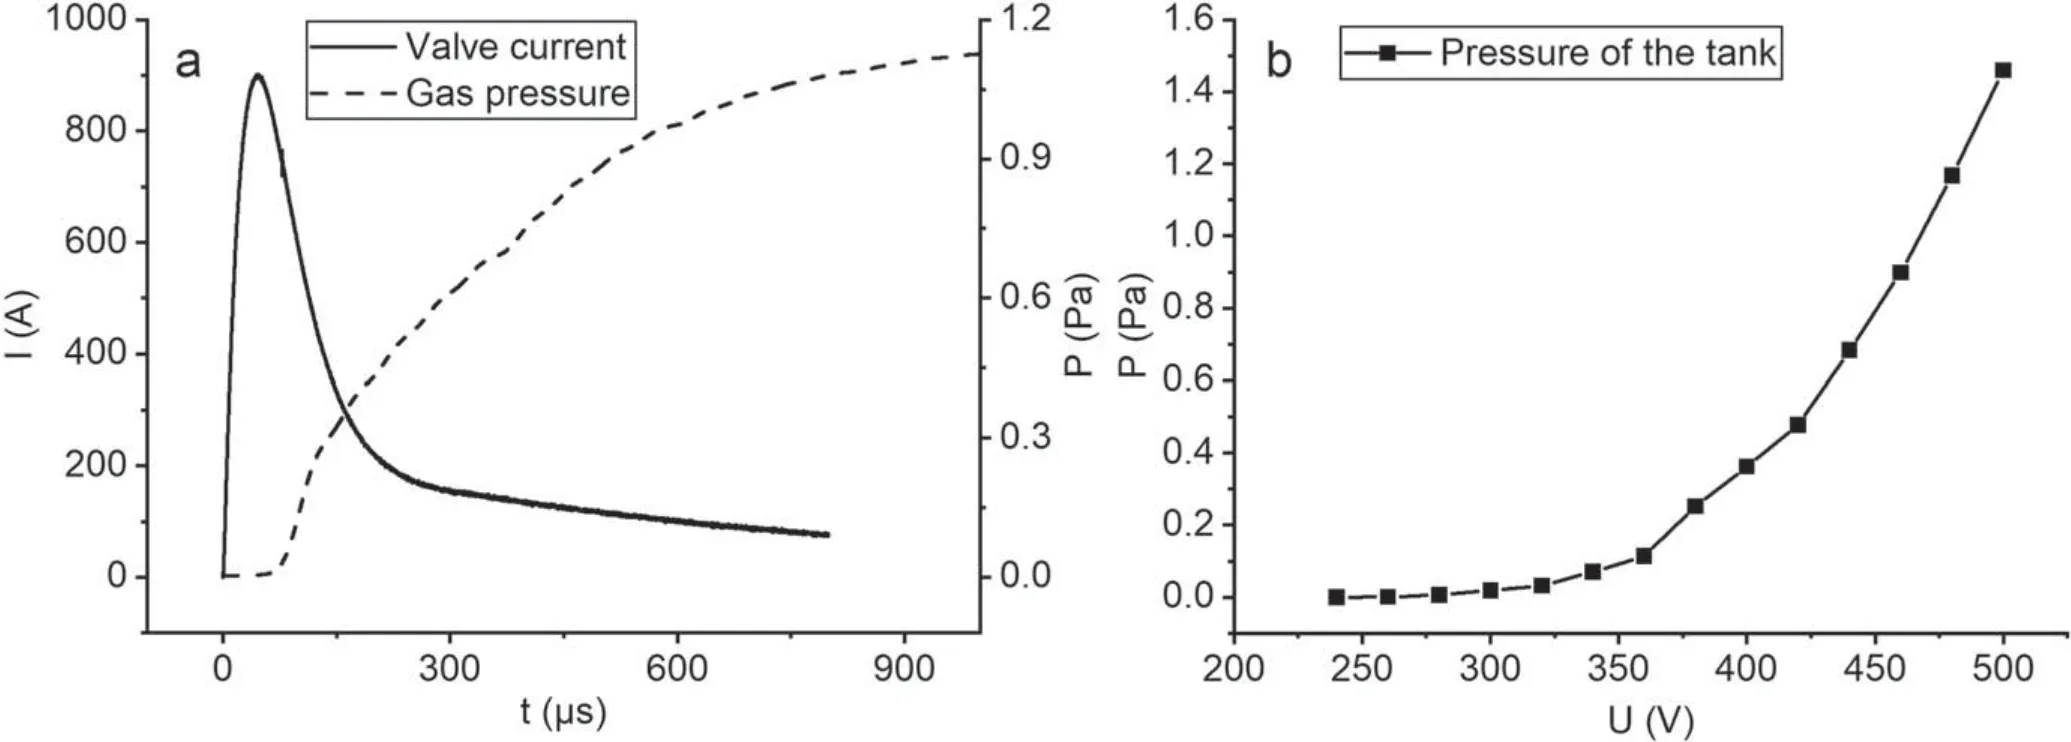
Figure 5.(a)Gas pressure (dash line, right hand side vertical scale)evolution measured by a fast ionization gauge and the coil current, (b)variation of the final static gas pressure in the test vacuum chamber after gas puffing as a function of bank voltage.
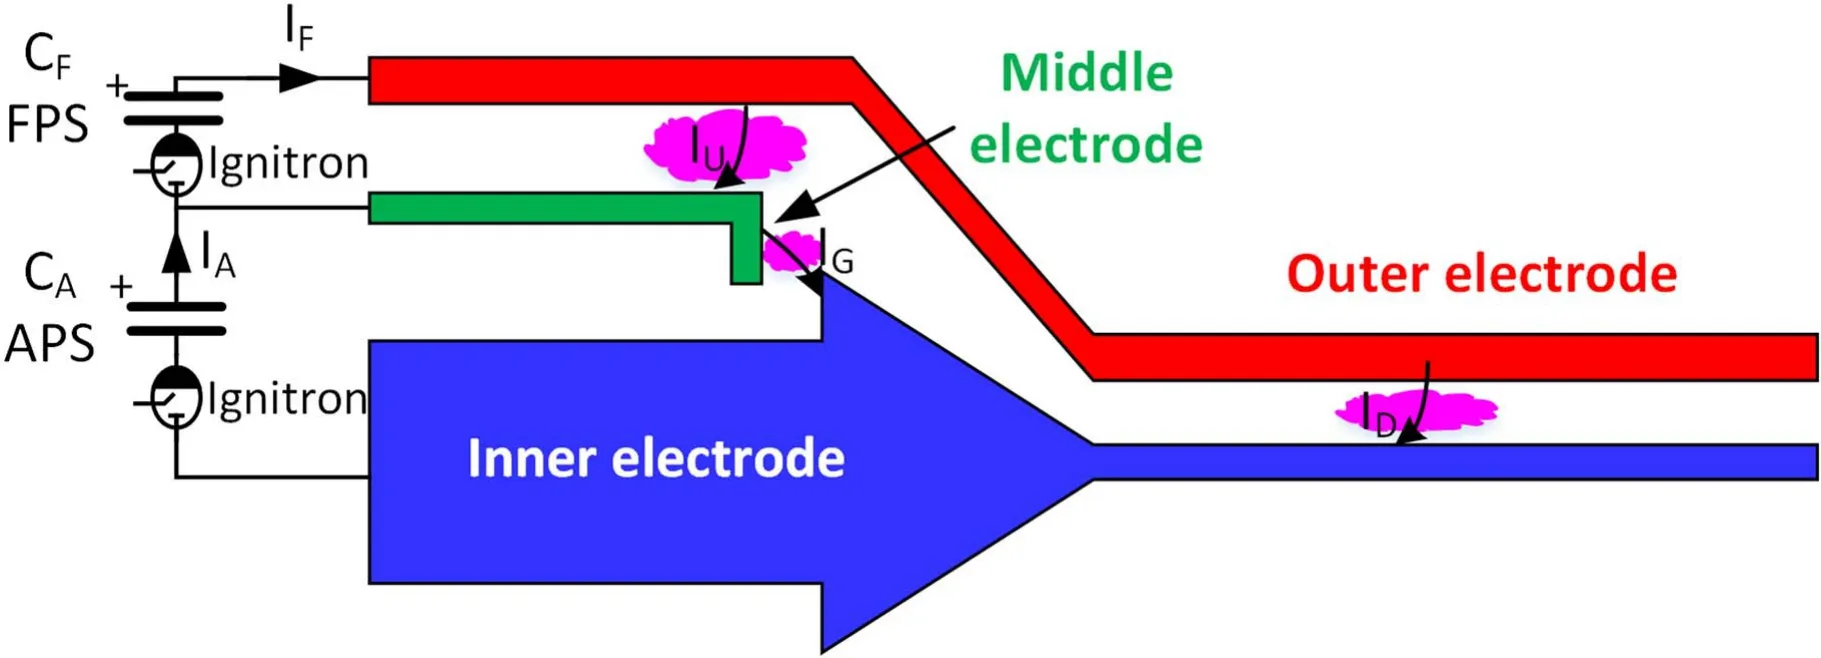
Figure 6.Schematics showing current paths of the FPS and APS discharge circuits.
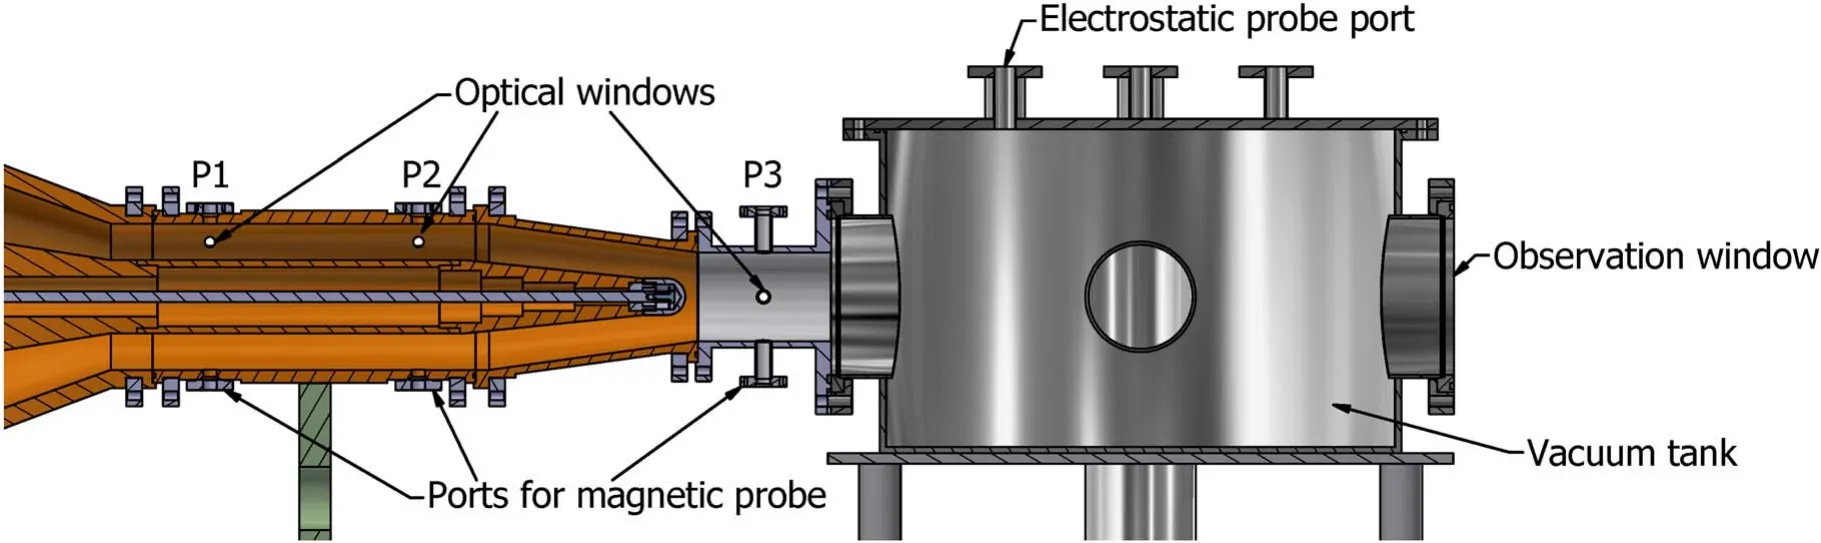
Figure 7.Test chamber and diagnostic systems.
2.4.Main discharge circuits
Two high voltage, high current and pulsed power suppliesthe formation power supply (FPS)and the acceleration power supply (APS), respectively-are developed for the formation and acceleration discharge circuits [17].Metalized film capacitors with low inductance for pulsed discharges are used as the energy storage banks.The two power supplies are connected in series as shown in figure 6.The envisaged current path through the plasma is also indicated in the diagram.
Each of the formation and acceleration banks(parameters of which are listed in table 1)uses four capacitors connected in parallel.Because the expected discharge currents are over 100 kA and the current pulse rise time is ~10 μs,ignitrons are used as the switches to deliver large current to the injector.Each bank uses four ignitrons,one for each capacitor.Sixteen parallel coaxial cables are used to connect the capacitor and ignitron assembly to circular flanges of the injector.Rogowski coils around ignitrons are used to measure the discharge currents.
The formation discharge current should match the solenoid magnetic field.Too small a formation discharge current is unable to stretch the field line enough to cause magnetic reconnection.Too large a current may break the magnetic field lines at front to blow the plasma through the magnetic field lines(so called blow-by mode).In both scenarios,free CT cannot be formed.The required formation currentIfneeds to satisfy the following condition to successfully form a free CT:
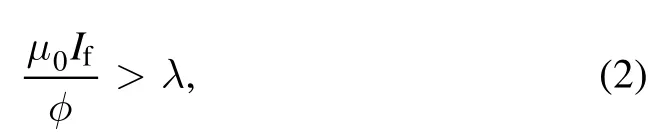
whereφis the solenoid magnetic fulx andλ(equal to 80m-1according to Barnes’theory[18])is the CT helicity eigenvalue.The threshold formation current is equal to 150 kA for 6 mWb solenoid magnetic flux.Therefore, the maximum formation current in KTX-CTI is designed to reach at least 200 kA.
The FPS and APS discharges follow an orderly sequence.After the solenoid field is prepared and the gas is injected into the injector chamber,FPS is triggered to breakdown working gas, to form plasma, to stretch the bias magnetic field lines,and to cause them reconnect.The self-confining free CT formed is pushed through the precompressor.Once the CT reaches the end of the compressor, the acceleration discharge is triggered to accelerate CT to a high velocity.
According to the railway gun theory,the force(F)on the sliding plasma armature is proportional to the square of its current I:F=L′I2/2,whereL′is the inductance of the two axial cylinders per meter.Thus, the APS current is the factor determining the maximum CT speed,which will be discussed in the next section.
2.5.Data acquisition and discharge timing system
The data acquisition system uses a National Instrument PXIe-1082 crate with a PXIe-8108 controller.Two high-speed PXIe-5105 modules with a maximum sampling rate of 60 MHz and 12-bit resolution are used.A total of 16 channels can be accommodated.The discharge timing pulses are generated using a field-programmable gate array (FPGA)controller with 0.1 μs control accuracy.The trigger pulses from FPGA are converted to optical signals and sent the FPS, APS, FGV and BFS subsystems using optical fibers to prevent ground loops and to reduce electromagnetic noises from the discharges of various capacitor banks.
3.Bench test setup
For bench test and optimization experiments, KTX-CTI is attached to a vacuum chamber as shown in figure 7.The diameter of the terminal cone outlet of KTX-CTI is 8.5 cm.The diameter of the cylindrical stainless steel(SS)chamber is 25 cm.CT enters the chamber via an SS drift tube with two different diameters.The diameter and length of the first part attached to KTX-CTI are 8.5 cm and 12.8 cm, respectively.The port spool attached to the test chamber has a diameter of 15 cm and a length of 5.8 cm.
Various diagnostic tools are installed on KTX-CTI and on the test chamber.Six magnetic pickup coils are mounted on vertical ports on the top and bottom of the outer electrode of the injector and drift tube at three different axial positions (marked as P1, P2 and P3)to measure the CT boundary field in the toroidal and poloidal(axial)directions.The distance between P1 and P2 is 20 cm and that between P2 and P3 is 33 cm.The optical windows are used for the laser interferometer to measure CT electron density.The windows are in the same axial positions as those for magnetic probes.Figure 8 shows the crosssectional view of the optical windows on the outer acceleration electrode to allow the laser beam to go through the region between the inner and outer electrodes.The normal of the window is off the optical axis,advantageous to avoid unwanted reflection.The impurity emission spectra(within the wavelength of 350-920 nm)are measured at the horizontal windows at P3 position using an Ocean Optics spectrometer.The images of the plasma emission are measured with a camera viewing directly towards the injector electrodes along the axial direction.A triple Langmuir probe is installed at a test port through the top of the test chamber.The probe is approximately 305 mm from the end of the final compressor.
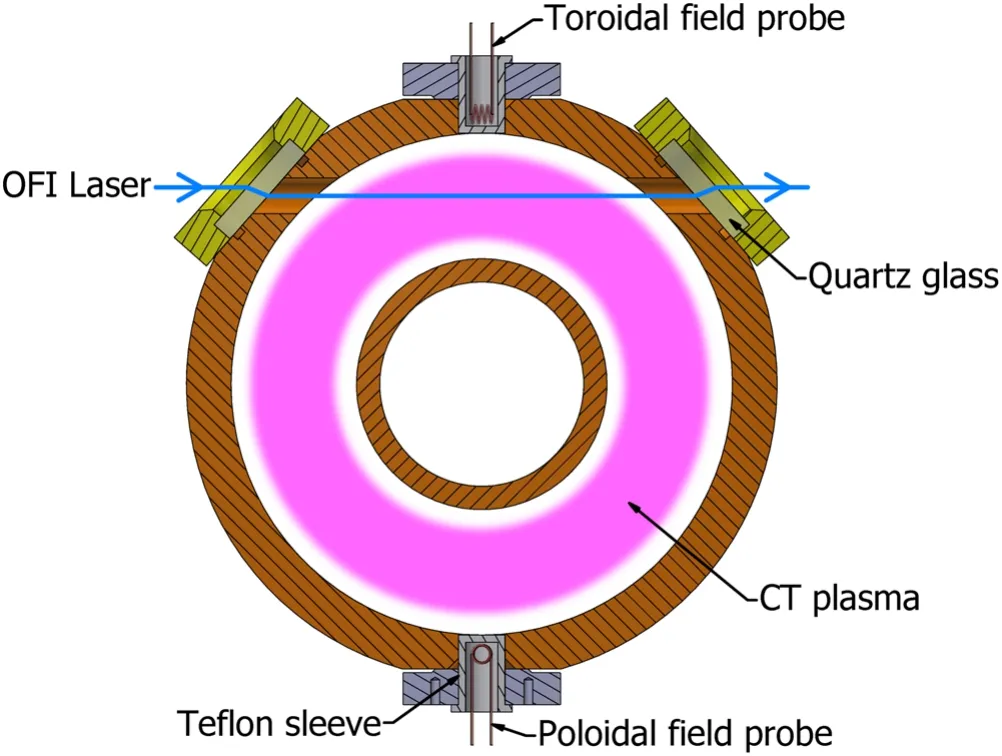
Figure 8.Schematic showing optical fiber Mach-Zehnder interferometer measuring density at a CT cross section in the acceleration region.
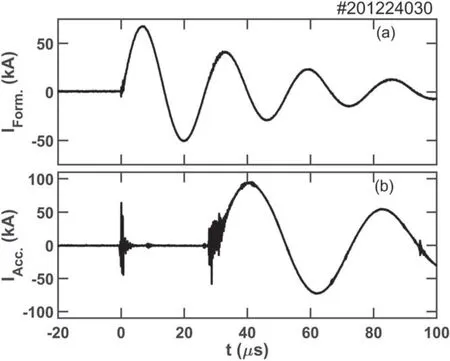
Figure 9.Typical discharge waveforms: (a)FPS and (b)APS currents.
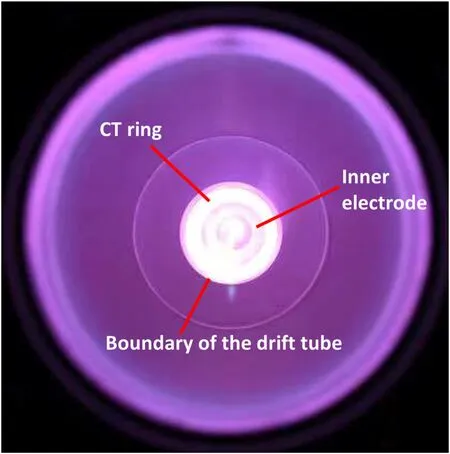
Figure 10.Visible light image from the exit of drift tube in a discharge.
In the previous CT experiments [5, 11, 15], the line averaged electron density was measured using traditional He-Ne laser interferometers and Langmuir probes.The traditional interferometer is mounted on an optical table to minimize environmental vibrations and optical alignment is tedious and may change due to change of the environment.Integrating the optical components into the injection device may also be challenging due to space limitations.Therefore, traditional interferometers were previously only on a single location.Detailed density evolutions at different locations were not obtained.In addition, the CT plasmoid velocity was usually calculated by the time-of-flight method from the signals of several magnetic pickup coils located along the axis of the injector.It has been found that the density and magnetic field peaks do not necessarily overlap.Thus, direct density measurements at multiple positions using interferometers will provide additional information on bulk-plasma velocity.For KTX-CTI,an optical fiber Mach-Zehnder interferometer(OFI)with the 1.55 μm laser wavelength has been developed[19].It uses single-mode optical fibers as light carriers.The fibers are compact, which makes them easy to integrate.The electron density and time resolutions of the interferometer are 5 ×10¹⁸m-3and 0.1 μs, respectively, precise enough compared with the expected CT density of over 1 ×10²²m-3and the time scale of tens of microseconds.The line-averaged densities at different axial locations of our experimental setup have been measured simultaneously (see figure 7).
4.Experimental results
Figure 9 shows the typical waveforms of the formation and acceleration discharge currents.The voltages of the formation and acceleration banks for this discharge are 4.5 kV and 7.5 kV,respectively.The peak currents through the formation and acceleration circuits are 66 kA and 93 kA, respectively.The periods of formation and acceleration discharges are 31 μs and 42 μs, respectively.The period of acceleration discharge is longer than that of the formation discharge since the capacitance and inductance of the acceleration circuit are larger than the corresponding parameters for the formation circuit.
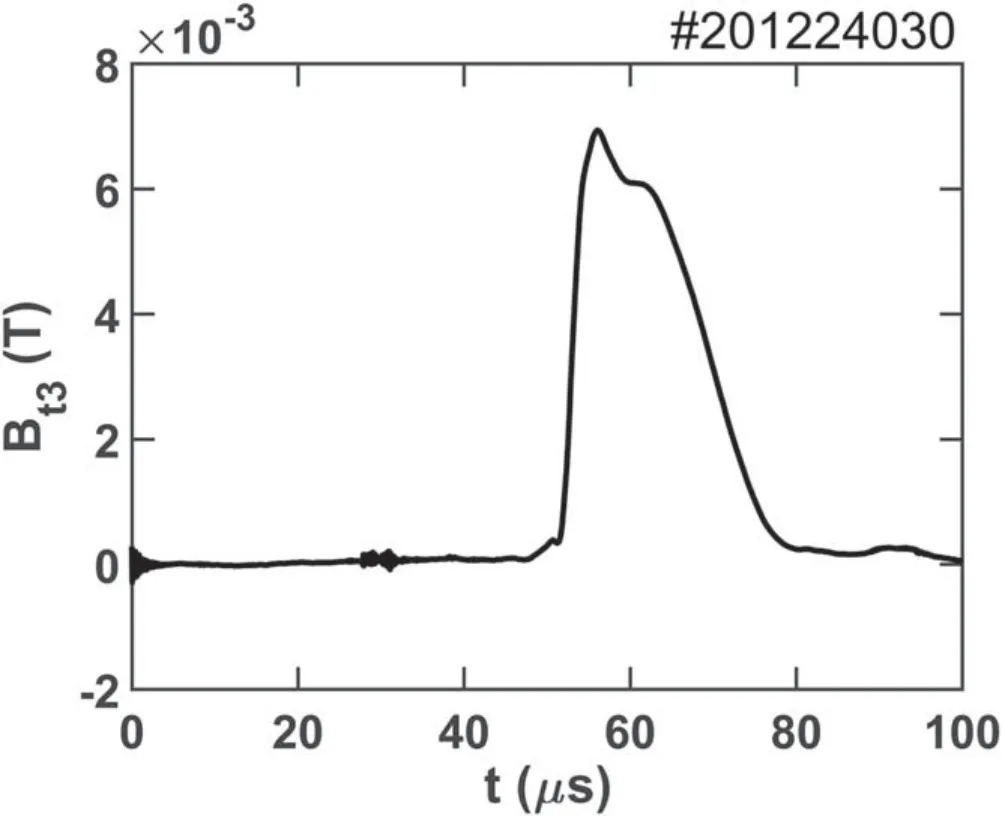
Figure 11.Surface toroidal field measured at axial position P3.
Figure 10 shows the image of a typical CT discharge captured by a visible light camera through the window of the chamber(see figure 7).The camera exposure time was 10 ms to eliminate the overexposure from the reflected light.A remarkably bright plasma ring and a relatively dim inner electrode of the acceleration region can be clearly seen in figure 10.The inner diameter of the CT ring is ~2/3 of the outer diameter,which is larger than the 1/2 ratio of the inner and outer diameters of the acceleration region.Thus,when the CT plasma leaves the terminal compressor at high velocity,the inner side of the CT ring disengages from the inner electrode cone while the outer part is still confined by the drift tube.
The toroidal boundary magnetic field at the P3 position(see figure 7)has also been measured by a pick-up coil.As shown in figure 11, the toroidal field generated by the poloidal current flows in the CT ring is in the order of 0.01 T.
Figure 12 shows the density evolution measured at three axial locations at P1, P2, and P3.The measurements were taken for the same discharge as shown in figure 9.For comparison,the acceleration current waveform is replotted on the top panel (figure 12(a)).The propagation of the CT density can be clearly seen as evidence by the time delay of the density peaks.To the best of our knowledge, this is the first report on simultaneous density measurements at three different CT injector locations with high density resolution and time resolution.
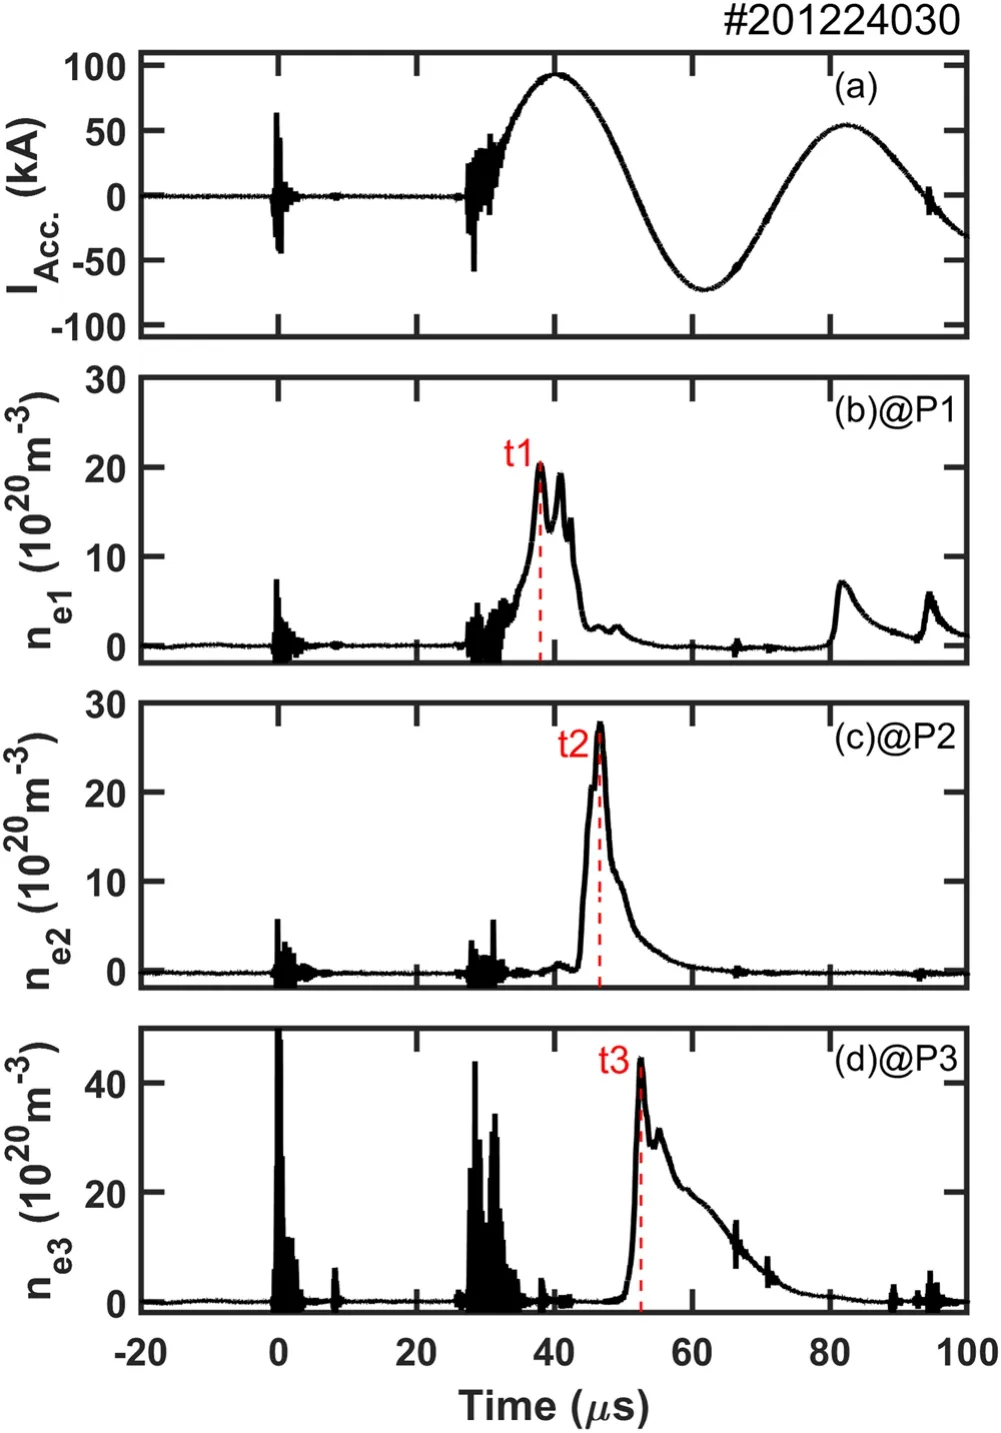
Figure 12.Acceleration discharge current and three line averaged CT densities measured using a multi-channel OFI at three locations.(a)Start of the acceleration discharge current, (b)density at P1, (c)density at P2 and (d)density at P3.The peak densities are successively delayed with respect to the start of the acceleration discharge current.
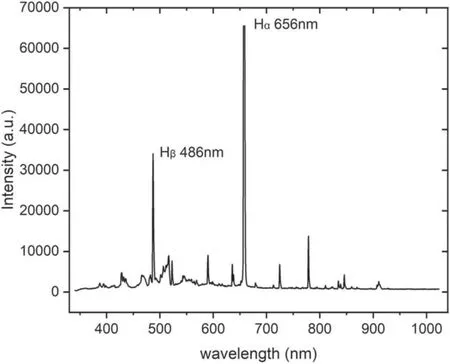
Figure 13.Emission spectrum of CT plasma measured at the drift tube end.
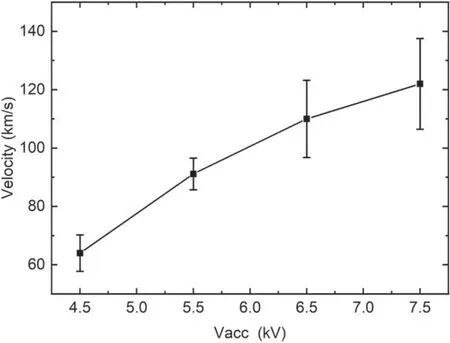
Figure 14.CT injection velocity as a function of the acceleration bank voltage.
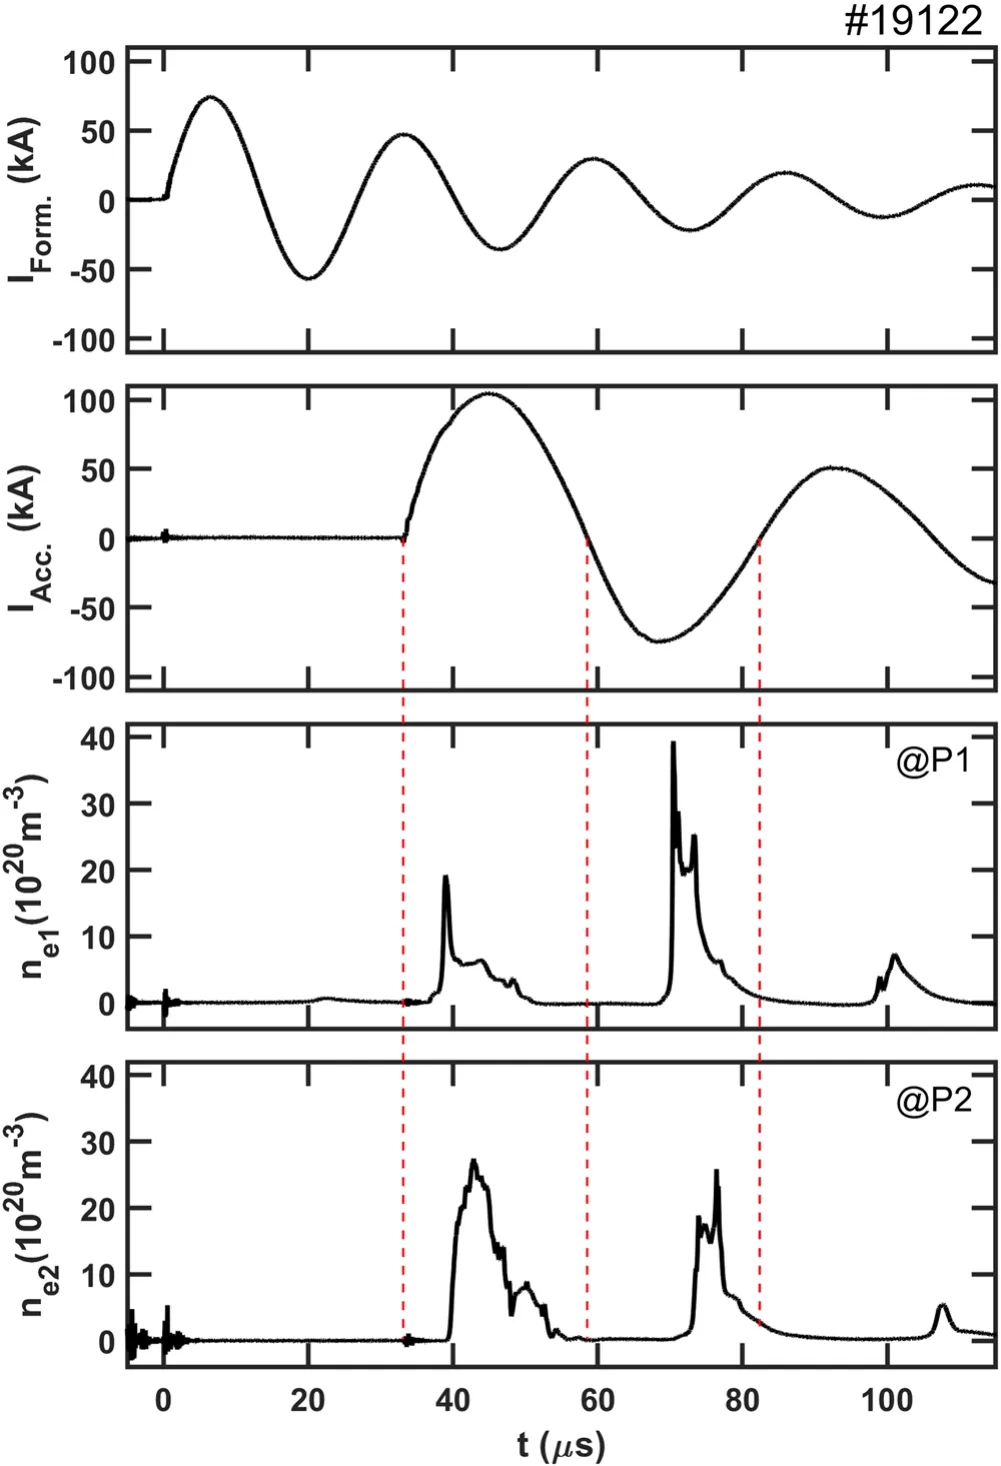
Figure 15.Multiple CT plasmoids emitted in one discharge.
The increasing maximum electron densities at P1, P2 and P3 positions have been measured atn1=21.1×10²⁰,n2=27.9×10²⁰andn3=44.6 ×10²⁰m-3.The successively delayed peak times of the density waveforms are measured att1=38,t2=46.6 andt3=52.6 μs.The average velocities between P1/P2 and P2/P3 positions areV12=23 andV23=55 km s-1, respectively, based on the time-of-flight principle.The increasing CT velocities indicate that the CT is accelerated by the acceleration discharge.The higher peak density and narrower waveform at the end of the accelerator(location P2 in figure 7)compared with the corresponding parameters at the start of the accelerator (location P1)suggest that the CT is also compressed in length while being accelerated.It can be seen that the peak density at P3 in the drift tube is the highest among the peak densities measured at the three locations.The cross-sectional area between the electrodes at the end of the final compression section is 57 cm2,approximately half of the area at the acceleration region (115 cm2).Considering the possible expansion of CT in the drift tube,the high CT density measured in the drift tube strongly suggests that the terminal compressor indeed effectively compresses the plasmoid.Lacking velocity measurements with high spatial resolution,the deceleration of CT in the compressor cannot been determined, although it is believed to occur.
Using the measured CT density and the velocity, the maximum magnetic field in KTX that the CT can penetrate is 0.17 T, according to equation (1).Therefore, the accelerated CT is suitable for the intended injection experiments on KTX,with a 0.17 T maximum toroidal field.
The particle inventory at the CT exit can be estimated by the following integral over a density waveform:
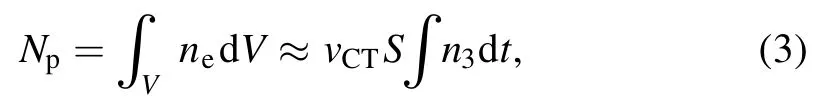
whereneandn3are the volume-averaged and line-averaged density as functions of time t, respectively; V is the CT volume, S is the cross-sectional area of the drift tube andvCTis assumed to beV23.Thus, in our case, the calculated Npis 1.16 ×10¹⁹,corresponding to 19 μg hydrogen plasma mass.The peak particle flux,ΓCT=nCTv23=2.2 ×1026m-2s-1,can be estimated as well.Under the optimized CT operation parameters, maximum hydrogen mass of about 50 μg and maximum CT velocity of about 100 km s-1can be obtained simultaneously.
Our current design uses the electrodes without tungsten or cadmium coatings.The spectra of emission from the CT plasma at the end of the drift tube at the P3 location have been measured(see figure 7).As shown in figure 13,the dominant peaks are Hαand Hβfrom the working gas hydrogen.Other smaller peaks will be determined in the future, perhaps using a high-resolution spectrometer.The CT temperature of~10 eV was obtained using the triple Langmuir probe.
The main purpose of the bench test of KTX-CTI is to optimize operation parameters to obtain a suitable particle inventory and injection velocity for CT injection experiments on KTX.It has been determined that the particle inventory is mainly determined by the gas puffing amount from FGVs.In addition,the CT velocity depends mainly on the bank voltage of APS which was verified by the data shown in figure 14.The CT velocity increases nonlinearly with the acceleration voltage (up to 7.5 kV).
After a lot of discharge cleaning and optimization of discharge parameters,the KTX-CTI can produce two or three masses of CT plasmoid in one discharge as shown in figure 15, which is observed for the first time.The three red dotted lines represent the beginning of the first three halfwave periods of acceleration current.We can see that each CT plasmoid is pushed into the acceleration region during each half-wave period of acceleration current.However, the time delay between the moment of zero current and the subsequent moment of density rise diagnosed at the P1 position becomes successively longer, and the velocity of each of the three CT plasmoids (125 km s-1, 58 km s-1and 30 km s-1,respectively)decreases sequentially.The reason for increasing delay times and the reduction in acceleration capacity should mainly be the attenuation of acceleration current.The frequency of the re-emitted CT plasmoids is up to 30-40 kHz,and the ultrahigh-frequency repetitive CT injection could be realized provided working gas can be continuously puffed into the formation region and the discharge currents remain unattenuated.
5.Summary
The KTX-CTI device has been constructed for future CT injection experiments on the KTX RFP which can also be operated in tokamak mode at a low toroidal magnetic field.The KTX-CTI configuration followed the conventional coaxial design concept.The main components include fast gas puffing valves, a solenoid to induce bias magnetic field, formation section to form a free CT and acceleration section to accelerate the CT to a desired high velocity.
Several diagnostic tools have been developed for the bench test experiments reported in this article,including magnetic field coils, multi-channel OFI, an optical imaging camera, a spectrometer and Langmuir probes.In particular,an innovative flexible OFI system has been used for the first time in the CT research community to measure the electron density evolution and to interpret CT velocities based on the time-of-flight principle.The number of injected particles is estimated from the CT velocity and density evolution.The edge magnetic field measurement provides an estimation of the injection helicity.
The highest CT velocity and density are over 120 km s-1and 1 ×10²²m-3,respectively.The maximum CT mass(mCT)was about 50 μg,corresponding to 30%of the particle inventory in a typical KTX plasma.The injection velocity of up to 120 km s-1is controllable by the acceleration bank voltage.The CT parameters are suitable for injection experiments on KTX.During the 100 μs period in one discharge, KTX-CTI can produce and emit multiple CT plasmoids, which means the possibility of ultra-high frequency repetitive CT fueling.
Acknowledgments
This work was supported by the National Magnetic Confinement Fusion Science Program of China (Nos.2017YFE0301700 and 2017YFE0301701)and National Natural Science Foundation of China (Nos.11875255,11635008, 11375188 and 11975231).
ORCID iDs
猜你喜欢
杂志排行
Plasma Science and Technology的其它文章
- Numerical analysis on the effect of process parameters on deposition geometry in wire arc additive manufacturing
- Investigation of the gas bubble dynamics induced by an electric arc in insulation oil
- The influence of charge characteristics of suspension droplets on the ion flow field in different temperatures and humidity
- Characteristic studies on positive and negative streamers of double-sided pulsed surface dielectric barrier discharge
- Hydrophobicity changes of polluted silicone rubber introduced by spatial and dose distribution of plasma jet
- Characteristics of water volatilization and oxides generation by using positive and negative corona