Discovery of Benzimidazole Derivatives as Novel Aldosterone Synthase Inhibitors: QSAR, Docking Studies, and Molecular Dynamics Simulation①
2022-04-16GUOHongMeiYUNaFULeLIGuangPingSHUMaoLINZhiHua
GUO Hong-Mei YU Na FU Le LI Guang-Ping SHU Mao② LIN Zhi-Hua②
a (School of Pharmacy and Bioengineering, Chongqing University of Technology, Chongqing 400054, China)
b (Key Laboratory of Screening and Activity Evaluation of Targeted Drugs, Chongqing 400054, China)
ABSTRACT Aldosterone synthase inhibitors can lessen the production of aldosterone in organisms, which effectively affecting the treatment of hypertension. A series of computational approaches like QSAR, docking, DFT and molecular dynamics simulation are applied on 40 benzimidazole derivatives of aldosterone synthase (CYP11B2) inhibitors. Statistical parameters: Q2 = 0.877, R2 = 0.983 (CoMFA) and Q2 = 0.848, R2 = 0.994 (CoMSIA) indicate on good predictive power of both models and DFT’s result illustrates the stability of both models. Besides, Yrandomization test is also performed to ensure the robustness of the obtained 3D-QSAR models. Docking studies show inhibitors rely on π-π interaction with residues, such as Phe130, Ala313 and Phe481. Molecular dynamics simulation results further confirm that the hydrophobic interaction with proteins enhances the inhibitor’s inhibitory effect. Based on QSAR studies and molecular docking, we designed novel compounds with enhanced activity against aldosterone synthase. Furthermore, the newly designed compounds are analyzed for their ADMET properties and drug likeness and the results show that they all have excellent bioavailability.
Keywords: hypertension, 3D-QSAR, molecular docking, molecular dynamics simulation, CYP11B2 inhibitors; DOI: 10.14102/j.cnki.0254-5861.2011-3321
1 INTRODUCTION
Blood pressure is the pressure of blood circulation on the wall of the body's arteries (the main blood vessels of the body). Hypertension is a chronic disease characterized by persistent high systemic arterial blood pressure (systolic blood pressure ≥ 140 mmHg, diastolic blood pressure ≥90 mmHg), which can be accompanied by functional or organic damage of heart, brain, kidney and other organs[1].Clinically, hypertension can be divided into two categories,primary hypertension and secondary hypertension. About 11.3 billion people around the world are affected by the disease[2,3]. At the same time, it has also become the "first killer" of Chinese people's health. At present, there are 160 million patients with hypertension in China, so it is also known as “the first disease in China”[4]. About half of the patients in our country show intractable hypertension, and their blood pressure is still high even after receiving a combination of three or more antihypertensive drugs[5]. Patients whose blood pressure is not maintained at normal levels have a significantly increased risk of stroke, heart attack and heart failure[6-8].
At present, the treatment of hypertension mainly depends on the RAAS system. Renin-angiotensin-aldosterone system(RAAS) is a pressor regulation system produced by the kidney in the body, which causes vascular smooth muscle contraction and water and sodium retention, resulting in pressor effect. RAAS inhibitors are widely used in clinical practice,but long-term use of pristine and sartan drugs (more than three months) can cause the phenomenon of “aldosterone escape”[9,10]. Recent studies have found that aldosterone is not only a deterioration factor of hypertension, but also a risk factor of cardiovascular disease. Aldosterone receptor antagonists include Spironolactone and Eplenone (Fig. 1),but the side effects are hyperkalemia and female breast development. Therefore, there is an urgent need to develop antihypertensive methods for aldosterone receptors[3,11].Aldosterone synthase (CYP11B2) is located in the adrenal glomerulus and can reduce the level of aldosterone in the blood[5,12]. Aldosterone synthase (CYP11B2) is a key enzyme in the synthesis of glucocorticoid aldosterone, which is thought to mediate the last three steps of aldosterone synthesis from 11-deoxycorticosterone to aldosterone[13]. The expression of CYP11B2 in adrenal gland is regulated by reninangiotensin system (RASS) and plays an important role in maintaining electrolyte metabolism in higher organisms.Abnormal overexpression of CYP11B2 can lead to disruption of mineral balance and may lead to high blood pressure.The effective inhibitor of CYP11B2 should effectively block the biosynthesis of aldosterone, thus reducing the level of plasma aldosterone and finally lowering the blood pressure[14]. The effective treatment strategy for a variety of diseases is to inhibit CYP11B2, which can lead to lower levels of acetone in circulating plasma, including hypertension and heart failure[6,12]. Considering this principle, inhibition of CYP11B2 may be an attractive way to regulate blood pressure and treat aldosterone-related diseases by reducing plasma aldosterone levels[15].
For this reason, computer-aided drug design methods have been widely and effectively used, including quantitative structure-activity relationship (QSAR) modeling based on assumptions about compound activity and its structure[16-19].3D-QSAR methods, such as comparative molecular similarity index analysis (CoMSIA) and comparative molecular field analysis (CoMFA)[19], are of great significance for the analysis of the relationship between structure and activity of compounds, such as the application of CADD technology in research on hypertension-related targets[20,21]. A 3D-QSAR model was established based on 40 benzimidazole derivatives to conduct in-depth research on the relationship between their structures and activities[22,23]. Molecular docking research is applicable to different stages of drug discovery,such as predicting the butt structure of the mating-subject complex and sorting the compound molecules according to the binding. The docking protocol helps clarify the most effective binding posture between the match and the subject[24,25]. The objective of the current study is tantamount to elucidate the mode of interaction of benzimidazole derivatives with aldosterone synthase (CYP11B2). Therefore, the information provided significant guidance about the design of novel CYP11B2 inhibitors.

Fig. 1. Structures of spironolactone and eplenone
2 MATERIALS AND METHODS
2. 1 Data sources and preparation
40 benzimidazole derivatives of CYP11B2 inhibitors come from the reported literature[22,23], and their experimental activities in micro-molar and inhibitory activities (-logIC50,pIC50) are listed in Table 1. 40 CYP11B2 inhibitors’ 3Dstructure was constructed and minimized utilizing SYBYL-X 2.1.1 software. With Gasteiger-Huckel charge, Tripos force field and Powll energy gradient method, all molecules were optimized. All parameters were default except the maximum optimization limit and convergence criterion[26]. They were setting as 10,000 times and 0.005 kcal/mol, respectively. We used the structure obtained by the above method as a subsequent 3D-QSAR analysis. Thirty compounds were randomly selected as the training set and the remaining compounds as the test set (marked by the symbol “*”)[27]. We selected compound No. 22 (pIC50 = 9.699, Fig. 2) as the template, which has the highest activity. After selecting the common Skeleton(Fig. 2), the superimposed structure of all compounds is shown in Fig. 3.
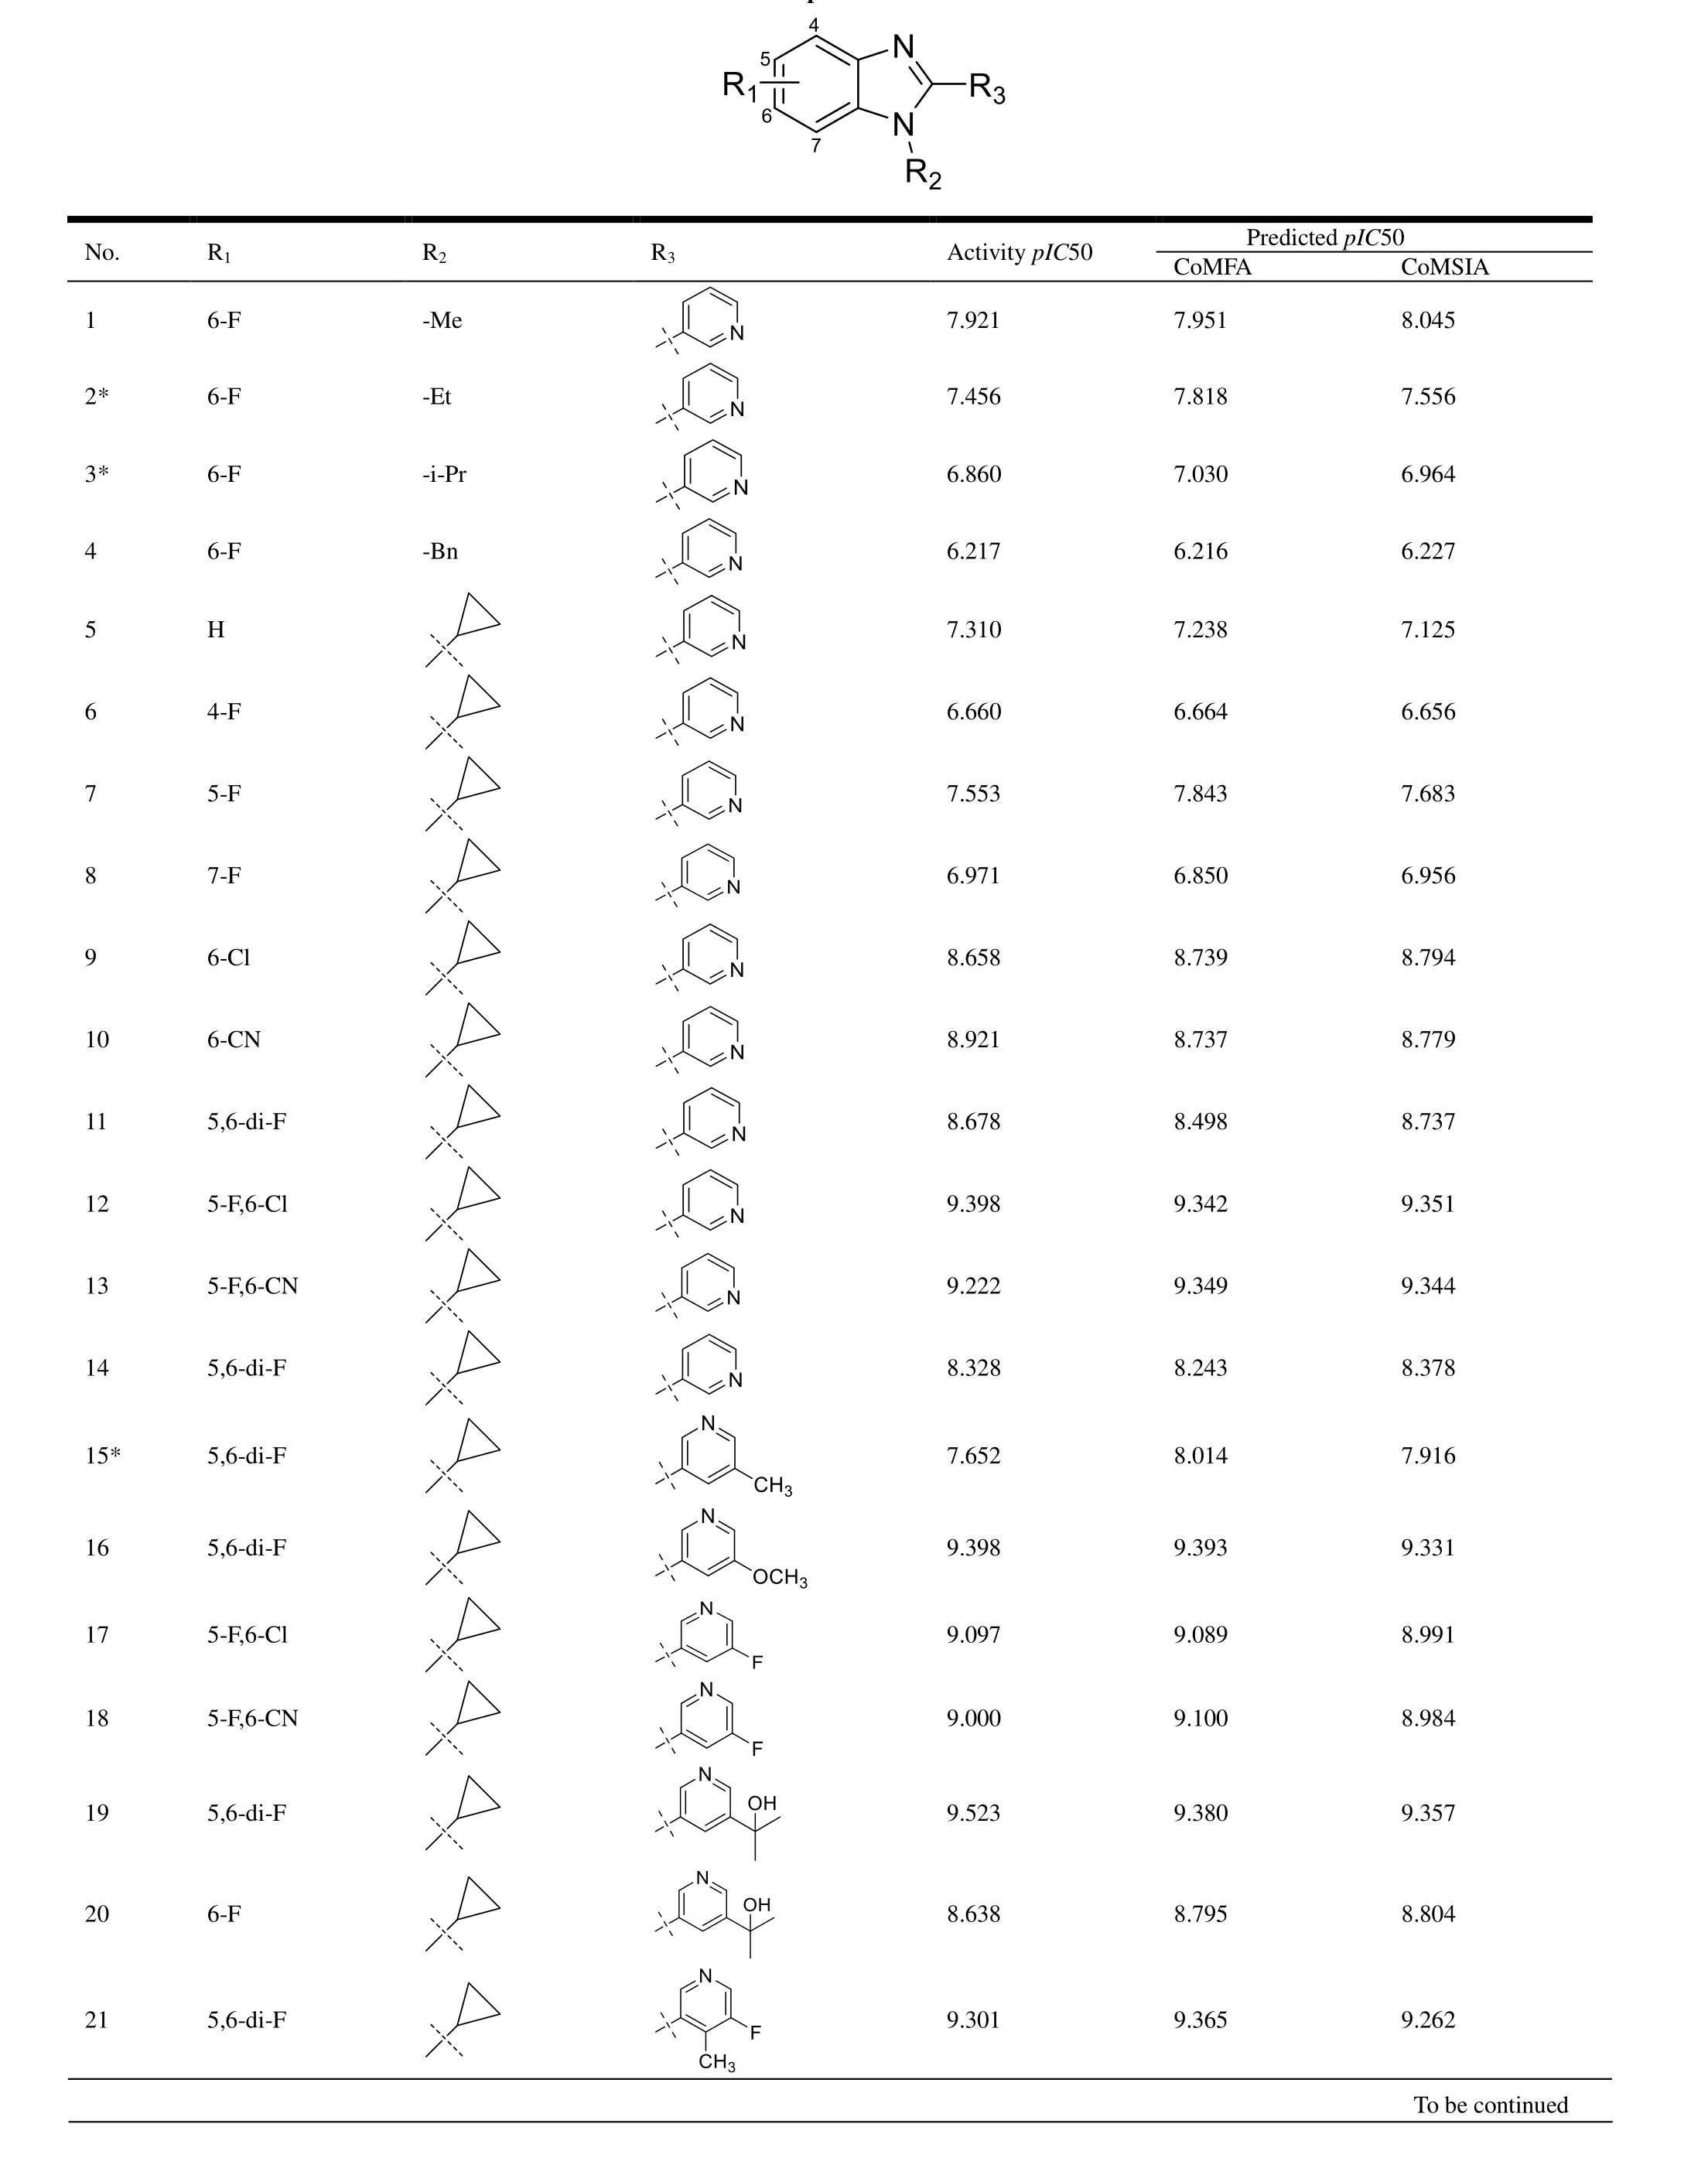
Table 1. Structures and Respective Activities of CYP11B2 Inhibitors

“*” means the test set
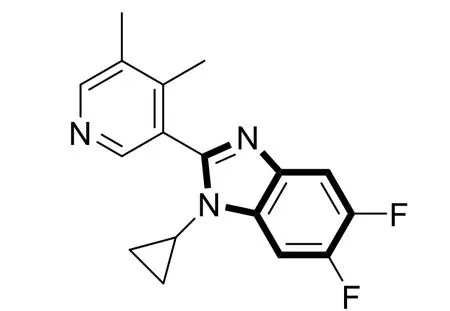
Fig. 2. Structure of compound No. 22
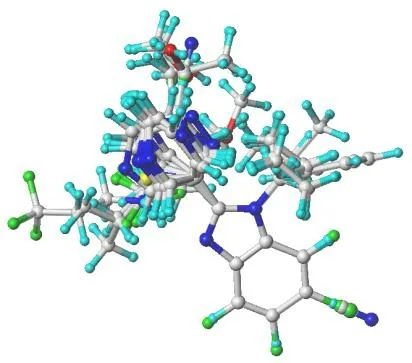
Fig. 3. Alignment of CYP11B2 inhibitors
SYBYL-X 2.1.1 software was applied in the preparation of CoMFA and CoMSIA models. In partial least squares (PLS)analysis, the CoMFA and CoMSIA descriptors are invoked as independent variables, while thepIC50 value is used as a dependent variable for the development of a 3D-QSAR model. The correlation coefficient (Q2) and the best principal component value (N) of cross validation are determined by leave one method (LOO) for cross validation. We performed non-cross-validation using previously acquired N values to estimate the general determination factor (R2). In addition,the estimated standard error (SEE) and Fischer statistical values (F) were determined[28]. Normally, parameterq2is greater than 0.5 and the model is acceptable[29,30]. The value ofR2ranged from 0.5 to 1.0, indicating that the model fit well[31]. The accuracy of the prediction ability of the model is verified by the external validation of the test set[30].
2. 2 Y-randomization

In order to ensure the robustness of the established 3DQSAR model, the opportunity correlation is avoided, the robustness of the model is controlled, and the Y randomization test is carried out[32]. In this verification method, the active values of the molecules studied (pIC50) are rearranged randomly throughout the learning set and a new model is derived.The values ofQ2andR2calculated by the new model are lower than those of the original model, and the operation is repeated several times. If the values ofQ2andR2of the model are low,the appropriate calibration results are not due to chance, but rather to the robustness of the QSAR model.
2. 3 External validation
After the QSAR model was established, it should be validated internally and externally to ensure that the constructed model is robust, reliable, stable, and predictable, and then used to predict the activity of novel compounds[33]. A strictly reliable 3D-QSAR model requires both internal and external validation. The credible 3D-QSAR model also must satisfy the following conditions: the predictedr2(r2pred> 0.5) and external standard deviation error of prediction (SDEPext) in Cruciani-Baroni’s method[34,35].
2. 4 Applicability domain (AD) of the QSAR models
Although the QSAR model works very well, it is not helpful to evaluate the suitability of all compounds for the model[27]. Therefore, the model application domain (AD) must be identified when using the constructed QSAR model to screen compounds, and the availability of compounds shall be considered only within the scope of the QSAR model application domain. The application domain methods for evaluating the model mainly include lever distance, residual standard deviation and similarity distance[36]. Here we used the leverage distance method to evaluate the application domain of the model. For a regression QSAR model, a straightforward evaluation of whether a compound is out of the model application domain is its leverage distance to the model,hi[37]:

Wherein,xiis the descriptor row vector of the predictive compound, the matrixXn*k-1is the descriptor variable matrix of the compound modelkofntraining sets, and the superscriptTrepresents the transpose of matrix/vector. The upper limit ofH*is usually set as ±2 or 3K/N, whereNis the number of samples in the training set andKis the parameter of the model. The lever distance is higher than the upper limitN*value indicates that the predicted response is the additional inference result of the model, so the forecast compound is not within the application domain of the QSAR model[37].
2. 5 DFT calculation
Density functional theory (DFT) is part of the powerful tools for dealing with the electronic structure and geometry of interacting multi-electron systems[38,39]. In order to evaluate the details of the electronic structure of the energy levels of small molecular orbitals, and accurately calculate various electronic properties, we calculated DFT. Gauss View 6.0 program and density functional theory were used to study the relevant properties of small molecule compounds. Because B3LYP/6-31G** can reach a good balance point in terms of time and accuracy, the B3LYP/6-31 G** method and basis set are used in the calculation[40]. We introduced the two compounds with the highest activity and the highest predicted activity into the Gauss View 6.0 platform, and calculated HOMO (Highest Occupied Molecular Orbitals), LUMO(Lowest Unoccupied Molecular Orbital) and MESP (Molecular Electrostatic Potential). The MESP, HOMO and LUMO of the molecular frontier orbitals of all optimized structures have been studied by GaussView 6.0 program[41]. The electrostatic potential V(r) at the r point of the molecular system, the nuclear charge (ZA) at (RA) and the electronic density ρ(r) are used to test the molecules with functional points as follows[42]:


2. 6 Molecular docking
The complex crystal structure of aldosterone synthase and small molecules comes from the PDB database(https://www1.rcsb.org/, PDB ID: 4DVQ, 2.49 Å resolution).The docking of CYP11B2 inhibitor and aldosterone synthase(4DVQ) was simulated by the Surflex-Dock module in SYBYL-X 2.1.1 software. Before docking, the protein needs to be pre-treated. We used SYBYL-X 2.1.1 software to preprocess 4DVQ, including processing the ends of the protein backbone and repairing the missing side chains, as well as adding hydrogen atoms, removing water molecules, and adding charges to 4DVQ[30]. Next, we constructed a pair of interface bag based on 4DVQ's exhibiting small molecule ligands,as shown in Fig. 4. The original molecule was re-docked to binding site, and RMSD between the redocking molecule and the original ligand was analyzed to verify the reliability of the docking method. After docking, the Surflex-Dock module was utilized to score the interactions between the receptor and molecules. Finally, binding posture with the highest inhibitory activity was selected and the corresponding complex was output and analyzed in Discovery Studio 3.0 software and PyMOL software (https://pymol.org/2/).

Fig. 4. Active pockets produced after protein (4DVQ) pretreatment. The yellow stick represents the original ligand (1CA), and magentas stick represents HEM
2. 7 Molecular dynamics simulation
Molecular dynamics simulation was executed with the AMBER16 package[43,44]. Receptor loaded the Amber ff14SB force field[45]and the ligand loaded the general Amber force field (GAFF)[46], and the whole complex system was solvated in TIP3PBOX (Buffer ≥ 10.0 Å) and then the system was electrically neutral by adding sodium and chloride ions.
We optimized the system to avoid unreasonable structural areas in the system, and then gradually heat the system from 0 to 300 K for the heating phase. Finally, the temperature was kept at 300 K in the next stage. The entire MD process took 2 fs as the time step. Periodic boundary conditions were applied to hold constant temperature and pressure. The Langevin dynamics method was used to adjust the temperature at a collision frequency of 2 ps-1and the pressure was set on 1 atm under each anisotropic pressure scale protocol. The Particle Mesh Ewald (PME) method was employed to deal with long-range electrostatics and the range of actual cutoff spatial interaction was less than 1 nm. All covalent bonds involving hydrogen atoms were restricted by the SHAKE method. Next,100 ns MD simulation was performed, and the trajectory was saved every 2 ps.
The MM/GBSA algorithm was used to process the saved MD simulation trajectories and calculate the binding energy with crystal complexes of different ligands[47,48]. A total of 100 frames were collected from the last 90 to 100 ns simulation to calculate the average binding energy. Formula is as follows:

Among them, ΔGBindis the binding free energy,Gcomplex,Gprotein,andGligandare related free energies, and ΔGsolrepresents the total mechanical energy of molecules in vacuum,which can be further divided into electrostatic contribution(ΔEele) and van der Waals force (ΔEvdw). The term can be calculated using molecular mechanics methods. ΔESOLis the solvation energy, including the polar solvation energy (ΔEGB)calculated by the generalized birth (GB) approximation model and the non-polar part (ΔESURF) obtained by fitting the solvent accessible surface area (SASA) and paired linear combination overlap (LCPO) model. In addition, the energy of each residue is broken down into the main chain and side chain atoms. The energy breakdown can be analyzed to determine the contribution of key residues to the binding.
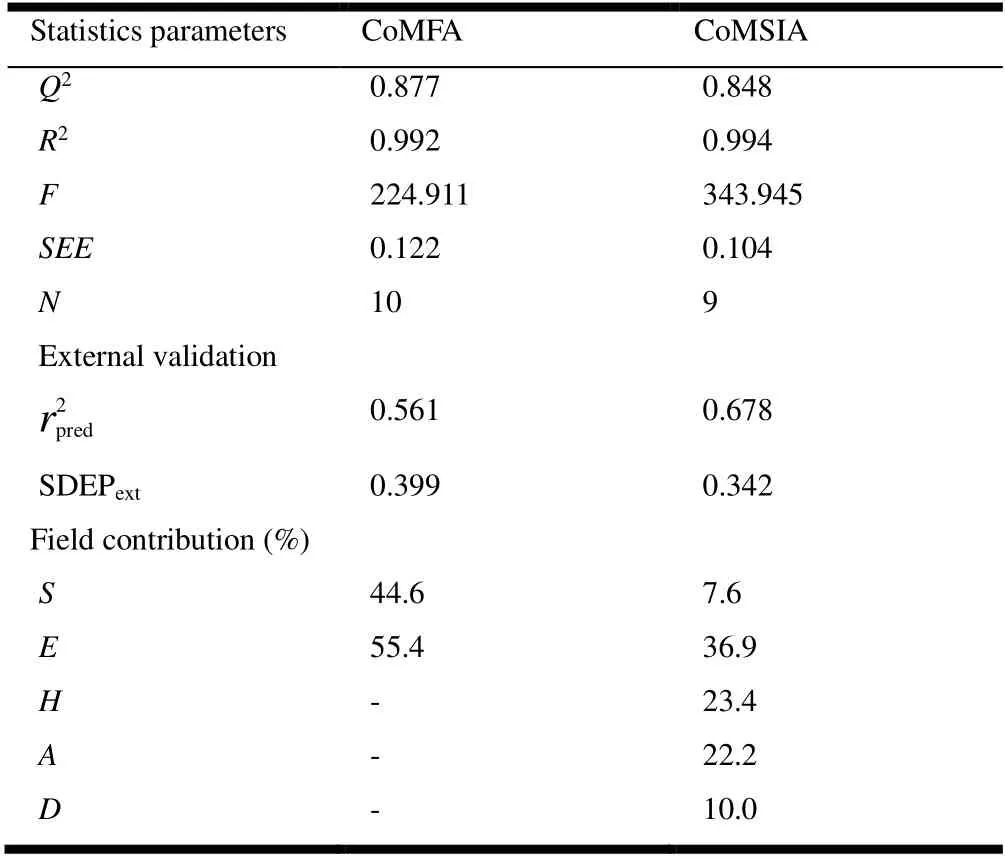
Table 2. PLS Statistics of CoMFA and CoMSIA Models

Fig. 5. pIC50 of predicted versus actual activity of the training and test sets. (A) CoMFA (B) CoMSIA
3 RESULTS AND DISCUSSION
3. 1 3D-QSAR results and analysis
The three-dimensional QSAR model based on atoms was successfully established by using the partial least-twomultiplication regression analysis, and iso-potential maps were used to analyze the favorable and unfavorable regions,respectively. The visualization of the equipotential maps was helpful for us to analyze which group changes can increase the activity of the compound used to design new compounds.The results of the 3D-QSAR model are presented in Table 2,which has achieved an excellent correlation coefficient (R2>0.9) of 0.992 and 0.994 with standard error of estimate (SEE)of 0.07, and a predicted coefficient (Q2> 0.5) of 0.877 and 0.848, with Fisher values of 223.911 and 343.945. The predicted model summary of statistical data is listed in Table 1.The scatter plot of the XY axis of the correlation between actualpIC50 and predictedpIC50 is represented in Fig. 5(a, b)for the CoMFA and CoMSIA models. The external validation results are shown in Table 2, and we regard the 3D-QSAR model as responsible with good statistical significance.
The COMFA model is exhibited in Figs. 6a and 6b. In the steric field (proportion of 44.6%), the green contours present the contribution to a high steric tendency, while yellow contours represent low steric effect. In Fig. 6a, there is a larger volume of yellow equipotential region at the position of the R3group, which indicates that the volume of the group decreased here will be beneficial to enhance the activity. In the electrostatic field, the red contour indicates that it is advantageous to increase the negative charge group, while the blue one shows that the increase in the positive charge group is favorable. In Fig. 6b, the red contour around the R1group exposing a negatively charged substituent at this position might improve the activity and the entire compound is mainly surrounded by red patches. The CoMFA model suggests a little group of the R3substituent and it should be considered as negatively charged groups. CoMSIA models contour maps of hydrophobic and H-bond acceptor fields are shown in Fig. 6c and 6d. COMSIA contour maps at electrostatic and stereoscopic fields of compound No. 22 showed similar results from COMFA model, and the effect of hydrogen bond to the body field is much smaller than that of hydrophobic field and H-bonded subject field, so only the latter two fields are discussed in this paper. In Fig. 6c, the white figure takes up more than half of the compound, indicating that the compound should have hydrophilic groups to increase its inhibitory activity, especially the R3group. In Fig. 6d, R3substituent indicates that the addition of hydrogen bond donor here is not conducive to the improvement of activity. All in all, the introduction of small-volume groups near the R3substituent,or the introduction to negatively charged groups near R1replacement bases or the groups capable of accepting hydrogen bonds or the hydrophilic groups near R3, can help to increase the activity of inhibitors.

Fig. 6. Three-dimensional equipotential maps of CoMFA(a, b) and CoMSIA(c, d) with No. 22.(a) stereo, (b) electrostatic, (c) hydrophobic and (d) hydrogen bond acceptor
3. 2 Y-randomization analysis
The robustness of the 3D-QSAR model was verified by the Y-random method, avoiding the chance correlation. In the current case, 60 random tries were executed for the final developed 3D-QSAR models. Y-randomization validation produces models that do not correspond to the initial model. TheQ2andR2values of the new QSAR model are indeed very low. Therefore, the possibility of random correlations was ruled out. The randomly arranged bioactivities were used for the test. All the results are summarized in the Table 3.
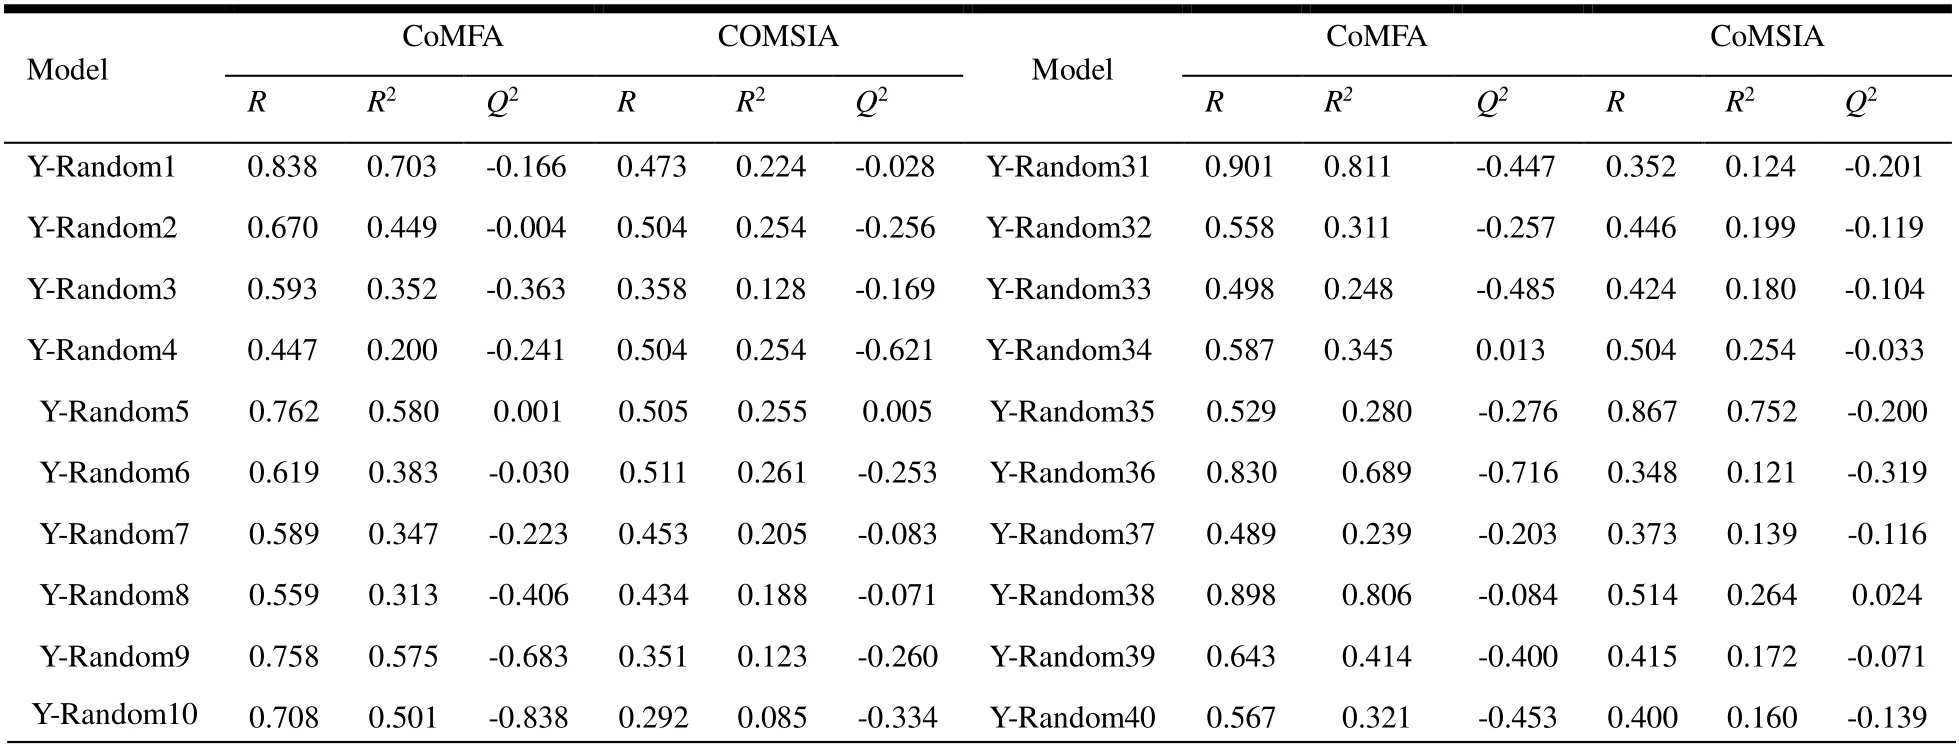
Table 3. Q2 and R2 Values Generated by Y-randomization and the Thresholds of the Two Models

Y-Random11 0.570 0.325 -0.442 0.381 0.145 -0.103 Y-Random41 0.405 0.164 0.067 0.422 0.178 -0.051 Y-Random12 0.471 0.222 -0.440 0.352 0.124 -0.397 Y-Random42 0.854 0.730 -0.536 0.386 0.149 -0.216 Y-Random13 0.959 0.919 -0.255 0.369 0.136 -0.293 Y-Random43 0.811 0.658 -0.401 0.474 0.225 -0.058 Y-Random14 0.605 0.366 -0.191 0.511 0.261 -0.039 Y-Random44 0.652 0.425 0.011 0.489 0.239 -0.062 Y-Random15 0.934 0.872 0.277 0.934 0.872 0.250 Y-Random45 0.823 0.678 -0.884 0.436 0.190 -0.144 Y-Random16 0.673 0.453 -0.998 0.261 0.068 -0.358 Y-Random46 0.622 0.387 -0.105 0.797 0.636 -0.128 Y-Random17 0.733 0.538 -0.213 0.428 0.183 -0.108 Y-Random47 0.651 0.424 0.105 0.427 0.182 -0.084 Y-Random18 0.772 0.596 0.037 0.600 0.360 0.142 Y-Random48 0.556 0.309 -0.646 0.470 0.221 -0.077 Y-Random19 0.778 0.606 -0.013 0.522 0.273 -0.016 Y-Random49 0.675 0.456 -0.139 0.498 0.248 -0.172 Y-Random20 0.509 0.259 -0.219 0.446 0.199 -0.081 Y-Random50 0.488 0.238 -0.181 0.436 0.190 -0.011 Y-Random21 0.864 0.746 -0.009 0.495 0.245 -0.043 Y-Random51 0.663 0.439 -0.431 0.308 0.095 -0.154 Y-Random22 0.591 0.349 -0.074 0.505 0.255 -0.151 Y-Random52 0.835 0.697 0.201 0.801 0.642 0.160 Y-Random23 0.594 0.353 -0.067 0.506 0.256 -0.002 Y-Random53 0.941 0.886 0.469 0.965 0.931 0.456 Y-Random24 0.397 0.158 -0.644 0.266 0.071 -0.274 Y-Random54 0.680 0.462 -0.527 0.418 0.175 -0.137 Y-Random25 0.521 0.271 -0.312 0.367 0.135 -0.215 Y-Random55 0.549 0.301 -0.192 0.465 0.216 -0.322 Y-Random26 0.832 0.692 0.081 0.868 0.753 0.023 Y-Random56 0.884 0.781 -0.215 0.918 0.843 -0.243 Y-Random27 0.635 0.403 -0.091 0.542 0.294 -0.071 Y-Random57 0.490 0.240 -0.236 0.991 0.982 -0.123 Y-Random28 0.537 0.288 -0.219 0.395 0.156 -0.177 Y-Random58 0.404 0.163 -0.798 0.624 0.390 -0.749 Y-Random29 0.636 0.404 -0.417 0.397 0.158 -0.209 Y-Random59 0.533 0.284 -0.294 0.467 0.218 -0.245 Y-Random30 0.570 0.325 -0.133 0.410 0.168 -0.035 Y-Random60 0.655 0.429 -0.457 0.425 0.181 -0.054 Average RRand R2 Rand Q2 cvloo cRp2 Threshold < R < R2 < Q2 > 0.5 CoMFA-SE 0.657 0.453 -0.263 0.731 CoMSIA-SEHAD 0.497 0.276 -0.133 0.0845

Fig. 7. Williams plot for CoMFA(a) and COMSIA(b) models(The leverage threshold h* = 0.146/0.366 and standardized residual σ = ±2 or 3)
3. 3 Applicability domain analysis
The applicability domain (AD) obtained by the leverage distance method is the Williams diagram (Fig. 7), where the standardized residuals (σ± 2 or 3) and the leverage threshold(h* = 0.146/0.366) are plotted. As Fig. 7b shows, it is obvious that there is one compound outlier of the test set; the chemical is identified as an outlier for the COMSIA model. Other compounds have a standard deviation in the out of ±2 or 3.This mistaken prediction might perhaps be accredited to wrong experimental data or the structures of these compounds.
3. 4 DFT analysis
The model compound (No. 22) and the new derivative (No.a2) were used for orbital energy level and electron cloud density analysis. The results show these two compounds have unique orbital energy levels and electron cloud properties. In Fig. 8, the MESP diagram shows the MESP curves of the two compounds, in which the negatively charged potential is represented in red and the positively charged region in blue. In drug design, improving the complementarity of electrostatic potential can improve the affinity and selectivity of ligands;and the dominant compounds can be judged by comparing the MESP of different molecules. From these results, obviously the positive and negative charge distributions on the surface of the model compound and the newly designed compound (No. a2) are more uniform and complementary. In addition, it also verifies the credibility of the 3D electrostatic equipotential map constructed by the QSAR model. When the molecules interact in the form of charge transfer complex, the HOMO energy can be used as a measure of the electrongiving ability of the molecule, while the LUMO energy of the electron-receiving ability, that is, the electron transfer from the HOMO of the donor to the LUMO of the acceptor. The results of No. 22 and No. a2, the HOMO’s outcome ranges from -5.660 to -6.011 and LUMO -0.802 to -1.084, and frontier orbital energy difference (HOMO-LUMO gap, HLG)of -9.337 and -15.656 are tabularized in Table 4. The energy gap of the compound is the energy difference (HOMO-LUMO)between HOMO and LUMO. It is an important parameter for the excited transition of reactants. The energy levels and electron cloud density distribution of HOMO and LUMO of each molecule were analyzed (Fig. 8). In compounds No. 22 and No.a2, most of the HOMO orbital electrons appear on the common skeleton benzimidazole ring, while the LUMO orbital electrons are concentrated in other parts (except the benzimidazole ring).Therefore, for compounds No.22 and No. a2, the electron transitions are transferred from the benzimidazole ring to other groups (except the imidazole ring), indicating an obvious charge transfer process, which indicates that the benzimidazole ring has strong electrical absorptivity, therefore resulting in an increase in the electron cloud density of the compound as a whole.

Table 4. HOMO, LUMO and Energy Values for Compounds
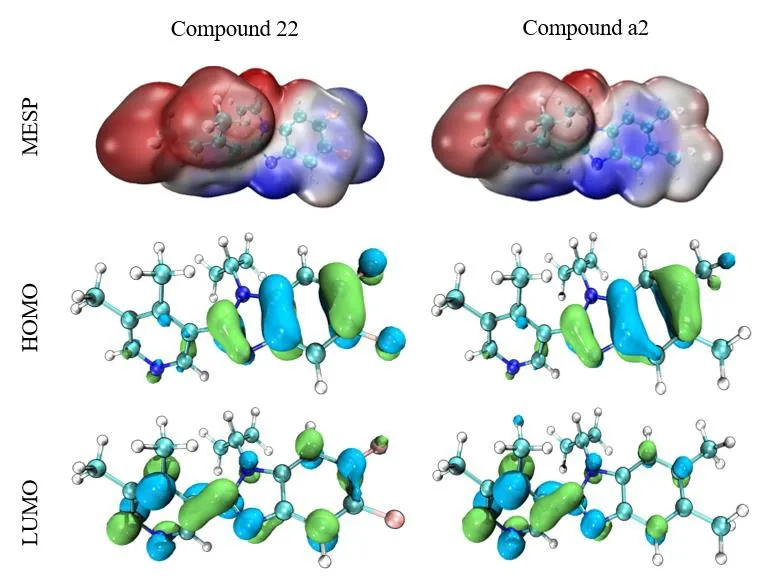
Fig. 8. MESP superimposed onto a surface of constant electron density, HOMO and LUMO
3. 5 Molecular docking results and analysis
In the present studies, we employed molecular docking calculations for compound with the highest biological activity(No. 22) and that with the lowest biological activity (No. 04),respectively. Before docking, we calculated the root-meansquare deviation of the redocked conformation of original ligand (1CA, Fig. 9) and the value of RMSD is 0.76Å (< 2.0 Å), which indicated the generated docking scheme is reliable and can be used for subsequent research[49]. The summarized results of docking calculations are presented in Table 5. The highest biological activity (No. 22,pIC50 = 9.699) showed promising docking score (Docking Score = 7.581) surrounded by residues Arg120, Phe130, Ala313, Gly314, Val378,Cys450, Phe487 and HEM. However, compound No. 04 with the lowest bioactivity (pIC50 = 6.217) had only 3.8889 docking scores near Arg110, Phe130, Val378, Gly379, Phe381 and HEM residues. The binding mode and interaction between compound No.22/No.04 and aldosterone synthase are shown in Fig. 10.
As shown in Fig. 10b, compound No. 04 was inserted into the binding cage surrounded by Arg110, Phe130, Val378,Gly379, Phe381 and HEM. The 6-position fluorine atom on the benzimidazole ring of the nucleus forms a hydrogen bond with the guanidine group NH of Arg110, while the nitrogen atom on the R3substituent makes a H-bond with the amino group of Gly379. It is also seen that the 6-position nitrogen atom on the benzimidazole ring forms a conventional hydrogen bond with Gly379. At the same time, an unfavourable bump is formed between the carbon atom on the benzimidazole loop and the amino acid residue Phe381. The aromatic ring of compound No. 04 forms a stableπ-πstacking interaction of Phe130, and formsπ-πshaped interaction andπ-alkyl interaction with HEM, including benzimidazole ring and pyridyl. In contrast to compound No. 22 in Fig. 10a, the 6-position fluorine atom makes hydrogen bond with the NH of Arg120. And benzimidazole loop produces amide-πstacking interaction with Ala313 and Gly314, while two methyl groups at pyridyl makeπ-alkyl and alkyl interactions with Val378 and Phe487, respectively. The cyclopropyl of compound No.22 forms a hydrophobic interaction with the aromatic ring of Phe130. The difference is perhaps that the R3substituent formsπ-sulfur interaction with Cys450, and only cyclopropyl and HEM produce weakerπ-alkyl and alkyl interactions. It is possible that the weaker interaction with HEM and the difference in amino acids caused the two compounds to have such diverse activities. This also explains why hydrophobic interactions can enhance the potency. At the same time, this means that the hydrophobic interaction between the inhibitor and the protein can make it integrate well into the human receptor and form the most durable energy for the drug receptor[50,51].
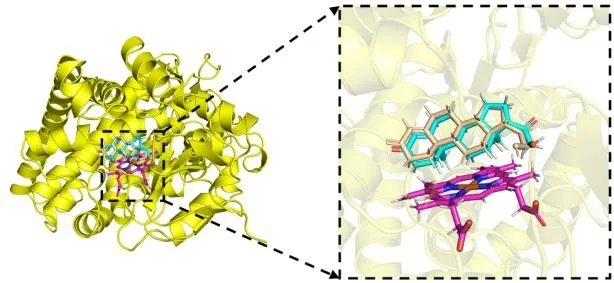
Fig. 9. Overlay of the original ligand docked (1CA, shown as cyan sticks)and re-docked (shown as wheat sticks) in the aldosterone synthase active site

Fig. 10. Interaction between protein and molecule. (a) No. 22, (b) No. 04. The small molecule ligand is shown as green sticks and HEM as magentas sticks. π-π interactions are represented by pink dashed lines and hydrogen bond is the yellow dashed lines

Table 5. Molecular Interactions between Compounds and 4DVQ
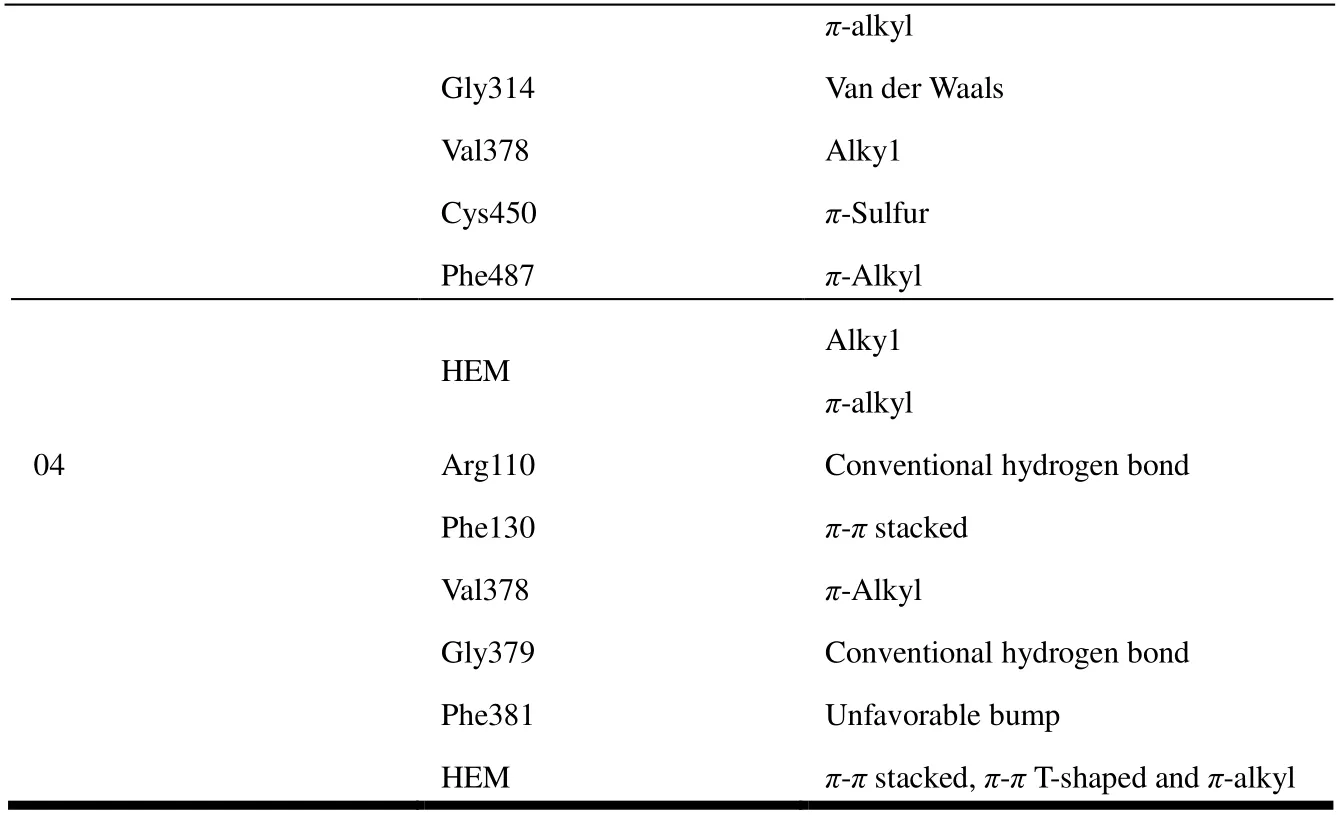
π-alkyl Gly314 Van der Waals Val378 Alky1 Cys450 π-Sulfur Phe487 π-Alkyl HEM Alky1 π-alkyl 04 Arg110 Conventional hydrogen bond Phe130 π-π stacked Val378 π-Alkyl Gly379 Conventional hydrogen bond Phe381 Unfavorable bump HEM π-π stacked, π-π T-shaped and π-alkyl
3. 6 Molecular design and activity prediction of novel derivatives
To begin our investigation into novel CYP11B2 inhibitors featuring a benzimidazole template, we modified some groups of compound No. 22 with various substituent groups while keeping the benzimidazole ring structure according to the information obtained from molecular docking and QSAR model. Table 6 lists the structure and predictedpIC50 value of the novel CYP11B2 inhibitor compounds. The results show that the five newly compounds designed have betterpIC50 values than their model, of which No. a2 is most likely to become the lead compound, and the result of molecular docking further improves the reliability of the obtained compound.
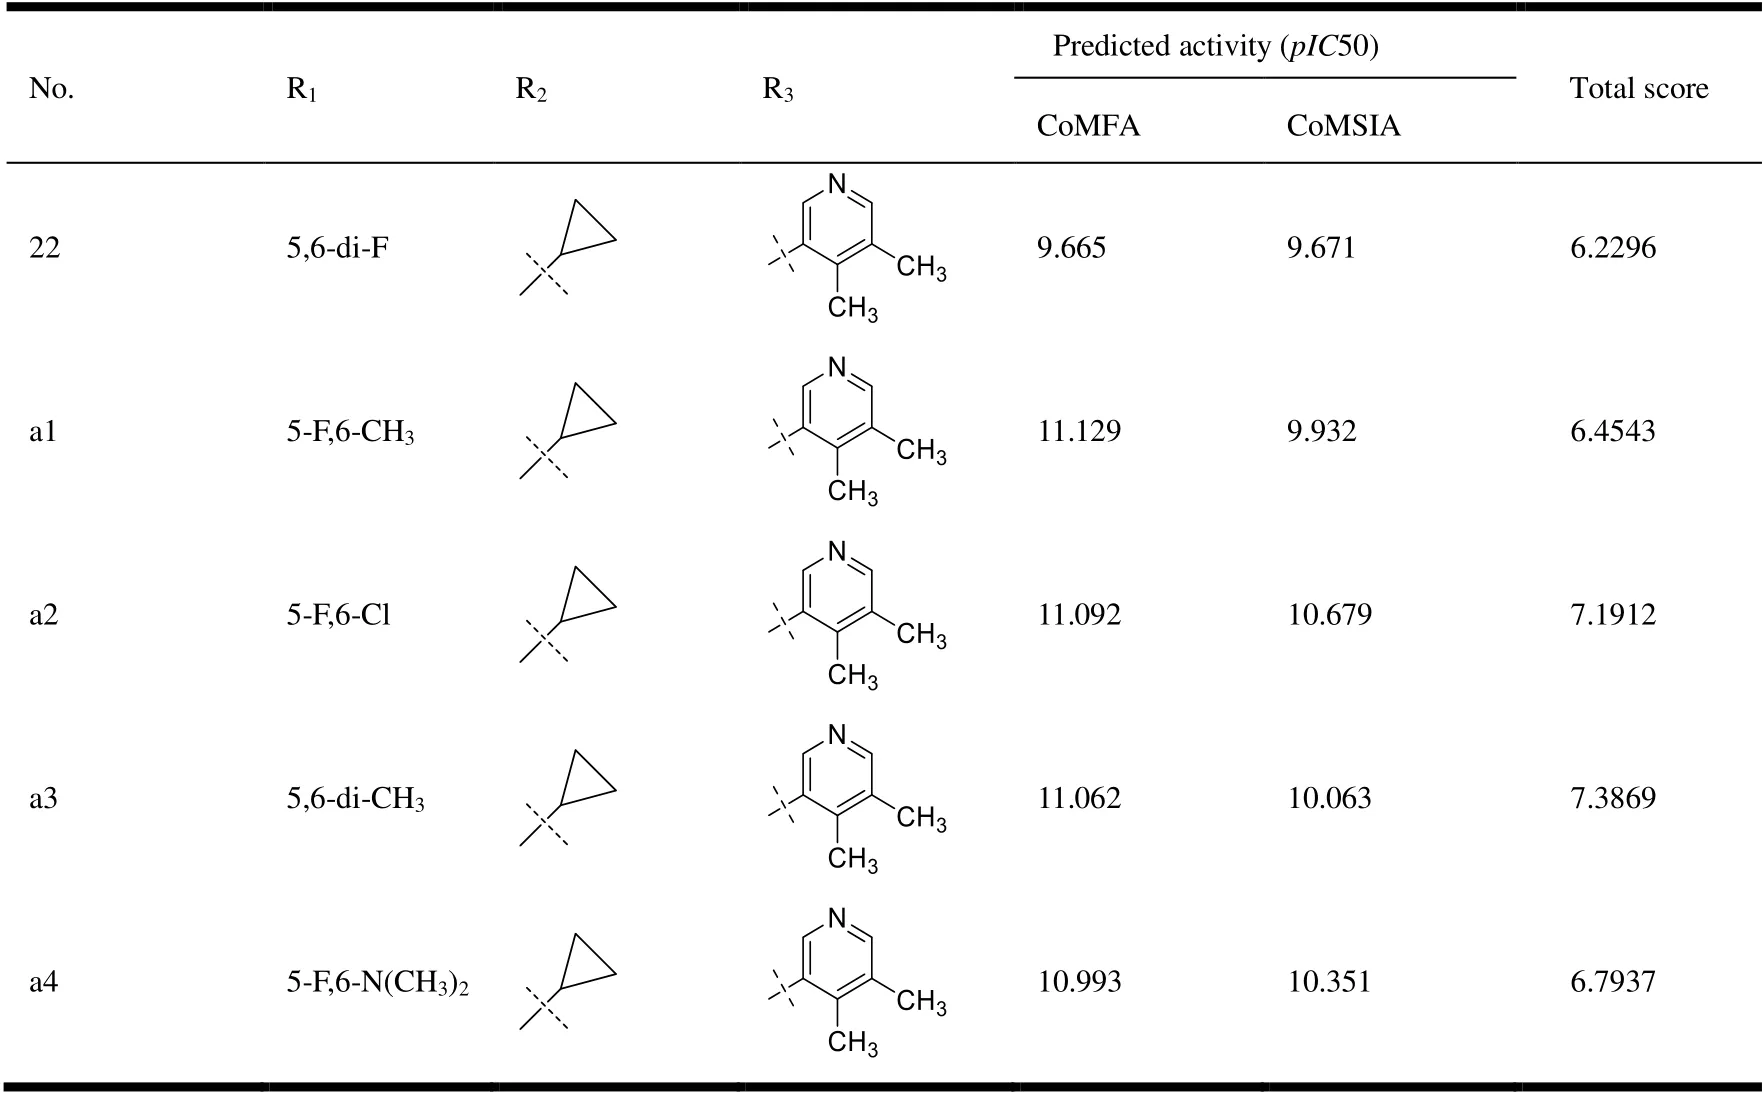
Table 6. Structures and Predicted pIC50 of Novel CYP11B2 Inhibitors
3. 7 In silico toxicity analysis
ADME/T, including absorption, distribution, metabolism,elimination and toxicity, is a critical parameter that is commonly used in clinical trials and the selection of the development of drugs[52]. We used the online tool SwissADME(http://www.swissadme.ch/index.php) to evaluate the synthetic availability of new compounds[53]. For uploaded compounds, the web server can predict the percentage of absorption of the drug in the human intestine. Radar maps of compounds that indicate drug similarity are important for identifying compounds with poor absorption and permeability and for addressing parts of the barrier range in which compounds must demonstrate their drug ability. To accurately examine molecules, we used drug sample indices to compare Lipinski 5 criteria for the selection of oral bio-use drugs (Table 7).
Each designed compound complies with Lipinski rules. In addition to the five rules, the MW independent rule accurately predicts the oral bio-utilization of compounds. According to the radar map (Fig. 11), all compounds show good drug similarity.

Table 7. No. 22 and Its Derivatives to the Computational Parameters of Oral Bioavailability (Lipinski’s Rule of Five)
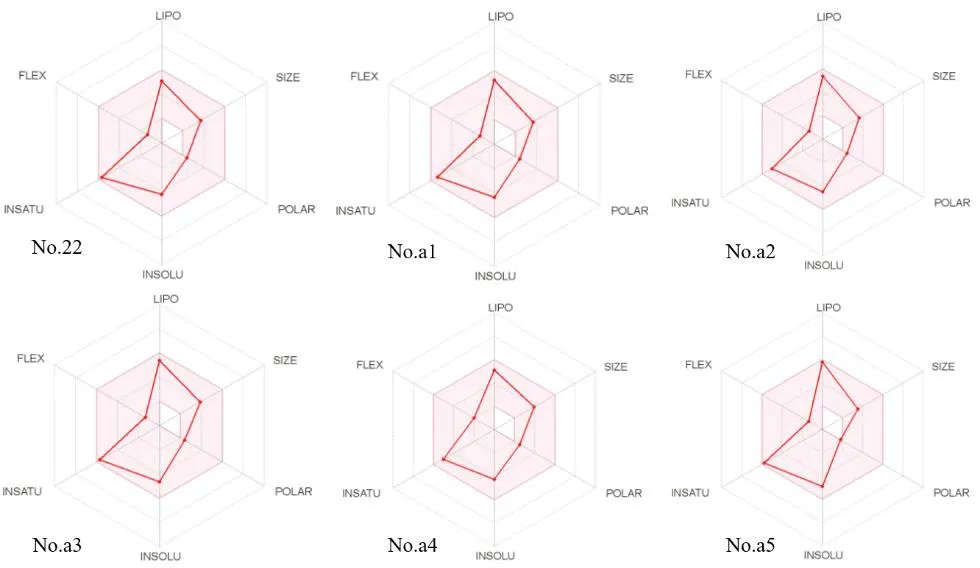
Fig. 11. Radar maps of compound No. 22 and its derivative
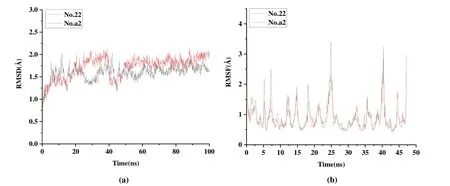
Fig. 12. RMSD and RMSF of complexes docked with compound No. 22/a2 for 100 ns simulations
3. 8 Molecular dynamics simulation results and analysis
To further verify whether newly designed inhibitors can bind well to aldosterone synthase, we ran 100 ns MD simulation on the template compound No. 22 and the most likely candidate compound molecule No. a2. The root mean square deviation (RMSD) and the root mean square fluctuation(RMSF) of the complex, the ligand and the binding pocket(defined as residues within 5 Å around the ligand) were calculated to research the stability of the structure and residues in the system. Fig. 12 shows RMSD and RMSF after MD simulation. As shown in Fig. 12a, the RMSD of the proteincompound No. 22/No. a2 complexes fluctuated around ~1.75 Å after 40 ns simulation. Although there is a large fluctuation in compound No. a2 (Fig. 12a), the complex of No. a2 and protein also stabilized at ~1.75 Å after 50 ns. The RMSD of two complexes fluctuated within a range of less than 2.75 Å in the late simulation stage. The fluctuating trend of amino acid residues measured by calculating the RMSF parameters is given in Fig. 12b, indicating that the position changes of the residues are relatively stable with the extension of the simulation time. Taking the template compound as a reference, motion intensity of the newly designed molecule tends to be stable and the fluctuation is small. This phenomenon indicates that the binding of the novel molecule to the protein is more stable.
Then as showed in Figs. 13 and 14, we compared the interaction before and after MD simulation. Compounds No. 22 and No. a2 both form a hydrophobic interaction between similar amino acid residues, which are marked with a dotted line. Figs. 13 and 14 show the protein-ligand interaction diagrams of compound No.22/No.a2 before and after molecular dynamics. It can be seen from the figures that the amino acid residues of the interaction between the small molecule ligand and the protein are roughly similar, which also confirms the result of molecular docking, that is, the interaction between the aldosterone synthase inhibitor and the protein is mainly based on the hydrophobic interaction between the molecules.Compound No. 22 is located in the cleft between protein and HEM (Fig. 13), in a pocket surrounded by residues Arg110,Phe130, Ala313, Phe381, Leu382, Glu383, and Phe487 after 100 ns of molecular dynamics. As shown in Fig. 13b, the difference lies in that compound No. 22 and Arg110 formπcation interaction instead of a hydrogen bond. The 6-position fluorine atom forms a hydrogen bond with Glu383, while the methyl group on the pyridyl group only generates alkyl interaction with HEM.

Fig. 13. Interaction between 4DVQ and compound No. 22 before (A) and after (B) 100ns MD simulation

Fig. 14. Interaction between 4DVQ and compound No. a2 before (A) and after (B) 100 ns MD simulation
The protein-ligand interaction diagram of the new compound No. a2 designed based on the 3D-QSAR model and the results of molecular docking before and after molecular dynamics are shown in Fig. 14, a diagram of the interaction between compound No. a2 and protein. Fig. 14 depicts that compound No. a2 is surrounded by amino acid residues Trp116, Phe130, Met238, Phe381, Cys450, Phe487 and Ile488, and generates a hydrophobic bond of different lengths with each amino acid residue. The molecular docking effect of the new derivative compound No. a2 is better than that of the template compound No. 22 (Table 5). The protein-ligand interaction diagrams in Figs. 13 and 14 show that the former has more important amino acid residues than the template compound, such as Ile488. Moreover, Ile488 can also formππhydrophobic interactions with small molecule ligands. This also explains the importance of the amino acid residues Phe130, Ala313, Phe487 and Ile488.

Fig. 15. Contributions of free energy calculated by MM/GBSA for key residues of 4DVQ (A) No. 22 and (B) No. a2
After MD simulation, the MM/GBSA method was used to decompose the binding free energy to find the key residues in the binding process of 4DVQ and inhibitors. The binding free energy and various energy items in the MD process are shown in Fig. 15 and Table 8. Compared with compound No.22, compound No. a2 has better binding energy, forms key residues, and has more amino acids, indicating that it may have better activity, which is consistent with its larger molecular docking score.

Table 8. Binding Free Energies and Various Energy Terms (kcal/mol)
4 CONCLUSION
To find novel and highly effective anti-hypertension drugs CYP11B2 inhibitors, based on the CoMFA and CoMSIA methods we established a 3D-QSAR model by using molecular docking. The interaction between compounds and proteins was analyzed, and the activities of 5 novel CYP11B2 inhibitors were designed and predicted. From 3D-QSAR model's contour map analysis, the contribution value of the stereo field of the molecule is larger than that of the electrostatic field, and the effects of hydrophobic and hydrogen bond receptor fields on inhibitor molecular activity cannot be ignored. The introduction to small-volume groups near the R3substituent or the introduction to negatively charged groups near R1replacement bases or the groups capable of accepting hydrogen bonds or the hydrophilic groups near R3, can help to increase the activity of CYP11B2 inhibitor compounds. In addition, we also found that the interaction mode of compounds and proteins is mainly hydrogen bonding interaction.Some amino acids played an important role in combining protein and inhibitor, such as Phe130, Ala313 and Phe487.The predicted activity values of the newly designed compounds were higher than the respective templates. In addition,these compounds have shown beneficial results of the synthesis feasibility and ADMET evaluation. In summary, through construction, verification and analysis of the 3D-QSAR model, combined with the analysis of the mechanism of molecular docking, new ideas and directions for the subsequent development of novel anti-hypertension drugs are provided.
杂志排行
结构化学的其它文章
- Structural and Electronic Properties of Lutetium Doped Germanium Clusters LuGen(+/0/-) (n = 6~19):A Density Functional Theory Investigation①
- QSAR Models for Predicting Additive and Synergistic Toxicities of Binary Pesticide Mixtures on Scenedesmus Obliquus①
- Preparation, Crystal Structure and Fungicidal Activity of N-(5-(benzofuranol-7-oxymethyl)-1,3,4-thiadiazol-2-yl)amide Compounds①
- Antibiotic Silver Particles Coated Graphene Oxide/polyurethane Nanocomposites Foams and Its Mechanical Properties①
- Planar Tetracoordinate Carbon in 6σ + 2π Double Aromatic CBe42- Derivatives①
- Manganese(II) and Copper(I) Compounds Based on Two Derivatives of Imidazo[1,5-a]pyridine: Synthesis,Structures, Magnetic Properties, and Catalytic Activity①
