On the System Performance of Mobile Edge Computing in an Uplink NOMA WSN With a Multiantenna Access Point Over Nakagami-m Fading
2022-04-15VanTruongTruongVanNhanVoDacBinhHaandChakchaiSoIn
Van-Truong Truong, Van Nhan Vo, Dac-Binh Ha, and Chakchai So-In,
Abstract—In this paper, we study the system performance of mobile edge computing (MEC) wireless sensor networks (WSNs)using a multiantenna access point (AP) and two sensor clusters based on uplink nonorthogonal multiple access (NOMA). Due to limited computation and energy resources, the cluster heads(CHs) offload their tasks to a multiantenna AP over Nakagami-m fading. We proposed a combination protocol for NOMA-MECWSNs in which the AP selects either selection combining (SC) or maximal ratio combining (MRC) and each cluster selects a CH to participate in the communication process by employing the sensor node (SN) selection. We derive the closed-form exact expressions of the successful computation probability (SCP) to evaluate the system performance with the latency and energy consumption constraints of the considered WSN. Numerical results are provided to gain insight into the system performance in terms of the SCP based on system parameters such as the number of AP antennas, number of SNs in each cluster, task length, working frequency, offloading ratio, and transmit power allocation.Furthermore, to determine the optimal resource parameters, i.e.,the offloading ratio, power allocation of the two CHs, and MEC AP resources, we proposed two algorithms to achieve the best system performance. Our approach reveals that the optimal parameters with different schemes significantly improve SCP compared to other similar studies. We use Monte Carlo simulations to confirm the validity of our analysis.
I. INTRODUCTION
IN recent years, wireless sensor networks (WSNs) have been commonly applied in many fields, such as agriculture,industry, healthcare monitoring, and traffic control, and play an important role in Internet of Things (IoT) applications [1],[2]. The sensor nodes (SNs) in a WSN system collect data and must process this information to control the corresponding actuator [3], [4]. For example, agricultural SNs collect local environmental information and calculations to drive a water pump [5], [6]. Each vehicle, which is considered a mobile SN in the vehicle-to-everything WSN, gathers traffic information and processes it to make self-driving decisions and provide cooperative collision avoidance [7]. However, a WSN is challenging to implement in practical scenarios because of the limited resources of SNs, e.g., computational ability, energy,and throughput. For example, SNs cannot complete all tasks in real time by themselves due to limitations on computing resources and operating energy [8], [9].
Therefore, mobile edge computing (MEC) [10] is a potential solution to meet computation-intensive and latency-crucial applications at limited resource SNs [11], [12]. According to the MEC paradigm, the SNs divide the computation workloads into parts and offload some parts to the MEC servers in the edge network. With short propagation distances and simple protocols, SNs can achieve very low latency within their limited energy capacity. Additionally, using effective computation offloading strategies, the MEC technique can decrease the energy consumption of the SNs and prolong their battery life [13].
Furthermore, there are many advantages when applying MEC to WSNs, including decreasing traffic passing through infrastructure [10], reducing the latency for applications [11],[12], and raising the exactitude rate of task processing [14].However, an MEC-WSN network deploying a billion SNs in the future will create a massive amount of IoT data transmitted in the network [15]. This results in satisfying service requirements such as connection density and extremely high throughput in tight latency constraints. Hence,nonorthogonal multiple access (NOMA) can be applied to solve WSN throughput limitations in contrast to traditional orthogonal multiple access (OMA) [16]–[18]. Furthermore,the uplink NOMA architecture contributes to realizing the MEC model for WSNs [19]–[21]. NOMA can simultaneously serve many sensors with extremely high data rates and very low latency with the same frequency resources. With these advantages, many studies on the challenges of implementing NOMA in the MEC paradigm have been performed [22]–[25].For example, Wuet al. [22] proposed a model in which mobile users offloaded their tasks to computation servers at the edge of cellular networks using NOMA. This work proposed algorithms to minimize the system latency.
Furthermore, an MEC server located at the base station(BS), which can provide the computing and storage capacity for many users, was proposed in [23]. The authors used a successive convex approximation algorithm to minimize the total cost of the network. Yeet al. proposed the MEC network in [24], where two users could offload their computational tasks to the MEC server via an uplink NOMA. The proposed offloading scheme can work in three modes: complete local computation, partial computation offloading, and complete offloading. An optimization problem is presented that maximizes the successful computation probability (SCP) by optimizing the offloading time, power allocation, and offloading ratio of the two users. The authors concluded that NOMA could improve system performance for MEC networks.
From the above discussion, it is apparent that prior works have investigated the simple Rayleigh channel model and some essential system parameters such as the number of SNs;however, the number of antennas has not been examined.Thus, our work considers a WSN model with two sensor clusters and a multiantenna access point (AP) using uplink NOMA and Nakagami-mfading. Note that Nakagami-mis a general distribution, whereas Rayleigh, Rician, and Hoyt are special cases [26], [27]. We investigate the communication protocol using a combination of selection combining(SC)/maximal ratio combining (MRC) and the best sensor node selection (BSS)/random sensor node selection (RSS)approaches to promote the advantages of the multinode and multiantenna system. The main contributions of our work are as follows:
1) We investigate a WSN architecture based on MEC,where two sensor clusters communicate with a multiantenna AP using the uplink NOMA over Nakagami-mfading. We propose a protocol for this system with a combination of SC/MRC and BSS/RSS schemes. Furthermore, we derive the closed-form exact analytical expressions of the SCP for these schemes.
2) We propose two algorithms to determine the optimal resource parameters (including the transmit power allocation,offloading ratio of the SNs, and resources of the AP) so that the SCP is maximized under energy constraints.
3) We examine the system performance with respect to the task length, working frequency, offloading ratio, number of SNs, number of antennas, Nakagami-mshape factor, and transmit power allocation to understand the behaviors of the proposed system.
The remainder of this paper is organized as follows: Section II summarizes several related works. The system model is presented in Section III. Section IV presents a performance analysis. Section V presents the simulation results and discussion. Section VI concludes our paper.
II. RELATED WORK
In this section, we investigate several works that studied the MEC uplink NOMA techniques in WSNs.
One of the issues that has attracted the attention of academics is the need to evaluate the NOMA-MEC system within the maximum allowed time. Dinget al. [19] proposed the idea of two users offloading their tasks to an MEC server.Their work uses two iterative algorithms to minimize the system delay: Dinkelbach’s method and Newton’s method.The work concludes that Newton’s method converges faster than Dinkelbach’s method. This model was also used by Yeet al.in [24]. However, these works use the simple uplink NOMA model, which is not close to reality because wireless network systems generally work with many users, and in particular, WSNs require several SNs to ensure reliability. By contrast, Daiet al. proposed a more complex model in [28]. In particular, multiple users simultaneously offload their tasks to the MEC BS. The work proposes a method to minimize system latency with constrained parameters as a subcarrier assignment and computation resource allocation problem.While their work presented exciting results regarding the relationship between the length of the message and the system latency, a limitation is that it fails to identify and assess the effect of the fading channel on system performance.
To complement these deficiencies, the work in [29], which was developed from the simple NOMA-MEC model in [24],proposed an MEC network that considered the effect of wireless channels. The authors investigated the system performance in terms of the SCP by considering parameters such as the channel coefficient, distance between the user and the server, power allocation ratio, and offloading ratio.Specifically, the users are divided into two groups: center users and edge users, which are distributed according to a Poisson distribution and communicate with the MEC server over quasistatic Rayleigh fading. All devices in the system are equipped with a single antenna. Yeet al. proposed a new offloading scheme that could operate in three modes, namely,partial computation offloading, complete local computation,and complete offloading, and there are three user selection schemes based on the distance from the users to the MEC server: i) random center user and random edge user selection,ii) nearest center user and farthest edge user selection, and iii)nearest center user and nearest edge user selection. However,many essential aspects were not explored by this work, such as the effect of the number of users in each group, the bandwidth, the operating frequency, and the system energy consumption.
To realize an MEC model, considering only the maximum allowed time delay is not sufficient; the constraints on system energy consumption must also be considered, which makes sense in WSNs since the sensors have very limited power.Thus, some authors have examined both time and energy constraints of the MEC system. Zhanget al. [30] investigated the trade-off between energy consumption and latency in an orthogonal frequency division multiple access (OFDMA)-MEC network. They proposed an iterative search algorithm that incorporated the interior penalty function to find the optimal solution. Although the system uses binary offloading,the partial offloading model is closer to reality because users can select between self-computing or receiving assistance from the MEC server with the offloading ratio parameter.
A more realistic resource management in an MEC system was proposed by Yanget al. in [31]. The users are distributed in groups and perform binary or partial offloading to the BS using the uplink NOMA. The authors solved the problem of minimizing a linear combination of the maximum allowed time delay and total energy consumption of all users and offered superior advantages over time division multiple access(TDMA) and frequency division multiple access (FDMA)techniques. A similar model was proposed by Wanget al. to solve the energy consumption and application execution latency minimization of smart mobile devices [32]. The constraints of the optimal problem include the transmit power,user computational speed, number of cycles required for the application, and offloading ratio under dynamic voltage scaling technology. The common point of these proposed models is that all implementations are single-input, singleoutput (SISO) that operate over the simple fading channel model, i.e., Rayleigh fading.
A more complex model was proposed in [33]–[36]. For example, Wuet al. proposed a multi-user NOMA model for both uplink and downlink, where the edge server communicates with a group of mobile terminals (MTs). In this system, the users utilize the uplink to send the computation workload to the BS and vice versa, while the BS uses the downlink to feed back the results to the users. The authors proposed the offloaded computational workload optimization algorithm to minimize the overall delay in completing the MT workload. The results were compared with those of LINGO (a commercial optimization package), which showed the advantages of the NOMA-enabled computational-offloading scheme. However, in [24], [29], [37], the downlink merely transmits the small size and simple control signal; thus, it is unnecessary to investigate.
In addition, Wanget al. [34] proposed a model where multiple users simultaneously offloaded their workloads to a multiantenna BS. The authors use the Lagrange method to solve the problem of optimizing the energy consumption of the users, where the variables are the task partition, local CPU frequencies, and user offloading ratio. However, their work ignored the contribution of the task execution time to the system delay budget. This assumption is not reasonable because the MEC server has average resources; hence,considering this time is meaningful. Moreover, the work did not describe how to select users in NOMA communication and how to obtain the best-received signals of a multiantenna BS. A similar model was proposed by Wanget al. in [35]. The authors analyzed the system in two scenarios to minimize the total energy consumption of the users: binary offloading and partial offloading. They used the Lagrange method and branch-and-bound-based algorithms to solve the optimization problem for these two cases; however, the computational complexity became vast when the number of users increased.These works did not mention protocols that used the multiuser and multiantenna aspects in the NOMA-MEC system.
To the best of our knowledge, no prior works consider the uplink NOMA-MEC-WSN using a multiantenna access point(AP) with an SN selection scheme (BSS/RSS) implemented with a diversity combination technique (SC/MRC). In this study, we investigate a model for the uplink NOMA-MEC network in WSNs, where two sensor clusters communicate with a multiantenna AP over a Nakagami-mfading channel.
III. SYSTEM AND CHANNEL MODEL
We define the notations adopted in the next part of this work in Table I.
In the cluster-based WSN, multiple sensor nodes are classified into multiple clusters to take advantage of this approach, such as energy efficiency, more reliable network communication, and minimized tolerance [38], [39]. When applying the uplink NOMA technique to the WSN system, the AP divides clusters into disjunct pairs and allocates the available resources to these pairs [40].
In this paper, we consider the uplink NOMA-MEC-WSN over the Nakagami-mchannel for one pair of clusters, as depicted in Fig. 1. Specifically, the model consists of two sensor clusters (AandB) and one MEC server at theAP. As used in [36], [41], clusterAhasNhigh-priority SNs, which are denoted byAn(1 ≤n≤N); clusterBhasMlow-priority SNs, which are denoted byBm(1 ≤m≤M). This is the primary case in an uplink NOMA network, often used in research to ensure the delay in successive interference cancellation (SIC) is significantly reduced. Furthermore, with insights into system design from a two-cluster solution, a general solution with multiple clusters can also be obtained without much difficulty [42]–[44]. SNs are single-antenna devices, theAPis equipped withKantennas, and they operate in half-duplex mode [45]. Suppose that the SNs perform the same application with task lengthL(bits), which are independent of one another and divided into different groups[19], [24], [29]. LetT(seconds) be the maximum allowed time delay of the system. Due to limited computing capabilities and energy,AnandBmcannot complete their tasks inT. Therefore,AnandBmsimultaneously offload their tasks with offloading ratio βν(0 ≤βν≤1,ν ∈{A,B}) to theAPusing the uplink NOMA.
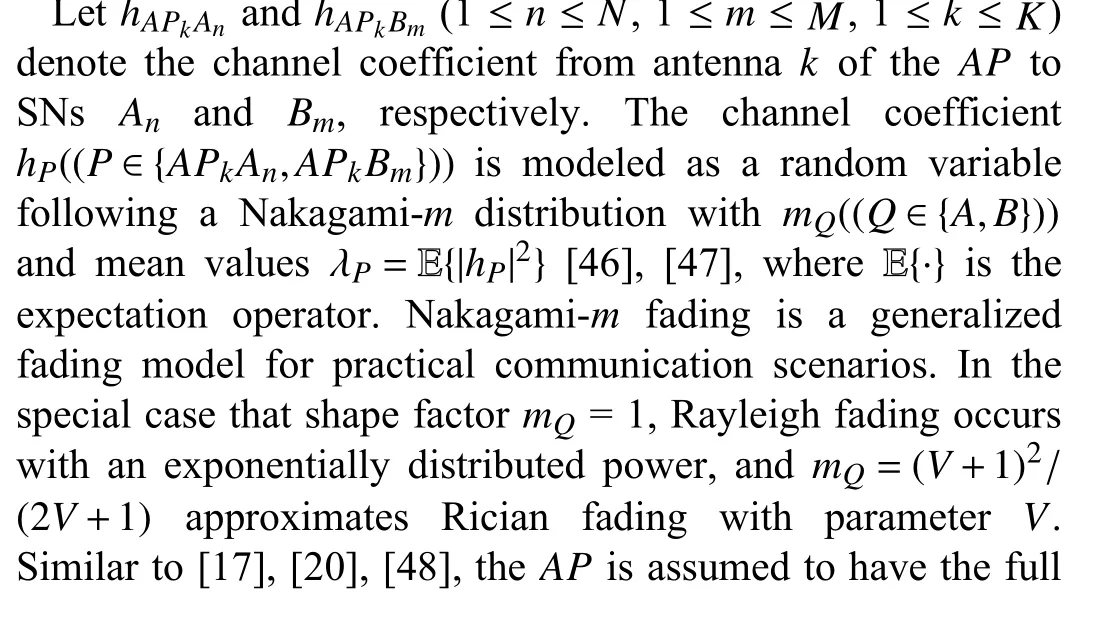
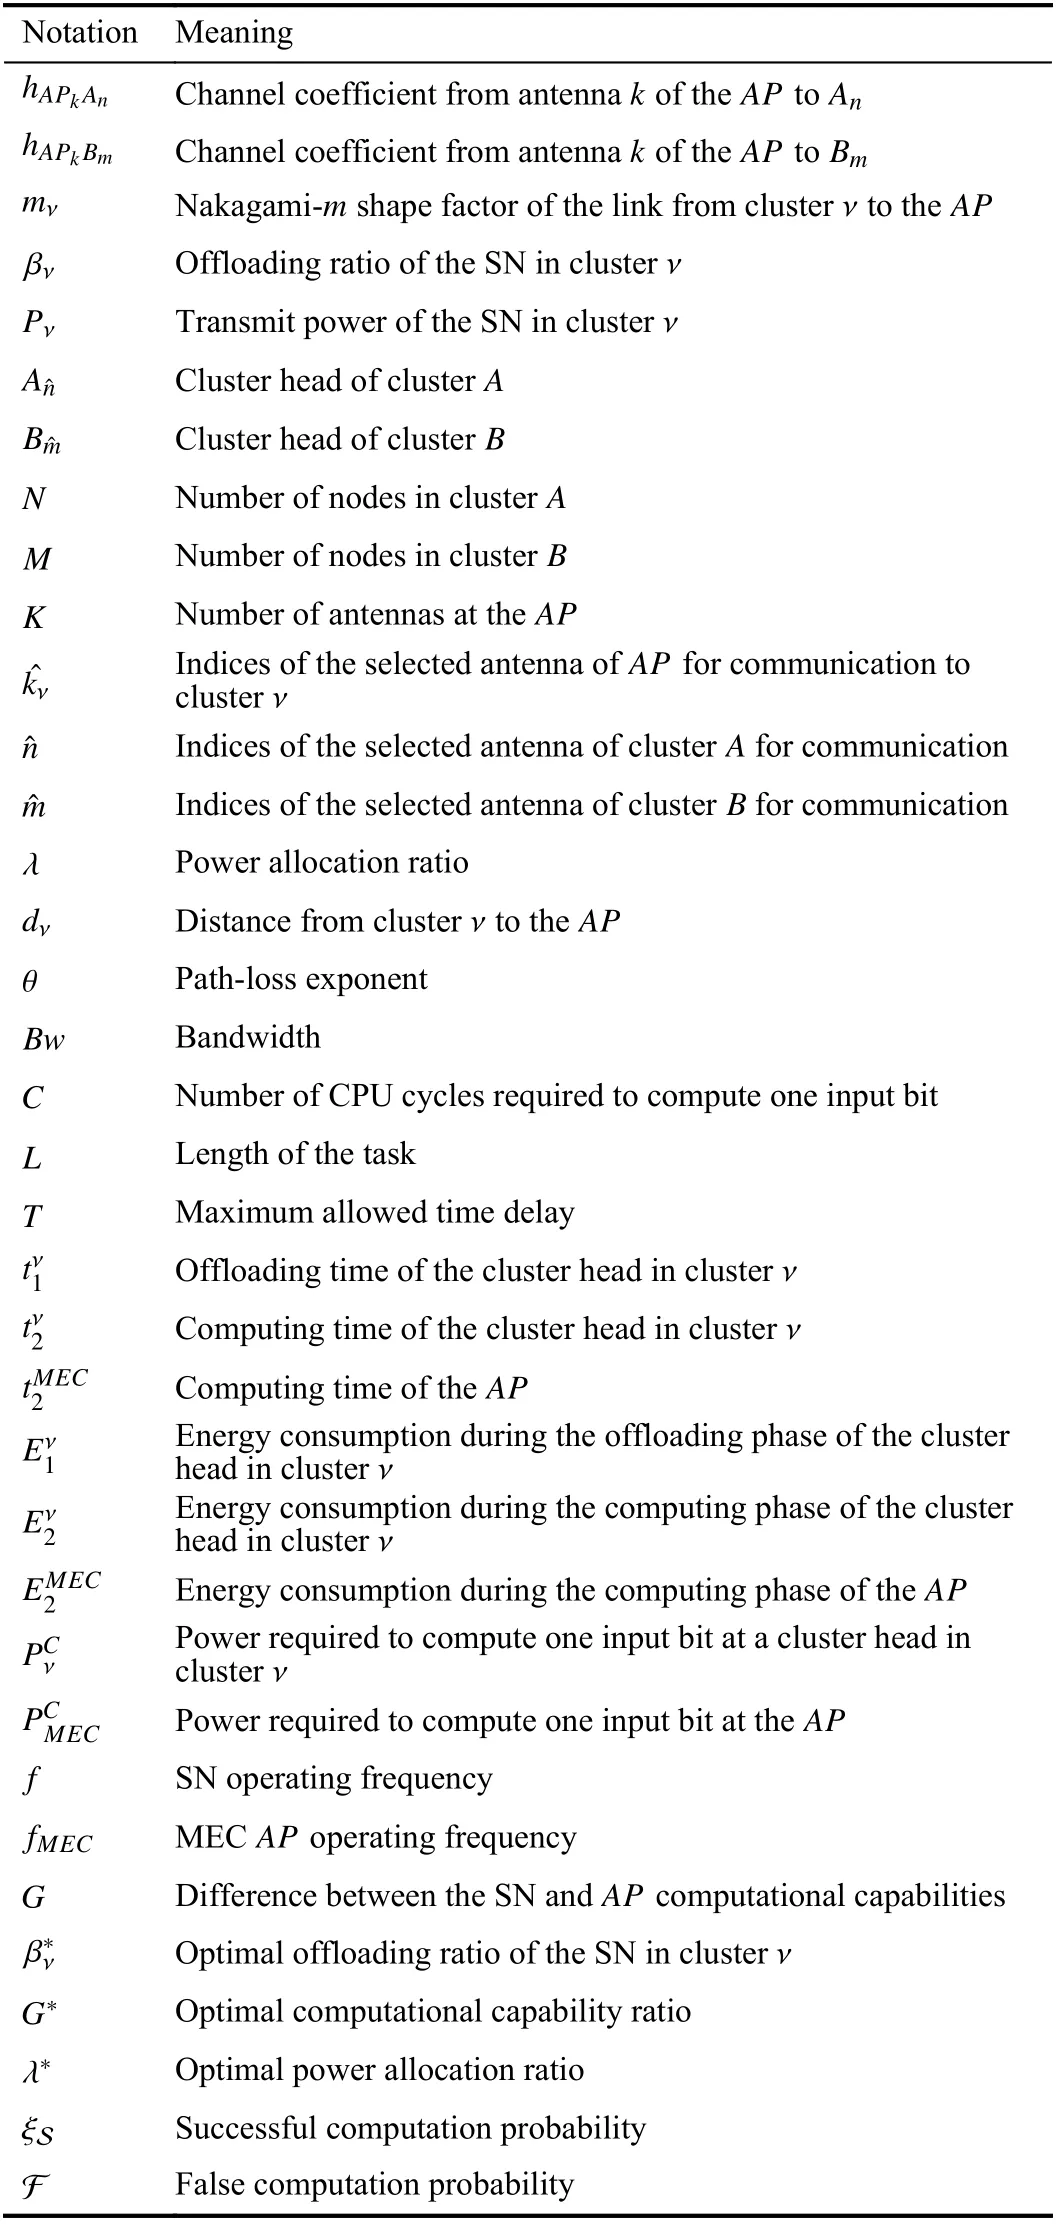
TABLE I NOTATIONS
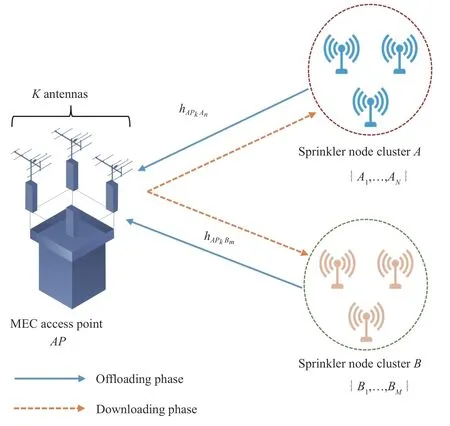
Fig. 1. System model for an uplink NOMA-MEC-WSN using a multiantenna access point.
A. Sensor Node Antenna Selection
The solutions obtained by choosing two CHs and an antenna are presented in this subsection.
1) Best Sensor Node Selection-Selection Combining (BSSSC) Scheme:When using the BSS-SC scheme,APselects antennaskˆAandkˆBfor the communication process with two CHs (AnˆandBmˆ) based on the channel power gains. We use this scheme for two reasons:
i) TheAPselects one ofKantennas that has the lowest complexity of all received diversity techniques for communication.
ii) Cluster ν consists of a set of SNs that are distributed near one another and perform similar monitoring tasks [4], [5],[49]. Furthermore, using the CH strategy helps to reduce energy consumption, save communication bandwidth and enhance the scalability of the WSN [50]–[52]. Thus, one can select CHs that participate in the communication process that can help the channel achieve the highest instantaneous SNR.
The formulas describe the indices of the selected antenna and two CHs for communication as follows:
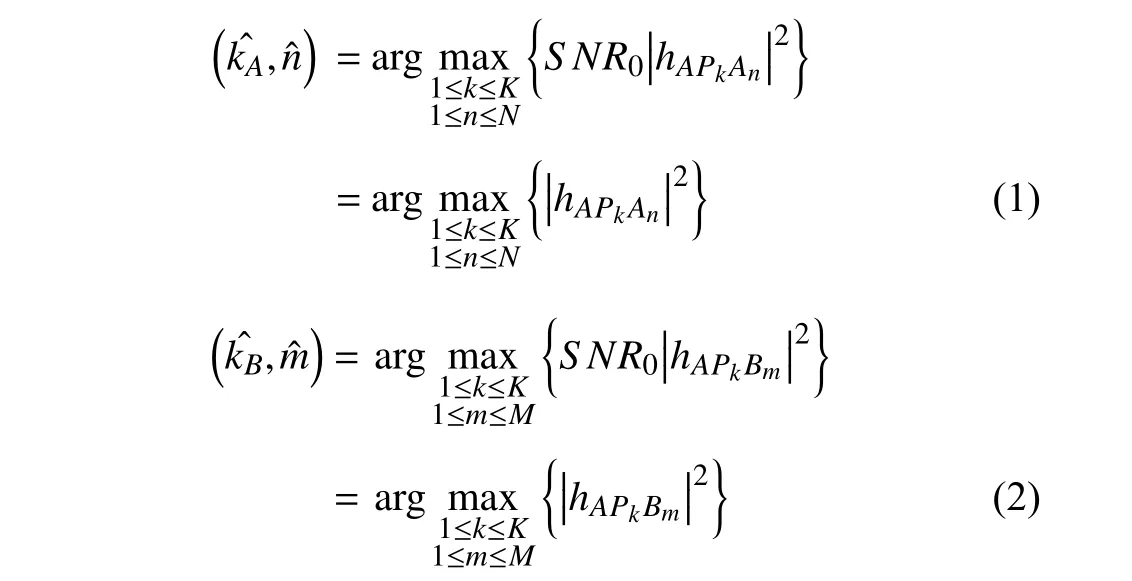
whereS NR0is the SNR in the absence of fading [53].

TABLE II SCHEMES FOR AN UPLINK NOMA-MEC-WSN USING A MULTIANTENNA ACCESS POINT
2) Best Sensor Node Selection-Maximal Ratio Combining(BSS-MRC) Scheme:Although BSS-SC is a low-complexity technique, it is not the best solution because the remaining(K−1)antennas of theAPare wasted. Therefore, we use the BSS-MRC scheme, where all antennas of anAPparticipate in the communication process. The channel with the highest sum of individual instantaneous SNRs is selected. The formulas that describe the indices of CHsAnˆandBmˆfor communication are as follows:
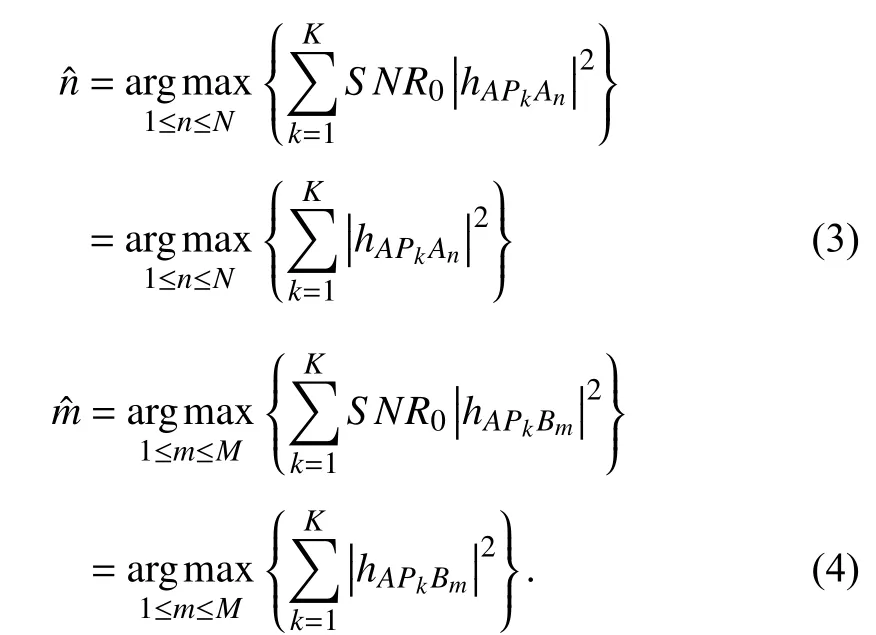
3) Combining the Best Sensor Node Selection and Random Sensor Node Selection:For the system using NOMA, the signal from one SN will interfere with other signals; thus,selecting the BSS for both clusters does not guarantee achieving high efficiency in terms of system performance.Therefore, we consider the RSS technique for selecting CHs.The formulas that describe the indices of CHsAnˆandBmˆfor communication are as follows:

The RSS technique is based on a random function that randomly picks a number from an interval. Its time complexity isO(1); thus, RSS has a much lower complexity than BSS. Hence, we propose a solution that combines BSS and RSS to select CHs as follows: i) Best Sensor node-A Selection - Random Sensor node-B Selection, denoted by S1,and ii) Random Sensor node-A Selection - Best Sensor node-B Selection, denoted by S2. Combined with two different combination methods (SC and MRC), the system can operate in one of four schemes:
a) S1-SC scheme:The formulas that describe the indices of the selected antenna and CHsAnˆandBmˆfor communication are as follows: (1) and (6).

Fig. 2. Time flowchart of the proposed protocol.
b) S1-MRC scheme:The formulas that describe the indices of CHsAnˆandBmˆfor communication are as follows:(3) and (6).
c) S2-SC scheme:The formulas that describe the indices of the selected antenna and CHsAnˆandBmˆfor communication are as follows: (2) and (5).
d) S2-MRC scheme:The formulas that describe the indices of CHsAnˆandBmˆfor communication are as follows:(3) and (5).
B. System Protocol
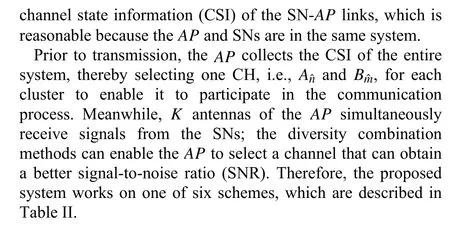
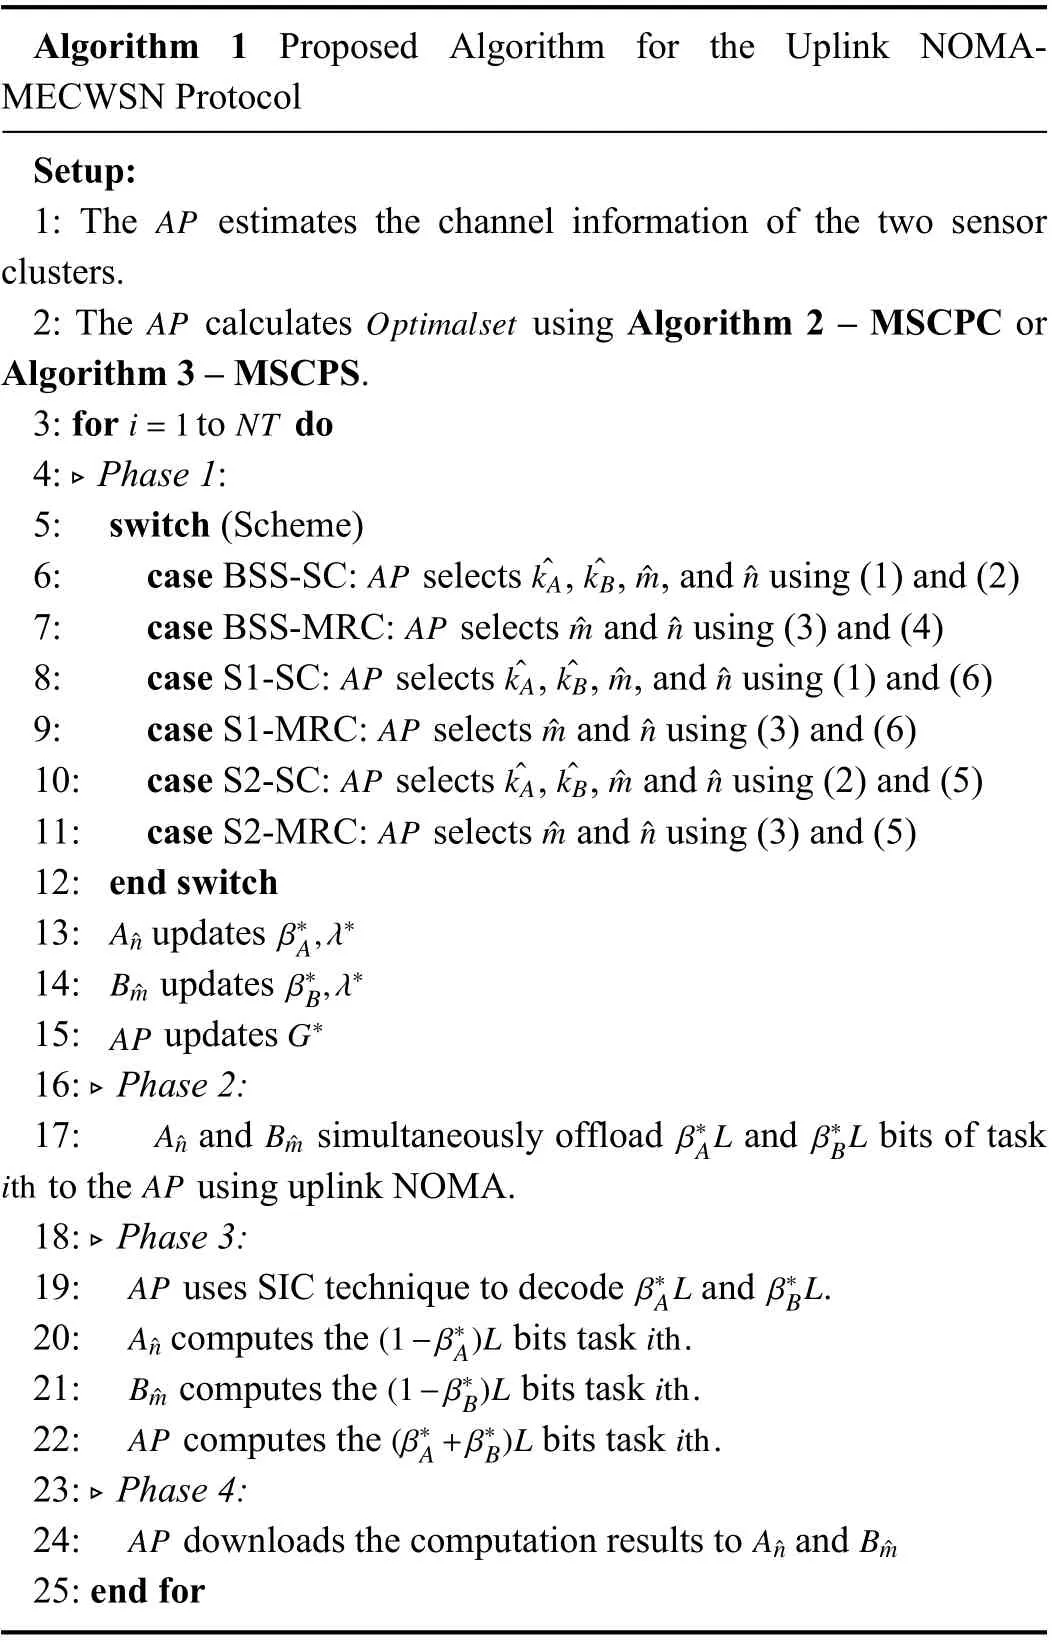
Based on one of these six schemes, we describe the system protocol in Algorithm 1. After theAPestimates the channel information and calculates the optimal set of parameters, the system begins to perform all tasks. LetNTbe the number of tasks that the system must perform. The time flowchart for the proposed protocol is shown in Fig. 2. In the first phase, theAPdecides to select the CHs and antenna for communication in durationt0. In the second phase, the CHs simultaneously offload their tasks to theAPusing the optimal power allocation and offloading ratio in durationt1. In the third phase,APuses the SIC technique to decode the superimposed data. Then, theAPand CHs compute their data in durationt2.Finally, the CHs download their results from theAPduringt3.In the scope of this paper, we consider the communication between CHs and sensor members to be solved [54]–[57].Therefore, we do not hold this time in the proposed protocol and sett0= 0. According to the study in [11], [12], [24], [29],t3is assumed to be much smaller thant1andt2and consequently negligible because the resources of the MEC server at theAPare sufficiently strong to very quickly perform the initial parameter selection calculations. Moreover, the calculation results in the downloading phase are usually much smaller in size than the offloaded bit task sequence; hence, the SNs very quickly obtain results via the downlink NOMA.
Algorithm 1 Proposed Algorithm for the Uplink NOMAMECWSN Protocol Setup:1: The estimates the channel information of the two sensor clusters.APOptimalset AP 2: The calculates using Algorithm 2 – MSCPC or Algorithm 3 – MSCPS.i=1 NT 3: for to do▷4: Phase 1:5: switch (Scheme)APˆkA ˆkB ˆmˆn 6: case BSS-SC: selects , , , and using (1) and (2)APˆmˆn 7: case BSS-MRC: selects and using (3) and (4)APˆkA ˆkB ˆmˆn 8: case S1-SC: selects , , , and using (1) and (6)9: case S1-MRC: selects and using (3) and (6)APˆkA ˆkB ˆmˆn 10: case S2-SC: selects , , and using (2) and (5)APˆmˆn APˆmˆn 11: case S2-MRC: selects and using (3) and (5)12: end switch Aˆnβ∗A,λ∗13: updates B ˆmβ∗B,λ∗14: updates APG∗15: updates▷16: Phase 2:AˆnB ˆmβ∗ALβ∗BL ithAP 17: and simultaneously offload and bits of task to the using uplink NOMA.18: Phase 3:APβ∗ALβ∗BL 19: uses SIC technique to decode and .Aˆn(1−β∗A)Lith 20: computes the bits task .B ˆm(1−β∗B)Lith 21: computes the bits task .AP(β∗A+β∗B)Lith 22: computes the bits task .▷23: Phase 4:APAˆnB ˆm▷24: downloads the computation results to and 25: end for

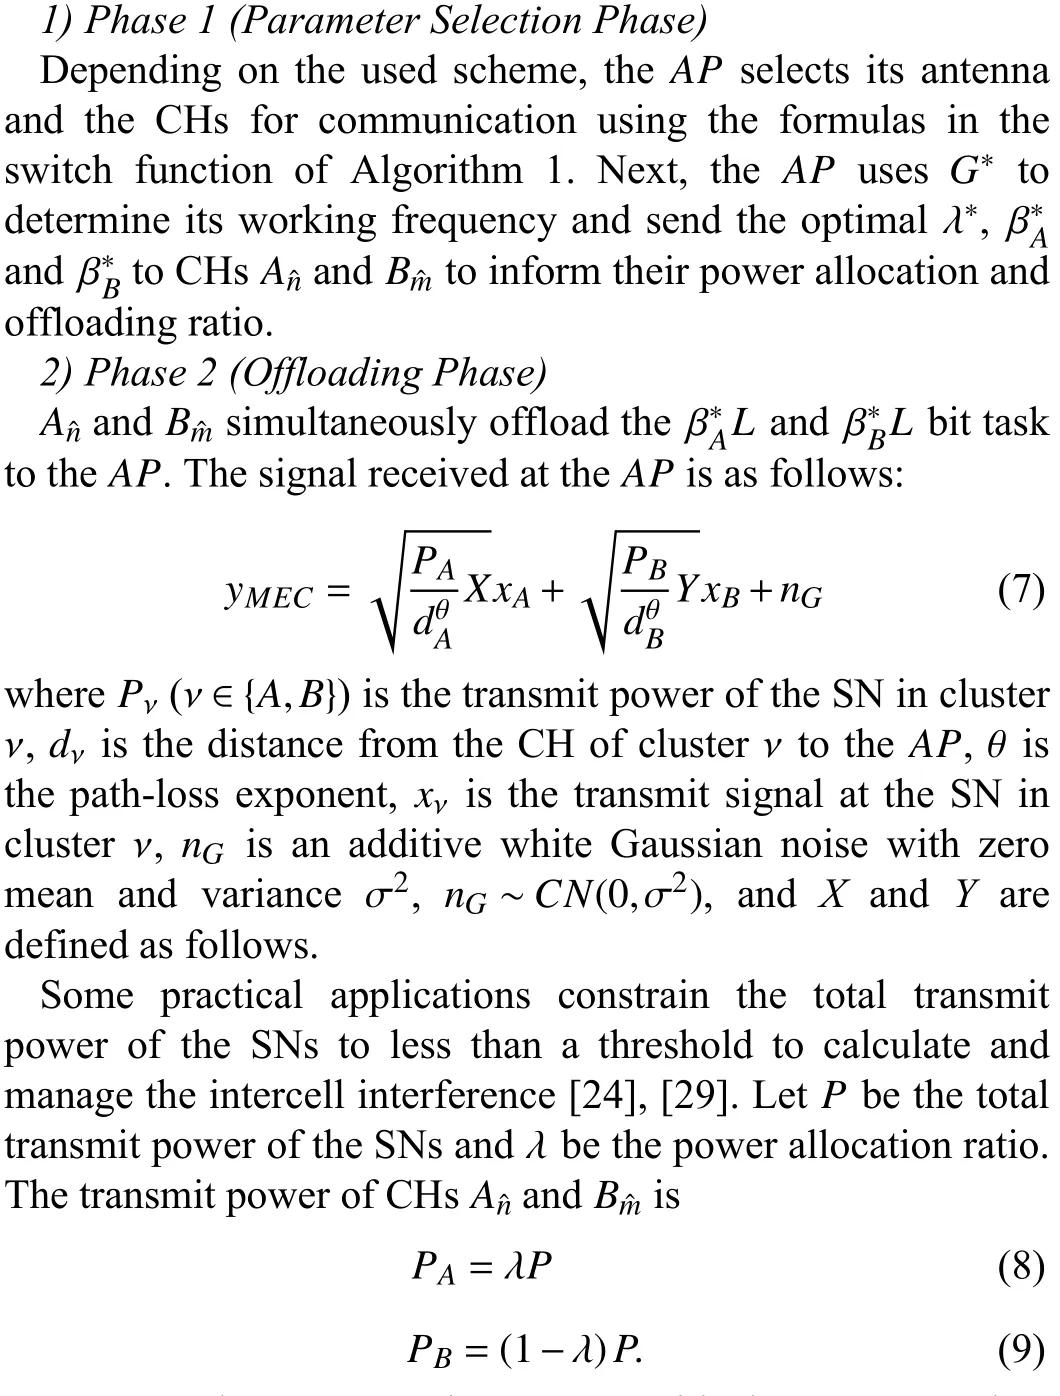
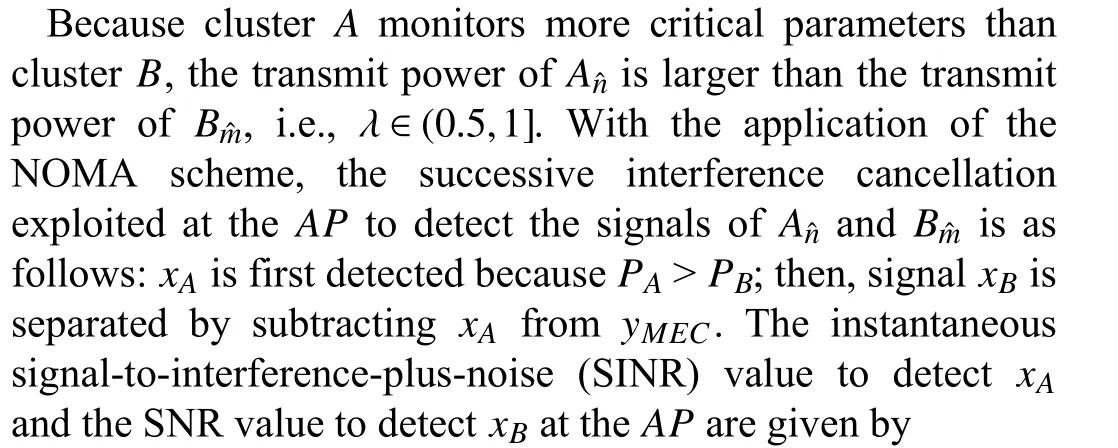
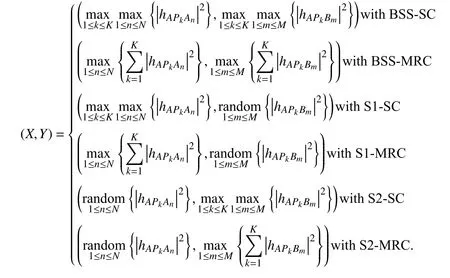
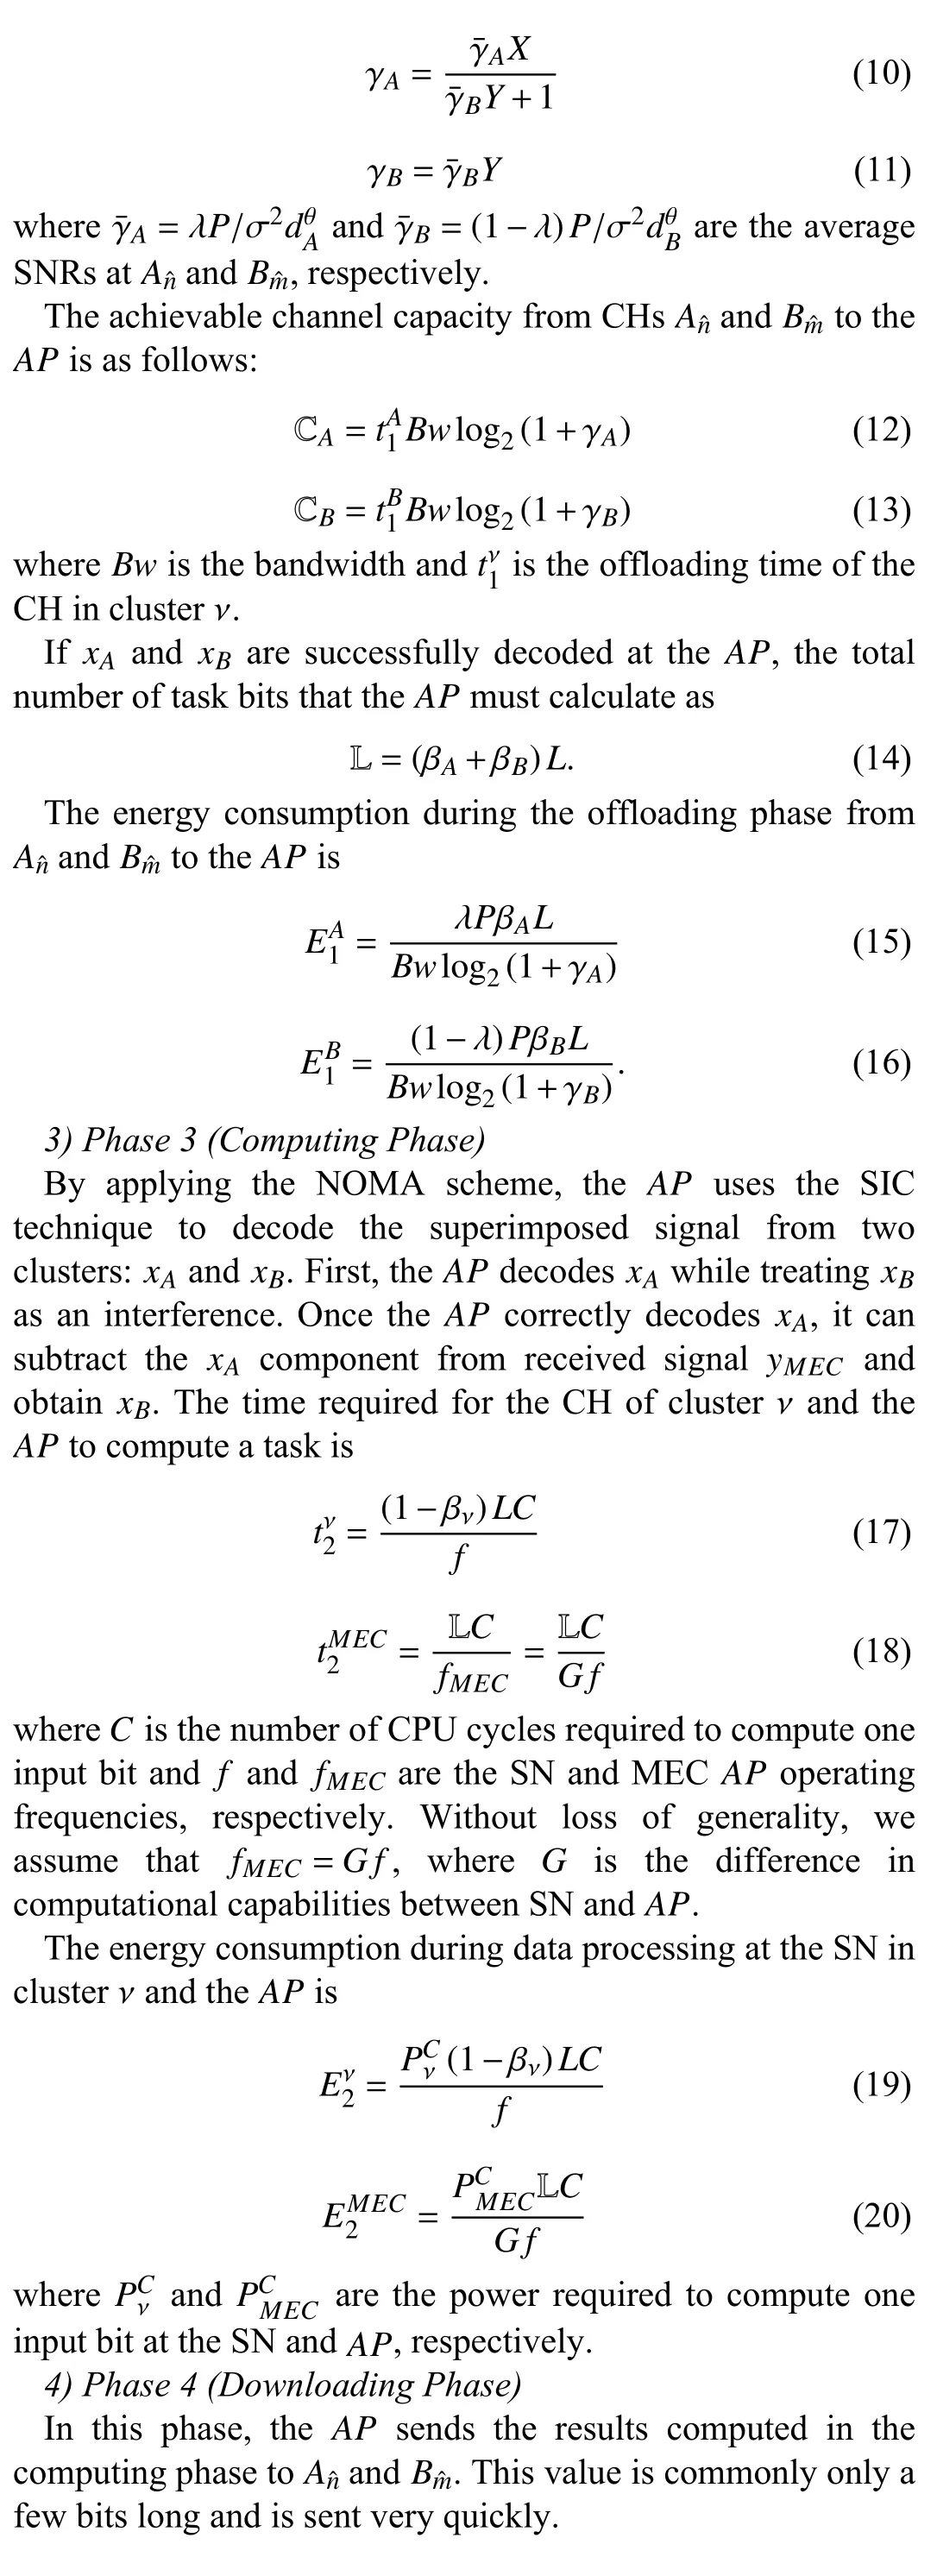
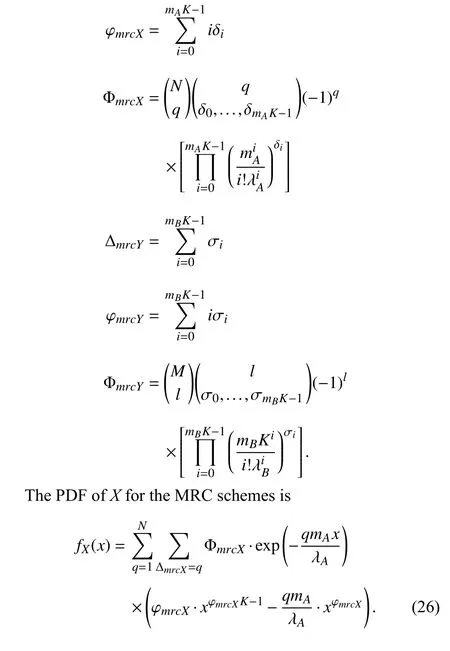
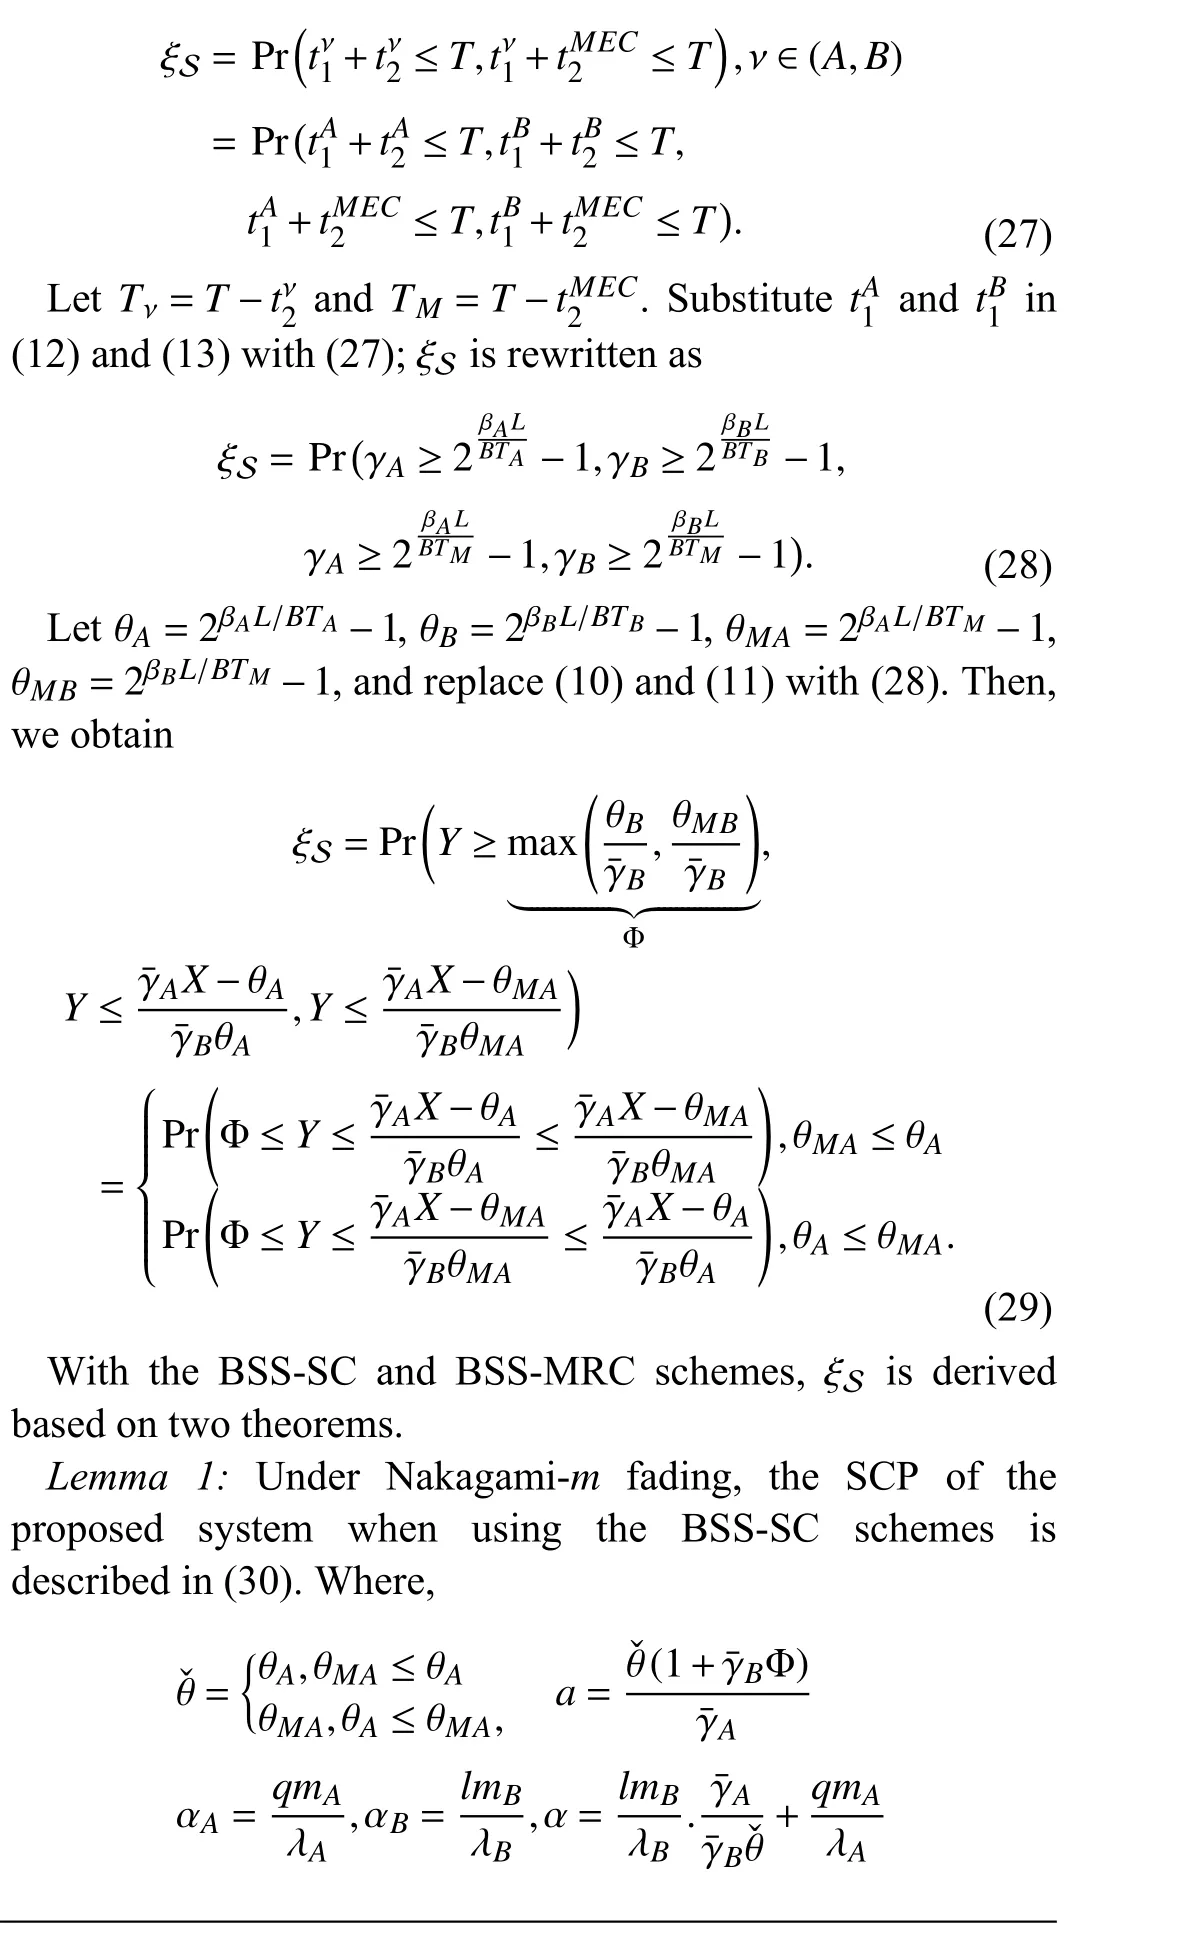
To perform further analyses, we derive the probability density function (PDF) and cumulative distribution function(CDF) of the channel power gains, i.e.,XandY, in the SC and MRC schemes as follows.
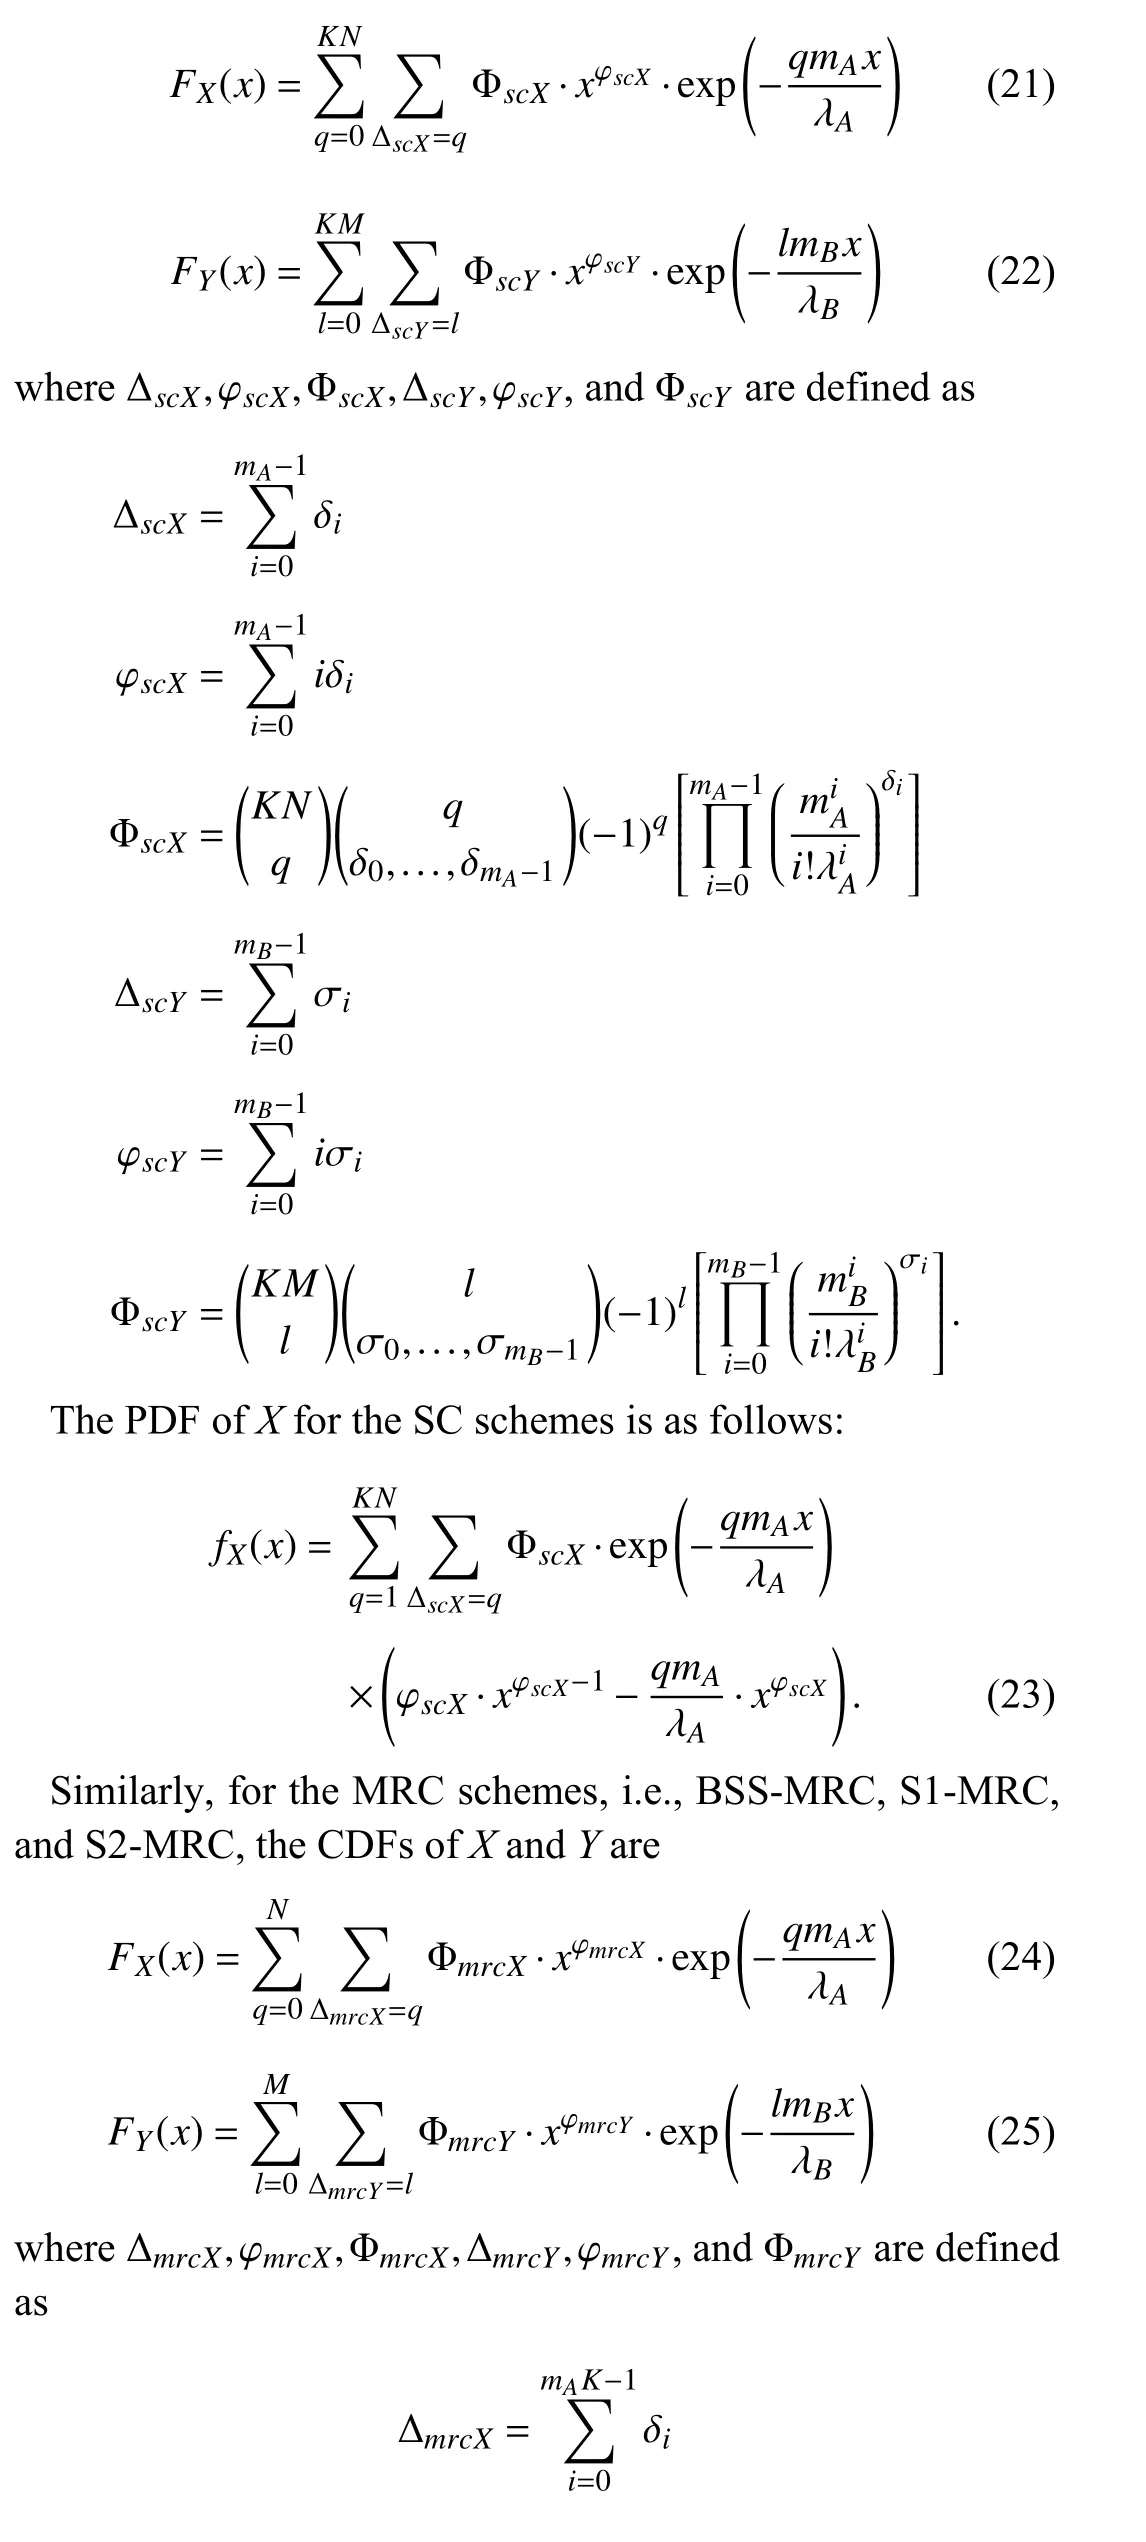
Because the channel gains follow the Nakagami distribution, for the SC schemes, i.e., BSS-SC, S1-SC, and S2-SC, the CDFs ofXandYare expressed as follows [41]:
IV. PERFORMANCE ANALYSIS AND OPTIMIZATION
A. Successful Computation Probability Analysis
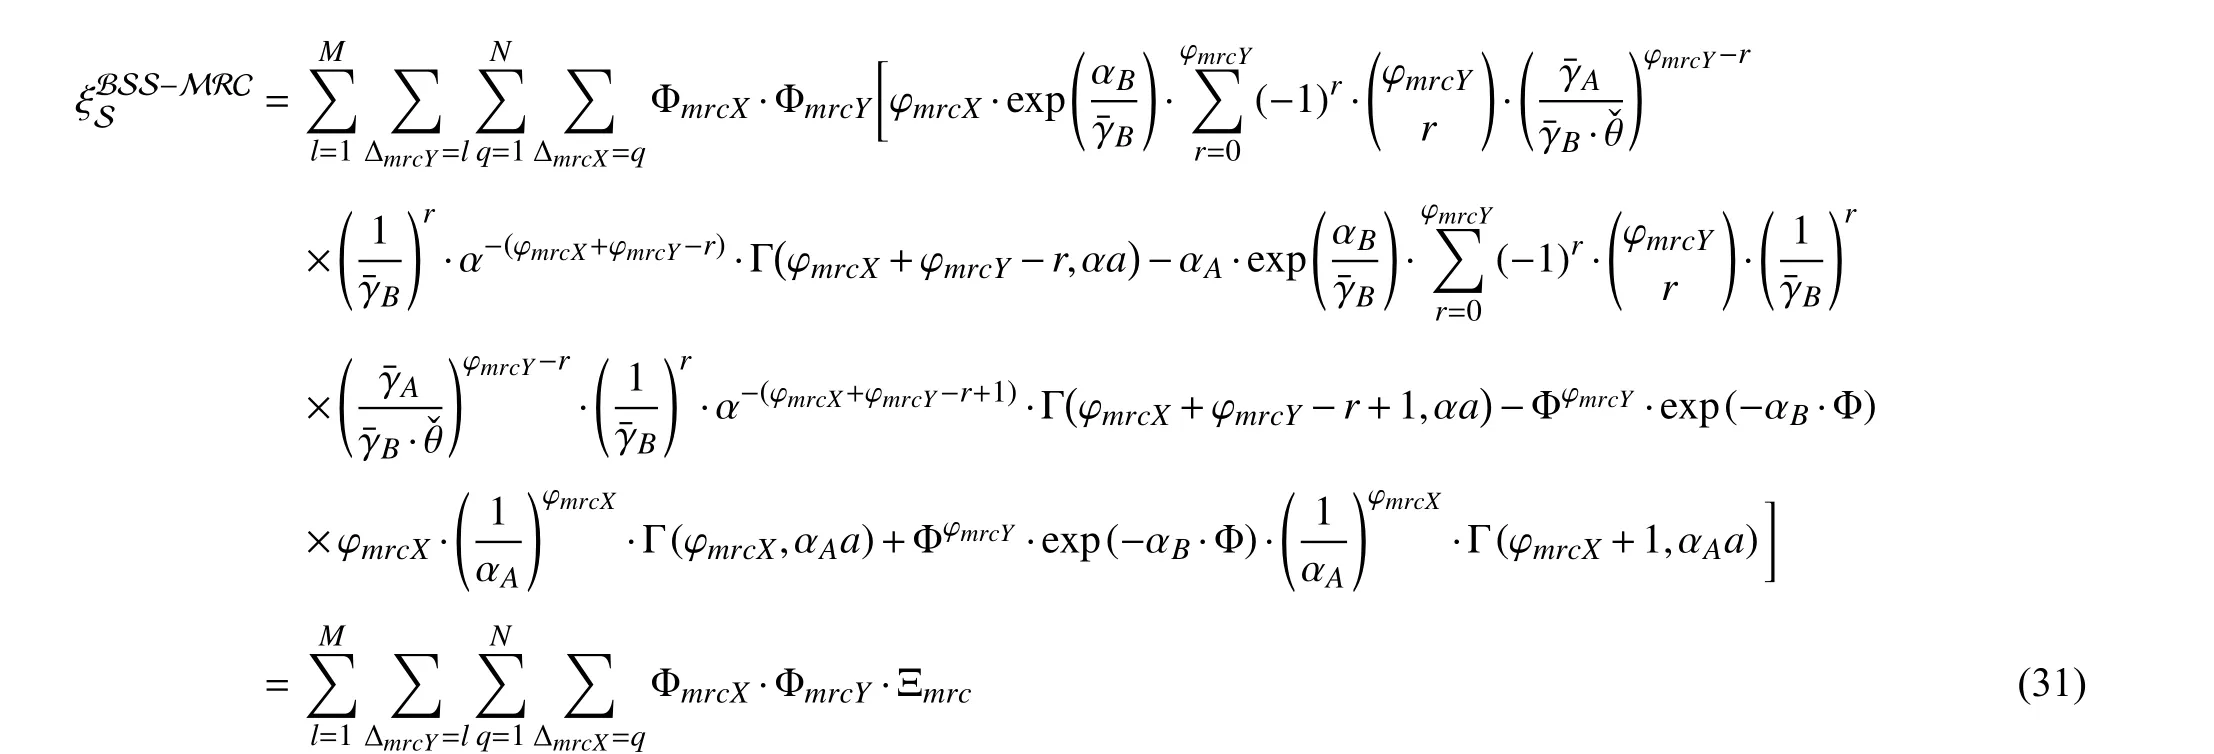
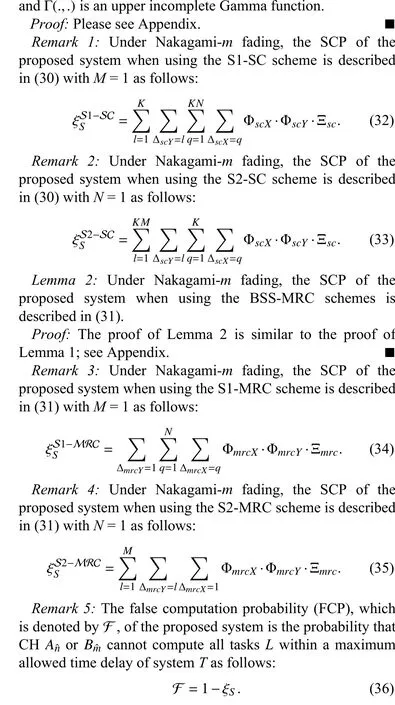
First, we define the SCP, which is denoted by ξSto be the probability that the CHsAnˆandBmˆsuccessfully compute all tasksLwithin a maximum allowed time delay of systemT.Specifically, the SCP is the probability that the total communication timet1in Phase 2 and computing timet2in Phase 3 of the SNsAnˆandBmˆand theAPare less thanT.Thus, we derive the SCP according to the following formula:
B. Problem Formulation and Solution
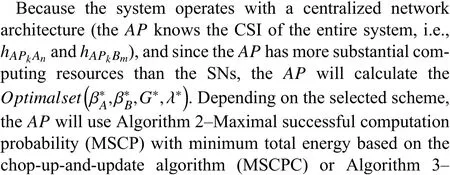
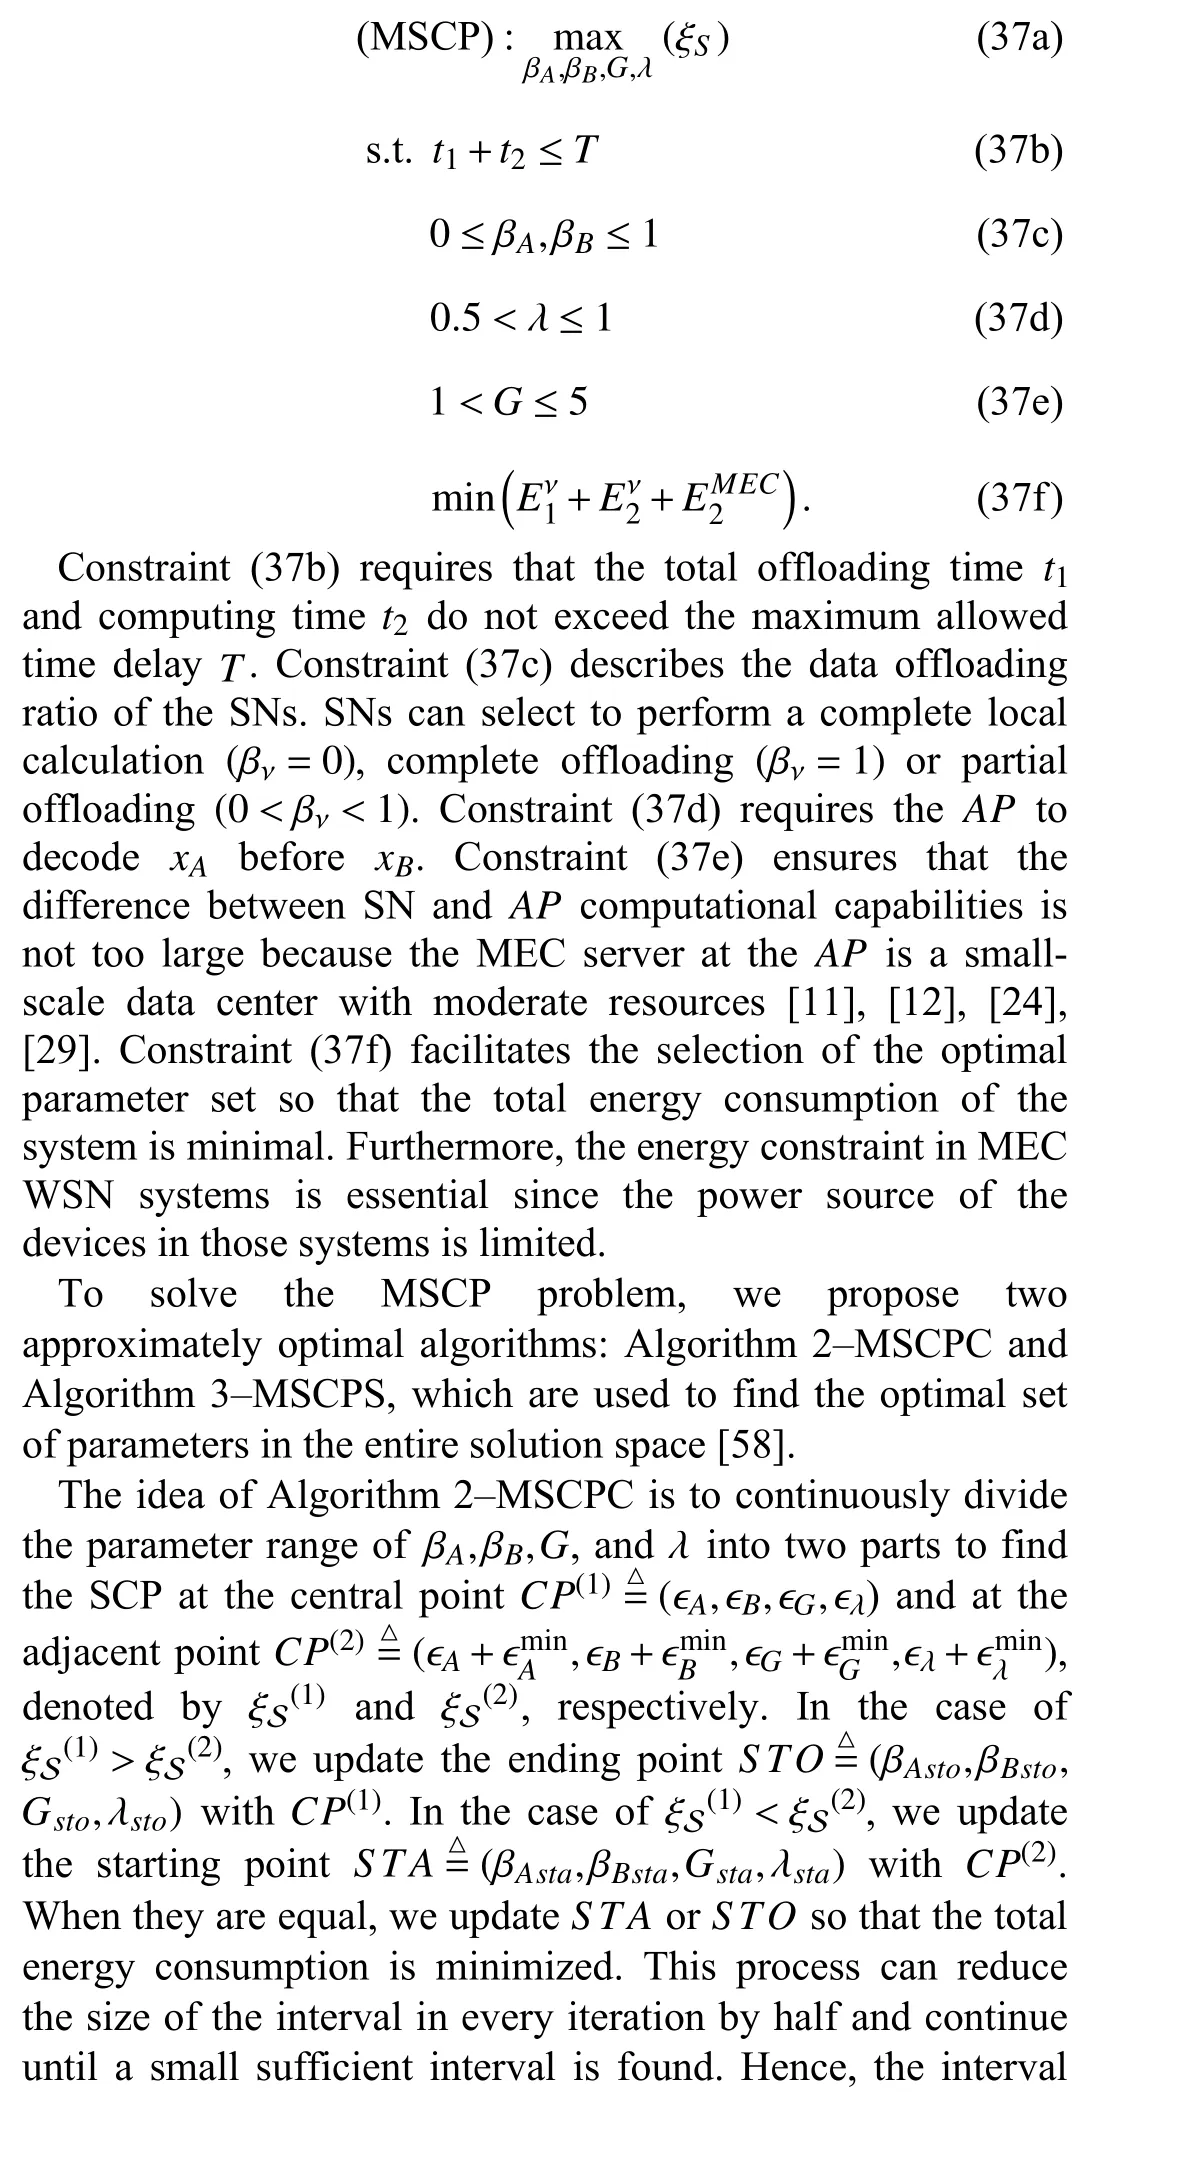
Based on the above model, we formulate the optimization problem to maximize the SCP (here, “MSCP” refers to the“maximal successful computation probability”)
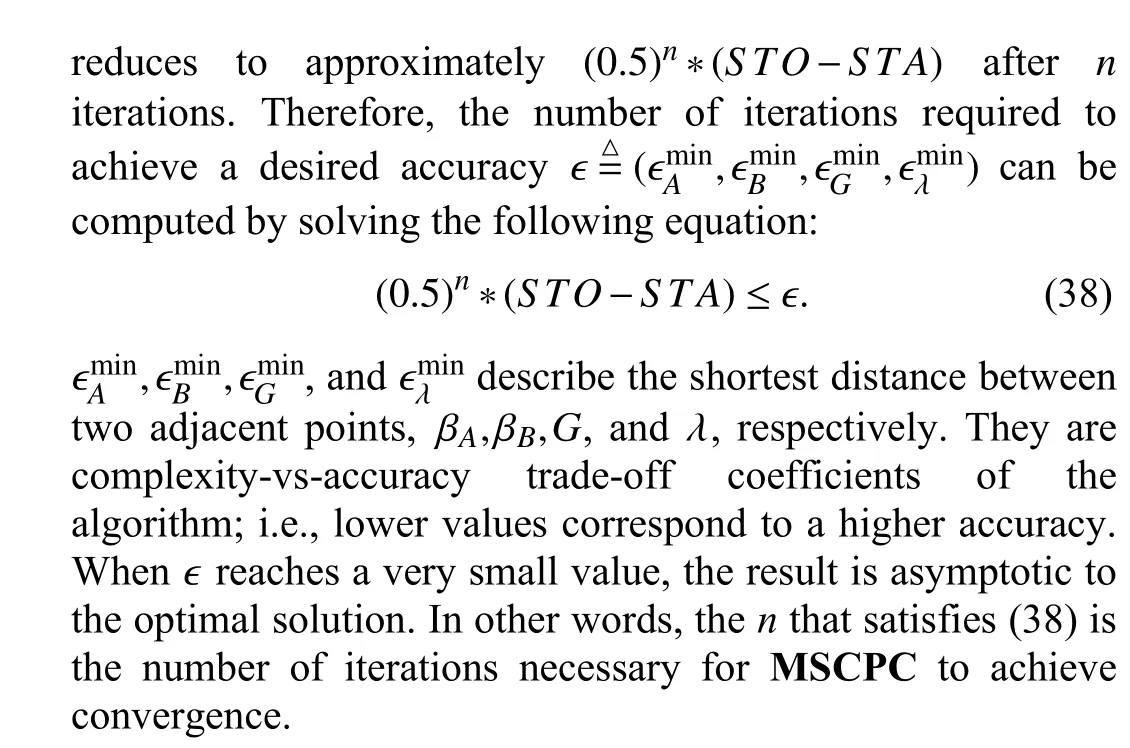
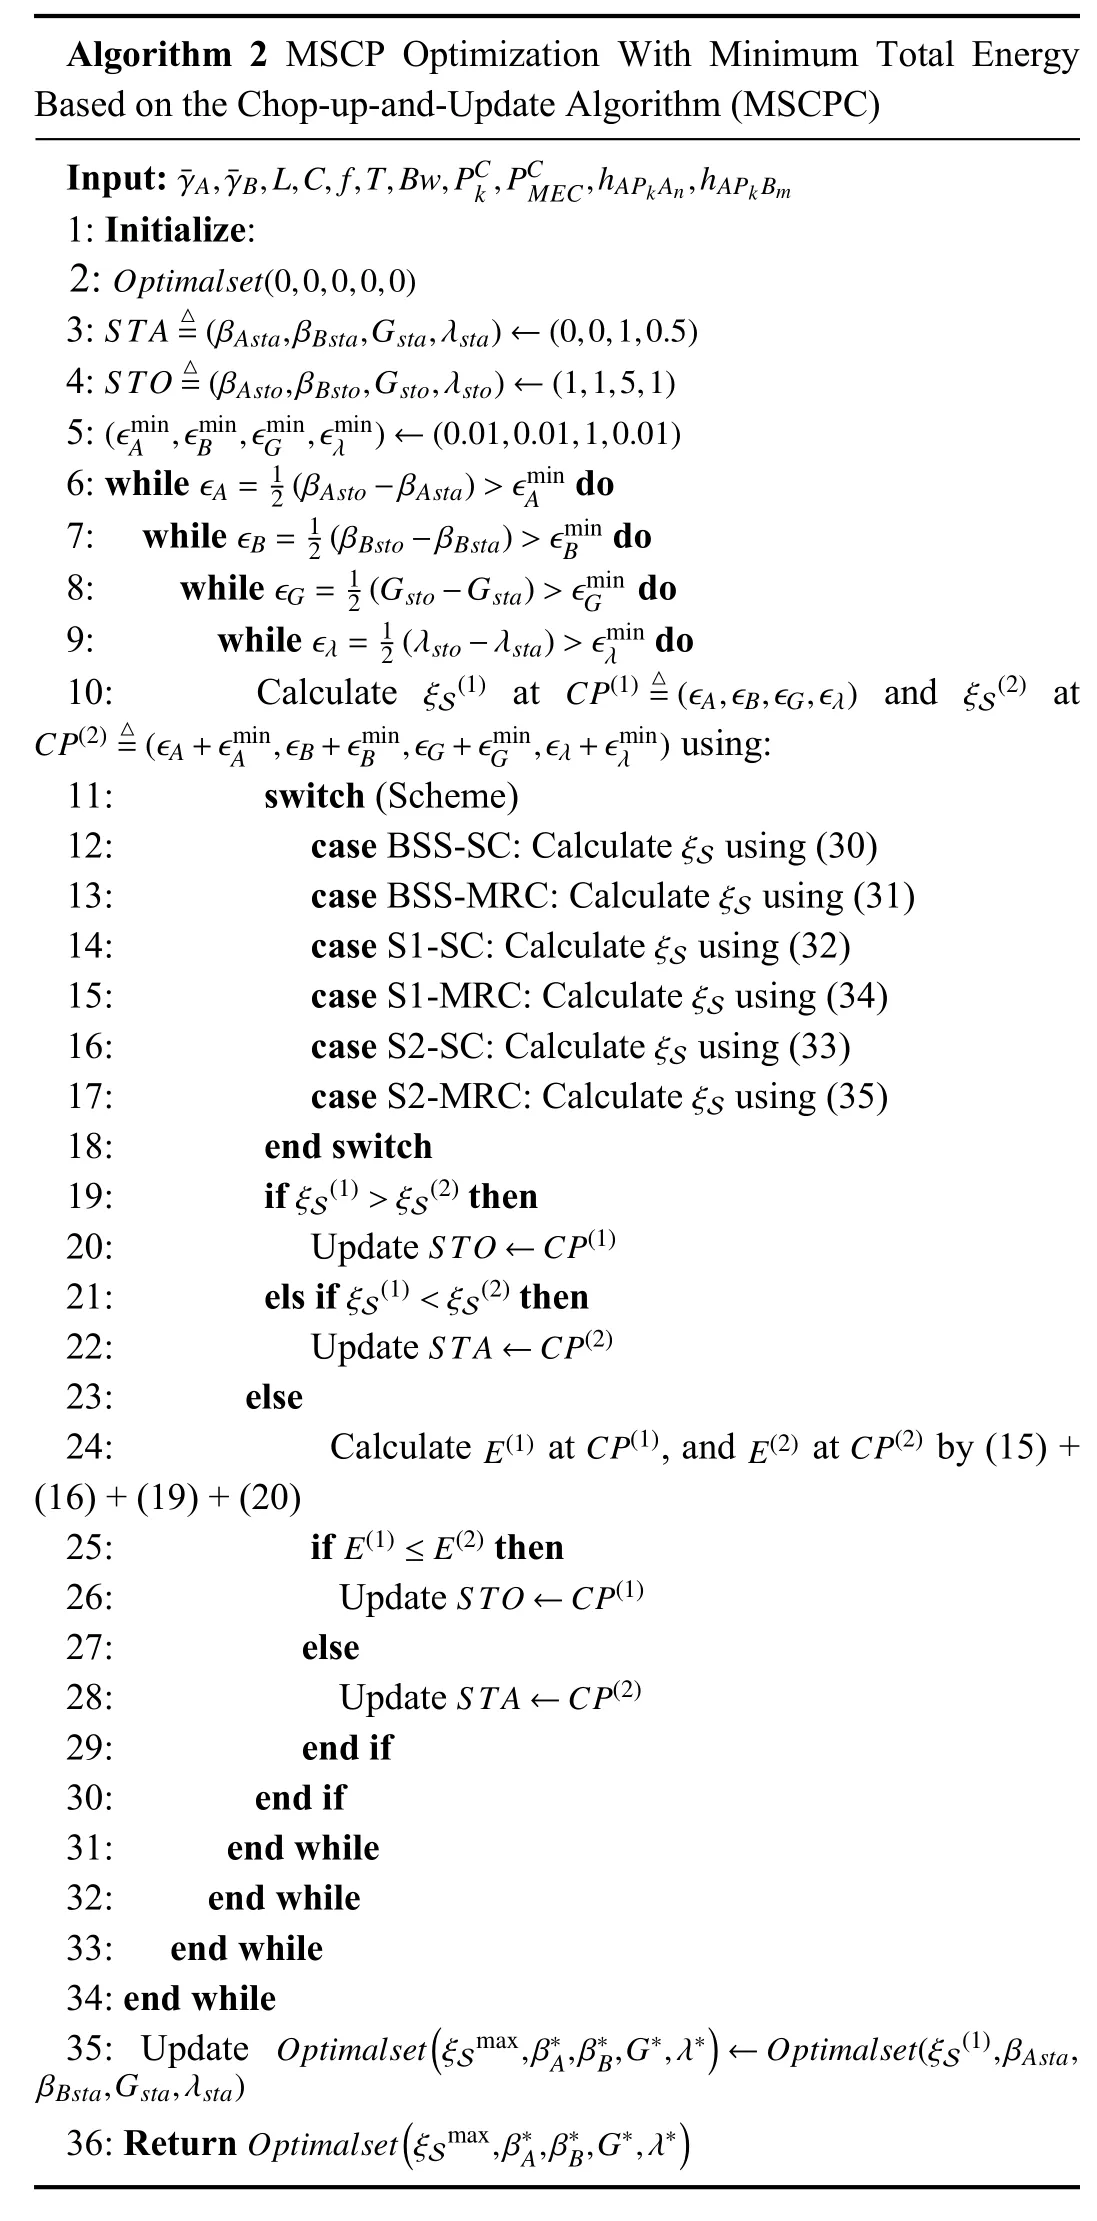
Algorithm 2 MSCP Optimization With Minimum Total Energy Based on the Chop-up-and-Update Algorithm (MSCPC)¯γA,¯γB,L,C,f,T,Bw,PCk,PCMEC,hAPkAn,hAPkBm Input:1: Initialize:Optimalset(0,0,0,0,0)2:S TA △=(βAsta,βBsta,Gsta,λsta)←(0,0,1,0.5)3:S TO △=(βAsto,βBsto,Gsto,λsto)←(1,1,5,1)4:(ϵmin A ,ϵminB ,ϵminG ,ϵminλ )←(0.01,0.01,1,0.01)5:ϵA= 1 2(βAsto −βAsta)>ϵminA 6: while do ϵB= 1 2(βBsto −βBsta)>ϵminB 7: while do ϵG = 1 2(Gsto −Gsta)>ϵminG 8: while do ϵλ= 1 2(λsto −λsta)>ϵminλ 9: while do ξS(1)CP(1)△=(ϵA,ϵB,ϵG,ϵλ)ξS(2)CP(2)△=(ϵA+ϵmin A ,ϵB+ϵminB ,ϵG+ϵminG ,ϵλ+ϵminλ )10: Calculate at and at using:11: switch (Scheme)12: case BSS-SC: Calculate using (30)ξS 13: case BSS-MRC: Calculate using (31)ξS 14: case S1-SC: Calculate using (32)ξS 15: case S1-MRC: Calculate using (34)ξS ξS 16: case S2-SC: Calculate using (33)ξS 17: case S2-MRC: Calculate using (35)18: end switch ξS(1)>ξS(2)19: if then S TO ←CP(1)20: Update ξS(1)<ξS(2)21: els if then S TA ←CP(2)22: Update 23: else E(1)CP(1)E(2)CP(2)24: Calculate at , and at by (15) +(16) + (19) + (20)E(1)≤E(2)25: if then S TO ←CP(1)26: Update 27: else S TA ←CP(2)28: Update 29: end if 30: end if 31: end while 32: end while 33: end while 34: end while Optimalset(ξSmax,β∗A,β∗B,G∗,λ∗)←Optimalset(ξS(1),βAsta,βBsta,Gsta,λsta)35: Update Optimalset(ξSmax,β∗A,β∗B,G∗,λ∗)36: Return
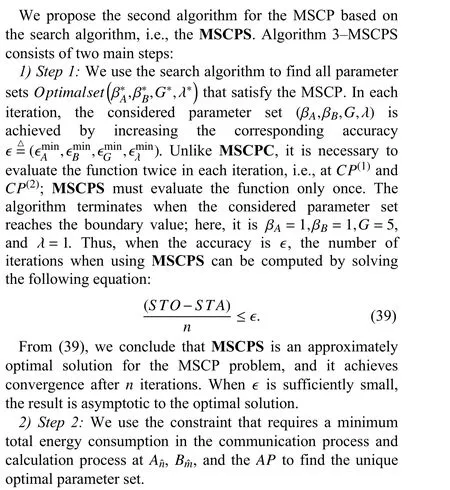
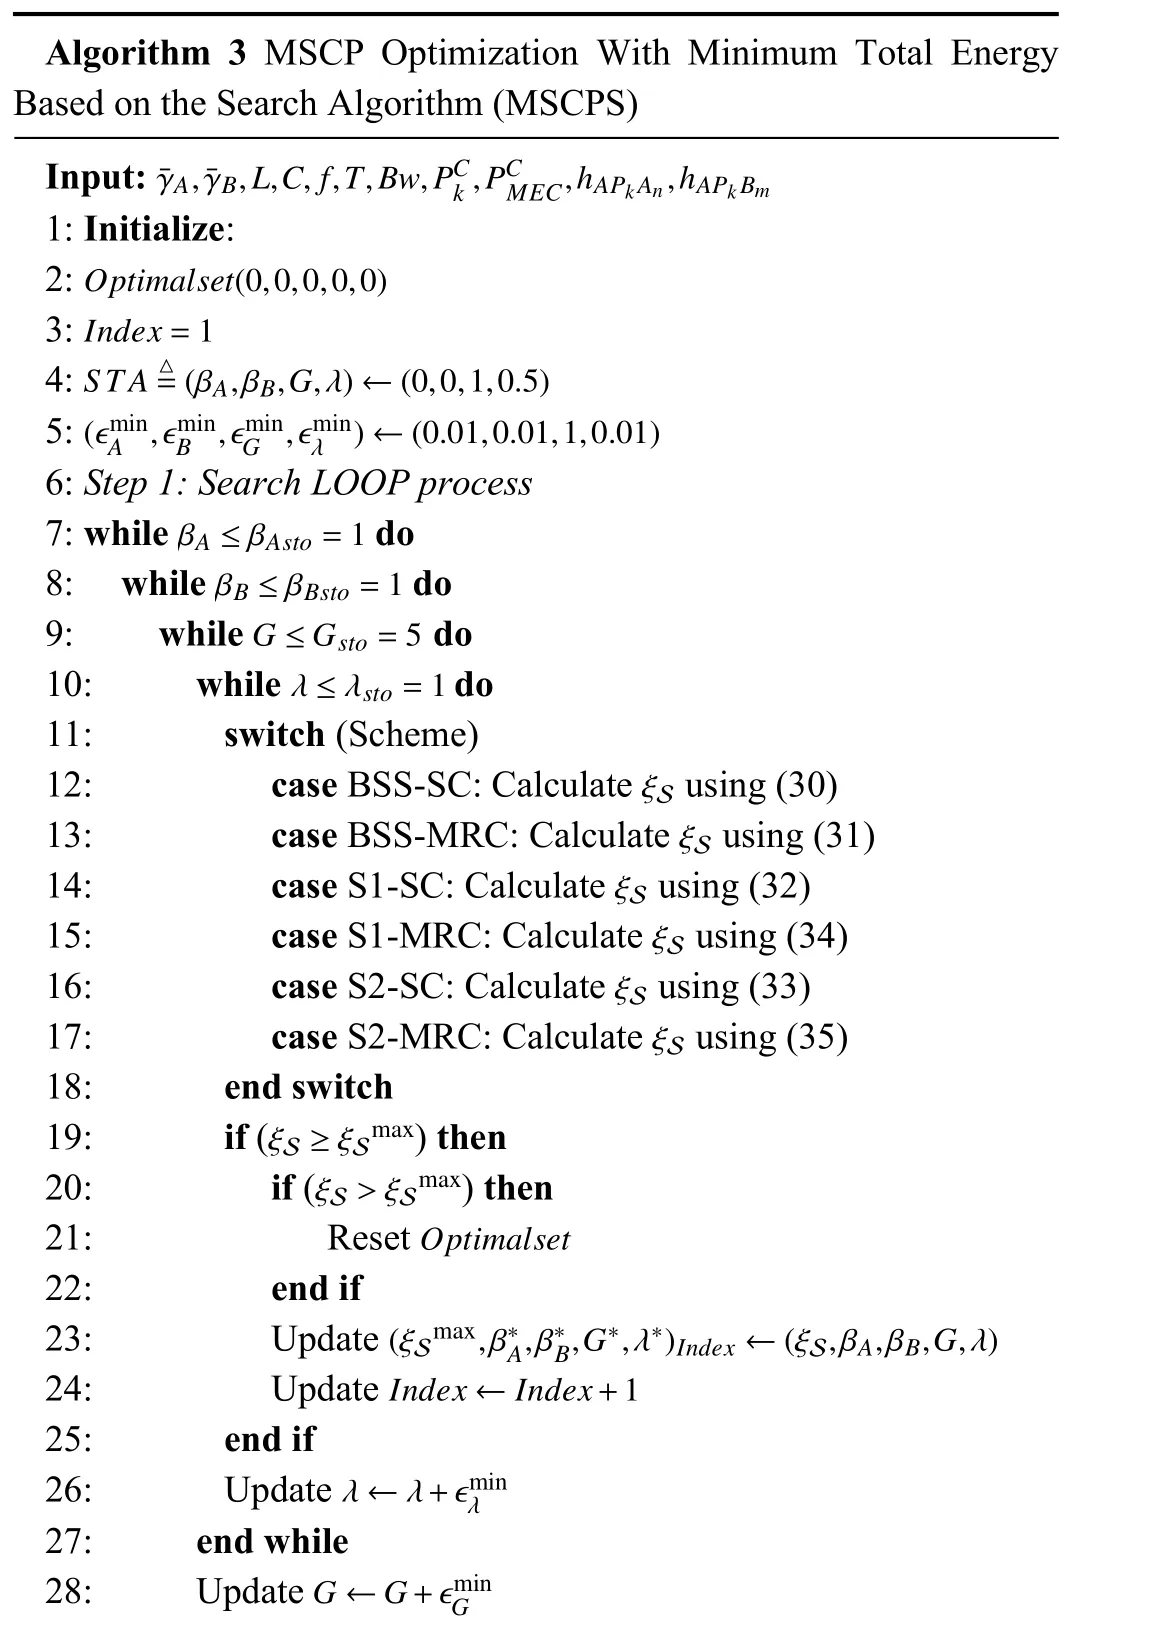
Algorithm 3 MSCP Optimization With Minimum Total Energy Based on the Search Algorithm (MSCPS)¯γA,¯γB,L,C,f,T,Bw,PCk,PCMEC,hAPkAn,hAPkBm Input:1: Initialize:Optimalset(0,0,0,0,0)2:3:S TA △=(βA,βB,G,λ)←(0,0,1,0.5)4:(ϵmin Index=1 A ,ϵminB ,ϵminG ,ϵminλ )←(0.01,0.01,1,0.01)5:6: Step 1: Search LOOP process βA ≤βAsto=1 7: while do βB ≤βBsto=1 8: while do G ≤Gsto=5 9: while do λ ≤λsto=1 10: while do 11: switch (Scheme)12: case BSS-SC: Calculate using (30)ξS 13: case BSS-MRC: Calculate using (31)ξS ξS 14: case S1-SC: Calculate using (32)15: case S1-MRC: Calculate using (34)ξS 16: case S2-SC: Calculate using (33)ξS ξS 17: case S2-MRC: Calculate using (35)18: end switch ξS ≥ξSmax 19: if () then ξS>ξSmax 20: if () then Optimalset 21: Reset 22: end if(ξSmax,β∗A,β∗B,G∗,λ∗)Index ←(ξS,βA,βB,G,λ)23: Update Index ←Index+1 24: Update 25: end if λ ←λ+ϵmin 26: Update 27: end while G ←G+ϵmin λ 28: Update G
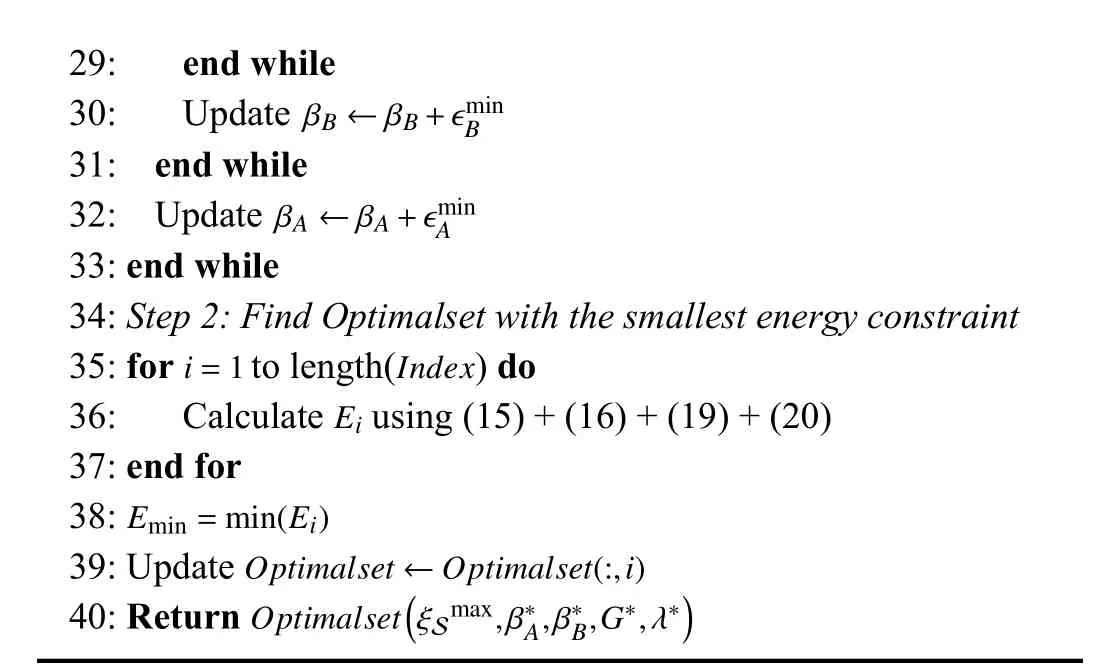
29: end while βB ←βB+ϵmin 30: Update 31: end while βA ←βA+ϵmin B 32: Update 33: end while 34: Step 2: Find Optimalset with the smallest energy constraint i=1Index A 35: for to length() do Ei 36: Calculate using (15) + (16) + (19) + (20)37: end for Emin=min(Ei)38:39: Update Optimalset ←Optimalset(:,i)Optimalset(ξSmax,β∗A,β∗B,G∗,λ∗)40: Return
V. NUMERICAL RESULTS AND DISCUSSION
In this section, we provide numerical results on the SCP. A Monte Carlo simulation is used to verify the analysis results.Unless otherwise stated, the parameters required during the simulation and analysis are shown in Table III [29], [41].
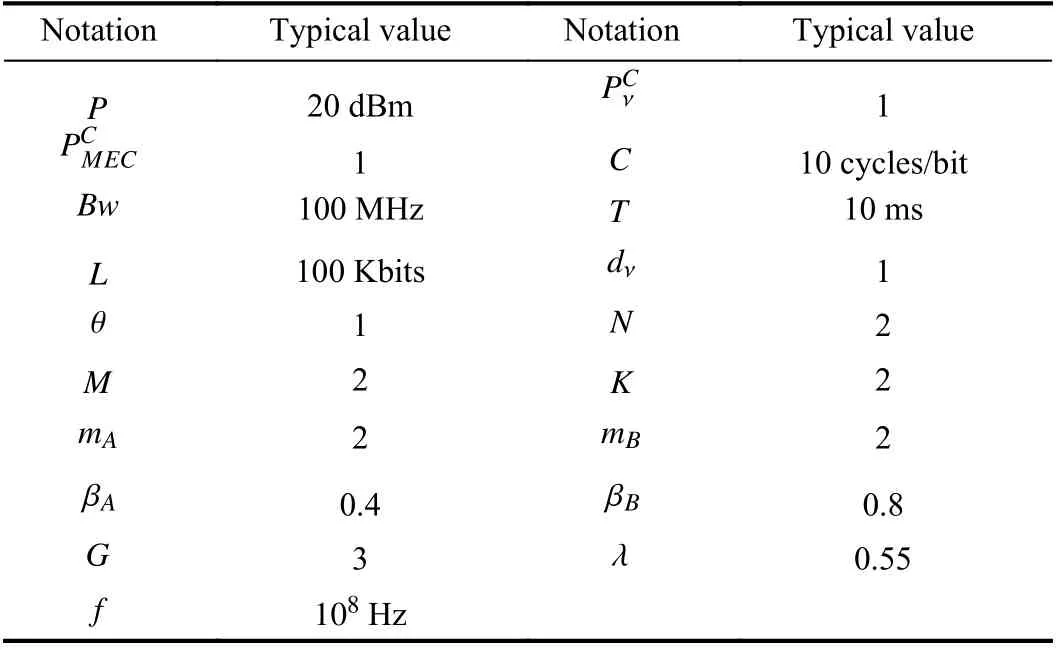
TABLE III TYPICAL VALUES OF THE PARAMETERS IN THE SIMULATION
As shown in Figs. 3–16, both analysis (Ana.) and simulation(Sim.) results are highly agreeable, which verifies our analysis. Fig. 3 compares the SCP in six schemes: BSS-SC,S1-SC, S2-SC, BSS-MRC, S1-MRC, and S2-MRC, as described in Table II. We observe that the MRC schemes always have better SCPs than the corresponding SC schemes.This results makes sense when the system operates under MRC schemes; the overall SNR is equal to the sum of individual SNRs of all signals received fromKantennas,which yields the maximum diversity gain.
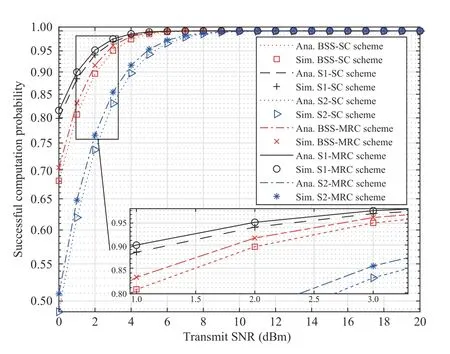
Fig. 3. Comparison of ξS in different schemes.
We continue to observe two scheme groups: the SC scheme group and MRC scheme group. Within each group, the S1 scheme has the best SCP, followed by the SCP of the BSS scheme, and the S2 scheme has the worst SCP. Hence, when the system works with NOMA, the signals may interfere with one another. In addition, signalxAis first decoded in theAPbecause under the assumption of λ>0.5, i.e.,PA>PB, the system performance is good when signalxAis better than signalxB. Therefore, the SCP reaches its maximum value under the S1 scheme. Because signalxAis selected as the best one while signalxBis randomly selected (i.e., not the best signal in clusterB), it will cause less interference onxAwhen decoding at theAP. By selecting the CH in contrast to the S1 schemes, the SCP of the S2 schemes has the lowest value.With the BSS schemes, although both clusters select their best SNs, the strong signal fromBmaffects the decoding ofAnat theAPand reduces the SCP.
Another observation is that ξSreaches saturation when the transmit SNR is very low (less than 10 dBm), which shows that the proposed system is suitable for WSN applications when the transmit power of the SNs is very low but still ensures communication quality.
Fig. 4 shows the comparison of the total throughput between NOMA and OMA schemes, where the bandwidth is 1 Hz. As expected, in this figure, we observe that the total achieved throughput of the NOMA scheme significantly outperforms that of the OMA scheme. This trend is inevitable and will repeat in all of our subsequent experiments; thus, we will not present them in the remaining figures.
To easily observe the effect of the power allocation ratioλ on the system performance, we use the FCP as a metric, as defined in Remark 5. In Fig. 5, there are one or more points that minimize the FCP (i.e., yield the largest SCP) for the six schemes. We observed that the minimum FCP occurs whenλ is in the range of 0.5 to 1, consistent with (8) and (9), where more power is allocated to cluster A. However, among those points, Algorithm 2 or Algorithm 3 selects only the optimal points to have the lowest energy consumption. With increasing λ, transmit powerPAincreases, and transmit powerPBdecreases, which decreases the FCP. However, whenλ increases to 1, all transmit powerPis allocated to SNAn,while SNBmdoes not have sufficient power to operate, which results in a high FCP.
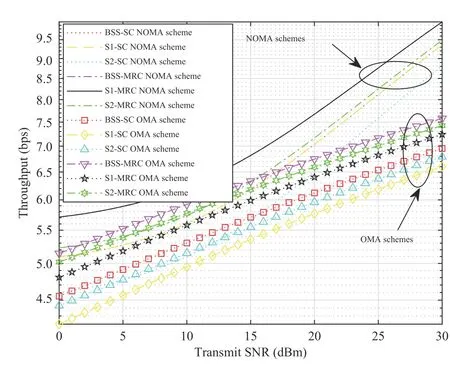
Fig. 4. Comparison of the total throughput among NOMA and OMA schemes, where the bandwidth is 1 Hz.
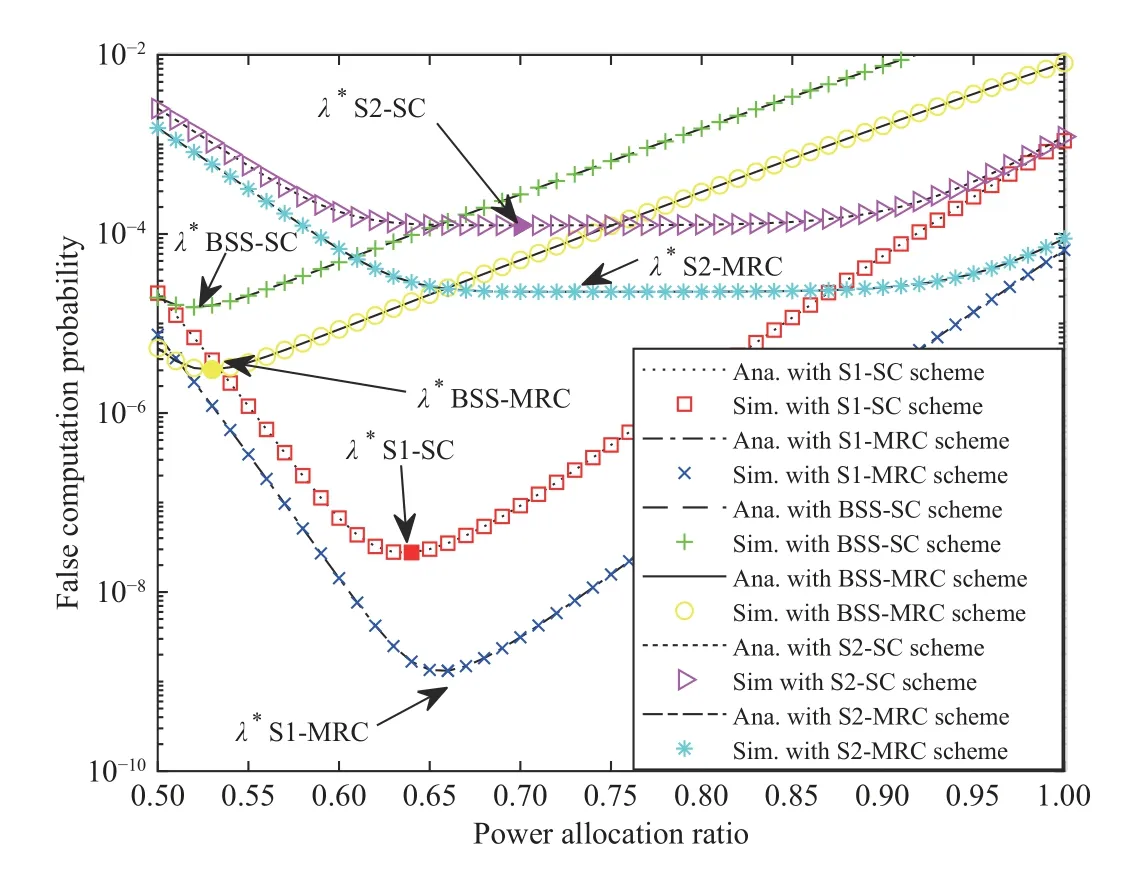
Fig. 5. F versus the power allocation.
Fig. 6 shows the SCP by task length under different SN operating frequencies. We set power allocation λ to 0.55. We observe that ξSdecreases whenLincreases, which is a reasonable result because whenLincreases, the time spent on the offloading phase from the SN to theAPalso increases,which reduces the time for the computing phase. Thus, both SNs andAPwill likely not have sufficient time to handle all of their tasks, so the SCP decreases.
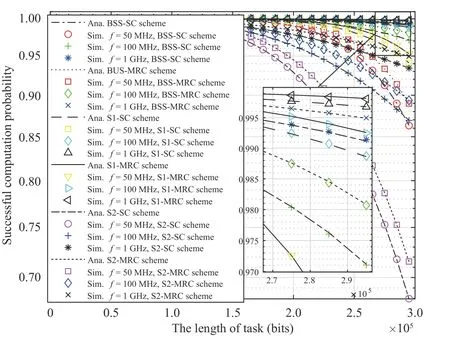
Fig. 6. ξS versus the length of tasks under different SN operating frequencies.
Another observation is that when a higher amount of frequency resources is used, the SCP is better because when the frequency increases, the process in the computing phase more quickly occurs and guarantees the system allowed delay time, which increases the system performance. With the proposed system, when the SN operating frequency increases from 50 MHz to 100 MHz, ξSimproves by 10%. When the SN operating frequency increases from 100 MHz to 1 GHz,ξSimproves only by approximately 2%. This outcome proves that with increasingf, the proposed system performance can be improved; however, ξSwill be saturated at frequencies above 1 GHz.
We observe that the task length of the SNs will significantly affect the performance of the proposed system when the operating frequency of the SNs is lower than 50 MHz, while it has no significant effect when the SNs operate at 100 MHz and above.
Fig. 6 compares the performance of the proposed system with those of the other six schemes. In all scenarios, we find that the MRC schemes have higher ξSthan the SC schemes,and the S1 schemes have higher ξSthan the BSS schemes and S2 schemes. However, the difference in ξSwhen the proposed system operates in SC and MRC schemes is not massive (only approximately 1%), while the complexity of calculation when communicating with the MRC schemes is higher than that with the SC schemes. Therefore, for applications with limited system resources, we consider using the SC schemes to obtain a desirable ξSwith lower computational complexity than the MRC schemes. Figs. 7 and 8 depict the effects of the number of antennas (K) of theAPand number of SNs in each cluster(NandM) on the SCP in the 2 scheme groups: the SC and MRC scheme groups. We set power allocation λ to 0.55. We perform six test scenarios on the proposed model: 1) all devices in the network are equipped with a single antenna, and each cluster has 1 node; 2) all devices in the network are equipped with a single antenna, and each cluster has 2 nodes;3) theAPis a 2-antenna device, where each cluster has 1 node; 4) theAPis a 2-antenna device, where each cluster has 2 nodes; 5) theAPis a 2-antenna device; cluster A has 1 node,and cluster B has 2 nodes (scheme S2); and 6) theAPis a 2-antenna device, cluster A has 2 nodes, and cluster B has 1 node (scheme S1).
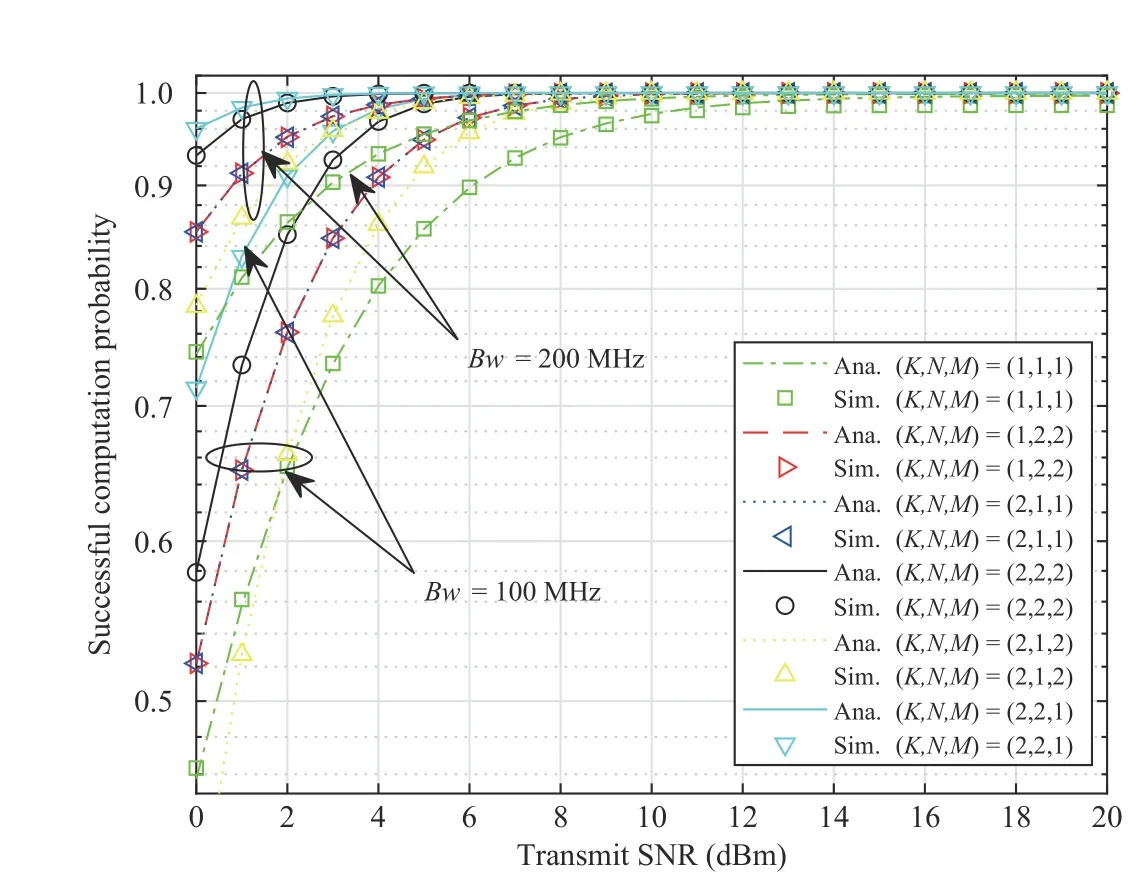
Fig. 7. ξS versus the transmit SNR for different numbers of AP antennas and SNs in clusters with the SC schemes.
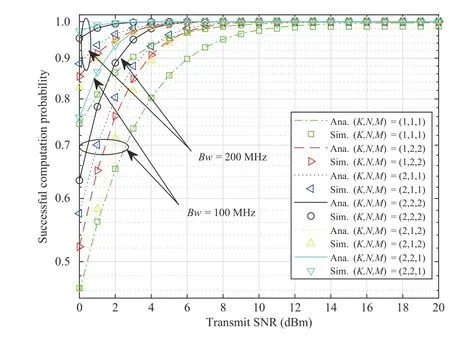
Fig. 8. ξS versus the transmit SNR for different numbers of AP antennas and SNs in clusters with the MRC schemes.
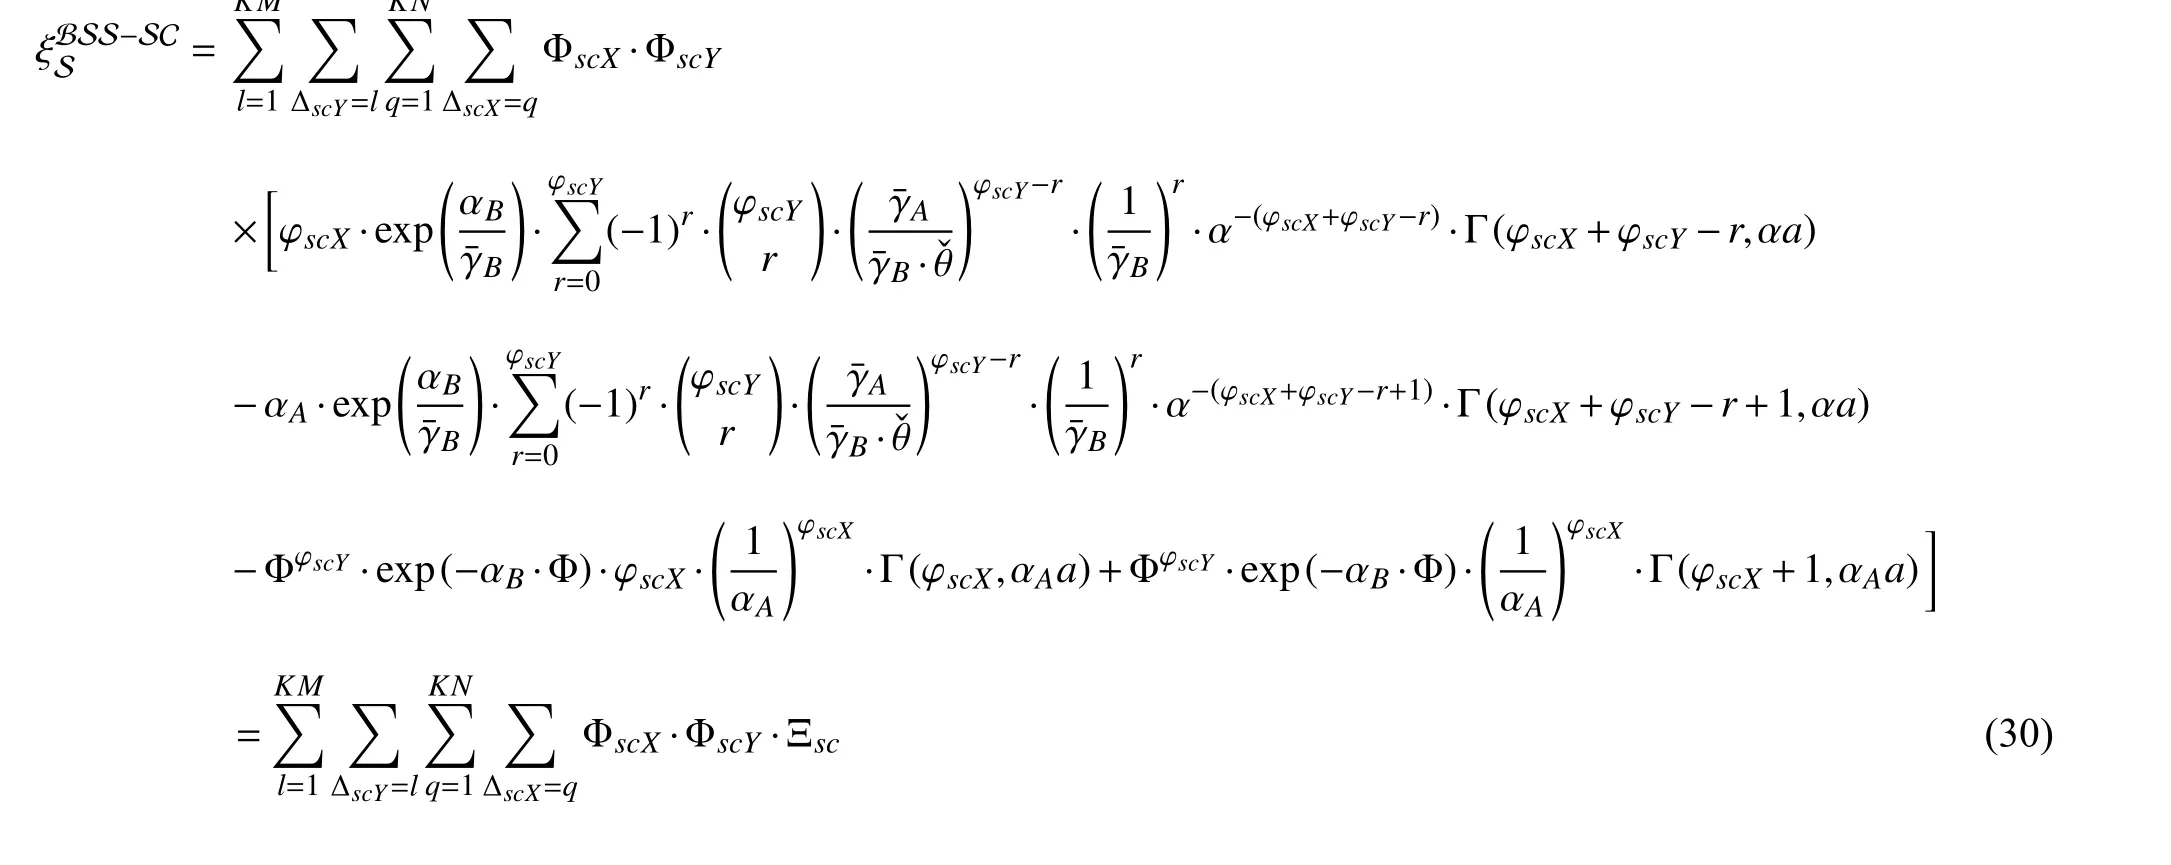
Figs. 7 and 8 show the difference between SC and MRC scheme groups. We observe that Scenarios 2 and 3 of the SC schemes have entirely identical results, which makes perfect sense for formula (30) in Lemma 1, where ξSSCis constant when the product of the number of antennas of theAPand the number of SNs in each cluster is constant. However, in the MRC schemes, the number of antennas is more critical because allAPantennas participate in the communication process. Hence, a higherKcorresponds to better system performance (ξSMRCin Scenario 3 is better than ξSMRCin Scenario 2), which appears reasonable considering that the BSS-MRC scheme uses all antennas.
We investigate the effect of the bandwidth on the system performance, i.e.,Bw= 100 MHz andBw= 200 MHz. The bandwidth significantly affects the SCP when the transmit SNR is less than 10 dBm.
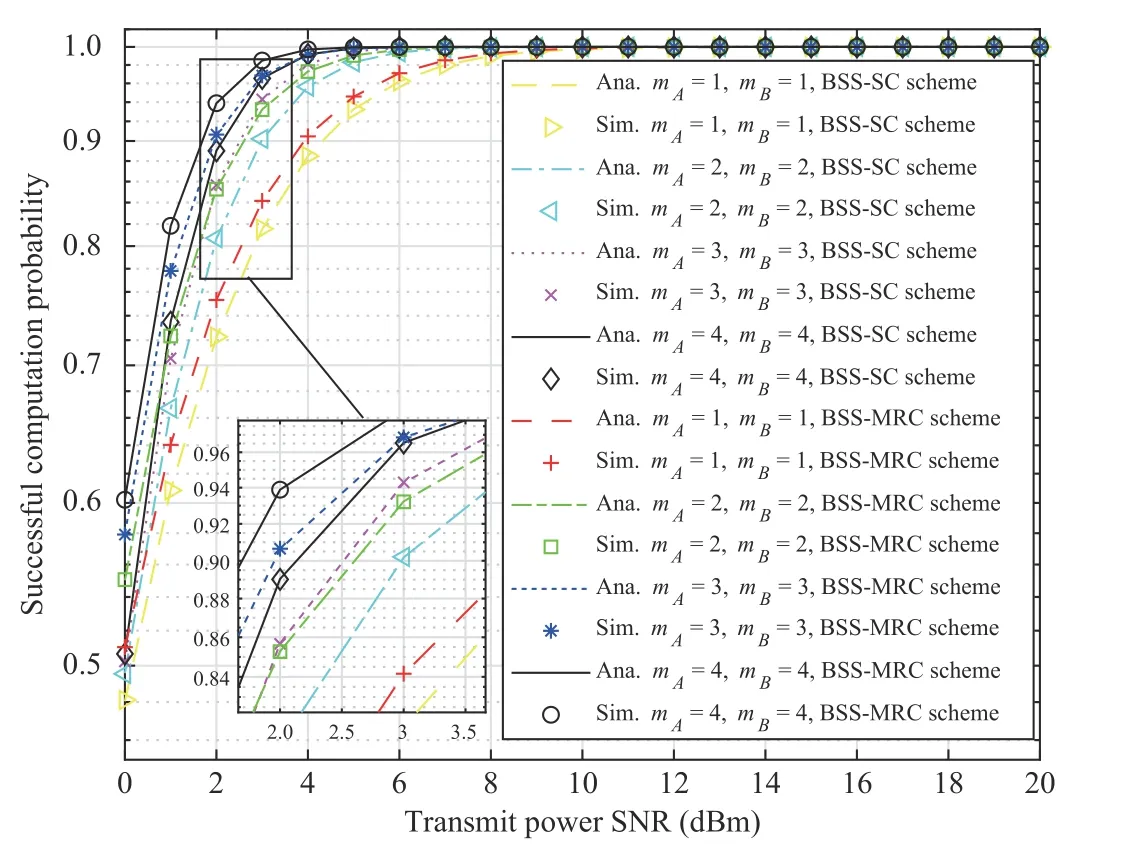
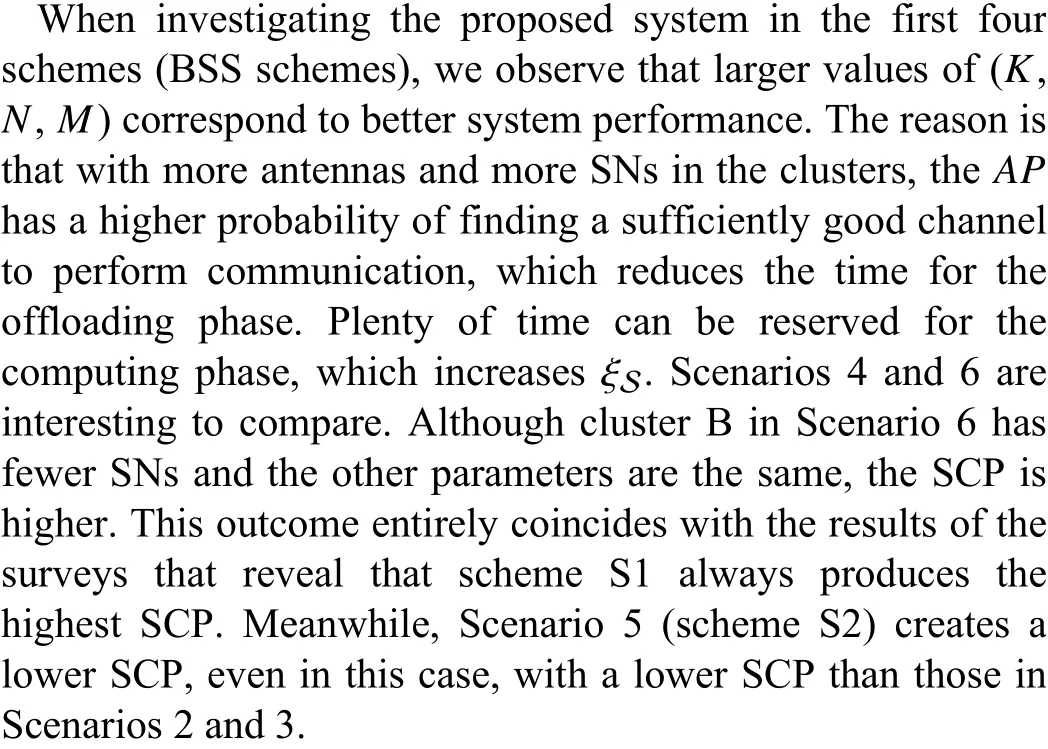
Fig. 9. ξS versus the transmit SNR for different Nakagami- m shape factors in the BSS schemes.
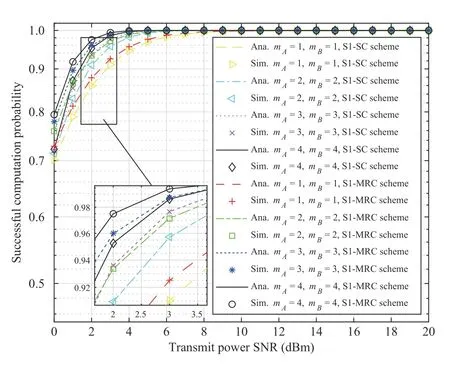
Fig. 10. ξS versus the transmit SNR for different Nakagami- m shape factors in the S1 schemes.
Fig. 11. ξS versus the transmit SNR for different Nakagami- m shape factors in the S2 schemes.
Figs. 9–11 depict the SCP for different shape factors of Nakagami-m(mAandmB) in the BSS, S1 and S2 schemes.Clearly, the SCP associated withmA= 1 andmB= 1 is the smallest because whenmA= 1 andmB= 1, the transmission channels follow Rayleigh fading. Moreover, we observe that a higher shape factormcorresponds to a higher ξS. This result occurs because whenmAandmBincrease, the channel quality improves, which improves the system performance. The small figure in Fig. 9 shows that whenmAandmBincrease from 3 to 4, ξSinsignificantly changes. However, when shape factormincreases, the number of operations required to calculateξSconsiderably increases.s We observe that the system performance when using the two proposed algorithms are identical and relatively better than that of the solution in [21]. Moreover, our analysis of the system energy consumption is more realistic.
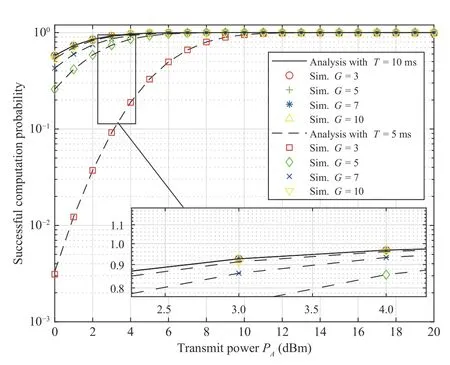
Fig. 12. ξS versus the transmit SNR for different values of G in the BSS schemes.
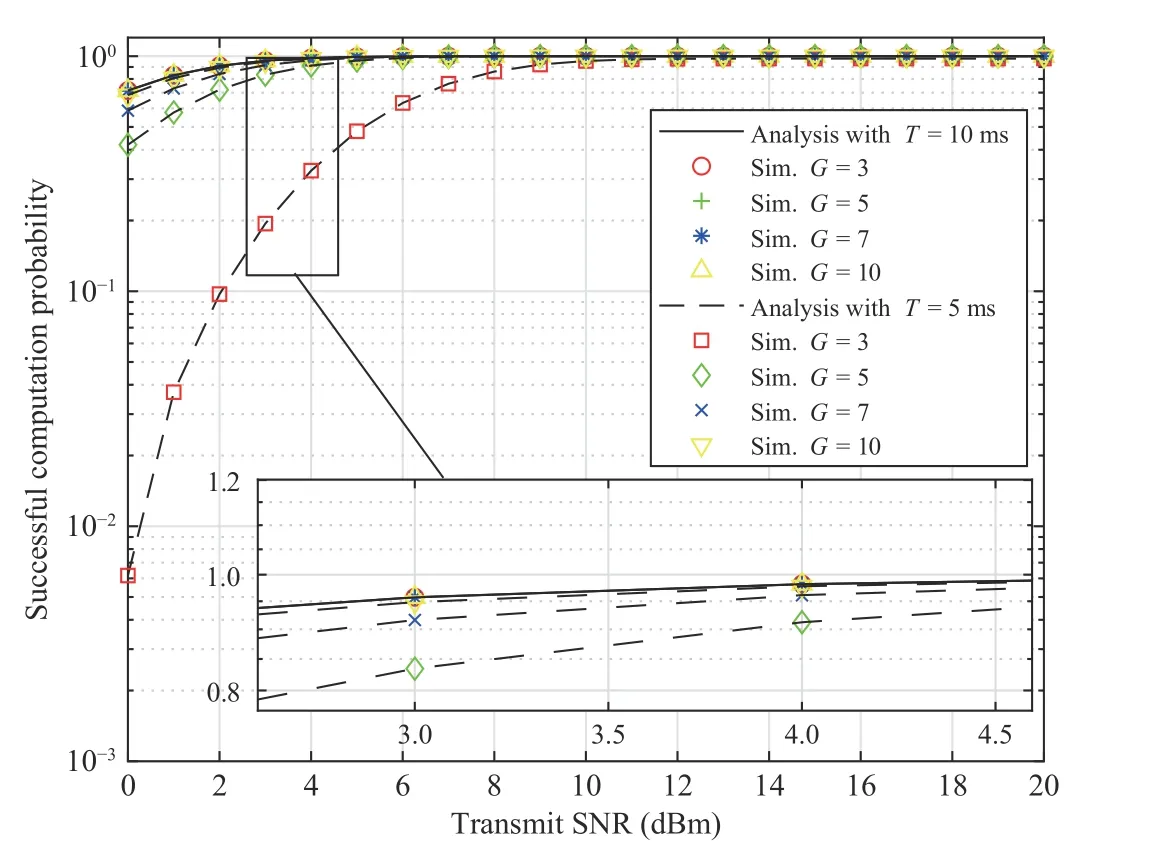
Fig. 13. ξS versus the transmit SNR for different values of G in the S1 schemes.
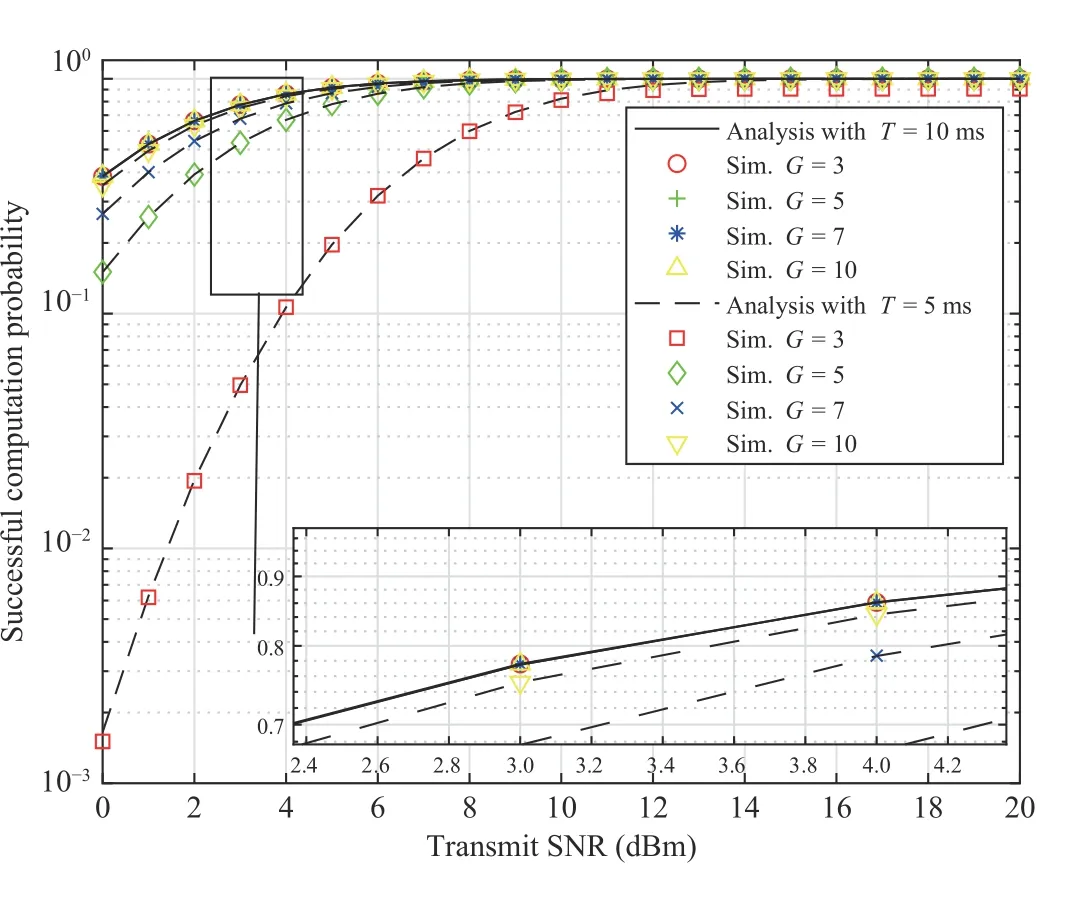
Fig. 14. ξS versus the transmit SNR for different values of G in the S2 chemes.
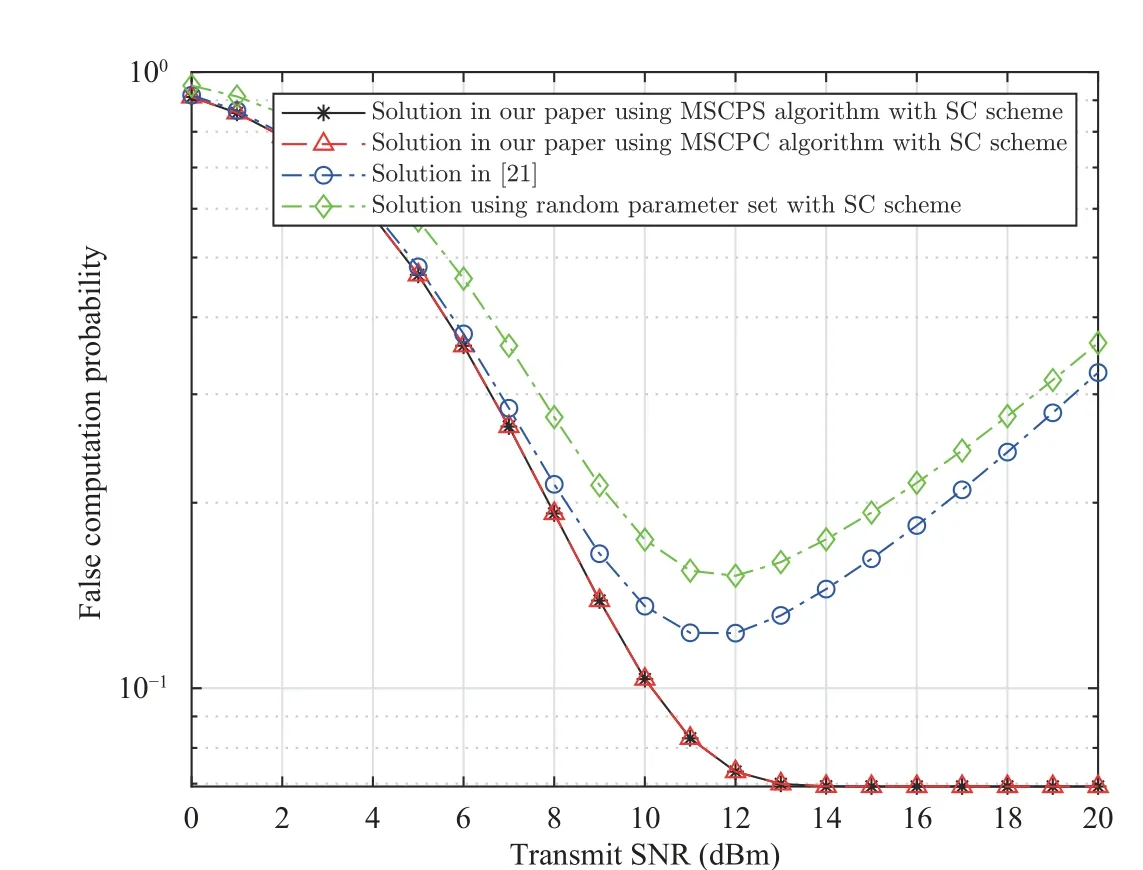
Fig. 15. System performance comparison (simulation results) among the optimal algorithms in the SC schemes.
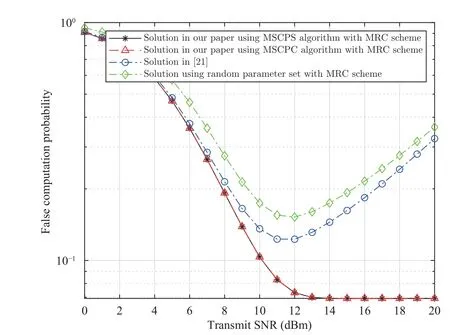
Fig. 16. System performance comparison (simulation results) among the optimal algorithms in the MRC schemes.

VI. CONCLUSIONS
In this paper, we investigate the system performance of a WSN based on the NOMA-MEC architecture. We considered a system model where two sensor clusters communicate with a multiantennaAPover Nakagami-mfading. We proposed a communication protocol with six schemes for the considered system: BSS-SC, BSS-MRC, S1-SC, S1-MRC, S2-SC, and S2-MRC. For each scheme, we derived the system performance analytical expressions in terms of the SCP. With the development of sensor circuit designs and digital signal processing, the proposed system model can be considered for deployment in practical scenarios. Therefore, our results are useful for wireless communication system designers and researchers in investigations about NOMA-MEC-WSN systems. In addition, we proposed two MSCP algorithms with the lowest system energy consumption: MSCPS and MSCPC. Finally,numerical results are provided with the key parameters to evaluate system performance using Monte Carlo simulations.
In future work, we will explore the case in which some antennas inKantennas are used to balance algorithmic complexity and system performance. We will also consider the error propagation effect during SCP computation to expand the scope of the study. Meanwhile, the combination of the NOMA-MEC-WSN system and radio frequency energy harvesting (RF EH) can improve the energy efficiency of SNs and prolong their battery life. This concept motivated us to investigate the RF EH NOMA-MEC-WSN multiple-cluster system, where the CHs will receive wireless energy from theAPand use that energy for communication and local computation with imperfect CSI.
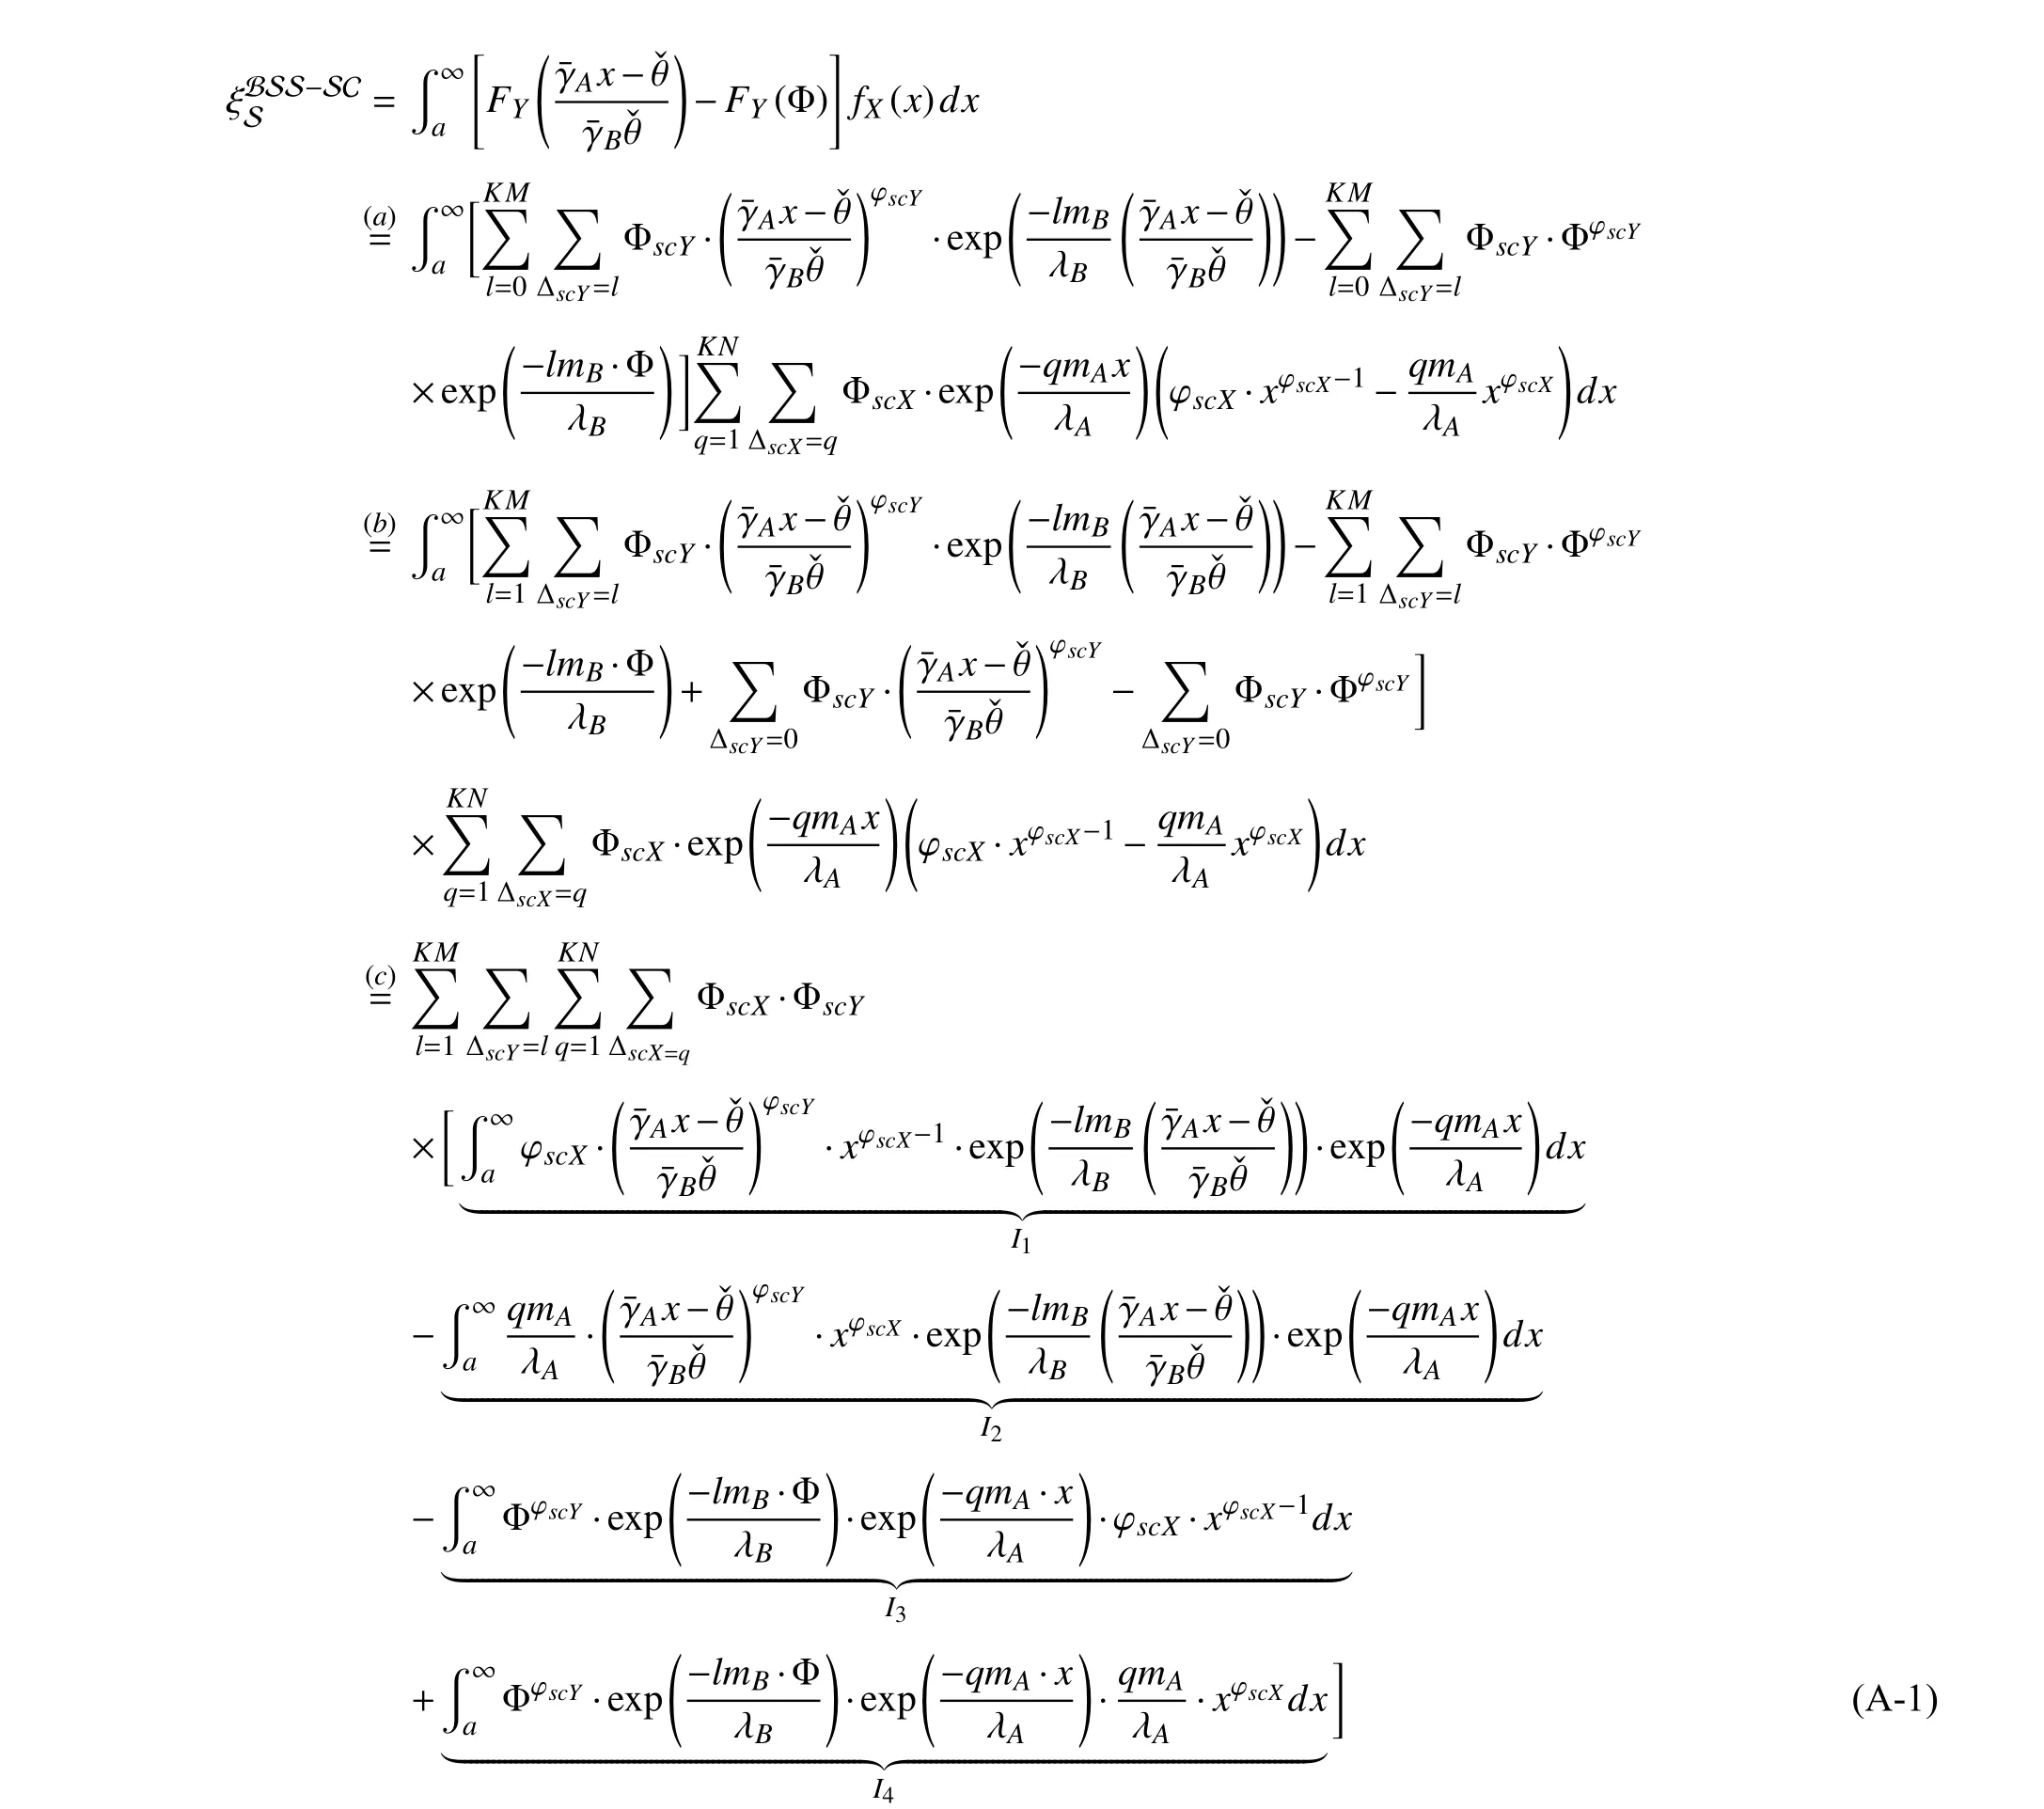
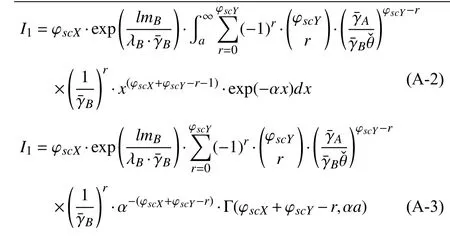
We now prove (30). By using the fundamental properties of CDFs and PDFs and applying the definition of probability, we obtain (A-0). Let us set
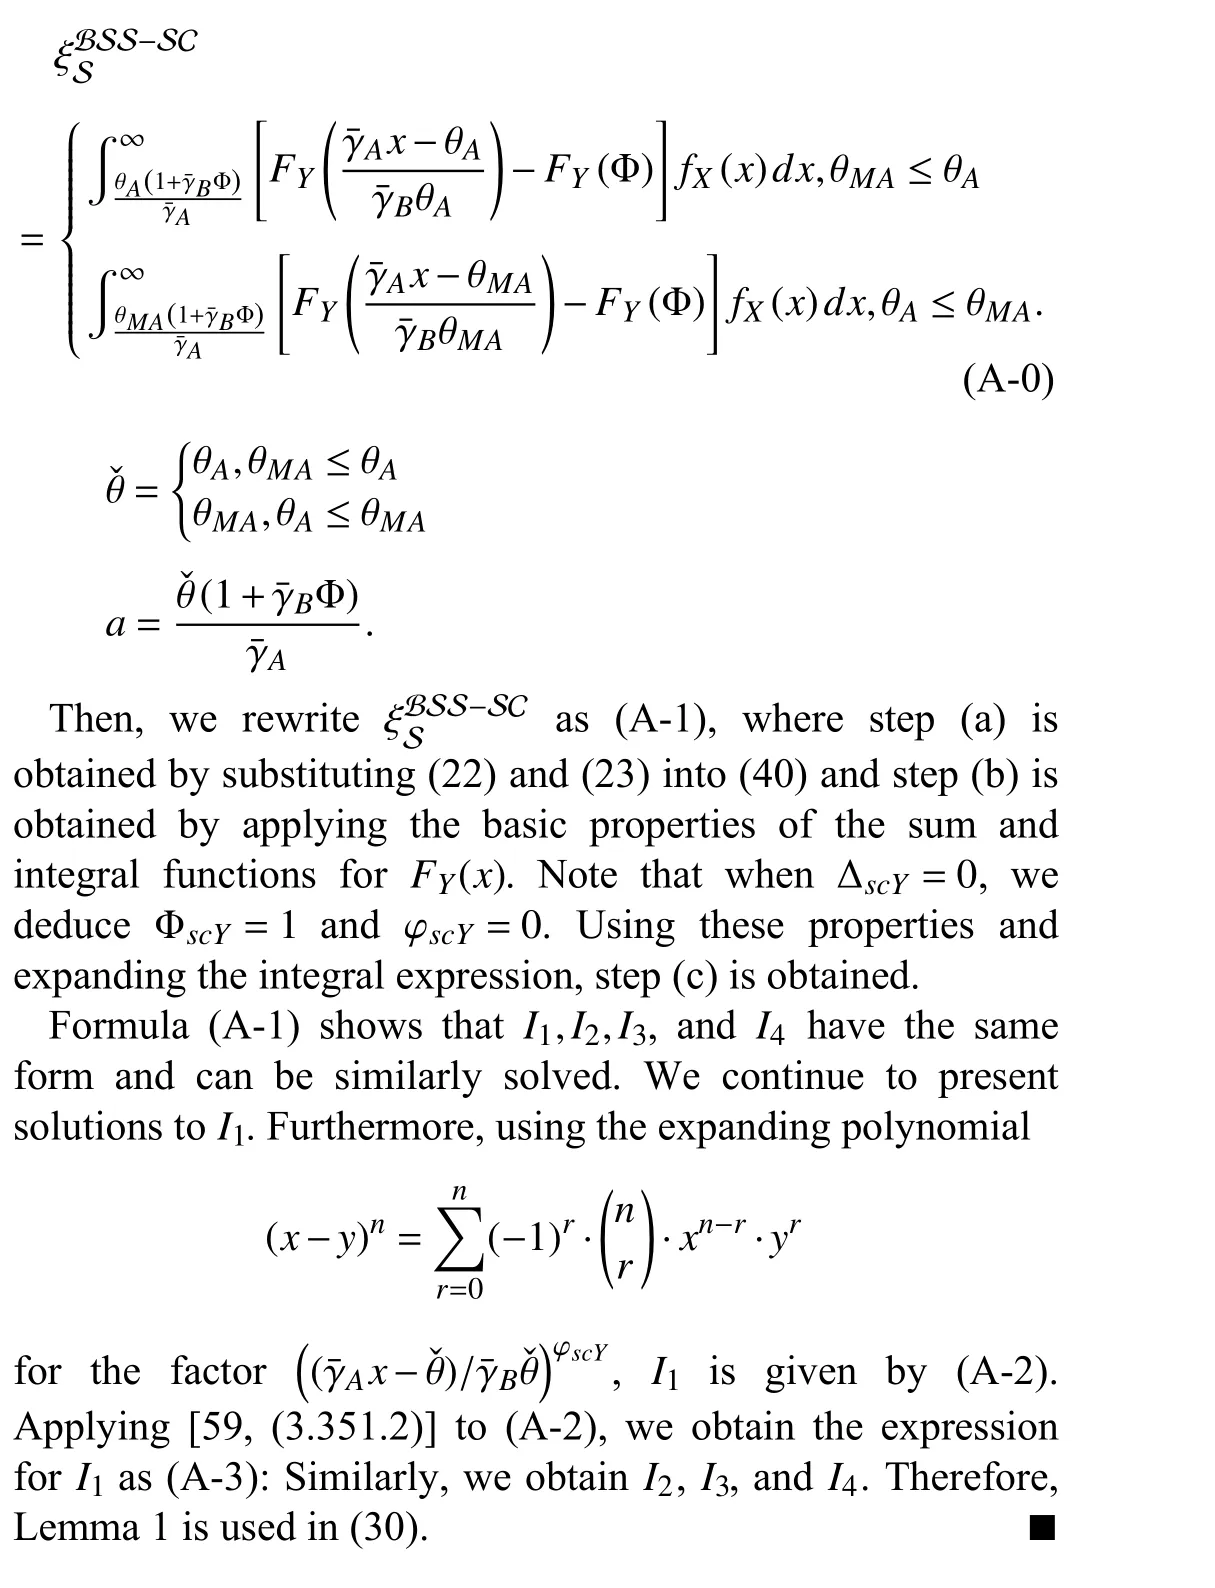
APPENDIX PROOF OF (30)
杂志排行
IEEE/CAA Journal of Automatica Sinica的其它文章
- Energy Theft Detection in Smart Grids: Taxonomy,Comparative Analysis, Challenges, and Future Research Directions
- Continuous-Time Prediction of Industrial Paste Thickener System With Differential ODE-Net
- Unmanned Aerial Vehicles: Control Methods and Future Challenges
- A Braille Reading System Based on Electrotactile Display With Flexible Electrode Array
- A Short-Term Precipitation Prediction Model Based on Spatiotemporal Convolution Network and Ensemble Empirical Mode Decomposition
- A Sandwich Control System with Dual Stochastic Impulses
