Distinct Evolution of the SST Anomalies in the Far Eastern Pacific between the 1997/98 and 2015/16 Extreme El Niños
2022-04-02ShaoleiTANGJingJiaLUOLinCHENandYongqiangYU
Shaolei TANG, Jing-Jia LUO*, Lin CHEN, and Yongqiang YU
1Institute for Climate and Application Research (ICAR), Nanjing University of Information Science and Technology, Nanjing 210044, China
2Key Laboratory of Meteorological Disaster, Ministry of Education (KLME)/ILCEC/CIC-FEMD, Nanjing University of Information Science and Technology, Nanjing 210044, China
3State Key Laboratory of Numerical Modeling for Atmospheric Sciences and Geophysical Fluid Dynamics (LASG),Institute of Atmospheric Physics, Chinese Academy of Sciences, Beijing 100029, China
4University of Chinese Academy of Sciences, Beijing 100049, China
5Center for Ocean Mega-Science, Chinese Academy of Sciences, Qingdao 266071, China
ABSTRACT The 2015/16 El Niño displayed a distinct feature in the SST anomalies over the far eastern Pacific (FEP) compared to the 1997/98 extreme case. In contrast to the strong warm SST anomalies in the FEP in the 1997/98 event, the FEP warm SST anomalies in the 2015/16 El Niño were modest and accompanied by strong southeasterly wind anomalies in the southeastern Pacific. Exploring possible underlying causes of this distinct difference in the FEP may improve understanding of the diversity of extreme El Niños. Here, we employ observational analyses and numerical model experiments to tackle this issue. Mixed-layer heat budget analysis suggests that compared to the 1997/98 event, the modest FEP SST warming in the 2015/16 event was closely related to strong vertical upwelling, strong westward current, and enhanced surface evaporation, which were caused by the strong southeasterly wind anomalies in the southeastern Pacific.The strong southeasterly wind anomalies were initially triggered by the combined effects of warm SST anomalies in the equatorial central and eastern Pacific (CEP) and cold SST anomalies in the southeastern subtropical Pacific in the antecedent winter, and then sustained by the warm SST anomalies over the northeastern subtropical Pacific and CEP. In contrast, southeasterly wind anomalies in the 1997/98 El Niño were partly restrained by strong anomalously negative sea level pressure and northwesterlies in the northeast flank of the related anomalous cyclone in the subtropical South Pacific.In addition, the strong southeasterly wind and modest SST anomalies in the 2015/16 El Niño may also have been partly related to decadal climate variability.
Key words: El Nño-Southern Oscillation, extreme El Niño, El Niño diversity, far eastern Pacific, decadal climate variability
1. Introduction
The El Niño-Southern Oscillation (ENSO) is the Earth’s most prominent driver for interannual climate variability, as highlighted by the occurrence of the latest extreme El Niño event in 2015/16 (Blunden and Arndt, 2016; Santoso et al.,2017). The pronounced global impacts of ENSO extend to social stability, food security, and marine habitats (e.g.,Glantz, 2001; Iizumi et al., 2014; Barnard et al., 2015; Hardiman et al., 2018), thus underscoring the necessity to improve understanding of ENSO dynamics for its accurate prediction and disaster risk reduction.
As the first extreme El Niño of the 21st century, the 2015/16 El Niño is characteristically distinct from the 1997/98 extreme El Niño during its peak phase in November-January (Fig. 1; L’Heureux et al., 2017; Paek et al.,2017; Ren et al., 2017; Xue and Kumar, 2017; Zhong et al.,2019). For example, compared with the 1997/98 El Niño,the equatorial Pacific SST anomalies of the 2015/16 El Niño were cooler in the east and slightly warmer in the west, i.e., the equatorial warm SST anomaly center was displaced westward (Figs. 1a-c). Interestingly, the largest difference in the SST anomalies between the two extreme El Niños appeared in the far eastern Pacific (FEP, 0°-15°S,80°-100°W, red box in Fig. 1c), rather than in the equatorial Niño-3.4 region (5°N-5°S, 120°-170°W, blue box in Fig. 1c). As shown in Fig. 1d, the SST anomalies averaged in the Niño-3.4 region were nearly equal during the peak phase of the two extreme El Niños. In contrast, the SST anomalies in the FEP in the 1997/98 El Niño reached as high as 3.2°C, while those in the 2015/16 El Niño were merely 1.5°C, just a half of those in the 1997/98 El Niño.
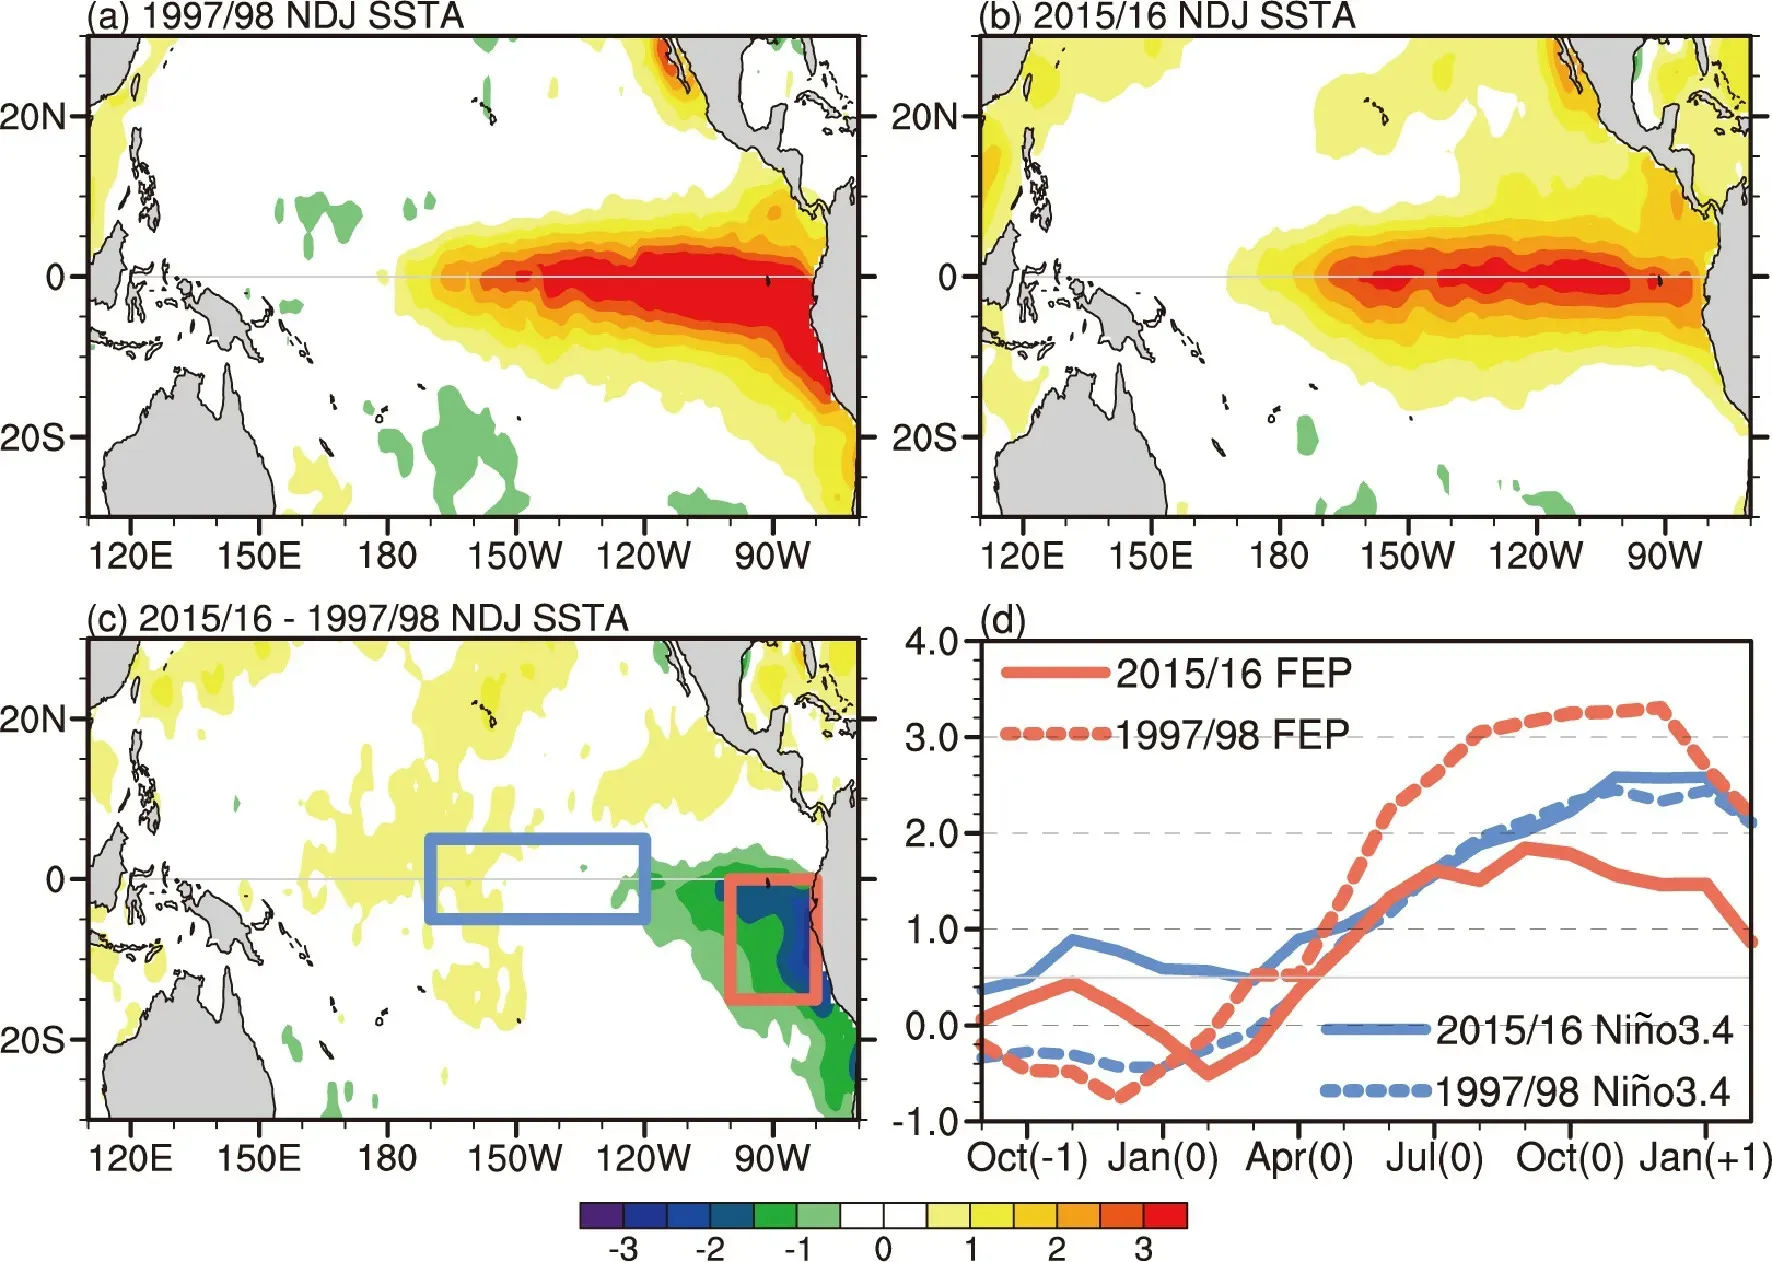
Fig. 1. Spatial pattern of SST anomalies (°C) during the mature phase (November-January, NDJ) of (a) the 1997/98 El Niño, (b) the 2015/16 El Niño, and (c) their difference. (d) SST anomalies averaged in the Niño-3.4 and fareastern Pacific (FEP) regions during the development of the 1997/98 and 2015/16 El Niños. Red and blue boxes in(c) denote the FEP (0°-15°S, 80°-100°W) and Niño-3.4 (5°N-5°S, 120°-170°W) regions, respectively. 0, -1, and+1 in the abscissa of (d) indicate the El Niño year, the preceding year, and the following year, respectively.
Strong warm SST anomalies in the FEP often have significant impacts on the marine ecosystem in the eastern Pacific and economics and social stability of countries located along the west coast of South America (Barber and Chavez, 1983; Takahashi, 2004; Peng et al., 2019; Echevin et al., 2020). The Pacific coast of Peru and Ecuador is usually kept cool and dry by intense upwelling of cold water from subsurface. Strong warm events are often associated with deepening of the nearshore thermocline and nutricline(Barber and Chavez, 1983; Espinoza-Morriberon et al.,2017), and the upwelling of cold, nutrient-replete waters and the associated primary productivity are thus strongly depressed, leading to a modification of marine food chains and biodiversity (Barber and Chavez, 1983; Echevin et al.,2020). Furthermore, warm SST anomalies over the FEP tend to induce atmospheric deep convection, triggering heavy rainfall and flooding in the arid coastal zone. For example, during the 1997/98 El Niño event, the losses of the society and economy caused by devastating rainfall events in Northern Peru were estimated to exceed $3.5 million (Sanabria et al., 2018). Therefore, it is necessary to investigate the underlying mechanisms responsible for the large difference in the FEP SST anomalies between the two extreme events for better predictions and mitigations.
Previous studies on the 2015/16 El Niño event have mainly focused on the westward displaced warm SST anomaly center along the equator compared to the 1997/98 El Niño event (e.g., L’Heureux et al., 2017; Paek et al., 2017;Ren et al., 2017; Xue and Kumar, 2017; Zhong et al., 2019).It has been suggested that this might be related to enhanced easterly wind anomalies in the eastern Pacific, which may have been partly caused by the multi-decadal enhancing of trade winds since 2000 (Luo et al., 2012; L’Heureux et al.,2017; Xue and Kumar, 2017) or strong equatorward winds(Zhong et al., 2019). In contrast, few studies have paid attention to possible causes of the large difference of SST anomalies in the FEP between the 1997/98 and 2015/16 extreme El Niños. Zhong et al. (2019) suggested that the suppressed SST anomaly in the Niño-1+2 region (0°-10°S, 80°-90°W)in 2015 might be related to the southerly wind anomalies over the southeastern tropical Pacific, which in turn were initially triggered by the warm SST anomalies over the northeastern subtropical Pacific (NESP, 15°-30°N, 110°-140°W, red box in Fig. 2b) in 2015 boreal spring. However, considerable cold SST anomalies existed in the southeastern subtropical Pacific (SESP, 20°-30°S, 70°-120°W, blue box in Fig.2b) since early 2015 (Figs. 2b, e). Whether the cold SESP SST anomalies might also have played a role in inducing the southeasterly wind anomalies, thus contributing to the suppressed SST development in the FEP in 2015, has not yet been explored. It remains unclear whether other processes besides SST changes might have played a role in the wind anomaly changes or not. Therefore, in this study, we attempt to explore these issues based on observational analyses and numerical experiments.
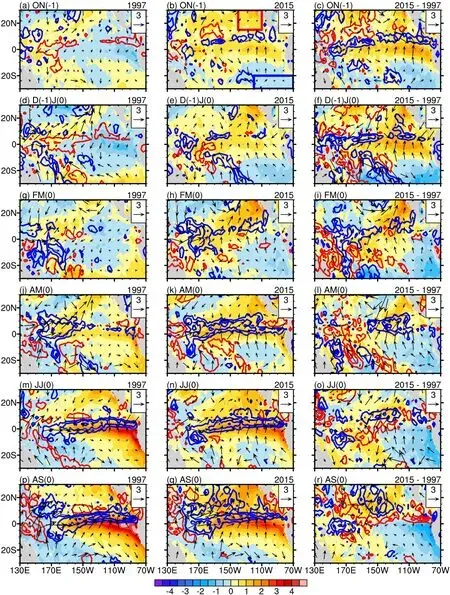
Fig. 2. Spatial distributions of SST (shading, °C), surface wind (vector, m s-1), and rainfall (contour, CI: ±2.0, ±5.0, ±9.0, ±14.0 mm d-1) anomalies during the development [October(-1) to September(0)] of the 1997/98 El Niño (left column), the 2015/16 El Niño (middle column), and their differences (right column). Red and blue boxes in (b) denote the northeastern subtropical Pacific region (NESP, 15°-30°N, 110°-140°W) and southeastern subtropical Pacific region (SESP, 20°-30°S, 70°-120°W),respectively.
The paper is organized as follows. The dataset, methodology, and model experiments are described in section 2. Section 3 compares the observed SST, precipitation, and wind anomalies between the 1997/98 and 2015/16 El Niño events. Section 4 investigates the possible factors that induce the southeasterly wind anomalies in the southeastern Pacific. Finally, a summary and discussion are given in section 5.
2. Data, methodology, and numerical experiment
2.1. Data and methodology
The observational SST data used in this study are from the Hadley Centre Global Sea Ice and Sea Surface Temperature (HadISST) version 1.1 (Rayner et al., 2003). NCEP GODAS data provides oceanic 3D temperature and velocity fields (Saha et al., 2006). 20°C-isotherm depth is calculated using the EN4 dataset, a subsurface temperature and salinity dataset for the global oceans from the Met Office Hadley Centre (Good et al., 2013). Surface heat flux is analyzed using the ESSO-INCOIS TropFlux data (Kumar et al.,2012). Precipitation data is from the CPC Merged Analysis of Precipitation (CMAP, Xie and Arkin, 1997). To reduce the uncertainty of surface wind data, they are derived from the ensemble mean of the 10-m wind of the NCEP-DOE Reanalysis-2 data (Kanamitsu et al., 2002) and the JRA-55 reanalysis data (Kobayashi et al., 2015). Cloud amount data is from the International Satellite Cloud Climatology Project (ISCCP)-H Series (Young et al., 2018). Monthly anomalies are obtained by subtracting the monthly mean climatology of the period 1981-2010.
The mixed-layer heat budget analysis is conducted to diagnose the relative importance of different processes in controlling changes in upper ocean temperatures during the developing phase of El Niño events. The mixed-layer temperature tendency equation may be written as:

where u, v, and w denote three-dimensional ocean current velocities, T is the mixed-layer temperature, ()′denotes the interannual anomaly,denotes the monthly climatological mean, Qnetrepresents surface net heat fluxes (positive indicates ocean gains heat), R represents the residual term, ρ =103kg m-3is the density of water, cp= 4000 J kg-1K-1is the specific heat of water, and h is the mixed-layer depth that is defined as the depth where ocean temperature is 0.8°C lower than SST. All the budget terms in Eq. (1) are integrated from the surface to the mixed-layer base.
2.2. Model description and experiment design
2.2.1. The model
The global ocean-atmosphere coupled model used in this study is the Climate Forecast System version 1.0 of Nanjing University of Information Science and Technology(NUIST CFS1.0), which is developed from the coupled model SINTEX-F (Luo et al., 2003, 2005a, b; Masson et al.,2005). The atmosphere component is the latest version of ECHAM4 with a high horizontal resolution of about 1.1° ×1.1° (T106) and a hybrid sigma-pressure vertical coordinate(19 levels in total). The ocean component is the reference version 8.2 of OPA with the ORCA 2 configuration, and the horizontal resolution is 2° cos (latitude) × 2° in longitude with meridional resolution being increased to 0.5° near the equator. It has 31 vertical levels, 19 of which are set in the top 400 meters. The coupling variables (i.e., SST, surface momentum, heat and water fluxes) are interpolated and exchanged every two hours between the OPA and ECHAM4 models by means of the OASIS 2.4 coupler (Valcke et al., 2000). The impact of ocean surface currents on the surface momentum flux is included (Luo et al., 2005b).The coupled model does not apply any flux correction except that sea ice cover is relaxed toward observed monthly climatology in the ocean model.
2.2.2. Sensitivity experiments
The NUIST CFS1.0 coupled model has displayed excellent performance in simulating and predicting El Niño/La Niña events (e.g., Luo et al., 2005a, 2008, 2017; Ham et al.,2019). Specifically, the model predicted an El Niño event occurring in the winter season of 2015 from as early as February 2015 (i.e., about 10 months in advance). The realtime ensemble forecasts of El Niño/La Niña using the NUIST CFS1.0 model at lead times of up to two years have been provided monthly at https://icar.nuist.edu.cn/qhcp/list.htm.
The hindcast sensitivity experiments consist of ninemember ensemble predictions generated by various combinations of different initial conditions and modified coupling physics (Luo et al., 2005a, 2008). Only the observed weekly NOAA OISST values are assimilated into the coupled model to generate realistic and well-balanced initial conditions required for the hindcasts. To assess the possible impacts of negative SST anomalies in the SESP, positive SST anomalies in the NESP, and their combined impact on the development of SST anomalies in the FEP during the 2015/16 El Niño, six groups of sensitivity experiments are conducted.
The first group of sensitivity experiments are started from 1 February 2015. The observed monthly climatological mean SSTs from 1981-2010 are specified in one sensitivity experiment (CLMFeb_SESP) and the observed monthly SST values from 2015 are specified in the other sensitivity experiment (OBSFeb_SESP) in the SESP, respectively. Elsewhere, free ocean-atmosphere coupling is kept in the two sensitivity experiments. Thus, the differences between the two sensitivity experiments (OBSFeb_SESPminus-CLMFeb_SESP) represent the impacts of the SESP SST anomalies on the development of FEP SST anomalies in the 2015/16 El Niño. The second group of sensitivity experiments is similar to the first group, except that the experiments are conducted starting from 1 March 2015. The differences between the two sensitivity experiments(OBSMar_SESP-minus-CLMMar_SESP) also represent the impacts of the SESP SST anomalies on the development of FEP SST anomalies in the 2015/16 El Niño. The results of the two groups of the sensitivity experiments that include 18 ensemble members in total (OBS_SESP-minus-CLM_SESP) are analyzed together to obtain robust results.
Similarly, the third and fourth groups of sensitivity experiments are conducted to investigate the impact of SST anomalies in the NESP on the FEP SST anomalies (OBS_NESPminus-CLM_NESP). The fifth and sixth groups of sensitivity experiments are conducted to investigate the combined impact of SST anomalies in the NESP and SESP on the FEP SST anomalies (OBS_BOTH-minus-CLM_BOTH). These groups of the sensitivity experiments are summarized in Table 1.
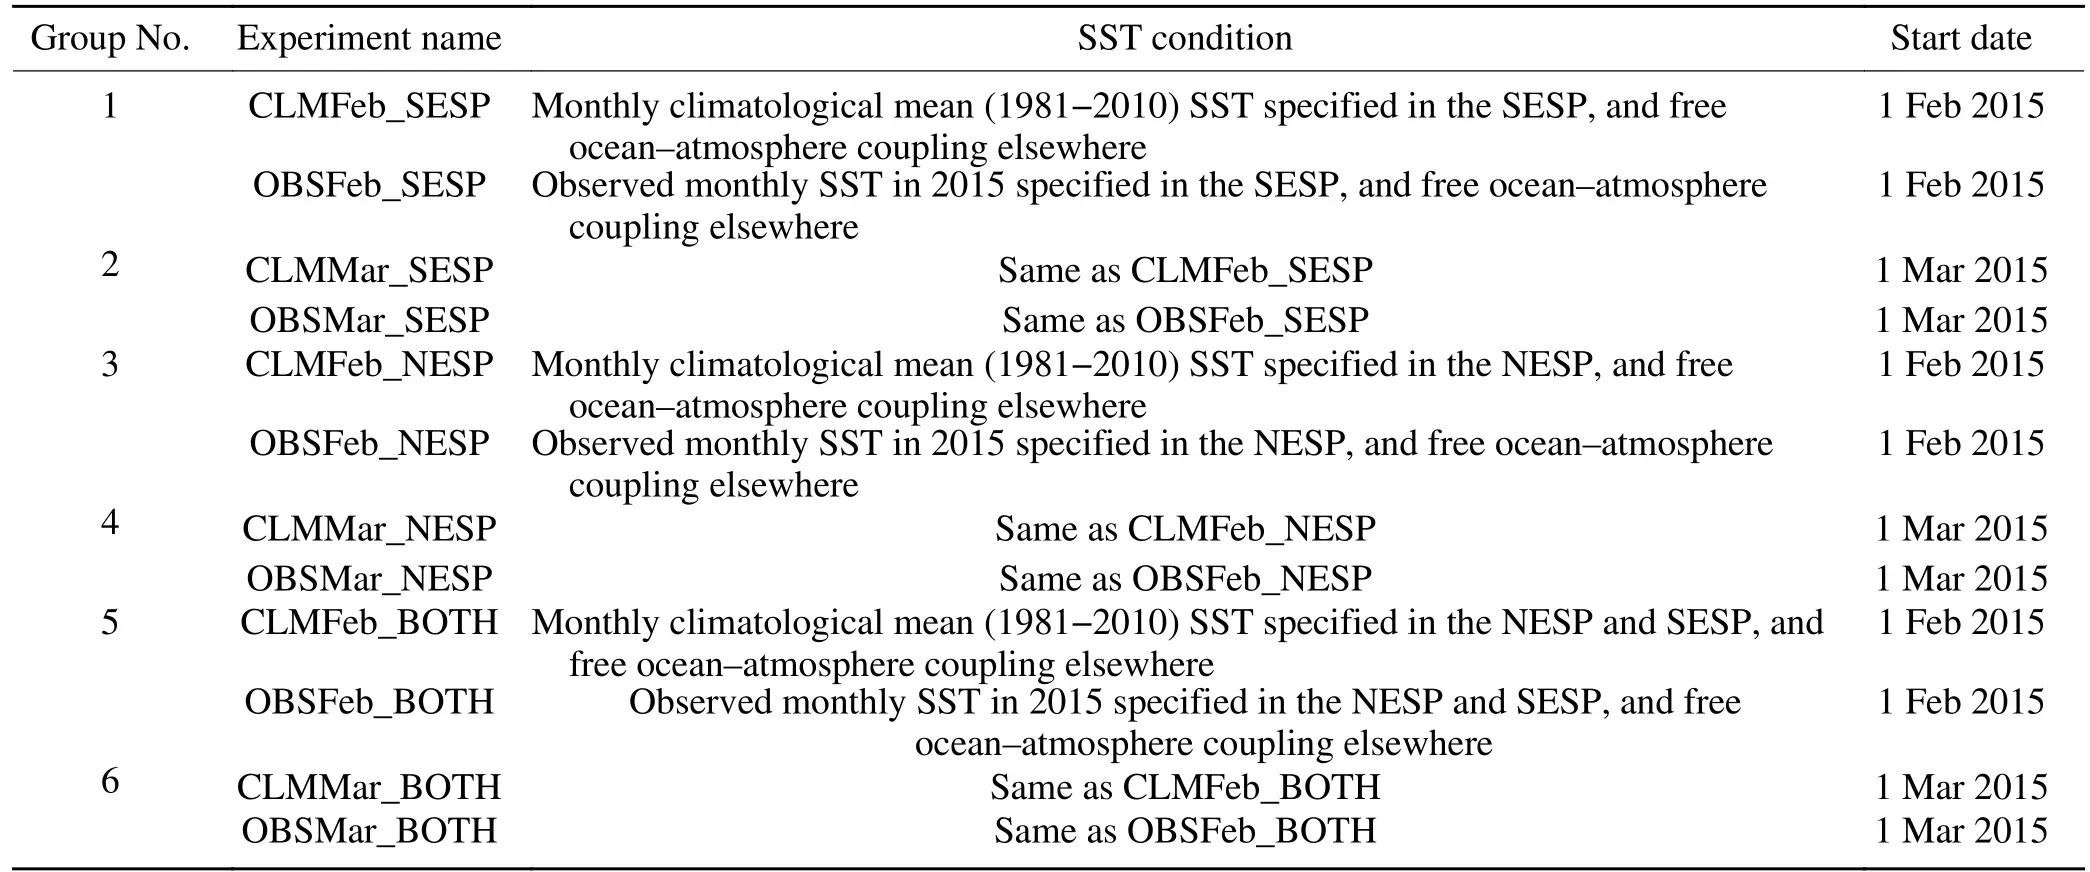
Table 1. Six groups of sensitivity experiments conducted to investigate possible impacts of SST anomalies in the southeastern subtropical Pacific (SESP, 20°-30°S, 70°-120°W), northeastern subtropical Pacific (NESP, 15°-30°N, 110°-140°W), and their combined impact on the development of SST anomalies during the 2015/16 El Niño.
3. Comparison between the 1997/98 and 2015/16 extreme El Niños
Figure 1 shows that in both 1997 and 2015, along with the development of basin-scale El Niño events, warm SST anomalies appeared in the FEP at the same time. However,the growth rates of SST anomalies in the FEP in the two extreme El Niño events were significantly different. As shown in Fig. 1d, the magnitudes of the warm SST anomalies in the FEP in the two events were nearly the same in April and both reached about 0.5°C. However, the FEP SST anomalies by September in 1997 reached more than 3.0°C,while those in 2015 were lower than 2.0°C.
To explore possible underlying mechanisms behind thelarge difference in the FEP SST anomalies between the two extreme events, spatial patterns of SST, precipitation, and surface wind anomalies are compared. Figure 2 shows that remarkable differences existed in the surface wind anomalies over the southeastern Pacific (0°-30°S, 70°-120°W)between the two events. Strong southeasterly wind anomalies existed in the southeastern Pacific during the developing phase of the 2015/16 event (April-September). In contrast, there were no apparent southeasterly wind anomalies in the southeastern Pacific in the 1997/98 El Niño. These southeasterly wind anomalies in the 2015/16 event even crossed the equator and reached the North Pacific. Corresponding to the strong southeasterly wind anomalies, the 2015/16 event shows relatively strong westward propagating zonal current and upward vertical currents in the FEP compared to the 1997/98 event (Figs. 3b-c).
It is worth mentioning that although the anomalous surface meridional winds in the 2015/16 event are always positive over the FEP, the anomalous zonal currents are not always flowing westward and vertical currents are not always upward [Figs. 3b-c, S1-S2 in the electronic supplementary material (ESM)]. This is probably because the zonal and vertical current anomalies in the FEP are not only affected by surface wind anomalies, but also affected by other factors, such as mesoscale eddies (Chaigneau et al.,2011), south equatorial current, and local-scale currents.The effect of meridional wind anomalies may be overwhelmed by other factors in 2015/16, resulting in the mismatch between southerly wind anomalies and eastward propagating zonal currents and downward vertical currents.This is the same case for the 1997/98 event. Nevertheless,of particular interest in this study is the difference between the 1997/98 and 2015/16 events. The difference in surface wind anomalies between the two events corresponds well with that in the current anomalies between the two events,with stronger southeasterly anomalies and westward propagating zonal currents and upward vertical currents in the 2015/16 event compared to the 1997/98 event, as shown in Fig. 3 and Figs. S1-S2 in the ESM.
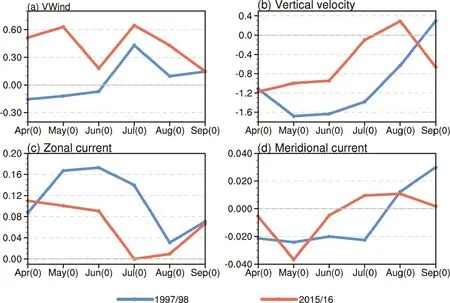
Fig. 3. (a) Meridional wind (m s-1), (b) vertical velocity (10-6 m s-1; positive indicates upwelling), (c) zonal current(m s-1), and (d) meridional current (m s-1) anomalies averaged in the FEP region (0°-15°S, 80°-100°W) during the developing phase [April(0) to September(0)] of the 1997/98 and 2015/16 El Niños.
To investigate the relative contributions of different processes to the growth of the SST anomaly in the FEP in the two extreme events, mixed-layer heat budgets for the deve loping phase (April-September) of the two El Niños were analyzed. As shown in Fig. 4, thermocline feedback, Ekman pumping feedback, and zonal advection feedbackwere the three most important positive feedbacks for the development of SST anomalies in the FEP in the two extreme events. But all three terms were weaker in the 2015/16 El Niño than in the 1997/98 El Niño.
Compared to the 1997/98 El Niño, the weaker thermocline feedback (- w¯∂T′/∂z) in the 2015/16 El Niño is due to the relatively weak positive 20°C isotherm depth (D20)anomalies in the FEP (Fig. S3); the D20 anomalies are used to depict thermocline changes. The weaker Ekman pumping feedback (- w′/∂z) and zonal advection feedback(- u′/∂x) are related to the relatively strong westward propagating zonal current and upward vertical currents in the 2015/16 event (Fig. 3), which in turn are caused by the strong southeasterly anomalies in the southeastern Pacific(Fig. 2).
Besides, the nonlinear process ( -v′∂T′/∂y) also has a positive impact on the development of SST anomalies in the FEP in the two events and contributes to the differences between the two events, which may be caused by both the larger -v′(Fig. 3d) and ∂T′/∂y (Fig. S4 in the ESM) in the 1997/98 event than those in the 2015/16 event. In contrast,the nonlinear process (-u′∂T′/∂x) has a negative impact on the development of SST anomalies in the two events and offsets the differences between the two events to a large extent,which may be caused by both the larger -u′(Fig. 3c) and∂T′/∂x (Fig. S5) in the 1997/98 event. This indicates that nonlinear ocean dynamic processes should be taken into consideration when investigate mechanisms and effects of El Niño events (e.g., An and Kim, 2017; Hayashi et al., 2020).
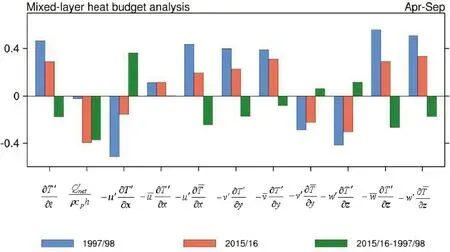
Fig. 4. Mixed-layer heat budget analysis (°C month-1) for the developing phase (April-September) of the 1997/98 El Niño (blue), 2015/16 El Niño (red), and their difference (green) in the FEP (0°-15°S, 80°-100°W).
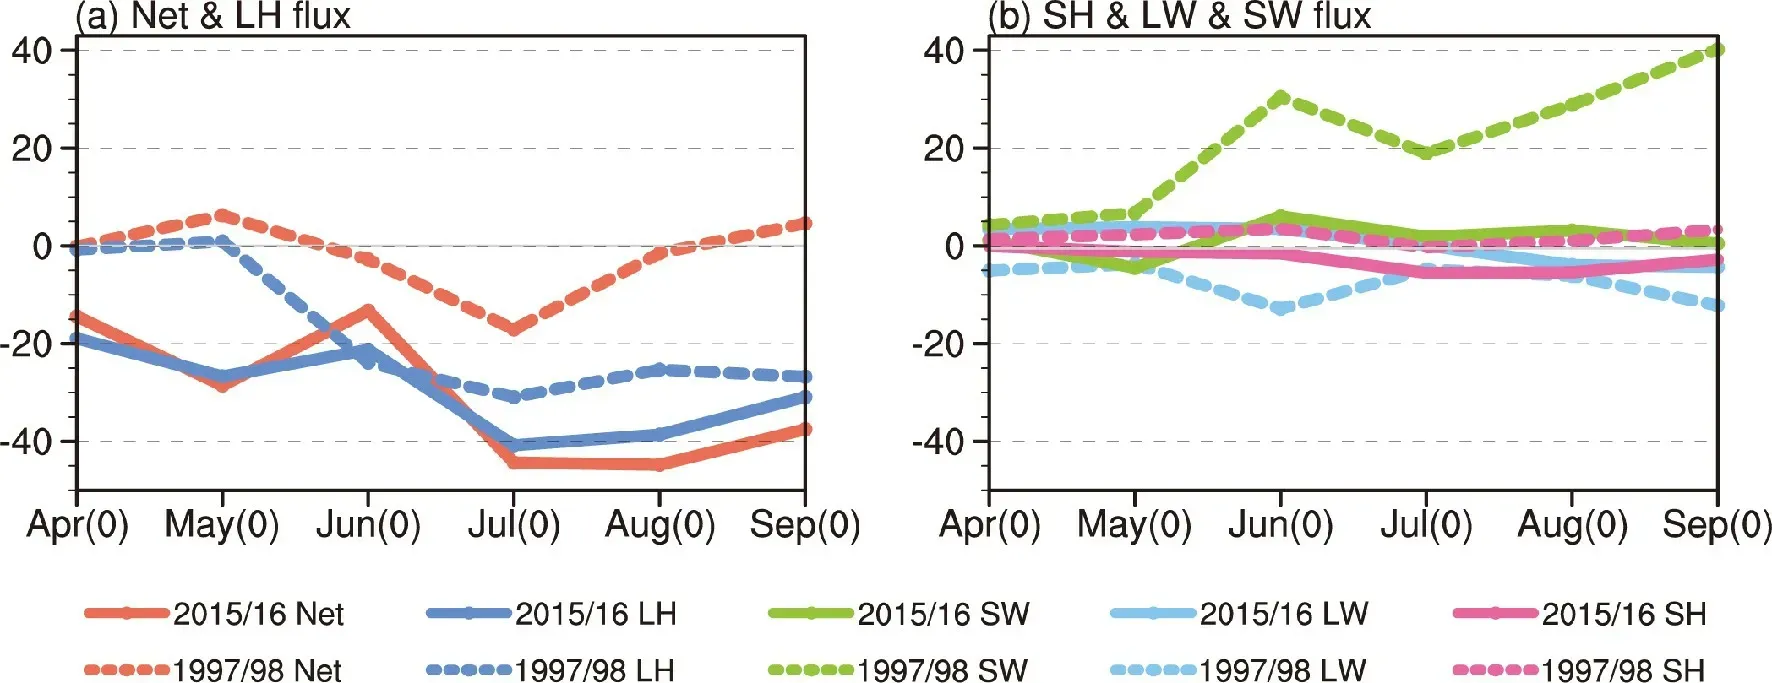
Fig. 5. Surface net heat flux (Net) anomalies and its four components: latent heat flux (LH), shortwave radiation(SW), longwave radiation (LW), and sensible heat flux (SH) (W m-2; positive downward) averaged in the FEP(0°-15°S, 80°-100°W) during the developing phase [April(0) to September(0)] of the 1997/98 and 2015/16 El Niños.
The results shown in Fig. 4 also suggest that, apart from the differences in the ocean dynamic processes, thermodynamic processes in the 2015/16 event might have also played a larger negative role in the development of the warm SST anomalies in the FEP. The surface net heat flux in the 2015/16 event was largely negative (i.e., ocean loses heat) and dominated by the latent heat flux (Fig. 5a). In contrast, the negative latent heat flux in the 1997/98 event was relatively small, and more importantly, its damping effect was mostly counteracted by the strong downward shortwave heat flux (Fig. 5b). Therefore, the negative surface net heat flux in the 1997/98 event was very weak and had a negligible impact on the development of the warm SST anomalies in the FEP in 1997 (Fig. 4). The strong downward shortwave heat flux in the 1997/98 event might have been caused by the positive SST-low cloud feedback (e.g., Klein et al.,2017); that is, the strong warm SST anomalies could have reduced the stratocumulus cloud fraction in the FEP (Fig.S6) and thus increased the shortwave heat flux into ocean(Fig. 5b).
Note that in addition to the FEP, greatly reduced lowlevel cloud anomalies also existed in the Northern Hemisphere (NH) off-equator in August-September 1997, as compared to those in 2015 (Fig. S6g in the ESM). However, this does not mean that more shortwave radiation was able to enter and heat the ocean. That is because more positive precipitation anomalies occurred there (Figs. 2p-r). The total cloud amount anomalies in the NH off-equator in August-September 1997 are positive (Fig. S7), and at the same time, the middle- and high-level cloud amount anomalies are positive and are larger than those in 2015 (Fig. S8).The greater quantity of convective clouds at middle and high levels in the NH off-equator is in accordance with the larger positive precipitation anomalies there. This indicates that in the NH off-equator, positive SST anomalies play an active role by forcing the overlying atmosphere and inducing positive precipitation anomalies there. In contrast, positive SST anomalies in the FEP play a passive role and are partly strengthened by more shortwave radiation that is caused by reduced low-level cloud cover.
4. Possible causes of the strong southeasterly wind anomalies in 2015
4.1. Effects of SST anomalies on the southeasterly wind anomalies
As was described above, different from the 1997/98 El Niño, the 2015/16 event experienced strong cross-equatorial southeasterly wind anomalies in the southeastern Pacific as early as in the antecedent autumn season (recall Figs. 2b, e). Accompanied with the strong southeasterly wind anomalies, positive SST anomalies existed in the NESP and negative SST anomalies existed in the SESP(right column in Fig. 2).
The SST anomalies of the two El Niño events showed significant difference even before the El Niños started. As shown in Figs. 2a-f, during the late autumn and early winter seasons (October-January) of 1996, negative SST anomalies existed over the CEP (Figs. 2a, d), and the magnitude of the Niño3 index (SST anomalies averaged over 5°S-5°N, 90°-150°W) was smaller than -0.5°C (Fig. S9),which is the threshold of a La Niña event. In contrast, in late 2014, positive SST anomalies existed over the CEP(Figs. 2b and e, Fig. S9 in the ESM), and 2014 eventually evolved into a weak El Niño year (Hu and Fedorov, 2016).Positive SST anomalies over the CEP could induce anomalous convection there and trigger southeasterly wind anomalies in the FEP (Figs. 6a, d).
At the same time, negative SST anomalies in the SESP also play an active role in triggering the FEP southeasterly wind anomalies (Figs. 6b, e), which usually penetrate into the equatorial Pacific and influence SST variability there(e.g., Su et al., 2014; Zhang et al., 2014; Min et al., 2015;Hu and Fedorov, 2016). Therefore, the strong southeasterly wind anomalies in the FEP during the OND(-1)J(0) (OND denotes October-November-December, -1 and 0 in brackets indicate the preceding year and the El Niño year, respectively) season of the 2015/16 event (Figs. 2b, e) are more likely contributed by both the positive SST anomalies over the CEP and negative SST anomalies over the SESP (Figs.6c, f).
During FM(0) 2015, positive SST anomalies over the CEP decayed (Fig. 2h) and the Niño3 index decreased to almost zero (Fig. S9). At the same time, positive SST anomalies over the NESP increased and reached its highest value(Fig. S9). Similar to the positive SST anomalies in the FEP,together with the negative SST anomalies in the SESP, positive SST anomalies over the NESP could trigger cross-equatorial southeasterly wind anomalies by increasing the meridional SST gradient between the NESP and the SESP (Figs.6g-i; Wu et al., 2018).
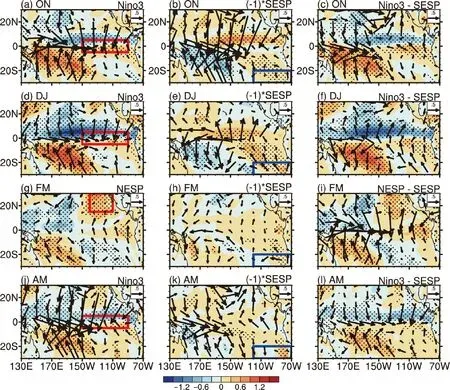
Fig. 6. Regressed surface wind anomalies (m s-1) on the standardized SST anomalies averaged in the Niño-3 (5°S-5°N,90°-150°W; red boxes in a, d, j), NESP (15°-30°N, 110°-140°W; red box in g), and SESP (20°-30°S, 70°-120°W; blue boxes in b, e, h, k) during October-November (ON), December-January (DJ), February-March (FM), and April-May (AM), respectively.Shading denotes the magnitude of meridional wind anomalies. To better display the impact of cold SESP SST anomalies on the surface wind, the sign of the regressed anomalies on the SESP SST index is reversed. Stippling denotes meridional wind regression coefficients are statistically significant at the 90% confidence level according to two-sided Student’s t-test.
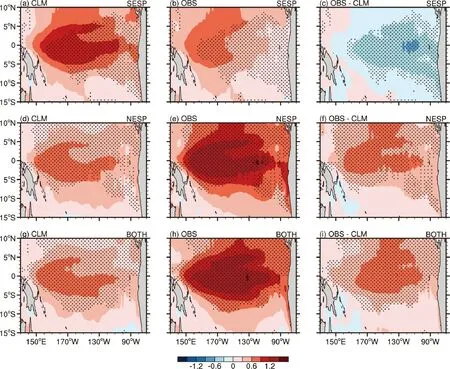
Fig. 7. Impacts of (a-c) cold SST anomalies in the SESP (20°-30°S, 70°-120°W), (d-f) warm SST anomalies in the NESP(15°-30°N, 110°-140°W), and (g-i) their combined impact on the development of NDJ (November-January) SST anomalies (°C) during the 2015/16 El Niño based on numerical sensitivity experiments. Stippling indicates the impacts are statistically significant at the 90% confidence level based on two-sided Student’s t-test.
In the following AMJJAS(0) season of 2015, positive SST anomalies over the equatorial eastern Pacific started to increase (Figs. 2, S9) because of the strong equatorial westerly wind anomalies and related downwelling Kelvin waves(Figs. 2k, n, q, S3; see also Chen et al., 2017). At the same time, compared to those of the 1997/98 El Niño, the preexisting cross-equatorial southeasterly wind anomalies pushed these positive SST anomalies northward (Figs. 2l, o, r). The northward located positive SST anomalies and related convection in turn enhanced the southeasterly wind anomalies in the southeastern Pacific (Zhong et al., 2019) and thus formed a positive feedback between them. In addition, compared to the modest positive SST anomalies in the SESP in the 1997/98 event, the negligible SST anomalies in the SESP in the 2015/16 event might also be favorable to the development of the southeasterly wind anomalies (Figs. 2l,o, r, 6k-l).
The above analysis suggests that the strong southeasterly wind anomalies in the FEP in the 2015/16 event were triggered and maintained by SST anomalies over different regions during different seasons. Positive SST anomalies over the CEP and NESP and negative SST anomalies over the SESP all contribute to the strengthening of the southeasterly wind anomalies in the FEP. It is worth mentioning that although positive SST anomalies over the NESP could induce southeasterly wind anomalies in the FEP, they could also activate the meridional modes (Chiang and Vimont,2004) and propagate and amplify from the subtropics into the equatorial central Pacific through the winds-evaporation-SST feedback (Figs. 2h, k, n, q), where the positive SST anomalies favor the development of El Niño (Alexander et al., 2010). Therefore, the net effect of positive SST anomalies over the NESP on the development of FEP SST anomalies in the 2015/16 event remains unclear and is investigated by numerical experiment in the next section.
4.2. Model experimental results
In this section, the possible impacts of SST anomalies over the NESP and SESP, and their combined impacts on the development of FEP SST anomalies in the 2015/16 El Niño event are examined by means of numerical experiments (recall Table 1). Figures 7a-c show the impact of SESP SST anomalies on the 2015/16 El Niño event. The results indicate that, without the cold SST anomalies in the SESP, positive SST anomalies in the FEP in the CLM_SESP experiment are stronger than those in the OBS_SESP experiment during the mature phase of the El Niño (Figs. 7a-c). In addition, SST anomalies in the equatorial central and eastern Pacific in the CLM_SESP experiment would be also stronger than those in the OBS_SESP experiment. This is consistent with previous studies that concluded cold SST anomalies in the southeastern Pacific could have a negative impact on the development of El Niño events (e.g., Su et al., 2014; Min et al., 2015; Hu and Fedorov, 2016).
The evolution of the hindcasted FEP SST anomalies shown in Fig. 8a reveals that the FEP SST anomalies in the OBS_SESP experiment are weaker than those in the CLM_SESP experiment during the entire evolution of the 2015/16 El Niño. The difference in the FEP SST anomalies between the two experiments gradually increases since June 2015 and reaches its maximum at the end of 2015. Consistently, the meridional wind anomalies averaged in the FEP in the CLM_SESP experiment are stronger than those in the OBS_SESP experiment (Fig. 8b), which confirms that cold SST anomalies in the SESP could suppress the development of SST anomalies in the FEP by enhancing southerly wind anomalies there. Note that the difference of meridional wind anomalies between the CLM_SESP and OBS_SESP experiments is not significant. This is probably because in the OBS_SESP experiment positive SST anomalies over the CEP are relatively modest. Even though negative SST anomalies exist in the SESP, the SST gradient between the CEP and the SESP is small, which is not conducive to the maintenance and development of southerly wind anomalies in the FEP.
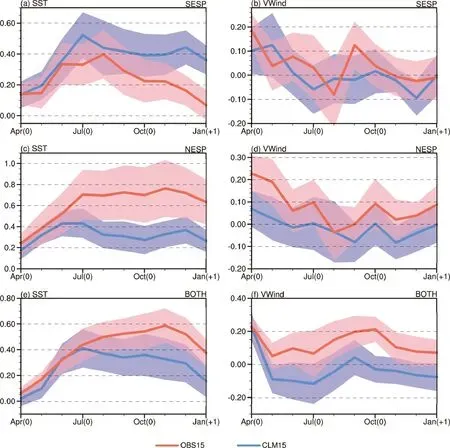
Fig. 8. Ensemble mean of (a) SST (oC) and (b) meridional wind (m s-1) anomalies averaged over the FEP (0°-15°S,80°-100°W) during April 2015 to January 2016 derived from the NESP sensitivity experiment. (c-d), (e-f) As in (a-b), but for the SESP and BOTH sensitivity experiments. Light red and blue shadings denote ensemble spread, represented by the inter-member standard deviation of the 18 members.
The impact of positive SST anomalies over the NESP on the 2015/16 El Niño event is shown in Figs. 7d-f. It turns out that, although positive SST anomalies over the NESP could induce cross-equatorial southeasterly wind anomalies as is shown in Figs. 6g and 8d, they have a net positive effect on the development of the 2015/16 El Niño and thus the SST anomalies in the FEP (Figs. 7d-f). This is because, as mentioned earlier, they could also activate the meridional modes (Chiang and Vimont, 2004), and propagate and amplify from the subtropics into the equatorial central Pacific through the winds-evaporation-SST feedback(Xie and Philander, 1994). The positive SST anomalies over the equatorial central Pacific could induce westerly wind anomalies and favor the development of an El Niño event.
In fact, previous studies have suggested that positive SST anomalies over the NESP might have played an important role in boosting the 2015/16 extreme El Niño and hence contributed to the ocean warming in the FEP (e.g., Paek et al., 2017; Su et al., 2018; Zheng et al., 2019), which is consistent with our experimental results (Figs. 7d-f). Therefore, during the 2015/16 El Niño, positive SST anomalies over the NESP may have influenced the FEP SST anomalies through two ways: One is that the NESP positive SST anomalies could have induced positive SST anomalies and westerly wind anomalies over the equatorial central Pacific, and thus contributed positively to the development of SST anomalies in the FEP; the other is that the NESP positive SST anomalies could have induced cross-equatorial southeasterly wind anomalies in the FEP, thus being detrimental to the FEP SST development. Although the negative effect(the latter way) would be overwhelmed by the positive effect (the former way), this would cause a slower increase of the FEP SST anomalies than in canonical El Niño events to some extent.
The combined impact of positive SST anomalies over the NESP and negative SST anomalies over the SESP on the 2015/16 El Niño event is shown in Figs. 7g-i. We can see that they have a net positive effect on the development of SST anomalies over the FEP. This indicates that the negative effect of the cold SST anomalies in the SESP (Figs.7a-c) is overpowered by the positive effect of the warm SST anomalies in the NESP (Figs. 7d-f). Compared to the NESP experimental result (Figs. 8c-d), the southerly wind anomalies in this experiment are stronger (Fig. 8f) and the positive SST anomalies are weaker (Fig. 8e), which further confirms the negative effect of the cold SESP SST anomalies on the development of FEP SST anomalies.
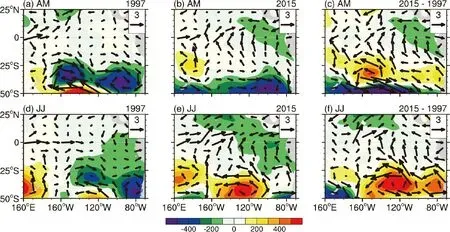
Fig. 9. Sea level pressure (shading, Pa) and surface wind (vector, m s-1) anomalies during the developing phase (April to July) of the 1997/98 El Niño (left column), the 2015/16 El Niño (middle column), and their differences (right column).
4.3. Effects of sea level pressure on the southeasterly wind anomalies
Previous studies have suggested that extra-equatorial sea level pressure (SLP) anomalies could have an impact on the evolution of an El Niño event by influencing wind anomalies in the tropical Pacific (e.g., Ding et al., 2017; You and Furtado, 2017; Min and Zhang, 2020). Therefore, we compare the South Pacific SLP anomalies in the 1997/98 and 2015/16 events to see if they might also have influenced the southeasterly wind anomalies in the FEP.
As shown in Fig. 9, surface wind anomalies in the southeastern Pacific are closely related to the SLP anomalies there. In the 1997/98 event, the persistent and significant negative SLP anomaly centers between 25°-50°S might have effectively hindered the southeasterly wind anomalies by inducing northwesterlies in the northeast flank of the cyclone(Figs. 9a, d). This helps explain why the southeasterly wind anomalies were so weak although strong convection occurred over the equatorial central and eastern Pacific during the developing phase of the 1997/98 El Niño (recall Figs. 2g, j). In contrast, negative SLP anomalies in the southeastern Pacific in the 2015/16 event were weak and displaced southward; they did not suppress the southeasterly wind anomalies in the FEP (Figs. 9b, e).
4.4. Possible relationship between the climate decadal variability and the southeasterly wind anomalies
It is well recognized that there have been systematic changes in background climate conditions over past decades (McPhaden et al., 2011; England et al., 2014; Hu and Fedorov, 2018). Compared to the last two decades of the 20th century, the trade winds were stronger and SSTs were slightly cooler in the east and warmer in the west during the first two decades of the 21st century (Fig. 10). The cooler SSTs and stronger southeasterly winds agree well with the differences between the 1997/98 and 2015/16 El Niño events(Figs. 1c, 2).
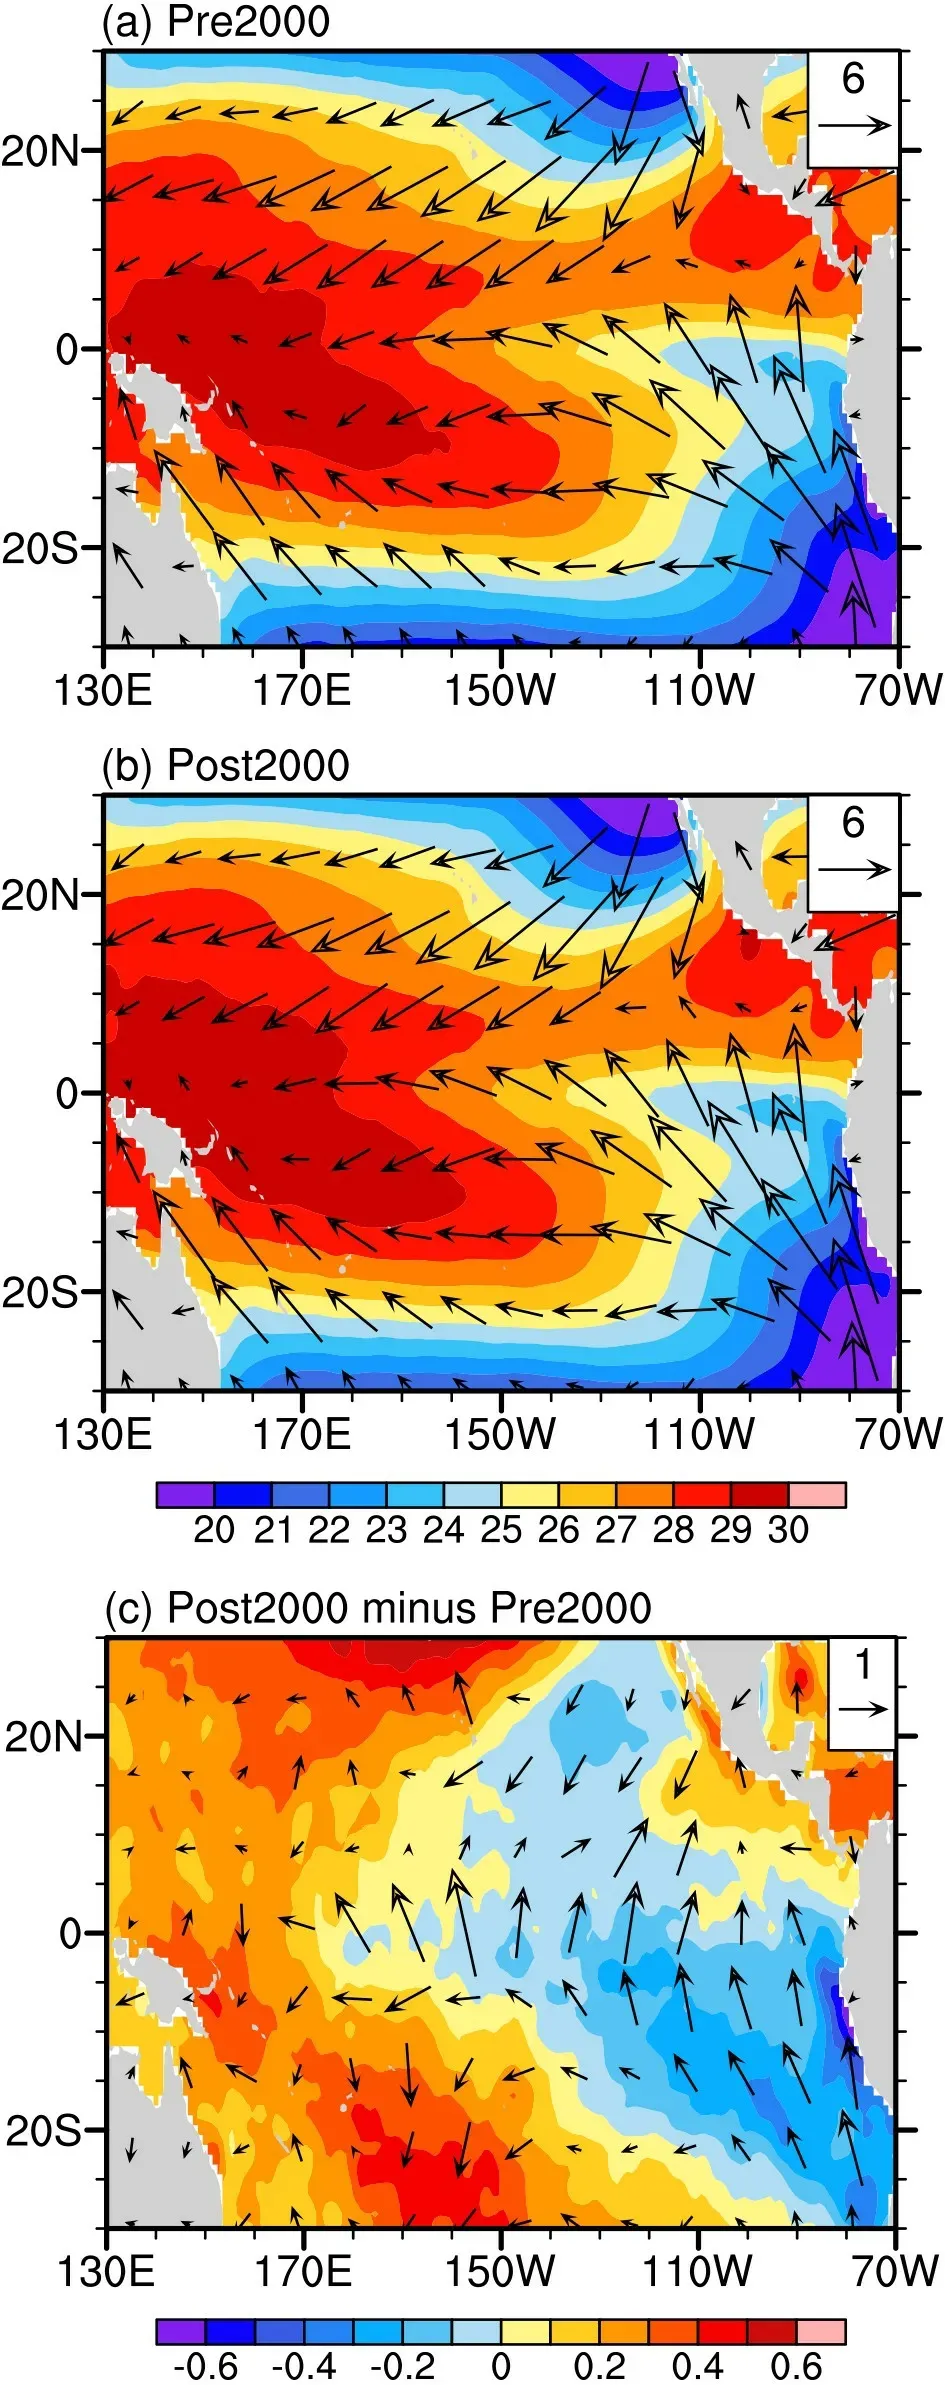
Fig. 10. Decadal mean SST (shading, °C) for (a) 1980-99(pre2000), (b) 2000-19 (post2000), and (c) their difference(post2000-pre2000), with surface wind (vector, m s-1)overplotted.
This indicates that the relatively modest FEP SST anomalies in the 2015/16 El Niño may have been related to the decadal changes in background conditions to some extent,but which one caused the other remains unclear (Capotondi et al., 2015). McPhaden et al. (2011) interpreted this similarity between mean and El Niño differences to indicate that decadal changes in the background state are the result of(rather than the cause of) a shift in El Niño statistics, which are varying naturally. Hu and Fedorov (2018) suggested that the multidecadal strengthening of cross-equatorial winds in the eastern Pacific could have partly contributed to the weakened positive SST anomalies over the eastern Pacific during the El Niño events. Considering the complicated mechanisms responsible for the El Niño events, more efforts and future studies are certainly required to improve our understanding.
5. Summary and discussion
As the first extreme El Niño of the 21st century, the 2015/16 El Niño is characteristically distinct from the 1997/98 extreme El Niño during its peak phase. The largest difference in the SST anomalies between the two extreme El Niños appeared in the far eastern Pacific (FEP). Compared to the strong FEP warm SST anomalies in the 1997/98 El Niño, the FEP warm SST anomalies in the 2015/16 El Niño were modest. In this study, possible causes of the distinct FEP SST anomalies are investigated by observational analysis and numerical experiments. The main findings are given as follows:
Along with the modest warm SST anomalies in the FEP in the 2015/16 El Niño, strong southeasterly wind anomalies existed in the southeastern Pacific during the development of this extreme El Niño. In contrast, southeasterly wind anomalies were barely noticeable in the 1997/98 El Niño.
Mixed-layer heat budget analysis indicates that compared to the 1997/98 El Niño, the strong southeasterly wind anomalies in the southeastern Pacific might have played an important role in suppressing the FEP SST warming in the 2015/16 El Niño by inducing relatively strong upwelling and related westward current, and by enhancing surface evaporation.
The strong southeasterly wind anomalies in the 2015/16 El Niño were initially triggered by the synergistic effects of warm SST anomalies in the CEP and cold SST anomalies in the SESP in the antecedent winter and then sustained by the warm SST anomalies over the NESP and CEP.In contrast, the southeasterly wind anomalies in the 1997/98 event were partly restrained by the significant negative SLP anomalies in the subtropical South Pacific, which may explain why the southeasterly wind anomalies were barely noticeable during the development of the 1997/98 event.
In addition, the strong southeasterly wind and modest SST anomalies in 2015/16 El Niño may also be partly related to the decadal climate variability, with the trade winds being stronger and SSTs being slightly cooler in the east and warmer in the west during the first two decades of the 21st century, compared to the last two decades of the 20th century.
The strong FEP warm SST anomalies in the 1997/98 El Niño were also partly contributed by the strong downward shortwave heat flux because of the positive SST-low-level cloud feedback.
The significant positive SST anomalies in the northeastern Pacific in winter 2014 and spring 2015 are part of a multi-year warming event lingering from fall 2013 to early 2016 (Di Lorenzo and Mantua, 2016), which has been referred to as a marine heatwave (Hobday et al., 2016) and has had unprecedented impacts on the marine ecosystem(Jones et al., 2018; Piatt et al., 2020). The onset and development of this unusual water mass anomaly in 2013/14 is attributed to forcing associated with a persistent atmospheric ridge over the northeast Pacific (Bond et al., 2015), which is associated with the North Pacific Oscillation (NPO), a leading pattern of atmospheric variability. Furthermore, by conducting correlation analysis and numerical experiments, Di Lorenzo and Mantua (2016) suggested that the persistence and reintensification of the anomaly in 2015 are caused by both the atmospheric forcing and the 2014 El Niño teleconnections in the tropical Pacific. And the variance of this NPOlike anomaly pattern may intensify under greenhouse forcing (Wang et al., 2014), hence leading to more extremes in ocean temperature.
The development of warm SST anomalies in the FEP is affected by various factors, such as coastal meridional winds and zonal wind anomalies over the equatorial western and central Pacific (WCP, Garreaud, 2018; Hu et al.,2019; Peng et al., 2019). This study mainly focuses on the negative impact of anomalous southeasterly winds in the southeastern Pacific on the FEP warm SST anomalies in the 2015/16 El Niño. Apart from the southeasterly wind anomalies in the southeastern Pacific, westerly wind anomalies over the WCP during the developing phase of El Niño are also a main factor that influences the development of the SST anomalies in the FEP, and strong WCP westerly wind anomalies could induce strong warm SST anomalies in the FEP by inducing significant eastward downwelling Kelvin waves. By calculating accumulated zonal wind stress anomalies, Chen et al. (2017) suggested that the accumulated magnitude of zonal wind stress anomalies over the equatorial western and central Pacific in 2015 was larger than that in 1997 during January-July. Therefore, in contrast to the 1997/98 event, the zonal wind anomalies in the WCP in 2015 might not contribute to the slow increase of the FEP SST anomalies in the 2015/16 event.
Acknowledgements.This work is jointly supported by National Natural Science Foundation of China (Grant No.42030605), National Key Research and Development Program of China (Grant No. 2019YFC1510004), National Natural Science Foundation of China (Grant Nos. 42088101 and 42005020), the General Program of Natural Science Research of Jiangsu Higher Education Institutions (19KJB170019) and the Natural Science Foundation of Jiangsu Province (Grant No. BK20190781). The model simulation is conducted in the High Performance Computing Center of Nanjing University of Information Science & Technology.HadISST data is downloaded from https://climatedataguide.ucar.edu/climate-data/sst-data-hadisst-v11. The EN4 dataset is from https://www.metoffice.gov.uk/hadobs/en4/. CMAP data, NCEP GODAS data, and NCEP-DOE Reanalysis-2 data are provided by the NOAA/OAR/ESRL PSL, Boulder, Colorado, USA, and are downloaded from https://psl.noaa.gov/. JRA-55 data is from https://rda.ucar.edu/datasets/ds628.1/. ESSO-INCOIS TropFlux data is downloaded from https://incois.gov.in/tropflux/. ISCCP H series cloud data is downloaded from https://www.ncdc.noaa.gov/isccp/isccp-data-access/isccp-basic-data.
Electronic supplementary material:Supplementary material is available in the online version of this article at https://doi.org/10.1007/s00376-021-1263-z.
杂志排行
Advances in Atmospheric Sciences的其它文章
- The IAMAS-CNC Early Career Scientists Nobel Prize Online Interpretation Workshop
- Contrasts between the Interannual Variations of Extreme Rainfall over Western and Eastern Sichuan in Mid-summer
- Analysis of the Winter Cloud-to-Ground Lightning Activity and Its Synoptic Background in China during 2010-20
- Quantifying the Spatial Characteristics of the Moisture Transport Affecting Precipitation Seasonality and Recycling Variability in Central Asia
- Structure and Evolution of Decadal Spiciness Variability in the North Pacific during 2004-20, Revealed from Argo Observations
- Strengthened Regulation of the Onset of the South China Sea Summer Monsoon by the Northwest Indian Ocean Warming in the Past Decade
