Variations in Amplitudes and Wave Energy along the Energy Dispersion Paths for Rossby Waves in the Quasigeostrophic Barotropic Model
2022-04-02YaokunLIJipingCHAOandYanyanKANG
Yaokun LI, Jiping CHAO, and Yanyan KANG
1College of Global Change and Earth System Science, Beijing Normal University, Beijing 100875, China
2National Marine Environmental Forecasting Center, Beijing 100081, China
3Beijing Meteorological Observatory, Beijing 100089, China
ABSTRACT Variations in wave energy and amplitude for Rossby waves are investigated by solving the wave energy equation for the quasigeostrophic barotropic potential vorticity model. The results suggest that compared with rays in the nondivergent barotropic model, rays in the divergent model can have enhanced meridional and zonal propagation, accompanied by a more dramatic variability in both wave energy and amplitude, which is caused by introducing the divergence effect of the free surface in the quasigeostrophic model. For rays propagating in a region enclosed by a turning latitude and a critical latitude, the wave energy approaches the maximum value inside the region, while the amplitude approaches the maximum at the turning latitude. Waves can develop when both the wave energy and amplitude increase. For rays propagating in a region enclosed by two turning latitudes, the wave energy approaches the minimum value at one turning latitude and the maximum value at the other latitude, while the total wavenumber approaches the maximum value inside the region. The resulting amplitude increases if the total wavenumber decreases or the wave energy increases more significantly and decreases if the total wavenumber increases or the wave energy decreases more significantly. The matched roles of the energy from the basic flow and the divergence of the group velocity contribute to the slightly oscillating wave energy,which causes a slightly oscillating amplitude as well as the slightly oscillating total wavenumber.
Key words: Rossby waves, quasigeostrophic barotropic model, energy dispersion, wave energy, amplitude
1. Introduction
The energy dispersion properties of Rossby waves have been extensively investigated since Rossby et al. (1939)first interpreted observed synoptic phenomena from the view of waves. For example, Yeh (1949) investigated the energy dispersion of Rossby waves and found that there is always a range of wavelengths for which the group velocity is larger than the phase velocity so that new waves can be formed ahead of the initial waves. Longuet-Higgins (1964)extended the energy dispersion on a rotating sphere and found that the orthogonal trajectories of the waves form great circles. Bennett and Young (1971) studied the effects of the horizontal shear of the mean zonal wind on the lateral propagation of waves through the tropics. Boyd (1978a,b, 1982) analytically discussed the effects of meridional shear on both equatorial and planetary waves. Hoskins and Karoly (1981) solved the energy dispersion paths and developed the wave ray tracing theory. Hoskins and his collaborators further discussed the propagation features of both stationary and nonstationary waves (Hoskins and Ambrizzi,1993; Yang and Hoskins, 1996). Li and Nathan (1994)derived an expression for the wave amplitude, which shows that forced waves, to maintain their strength well into midlatitudes, depend on their meridional wave scale and northward group velocity. Li et al. (2021) further proposed an available method to calculate wave amplitude and energy to investigate the development of such waves. In addition, many studies have highlighted the cross-equatorial propagation of Rossby waves [e.g., Karoly (1983); Li and Li (2012); Li et al. (2015); Li et al. (2019)].
Previous studies have applied the nondivergent barotropic vorticity equation, which is considered a good approximation of the quasi-incompressible atmosphere in certain cases. However, as early as 1945, Rossby (1945) noticed that waves require a certain amount of convergence or divergence to establish the pressure pattern prescribed by the motion, although the vorticity changes resulting from this distribution of convergence and divergence can be negligible.Sardeshmukh and Hoskins (1988) found that due to the advection of vorticity by the divergent component of the flow, the Rossby wave source can be very different from the simple divergence source that is often used. Chang and Philander(1989) investigated the propagation of Rossby wave packets in a shallow water model. They calculated ray paths and even derived the corresponding conservation laws. Lu and Boyd (2008) directly solved the divergent barotropic vorticity equation without applying the quasigeostrophic approximation. They also solved corresponding ray trajectories and examined the effects of divergence on low-frequency Rossby wave propagation. Recently, Li (2020) discussed enhanced poleward propagation in a divergent barotropic atmosphere. These studies highlight the different energy dispersion paths and benefit the understanding of different kinds of atmospheric phenomena. However, they do not analyze how either amplitude or wave energy varies along the ray paths, which is important in the development of Rossby waves [e.g., Lu and Zeng (1981); Li and Nathan (1997)].
Hoskins and Karoly (1981) noticed that the amplitude of the wave packet is inversely proportional to the square root of the meridional wavenumber, which is also derived by Li and Nathan (1994) in a different method. Li et al.(2021) calculated variations in both amplitude and wave energy by directly solving the wave energy equation.However, their results are all based on the nondivergent vorticity equation. According to Chang and Philander (1989),the conservation laws (e.g., wave action conservation) for both nondivergent and divergent atmospheres are formally the same (the definitions are different). This implies that the amplitudes of divergent Rossby waves may have features similar to those of their nondivergent counterparts. Therefore, it is natural to ask how the amplitude and wave energy vary along ray paths and what the similarities and differences between nondivergent and divergent atmospheres are. These questions are important and interesting. However, no studies relevant to answering these questions have been conducted yet. Therefore, this study tries to resolve amplitude and energy variations along ray paths by employing a method that can directly solve the divergence of group velocity and hence the wave energy equation. The energy dispersion relation and wave energy equation are derived by analyzing the divergent quasigeostrophic barotropic vorticity equation in section 2. The similarities and differences in propagation features between the nondivergent and divergent atmospheres are also discussed in section 2. Specific examples of December-January-February (DJF) and June-July-August (JJA)mean zonal basic flows are calculated to demonstrate the variations in the amplitude and wave energy in section 3. The conclusions are summarized in section 4.
2. Wave ray theory
The barotropic quasigeostrophic potential vorticity equation in the Mercator projection of a sphere is written as[e.g., Lau and Lim (1984) and Li (2020)]:

The dispersion relation is:
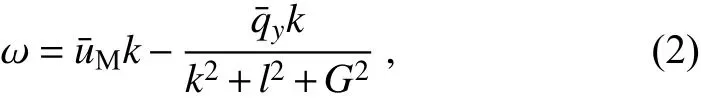
where k, l, and ω are the zonal wavenumber, meridional wavenumber, and angular frequency, respectively. If considering a nondivergent form in which G2=0, Eq. (2) reduces to the nondivergent dispersion relation. According to Eq. (2),the meridional propagation of Rossby waves requires the following:
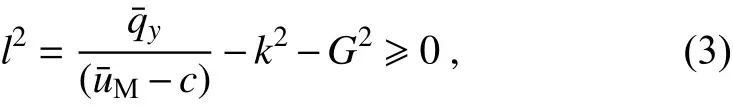
where c=ω/k is the zonal phase velocity. A turning latitude for a ray is the point at which l2=0. It reflects the ray in the direction in which the absolute meridional wavenumber increases.
When l2=0, Eq. (3) can be rewritten as:
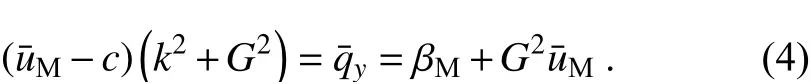
For a wave with a specified zonal wavenumber and frequency (and hence specified zonal phase speed) in both cases of divergence and non-divergence, the left-hand-side terms in Eq. (4) are invariant. This means that the following equation can be used:

where the superscripts d and n denote the divergent and nondivergent waves, respectively. We can further derive thatnamely,
As Li et al. (2021) analyzed, βMgenerally monotonically decreases when it is not far north of the jet center. This means that the turning latitude (if it is located not far north of the jet center) will locate further north when considering the divergent effect. In other words, when fixing the zonal phase speed, the turning latitude for the divergent wave will be more northern than the one for the nondivergent wave.The critical latitude where=c, and hence l2→∞, is the same for both divergent and nondivergent cases. The wave is trapped close to the critical line, and its energy is absorbed by the basic flow. For a propagating region enclosed by a critical latitude and a turning latitude as described here, we can find that meridional propagation is enhanced for divergent waves since the turning latitude is located further north to enlarge the region. This can also be seen from the ray path results of Li (2020). For stationary waves, the phase speed c =0 and Eq. (4) becomes

It is the same as the relation for nondivergent waves. In addition, the critical latitudes for both divergent and nondivergent stationary waves are the same (=c). Therefore, we know that the propagating region is the same for both divergent and nondivergent stationary waves. This result is slightly different from the results of Li (2020), in which λ0is set as a function of latitude, which results in a residual term related to the divergent effect of the free-surface elevation in the right-hand-side term of Eq. (6). For nondivergent waves, a necessary condition for barotropic instability is that βM=0 occurs somewhere in the region. This can be modified to=0 for divergent waves. Neither βM=0 for nondivergent waves nor=0 for divergent waves appear.They are not in the propagating region since they lead to l2<0. Therefore, as Li et al. (2021) pointed out, even though the existence of such a latitude. is a necessary condition for instability, this latitude is never in the propagating region.
The group velocity can be written as:
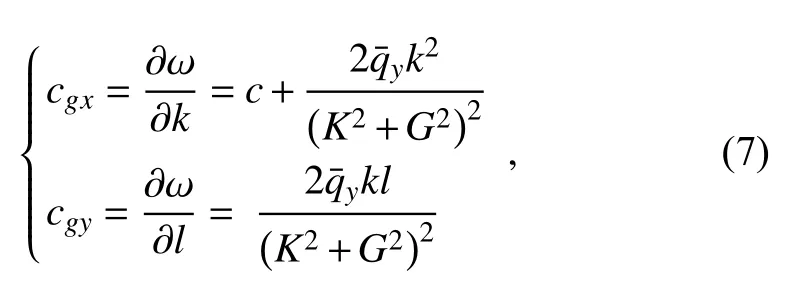
where K2=k2+l2is the squared total wavenumber. A ray can be defined as [e.g., Hoskins and Karoly (1981)]:
The ray equation can be solved by applying the Runge-Kutta method.
Following Chang and Philander (1989), the wave action conservation for divergent waves is formally the same as that for nondivergent waves and can be written as:
where Dg/Dt=∂/∂t+cg·∇ represents the rate of change along a ray, cg=[cgx,cgy] is the group( velocity) ve/ctor,A=E/ω′is the wave action density,is the wave energy density (Lau and Lim, 1984), A0is the wave amplitude, andis the intrinsic frequency. Note that the definition of the wave energy density for divergent waves is slightly different from that for nondivergent waves. The wave action is a combined variable and may be inconvenient for discussing the variations in the wave energy density. Therefore, we rewrite Eq. (9) as the wave energy equation:
Eq. (10) is also formally the same as the energy equation for nondivergent waves [e.g., Li et al. (2021)]. This demonstrates that the wave energy variation along a ray is determined by both the divergence of the group velocity and the energy budget from the basic flow through eddy activities.Along a ray, the zonal and meridional wavenumbers, meridional gradient of the basic flow, and ray positions are also known values. However, the divergence of group velocity cannot be directly obtained from deriving Eq. (7) because the group velocity values neighboring a ray are unknown (Lighthill, 1978). By setting a basic flow with meridional shear independent of y, Lau and Lim (1984) found an analytical solution of Eq. (1) and the corresponding wave energy.However, for a more general case, it is difficult to derive an analytical solution. Li et al. (2021) proposed a method to express divergence of the group velocity as:
where the subscript t denotes time, δt represents a short time interval, and d S is the cross-sectional area of a thin ray tube. This method only concerns ray curves and can be used for both divergent and nondivergent waves. In calculation,the short time interval is set to two hours, far smaller than the time scale (several days) of Rossby waves. And different time intervals are tested, for example, half of an hour,one hour, four hours, and six hours. The calculation results suggest that ray paths, wave energy, and amplitude are insensitive to the short time intervals. For developing Rossby waves, one can discuss either the wave energy [e.g., Lau and Lim (1984)) or the amplitude (e.g., Hoskins and Karoly(1981)] or both [e.g., Li et al. (2021)]. Following our previous study, we still consider both wave energy and amplitude. We say that a Rossby wave develops if there is a simultaneous increase in its wave energy and amplitude, while a wave decays if there is a simultaneous decrease in its wave energy and amplitude.
3. Results
3.1. December-January-February (DJF) zonal basic flow
The basic flow discussed in this subsection is a climatological DJF 500-hPa zonal-mean zonal flow based on National Centers for Environmental Prediction (NCEP) reanalysis data (Kalnay et al., 1996) provided by the NOAA/OAR/ESRL PSD, Boulder, Colorado, USA, from their website at https://www.esrl.noaa.gov/psd/. The most significant features of the DJF basic flow are the westerly jet in the midlatitudes and the easterly wind in the tropics (Fig. 1a). The speed of the westerly jet in the Northern Hemisphere (near 30°N) is approximately 18 m s-1, which is slightly weaker than its counterpart in the Southern Hemisphere (near 50°S)with an approximate speed of 22 m s-1. The maximum easterly wind in the tropics is approximately 6 m s-1, located slightly north of the equator. The corresponding meridional gradients of absolute vorticity (βM, solid line in Fig. 1b) and quasigeostrophic potential vorticity (, dashed line in Fig.1b) show quite similar characteristics. The two curves are basically the same at high latitudes and share the same variation in mid- and low latitudes. The major difference is thatis larger than βMin regions where westerlies prevail but smaller than βMin regions where easterlies prevail. This can be interpreted by their relation=βM+G2, where G2is larger than zero.=βMon the boundary of westerlies and easterlies where=0 . Their difference G2approaches maximum values near the westerly jet center and a minimum value (smaller than zero) near the easterly jet center since zonal basic flowvaries similarly. In the westerly jet regions of concern,is generally larger than βM.
According to the above section, rays have enhanced meridional propagation for divergent Rossby waves. Figure 2 further details the variation by portraying the propagating regions for both nondivergent and divergent waves at synoptic scales, with a corresponding time scale order of 101days and a horizontal scale order of 103km. The propagating region in the Northern Hemisphere is taken as an example.Specifying a wave with zonal wavenumber k =8 (the corresponding wavelength is approximately 4000 km) as an example, the propagating regions vary among different wave periods (Fig. 2a). When the wave period is 2-4 days(a little short for synoptic scales), the propagating region is enclosed by two critical latitudes. Since a critical latitude is only determined by phase speed and has no relation with divergent effects, the propagating region is the same for both nondivergent and divergent waves. When the wave period is five days, for nondivergent waves, there are two propagating regions (neglecting the very narrow region in high latitudes). The southern region (around 30°N) is enclosed by a critical latitude and a turning latitude, while the narrow northern region (around 60°N) is enclosed by two turning latitudes. However, for divergent waves, the above two regions merge together to form a wide propagating region from around 20°-70°N. The region is enclosed by a southern critical latitude and a northern turning latitude. Correspondingly, there are two physical propagating regions (also, there exists a mathematical region without physical meaning due to proximity to the North Pole and due to narrow width) for divergent waves with a period of six days. When the wave period is longer than seven days, the propagating region, enclosed by a critical latitude and a turning latitude, gradually moves southward. The difference between the turning latitude for the nondivergent waves and the turning latitude for divergent waves decreases and equals zero when the wave period is infinite (stationary waves), as discussed in section 2. Similarly, when specifying a wave with a period of 10 days, the propagating regions vary with different horizontal scales (Fig. 2b).When the zonal wavenumber is 2-3 (the corresponding wavelength is larger than 10000 km, planetary scale), the propagating region is enclosed by two critical latitudes. This means that the propagating region is the same for both types of waves. When the zonal wavenumber is larger than four(gradually belonging to large-scale motion), the propagating region, enclosed by a critical latitude and a turning latitude, gradually decreases and moves southward. This is mainly caused by the southward location of the turning latitude or restricted meridional propagation for synoptic waves.
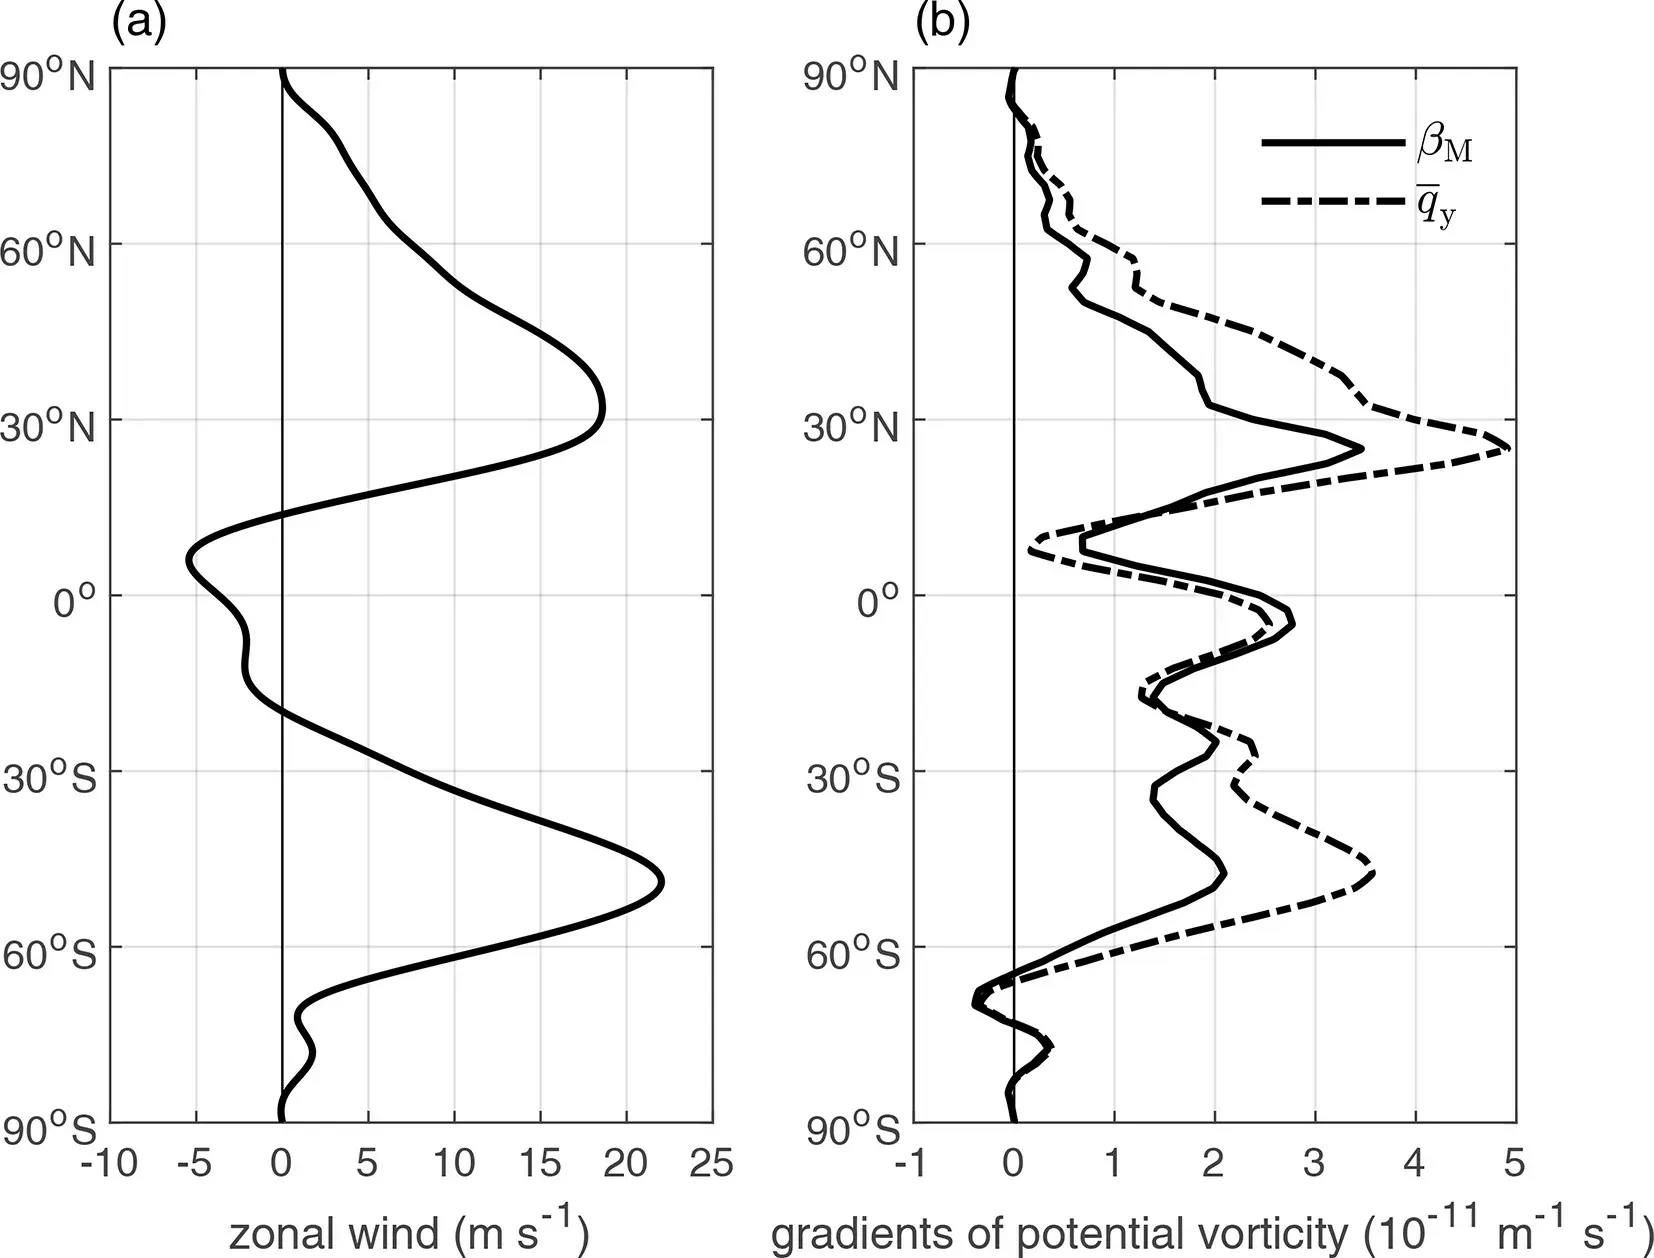
Fig. 1. Meridional distribution of zonal wind (a) and meridional gradients of absolute vorticity β M (solid line)and quasigeostrophic potential vorticity (dashed line) (b) at 500 hPa in DJF.

Fig. 2. Energy dispersion regions (shaded) bounded by a turning latitude (black and red solid lines for nondivergent and divergent waves, respectively) and a critical latitude (black dot-dashed line) for DJF mean zonal wind: (a) for zonal wavenumber k = 8; (b) for a period of T = 10 d. The gray shaded region is for nondivergent waves,while the red shaded region is for divergent waves.
As shown in Fig. 2, we can easily find that the propagating region enclosed by a low-latitude critical latitude and a relatively high-latitude turning latitude is most common. Therefore, we calculate a case in such a propagating region by specifying k=8 and T=10 d. The starting point is set to 20°N.The results for the leading wave (initial kl > 0) and trailing wave (initial kl < 0) are shown in Figs. 3 and 4, respectively. To compare the impact of divergence on the propagating features, we also calculate the corresponding nondivergent case. The divergent and nondivergent cases are portrayed in blue and red curves in Figs. 3 and 4. As expected,the leading wave rays (Fig. 3a) travel northward to approach the turning latitude and then turn southward to approach the critical latitude. Meanwhile, the leading ray for divergent cases can propagate farther in both latitudinal and longitudinal directions, which is similar to the results of Li (2020), who focused on stationary waves. Along the traveling ray, the wave energy (Fig. 3b) increases to a maximum value and then decreases to a local minimum value when approaching the turning latitude, and it continues to increase to the same maximum value and then gradually decreases to zero when the ray gradually approaches the critical latitude.The maximum wave energy is close to 1.3 (1.2) times the initial specified value (set to unit one) at approximately 1 (0.8)day for the divergent (nondivergent) wave. The variations in the wave energy are determined by the divergence of the group velocity and barotropic energy budget from the basic flow. From the starting point to the turning latitude, divergence of group velocity plays a negative role in determining the wave energy, while barotropic energy from the basic flow plays a positive role (Fig. 3e). The wave energy increases when the barotropic energy income outweighs the energy dispersion output and decreases when the energy concentration outweighs the energy loss to the basic flow. For the divergent wave, the change rate of the wave energy(blue solid line in Fig. 3e) decreases to zero in a longer time. This suggests that the wave energy can take a longer time to increase to a larger maximum value when considering the effect of divergence. In contrast to the wave energy,the amplitude shows simpler variations (Fig. 3c). The amplitude of the divergent (nondivergent) wave increases to the maximum value of approximately 2 (1.8) times when the ray arrives at the turning latitude and then decreases when the ray moves to the critical latitude. The increase(decrease) is mainly caused by the decrease (increase) in the total wavenumber (Fig. 3d). When the ray propagates toward the turning latitude, the wave can develop in the region where both the wave energy and amplitude increase.When the ray moves toward the critical latitude, both the wave energy and amplitude eventually decrease, and the wave eventually decays and is absorbed by the basic flow.
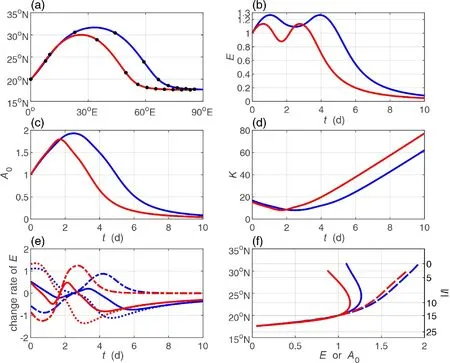
Fig. 3. Wave ray path (a), wave energy (b), amplitude (c), total wavenumber (d), variations in divergence of group velocity (dashed lines) and energy budget from the basic flow (dotted lines) and their sum: the change of the wave energy (solid lines) (e), and variations in wave energy (solid lines) and amplitude (dashed lines) with latitude (f) for both the leading divergent (blue lines) and nondivergent (red lines) waves starting from 20°N with zonal wavenumber k = 8 and wave period T = 10 d. All terms in (e) have been multiplied by 105 for better visualization.
Compared with the nondivergent wave, the total wavenumber of the divergent wave decreases to the minimum value at the turning latitude in a longer time (Fig. 3d).Since the zonal wavenumber is invariant along the ray, the variation in the total wavenumber is the result of the varying meridional wavenumber. The meridional wavenumber decreases to zero when the ray arrives at the turning latitude. However, the amplitude increases to the maximum value at the turning latitude (dashed lines in Fig. 3f). This inverse variation between amplitude and the meridional wavenumber is consistent with results of previous studies[e.g., Hoskins and Karoly (1981)]. However, the relation between the wave energy and meridional wavenumber(solid lines in Fig. 3f) is slightly complicated. As shown in Fig. 3b, the maximum wave energy is approached at a certain latitude between the starting point and the turning latitude, rather than at the turning latitude. The certain latitude divides the variation in wave energy into two parts: from the starting point to the certain latitude and from the certain latitude to the turning latitude. In the first part, the meridional wavenumber decreases but the wave energy increases.In the second part, both the meridional wavenumber and wave energy decrease. Therefore, there exists a latitude and a corresponding meridional wavenumber value at which the wave energy approaches the maximum value (solid lines in Fig. 3f). When the ray moves away from the latitude or the meridional wavenumber moves away from the value, the wave energy decreases. This is not consistent with the results of Lau and Lim (1984), who also reported an inverse relation between the wave energy and the meridional wavenumber. The discrepancy may be caused by the linear shear basic flow they adopted.
The trailing wave (Fig. 4) is less affected by the divergence. Both rays (Fig. 4a) have almost the same trajectories,and both the wave energy (Fig. 4b) and amplitude (Fig. 4c)monotonically decrease when rays move toward the critical latitude. The fact that both the wave energy and amplitude have very similar inverse relations with the meridional wavenumber (Fig. 4f) agrees with previous studies [e.g.,Hoskins and Karoly (1981), Lau and Lim (1984)]. The wave energy decreases since it is absorbed by the basic flow, although the divergence of group velocity means that the wave energy is concentrated along the traveling ray(Fig. 4e). With a gradually increasing total wavenumber or a decreasing spatial scale (Fig. 4d), the wave decays and is eventually trapped by the basic flow. Overall, variations in ray trajectories, the wave energy, amplitude, and total wavenumber for both divergent and nondivergent waves are very similar and have insignificant discrepancies.
Note that both divergent and nondivergent waves can propagate in regions enclosed by two turning latitudes (see Fig. 2). However, the propagating regions do not overlap.Therefore, we only calculate a divergent wave starting at 43°N with T = 6 d and k = 8 (Fig. 5). The leading ray (initial kl > 0) is alternatingly reflected by northern and southern turning latitudes to form a wave-like structure (Fig. 5a).Leaving from the starting point, the ray arrives at the northern turning latitude in around two days, arrives at the southern turning latitude in around six days, and arrives at the northern turning latitude again in around 10 days, at which it propagates near 200°E. It takes around four days to travel between two turning latitudes. Along the traveling ray, the wave energy also shows a wave-like variation (Fig. 5b). It decreases to the minimum value, around 0.93 times its initial value, when the ray arrives at the northern turning latitude, and it increases to the maximum value of around 1.02 times the initial value when the ray arrives at the southern turning latitude. The wave energy oscillation is very slight;the maximum oscillation does not exceed 5% of the initial value. The decrease and increase in the wave energy are mainly influenced by the energy budget from the basic flow, while the divergence of the group velocity plays an inverse minor role (Fig. 5e). The total wavenumber also oscillates up and down but with a more complex shape. It approaches the minimum value at the two turning latitudes where the meridional wavenumber l = 0 and approaches the maximum value at approximately 43°N in the propagating region. This means that the total wavenumber increases from the minimum value to the maximum value and returns to the minimum value again when the ray moves from one turning latitude to the other turning latitude. The combined effect of the wave energy and the total wavenumber causes the amplitude to have a similar variation to that of the total wavenumber. Take the period (near 6-10 days) when the ray starts to move from the southern turning latitude to the northern turning latitude as an example. During the period,the wave energy monotonically decreases from the maximum value at the southern turning latitude to the minimum value at the northern turning latitude (Fig. 5b). The decrease in wave energy is the result of the energy loss to the basic flow, even though the wave energy is concentrated (Fig. 5e).Meanwhile, the total wavenumber increases from the minimum value at the southern turning latitude to the maximum value at near 43°N and then decreases to the minimum value again at the northern turning latitude(Fig. 5d). From the southern turning latitude to near 43°N,both the decreasing wave energy and increasing total wavenumber contribute to a decreasing amplitude (Fig. 5c).From near 43°N to the northern turning latitude, only the decrease in total wavenumber contributes to the increase in amplitude (Fig. 5c). Based on the above analysis, we can conclude that the minimum value of amplitude occurs at the latitude where the meridional wavenumber, hence the total wavenumber, approaches its maximum value. The maximum values of amplitude occur at the two turning latitudes.Notice that the two maximum values are not the same, and the larger one occurs at the southern turning latitude(Fig. 5c). Therefore, there will exist a period when both the meridional wavenumber and the amplitude increase (dashed line in Fig. 5f). This means that the inverse relation between the amplitude and the meridional wavenumber is not valid again. This is not reported in previous studies [e.g., Hoskins and Karoly (1981); Lau and Lim (1984); Li and Nathan(1994)] but is consistent with the results of Li et al. (2021).Similarly, there also is a period when the inverse relation between the wave energy and the meridional wavenumber is invalid (solid line in Fig. 5f). Limited change ranges in both the wave energy and amplitude mean that the wave neither develops nor decays significantly. Therefore, the region permits the wave to propagate a long distance to realize the effect of a waveguide.
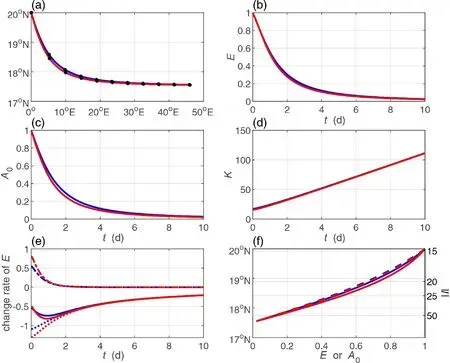
Fig. 4. Same as Fig. 3, but for the trailing waves.
3.2. June-July-August (JJA) zonal basic flow
In the JJA season, the westerly jet in the Northern Hemisphere weakens and moves northward (Fig. 6a). The maximum wind speed is located near 45°N with a value of approximately 11 m s-1. There is also a weak westerly peak north of 60°N with an intensity of approximately 5 m s-1.Compared to the DJF season, the westerlies in the Southern Hemisphere also weaken but with a more extensive range.The area with wind speeds exceeding 15 m s-1is mainly in the range 28°-60°S. The easterly winds in the tropics also move northward and are mainly located in the Northern Hemisphere. The corresponding meridional gradients of absolute vorticity (βM, solid line in Fig. 6b) and quasigeostrophic potential vorticity (, dashed line in Fig. 6b) vary similarly.As described above,is larger than βMin westerly wind regions and smaller than βMin easterly wind regions.
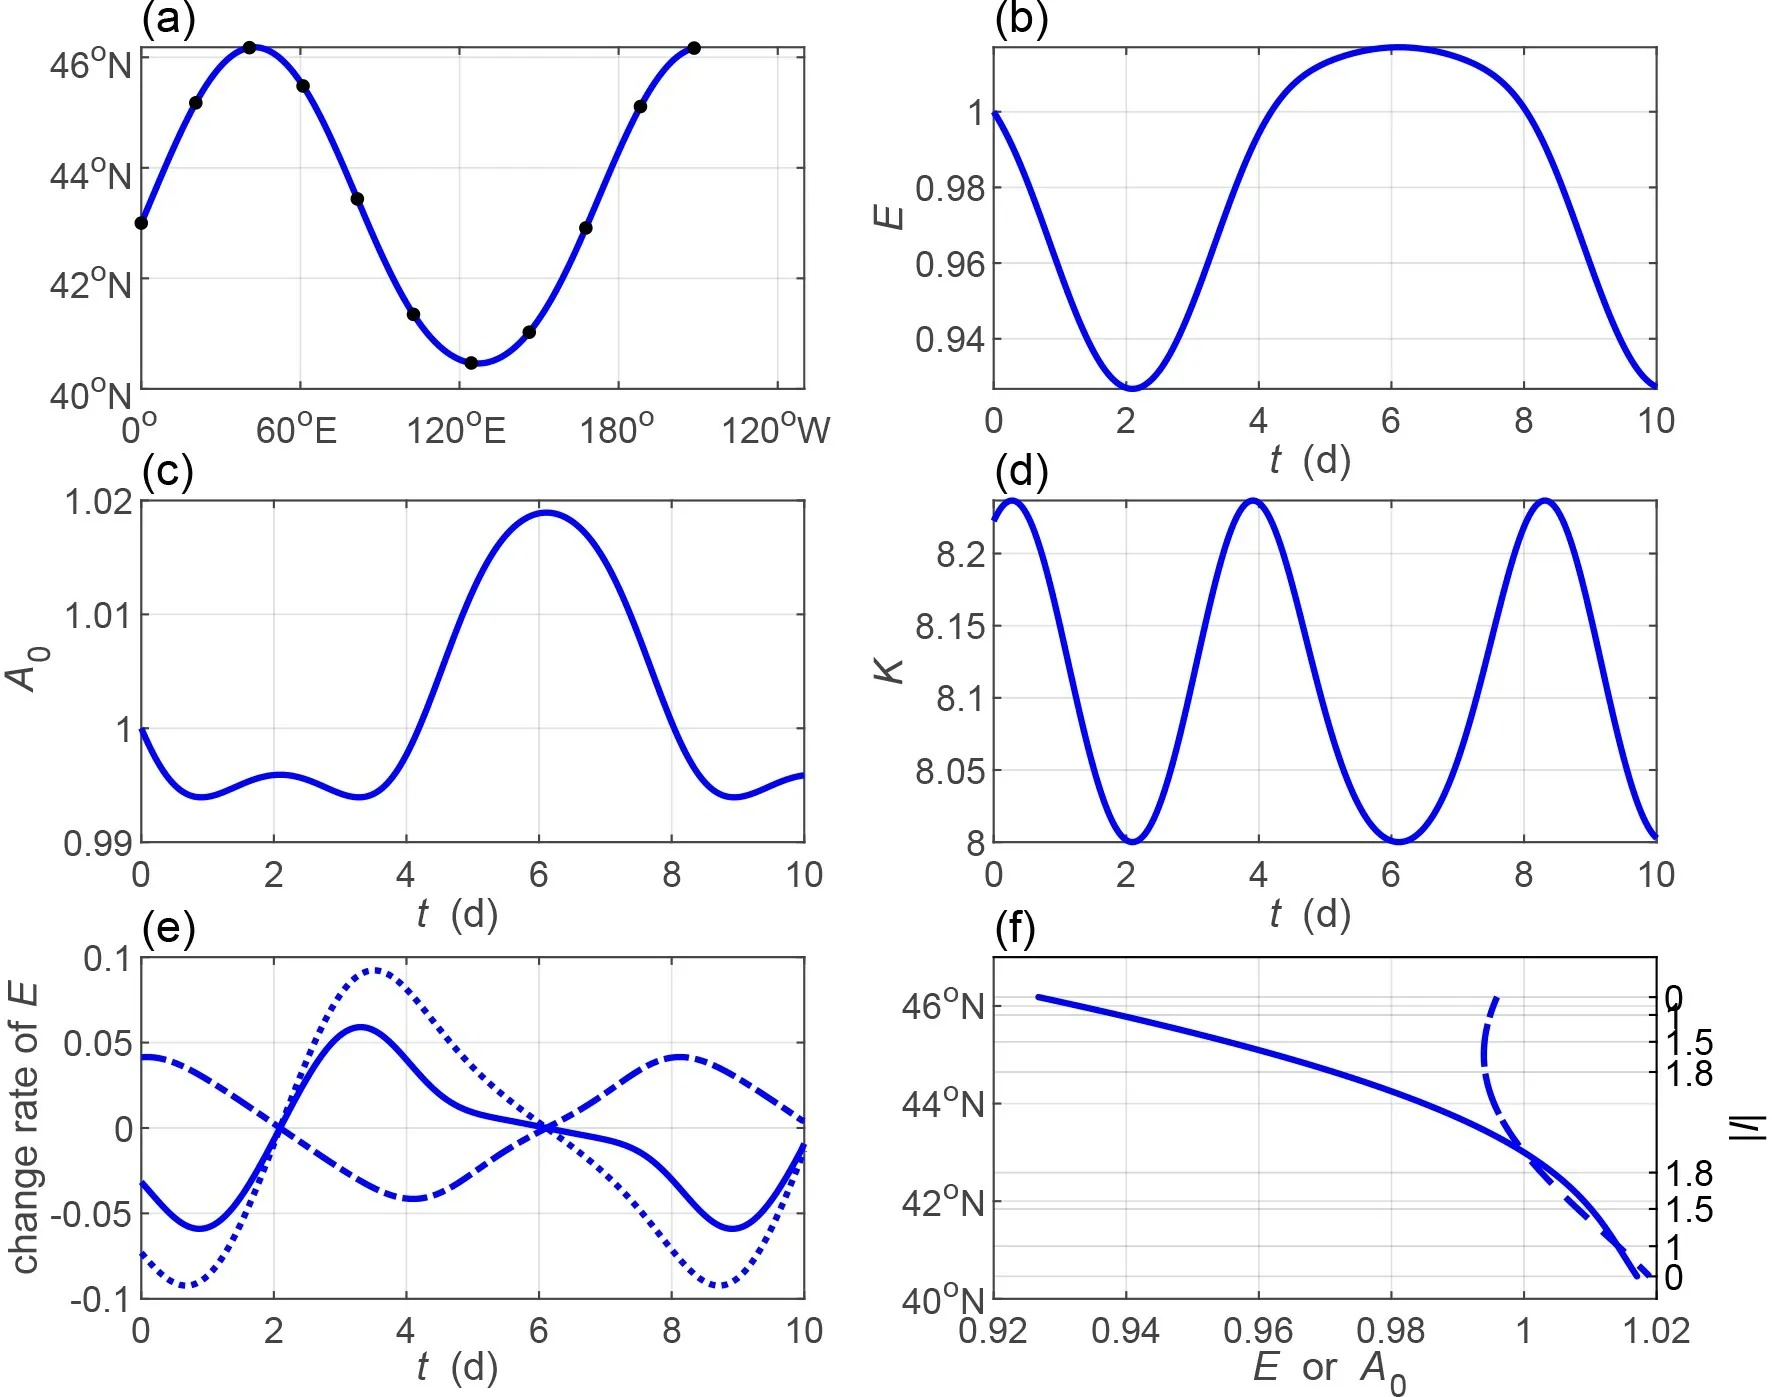
Fig. 5. Same as Fig. 3 but for a leading divergent wave starting from 43°N with zonal wavenumber k = 8 and wave period T = 6 d.
For synoptic Rossby waves (k = 8, Fig. 7a), there is only one narrow propagating region located in high latitudes when the wave period is less than a certain value, such as the period of three days in the Northern Hemisphere. The narrow band is a mathematical solution without physical meaning since synoptic waves generally have a longer time period. There are two propagating regions in the Northern Hemisphere when the wave period ranges from four to six days. The southern one is enclosed by two critical latitudes,while the northern one is enclosed by a southern critical latitude and a northern turning latitude. There is only one propagating region again when the wave period is longer than seven days. The region is located in the midlatitudes and has the largest meridional range. It is the major propagating region for synoptic waves. Furthermore, the effect of divergence enlarges the propagating region by increasing the northern turning latitude, and it is more significant when the wave period varies from 7 to 14 days. For waves with a period of 10 days (Fig. 7b), planetary waves (k < 5) can have two propagating regions at most. The one located at high latitudes is enclosed by a critical latitude and a turning latitude, and the one located in midlatitudes is enclosed by two critical latitudes. The latter propagating region is associated with the quasi-symmetric distribution of zonal wind about the jet center (see Fig. 6a). Synoptic waves (k > 4)mainly propagate in a region enclosed by a critical latitude and a turning latitude. The region narrows and moves equatorward with decreasing wave scale. Furthermore, divergent waves have enhanced meridional propagation due to location on the north side of the turning latitude.
It is obvious that the region enclosed by a critical latitude and a turning latitude is the major propagating tunnel for both divergent and nondivergent waves in the JJA season. It is quite similar to the situation in the DJF season,except for different locations. Therefore, we only provide a leading ray case that starts at 40°N (Fig. 8) and propagates for 20 days until the calculation is terminated. The divergent wave arrives at the turning latitude within around four days (Fig. 8a). Then, it moves southward to approach to the critical latitude. The wave energy variation is a little complex (Fig. 8b). It strengthens slightly within about 0.5 days when the ray moves near 42°N and then weakens until the ray arrives at the turning latitude near 50°N at around four days (the blue solid line in Fig. 8f). The strengthening period from the start to around 0.5 days is mainly caused by the barotropic energy absorption from the basic flow(energy divergence plays a negative role during this period),and the weakening period from around 0.5 to 4 days is the combined result of the wave energy divergence and the barotropic energy being absorbed by the basic flow (Fig. 8e).Compared to the wave energy, the total wavenumber (Fig.8d) plays a more significant role in determining the amplitude (Fig. 8c). The decreasing total wavenumber (or meridional wavenumber) contributes to an increasing amplitude when the ray is traveling from the starting point to the turning latitude and vice versa. This means that the amplitude shows an inverse relation with the meridional wavenumber(blue dashed line in Fig. 8f). The wave can develop in the region where both the wave energy and amplitude increase when the ray propagates toward the turning latitude. The situation for the nondivergent wave is quite similar to the divergent wave, and no more description is provided here.

Fig. 6. Same as Fig. 1, but for zonal mean wind in JJA.
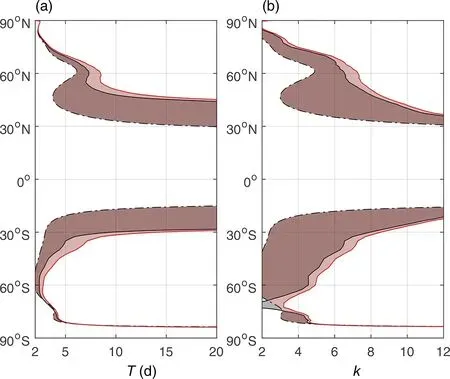
Fig. 7. Same as Fig. 2, but for zonal mean wind in JJA.
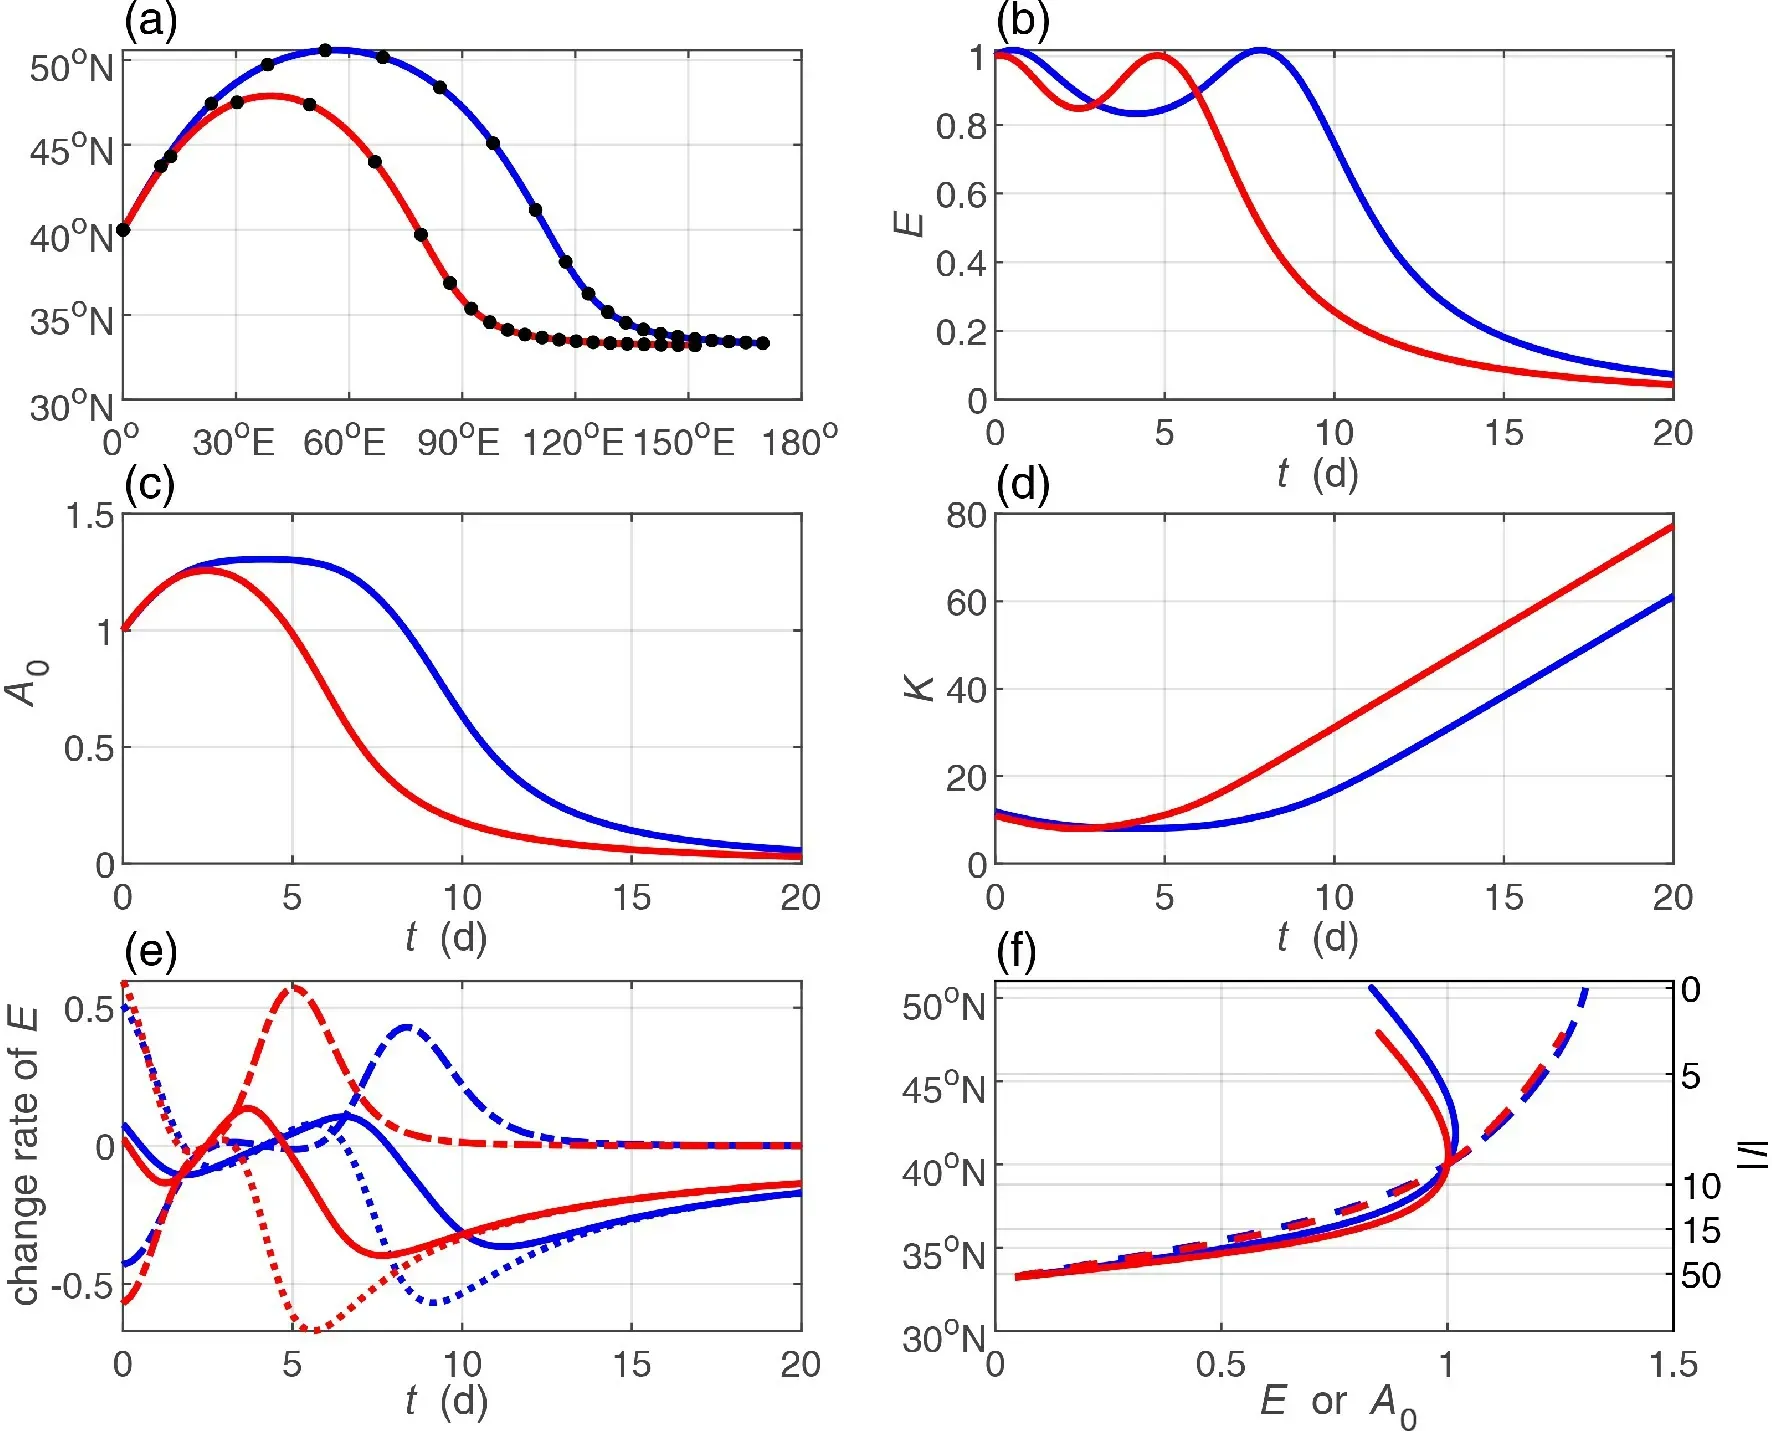
Fig. 8. Same as Fig. 3 but for the leading divergent and nondivergent waves starting from 40°N with zonal wavenumber k = 8 and wave period T = 10 d in a JJA zonal mean wind. The calculation time is 20 d.
4. Conclusions and discussion
This study investigates the energy dispersion of quasigeostrophic barotropic Rossby waves, considering the divergence effect of the free surface, and makes a comparison with their nondivergent counterparts. In contrast to previous studies, this study not only calculates the ray trajectories but also the wave energy and amplitude along the corresponding rays by applying a method that can solve the divergence of group velocity along rays. The results suggest that divergent waves can have enhanced meridional and zonal propagation with a strengthened variation in both the wave energy and amplitude because the potential energy has been introduced, or because of the divergence effect of the free surface.
The major propagating region for synoptic Rossby waves (the wave with a zonal wavenumber of eight and a period of 10 days is taken as an example) is enclosed by a southern critical latitude and a northern turning latitude in the Northern Hemisphere. A leading wave ray, defined by initial kl > 0, moves northward to the turning latitude and is then reflected close to the critical latitude. The wave energy approaches the maximum value at a certain latitude between the critical latitude and the turning latitude. The certain latitude divides the propagating region into two parts. In the southern part, the wave energy increases when the ray moves northward (leading structure) and decreases when the ray moves southward (trailing structure). The increase is mainly caused by the absorption of energy from the basic flow due to the leading structure (kl > 0) and positive meridional shear of the basic wind, while the decrease is the result of the loss of energy to the basic flow due to the trailing structure (kl < 0). Compared to the energy budget from the basic flow, the divergence of the group velocity has the opposite effect. The wave energy is divergent for the leading structure but concentrated for the trailing structure. In the northern part, the wave energy decreases when the ray continues to move northward and increases when the ray changes its direction to move southward. The decrease is mainly caused by the wave energy divergence due to increasingly fast group velocity when the ray moves northward on the south side of the jet center, or by the energy loss to the basic flow when the ray continues to move northward on the north side of the jet center. Accompanied by the varying wave energy, the total wavenumber (or meridional wavenumber) arrives at its minimum value at the turning latitude and then continues to increase when the ray moves toward the critical latitude. Compared with the wave energy, the total wavenumber changes more dramatically.Therefore, the amplitude shows a similar variation as the total wavenumber. It increases to the maximum value at the turning latitude and decreases to zero at the critical latitude,indicating a typical inverse relation with meridional wavenumber. A trailing wave ray, defined by initial kl < 0, moves toward the critical latitude directly. The wave energy decreases due to energy being absorbed by the basic flow,and the total wavenumber monotonically increases (the horizontal scale continues to shrink). Both contribute to the decreasing amplitude.
There also exists a narrow propagating region enclosed by two turning latitudes. Corresponding rays can propagate a long distance in such a region, which is mainly located near the jet center. Alternatively, the jet stream can be seen as a guide for the wave. When a leading ray moves north to the northern turning latitude, the wave energy decreases due to energy divergence, although the energy absorption from the basic flow plays a positive role. The total wavenumber approaches its maximum value at a certain latitude in the propagating region since it approaches the same minimum value at the two turning latitudes. In addition, the change range is relatively small. When the decrease in the wave energy is more significant, the amplitude decreases, and when the decrease in the total wavenumber is more significant, the amplitude increases. Therefore, amplitude does not have a simple inverse proportional relation with meridional wavenumber. Accompanied by the alternately moving ray between the two turning latitudes, the wave energy, amplitude, and total wavenumber all oscillate with respect to their initial values but with a slight range. This can ensure that the ray can move a long distance without extreme development or decay.
Rossby waves have different propagation properties in different propagating regions. They can develop only in certain regions enclosed by a critical latitude and a turning latitude. They can propagate a very long distance, but without significantly developing or decaying, in regions enclosed by two turning latitudes. They decay when propagating toward a critical latitude. For a specific weather phenomenon, the basic wind and wave sources and the propagating property can be identified with observed data. Then we can judge whether a corresponding wave can develop or not. This will bring guidance for explaining the weather phenomenon.Besides, the developing Rossby waves, especially significantly developing ones, may lead to instability. Therefore,the calculation for wave energy and amplitude may provide an effective method to theoretically discuss the barotropic instability problem.
Acknowledgements.This study was jointly funded by the National Natural Science Foundation of China (Grant Nos.41805041 and 41505042), the National Program on Global Change and Air-Sea Interaction (GASI-IPOVAI-03), the National Basis Research Program of China (2015CB953601 and 2014CB953903), and the Fundamental Research Funds for the Centr al Universities.
杂志排行

Advances in Atmospheric Sciences的其它文章
- Urbanization Impact on Regional Climate and Extreme Weather:Current Understanding, Uncertainties, and Future Research Directions
- Comparison of PM2.5 and CO2 Concentrations in Large Cities of China during the COVID-19 Lockdown
- A Hybrid Neural Network Model for ENSO Prediction in Combination with Principal Oscillation Pattern Analyses
- Evaluation of Arctic Sea Ice Drift and its Relationship with Near-surface Wind and Ocean Current in Nine CMIP6 Models from China
- Distinct Evolution of the SST Anomalies in the Far Eastern Pacific between the 1997/98 and 2015/16 Extreme El Niños
- Strengthened Regulation of the Onset of the South China Sea Summer Monsoon by the Northwest Indian Ocean Warming in the Past Decade