Nomograms predicting prognosis of patients with pathological stages T1N2-3 and T3N0 gastric cancer
2022-04-01YuFeiWangXinYinTianYiFangYiMinWangDaoXuZhangYaoZhangXiBoWangHaoWangYingWeiXue
Yu-Fei Wang,Xin Yin,Tian-Yi Fang,Yi-Min Wang,Dao-Xu Zhang,Yao Zhang,Xi-Bo Wang,Hao Wang,Ying-Wei Xue
Yu-Fei Wang,Xin Yin,Tian-Yi Fang,Yi-Min Wang,Dao-Xu Zhang,Yao Zhang,Xi-Bo Wang,Hao Wang,Ying-Wei Xue,Department of Gastroenterological Surgery,Harbin Medical University Cancer Hospital,Harbin 150081,Heilongjiang Province,China
Abstract BACKGROUND Patients with pathological stages T1N2-3(pT1N2-3)and pT3N0 gastric cancer(GC)have not been routinely included in the target population for postoperative chemotherapy according to the Japanese Gastric Cancer Treatment Guideline,and their prognosis is significantly different.AIM To identify the high-risk patients after radical surgery by analyzing biomarkers and clinicopathological features and construct prognostic models for them.METHODS A total of 459 patients with pT1N2-3/pT3N0 GC were retrospectively selected for the study.The Chi-square test was used to analyze the differences in the clinicopathological features between the pT1N2-3 and pT3N0 groups.The Kaplan–Meier analysis and log-rank test were used to analyze overall survival(OS).The independent risk factors for patient prognosis were analyzed by univariate and multivariate analyses based on the Cox proportional hazards regression model.The cutoff values of continuous variables were identified by receiver operating characteristic curve.The nomogram models were constructed with R studio.RESULTS There was no statistically significant difference in OS between the pT1N2-3 and pT3N0 groups(P = 0.374).Prealbumin(P = 0.040),carcino-embryonic antigen(CEA)(P = 0.021),and metastatic lymph node ratio(mLNR)(P = 0.035)were independent risk factors for prognosis in the pT1N2-3 group.Age(P = 0.039),body mass index(BMI)(P = 0.002),and gastrectomy(P < 0.001)were independent risk factors for prognosis in the pT3N0 group.The area under the curve values of the nomogram models for predicting the 5-year prognosis of the pT1N2-3 group and pT3N0 group were 0.765 and 0.699,respectively.CONCLUSION Nomogram model combining prealbumin,CEA,and mLNR levels can be used to predict the prognosis of pT1N2-3 GC.Nomogram model combining age,BMI,and gastrectomy can be used to predict the prognosis of pT3N0 GC.
Key Words:Gastric cancer;Biomarker;Clinicopathological feature;Adjuvant chemotherapy;Prognosis;Nomogram
lNTRODUCTlON
Gastric cancer(GC)is the sixth most common cancer and the third leading cause of cancer-related death,with more than 860000 deaths annually[1].The TNM staging system based on tumor infiltration,regional lymph node metastasis,and distant metastasis is considered as the conventional criterion for predicting prognosis and guiding treatment[2].Adjuvant chemotherapy is recommended for patients with pathological stage II or III GC after radical resection to reduce recurrence probability.However,based on the results of the Adjuvant Chemotherapy Trial of TS-1 for Gastric Cancer(ACTS-GC)[3],the Japanese Gastric Cancer Treatment Guidelines[4]recommend stage II/III disease as the standard target of adjuvant chemotherapy after surgery,with the exception of pathological stage T1N2-3(pT1N2-3)and pT3N0.But,in these two groups,there is still a portion of high-risk patients with a poor prognosis.Therefore,the research of pT1N2-3 and pT3N0 GC patients with a poor prognosis may help clinicians carry out targeted and individualized treatment.
Although previous studies have discussed independent prognostic factors among patients with pT1N2-3 and pT3N0 GC,relevant results have not been consistent.Yuraet al[5]suggested that pT1N2-3 patients with stage N3 or tumor diameter < 30 mm had a relatively poor prognosis,while pT3N0 patients had a good prognosis.Teradaet al[6]suggested that patients with pT3N0/pT1N2-3 complicated with vascular infiltration might be at a high risk for disease recurrence and might be candidates for adjuvant chemotherapy.Other relevant studies have shown that lymphatic infiltration is an independent risk factor for poor prognosis in pT3N0 GC patients[7,8].The above studies showed that the high heterogeneity of the same stage GC patients leads to significant differences in the risk for recurrence and death.Therefore,the search for effective diagnostic and monitoring tools for GC patients is a critical clinical goal.Many studies have shown that peripheral blood biomarkers and clinicopathological features can play an effective complementary role and have been widely used for the early diagnosis,therapeutic effect monitoring,and prognostic prediction of GC patients[9-11].However,previous studies evaluated the prognostic value of only a limited number of clinicopathological features,and the results of these studies inevitably have some limitations.Therefore,this study aimed to determine peripheral blood biomarkers and clinicopathological features that influence the prognosis of patients with pT1N2-3 and pT3N0 GC,thereby more comprehensively identifying patients who may benefit from adjuvant chemotherapy.
In this study,we retrospectively analyzed patients who underwent radical gastrectomy at the Harbin Medical University Cancer Hospital between January 2000 and April 2016.The predictive models were constructed by combining the peripheral blood biomarkers and clinicopathological features which influence the prognosis of pT1N2-3b and pT3N0 GC patients.
MATERlALS AND METHODS
Patients
A total of 459 patients with pT1N2-3/pT3N0 GC were continuously selected for the study.All GC patients underwent radical gastrectomy according to the respective conditions[4].The diagnosis of GC was based on tissue samples obtained during gastroscopy and further confirmed by pathologists through examination of postoperative pathological tissue.During hospitalization,the patients underwent routine preoperative examinations,including magnetic resonance imaging/gastric computed tomography(CT),abdominal ultrasonography,chest radiography,electrocardiography,hematological examination,and tumor marker examination.Some patients underwent positron emission tomography(PET)/CT if necessary.The patients were followed until the date of death or for 5 years,whichever came first.
The exclusion criteria were as follows:(1)Preoperative chemotherapy;(2)severe heart disease;(3)remnant gastric cancer;(4)postoperative confirmation of stage IV disease;(5)history of partial resection;(6)history of other malignant tumors;(7)esophagogastric junction tumor;and(8)endocrine carcinoma.
Postoperative chemotherapy regimens were based on the National Comprehensive Cancer Network Clinical Practice Guidelines in Oncology[12].Oxaliplatin + capecitabine(XELOX)or oxaliplatin + S-1(SOX)are the main treatment options for patients with stage II or III GC.To ensure the accuracy of the study,we included 166 patients who received complete postoperative chemotherapy at our institution.We did not include patients who did not undergo treatment at our institution or who returned to the local hospital after surgery and had incomplete chemotherapy records.
Clinicopathological data
Clinicopathological data of the patients were saved in the Gastric Cancer Information Management System v1.2 of the Harbin Medical University Cancer Hospital(Copyright No.2013SR087424,http://www.sgihmu.com),including sex,age,body mass index(BMI),tumor diameter,tumor location,gastrectomy,histological type,metastatic lymph node ratio(mLNR),pT stage,pN stage,Borrmann type,vascular infiltration,nerve infiltration,postoperative chemotherapy,and laboratory examination.pTNM stage was consistent with the eighth edition of the American Joint Commission on Cancer(AJCC).Tumor marker or radiographic examinations(ultrasound,CT,and gastroscopy)were performed on all patients every 3-6 mo postoperatively.In addition,PET/CT examinations were performed as needed.
Blood sample collection
Blood samples were taken on an empty stomach the day after admission.Venous blood(2 mL)was collected from the cubital vein and sent to the blood laboratory to separate the serum and calculate the corresponding blood indexes.
Statistical analysis
The chi–square test was used to analyze the differences in clinicopathological factors between the two groups.Overall survival(OS)was defined as the date from surgery to death or the date of the last follow-up.The OS was shown as the mean and 95% confidence interval(CI).According to the receiver operating characteristic curve(ROC),the "Youden index" was calculated by sensitivity-(1-specificity).The maximum value of the Youden index was the optimal cutoff value for continuous variables.The log-rank test and Kaplan–Meier method were used to analyze survival curves.Univariate and multivariate analyses based on the Cox proportional hazards regression model were used to analyze the independent risk factors for prognosis.Hazard ratios(HRs)and 95%CIs were estimated for each factor.The nomogram models were drawn through R studio using the “SvyNom” and “rms” packages.Calibration plots were used to show the relationship between predicted probabilities and the actual outcome by using the Hosmer goodness-of-fit test.SPSS version 25.0(SPSS Inc.,Chicago,IL,United States)was used for statistical analyses,andP< 0.05 was considered statistically significant.
RESULTS
Clinicopathological characteristics
According to the postoperative pathology report,there were 89 and 370 patients in the pT1N2-3 group and pT3N0 group,respectively.In the pT1N2-3 group,the age range was 28-81 years(median,55 years),and the male:female ratio was 44:45.In the pT3N0 group,the age range was 24-87 years(median,58 years),and the male:female ratio was 269:101.There were statistically significant differences in the clinicopathological features between the two groups,including sex(P< 0.001),tumor diameter(P=0.002),tumor location(P= 0.007),gastrectomy(P= 0.001),histological type(P= 0.043),vascular infiltration(P= 0.021),nerve infiltration(P< 0.001),and postoperative chemotherapy(P< 0.001).Table 1 shows the clinicopathological features of the two groups.

Table 1 Baseline characteristics of patients with pT1N2-3 and pT3N0 GC,n(%)
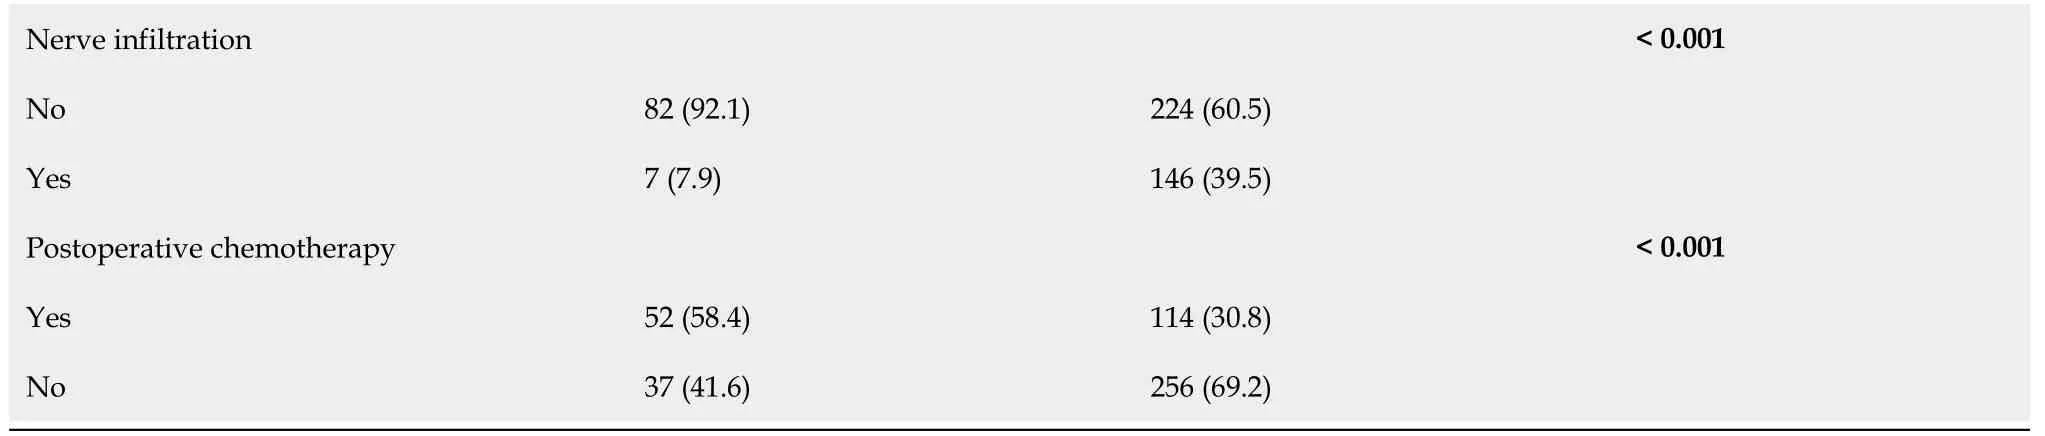
Tumor location,histological type,pT stage,pN stage,pTNM stage,vascular infiltration,and nerve infiltration were according to the postoperative pathology report.Statistically significant P values are in bold(P < 0.05).BMI:Body mass index.
Comparison of prognosis between the two groups
The OS of patients with pT1N2-3 GC was 53.34(95%CI:50.369-56.317)mo,and the 5-year OS rate was 73.7%.The OS of patients with pT3N0 GC was 53.66(95%CI:52.179-55.149)mo,and the 5-year OS rate was 79.7%.There was no statistically significant difference in OS between the two groups(P=0.374)(Figure 1A).In the pT1N2-3 group,there was no significant difference in OS between patients with and without postoperative chemotherapy(OS:53.20 movs53.40 mo,P= 0.527;HR:0.744,95%CI:0.297-1.865)(Figure 1B).Similarly,in the pT3N0 group,there was no significant difference in OS between patients with and without postoperative chemotherapy(OS:55.08 movs53.03 mo,P= 0.236;HR:0.774,95%CI:0.430-1.393)(Figure 1C).

Figure 1 Survival curve analyses for patients with pT1N2-3 and pT3N0 GC.A:Overall survival curves for all patients;B:Overall survival curves for pT1N2-3 patients with and without postoperative chemotherapy;C:Overall survival curves for pT3N0 patients with and without postoperative chemotherapy.
Prognosis of the pT1N2-3 group
Univariate and multivariate analyses based on the Cox proportional hazards regression model were performed to identify independent risk factors associated with the prognosis of patients with pT1N2-3 GC.Univariate analysis showed that age(P= 0.044),prealbumin(P= 0.003),carcino-embryonic antigen(CEA)(P= 0.004),and mLNR(P< 0.001)were statistically significant.Multivariate analysis showed that prealbumin(P= 0.040),CEA(P= 0.021),and mLNR(P= 0.035)were independent risk factors associated with prognosis(Table 2).
Subgroup analysis of independent risk factors associated with the prognosis of pT1N2-3 patients was performed.According to the Youden index,222.35,3.17,and 0.28 were the optimal cutoff values for prealbumin,CEA,and mLNR to evaluate the prognosis of patients with pT1N2-3 disease(Figure 2A).Subgroup analysis showed that there was a statistically significant difference in OS between patients with prealbumin > 222.35 mg/L and those with prealbumin ≤ 222.35 mg/L(OS:57.11 movs42.82 mo,P< 0.001;HR:5.972,95%CI:2.430-14.681),between patients with CEA ≤ 3.17 ng/mL and those with CEA> 3.17 ng/mL(OS:55.34 movs43.19 mo,P= 0.008;HR:3.497,95%CI:1.391-8.792),and between patients with mLNR ≤ 0.28 and those with mLNR > 0.28(OS:55.07 movs45.72 mo,P= 0.001;HR:4.430,95%CI:1.825-10.750).In addition,the combination of independent risk factors associated with the prognosis of pT1N2-3 patients was analyzed for survival.Patients with 0,1,and 2-3 risk factors were defined as the low-risk group,moderate-risk group,and high-risk group,respectively,and there were statistically significant differences in OS among these groups(OS:58.95 movs48.91 movs38.36 mo,respectively,P< 0.001)(Figure 3A-D).
Prognosis of the pT3N0 group
Univariate and multivariate analyses based on the Cox proportional hazards regression model were performed to identify independent risk factors associated with the prognosis of patients with pT3N0 disease.Univariate analysis showed that age(P= 0.019),BMI(P= 0.004),tumor diameter(P= 0.003),Borrmann type(P= 0.018),and gastrectomy(P< 0.001)were statistically significant.Multivariate analysis showed that age(P= 0.039),BMI(P= 0.002),and gastrectomy(P< 0.001)were independent risk factors associated with prognosis(Table 3).
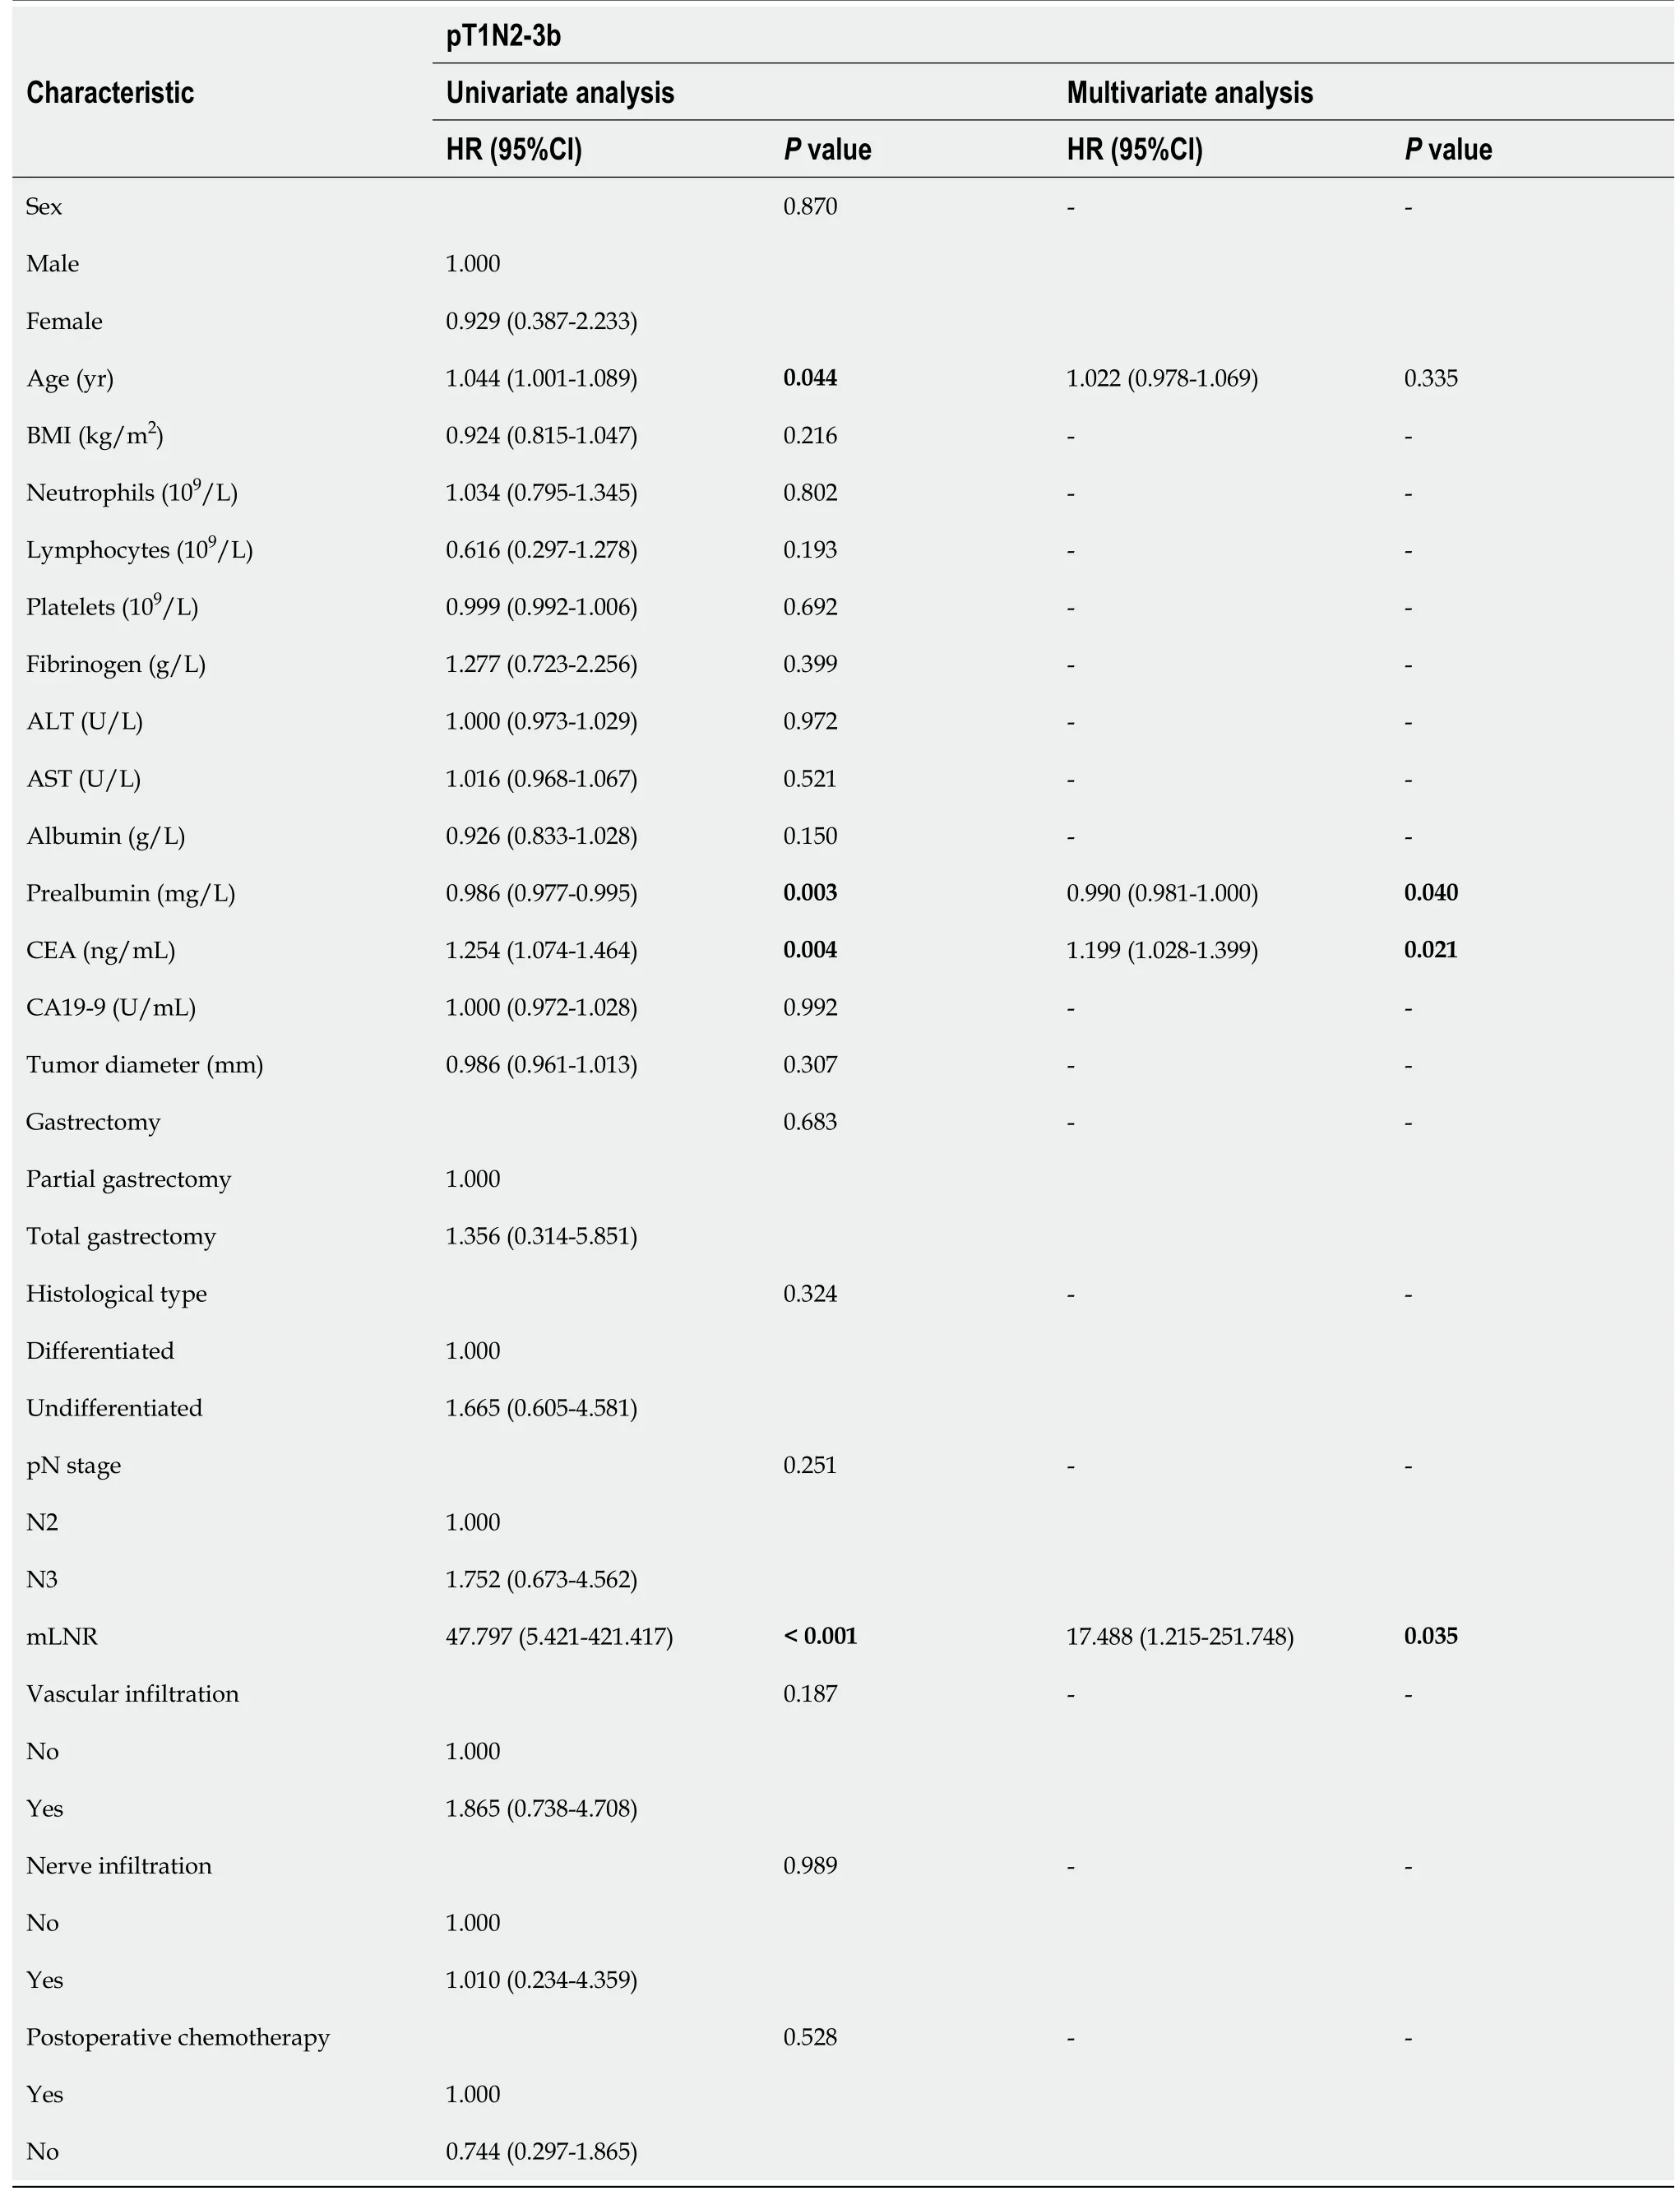
Table 2 Univariate and multivariate analyses of clinicopathological factors of patients with pT1N2-3b GC

Table 3 Univariate and multivariate analyses of clinicopathological factors of patients with pT3N0 GC
Subgroup analysis of independent risk factors associated with pT3N0 patient prognosis was performed.According to the Youden index,60.5 and 22.48 were the optimal cutoff values for age and BMI to evaluate the prognosis of patients with pT1N2-3(Figure 2B).Subgroup analysis showed that there was a statistically significant difference in OS between patients aged ≤ 60 years and those aged >60 years(OS:55.07 movs51.66 mo,P= 0.003;HR:2.010,95%CI:1.252-3.228),between patients with BMI> 22.48 kg/m2and those with BMI ≤ 22.48 kg/m2(OS:55.80 movs51.81 mo,P= 0.002;HR:2.165,95%CI:1.299-3.611),and between patients who underwent partial gastrectomy and those who underwent total gastrectomy(OS:55.19 movs47.92 mo,P< 0.001;HR:3.378,95%CI:2.105-5.421).In addition,the combination of independent risk factors associated with the prognosis of pT3N0 patients was analyzed for survival.Patients with 0,1,and 2-3 risk factors were defined as the low-risk group,moderate-risk group,and high-risk group,respectively,and there were statistically significant differences in OS among these groups(OS:57.42 movs55.02 movs49.45 mo,respectively,P< 0.001)(Figure 3E-H).
Nomogram models
We combined the independent risk factors associated with prognosis to construct nomograms that were used to evaluate the prognosis of patients in the pT1N2-3 and pT3N0 groups(Figure 4A and D).The area under the curve(AUC)of the nomogram model in predicting the 3-year and 5-year prognosis of pT1N2-3 patients was 0.772(95%CI:0.617-0.926)and 0.765(95%CI:0.639-0.891),respectively;the sensitivity was 81.8% and 75.0%,respectively,and the specificity was 73.1% and 73.9%,respectively(Figure 4B and C).The AUC of the nomogram model for predicting the 3-year and 5-year prognosis of pT3N0 patients was 0.632(95%CI:0.547-0.837)and 0.699(95%CI:0.629-0.768),respectively;the sensitivity was 52.9% and 64.3%,respectively,and the specificity was 69.9% and 67.3%,respectively(Figure 4E and F).In addition,the calibration plots showed that the nomogram performed well forpredicting the 3-year OS of the pT1N2-3 group and the 3- and 5-year OS of the pT3N0 group but did not perform well for predicting the 5-year OS of the pT1N2-3 group(Figure 5).
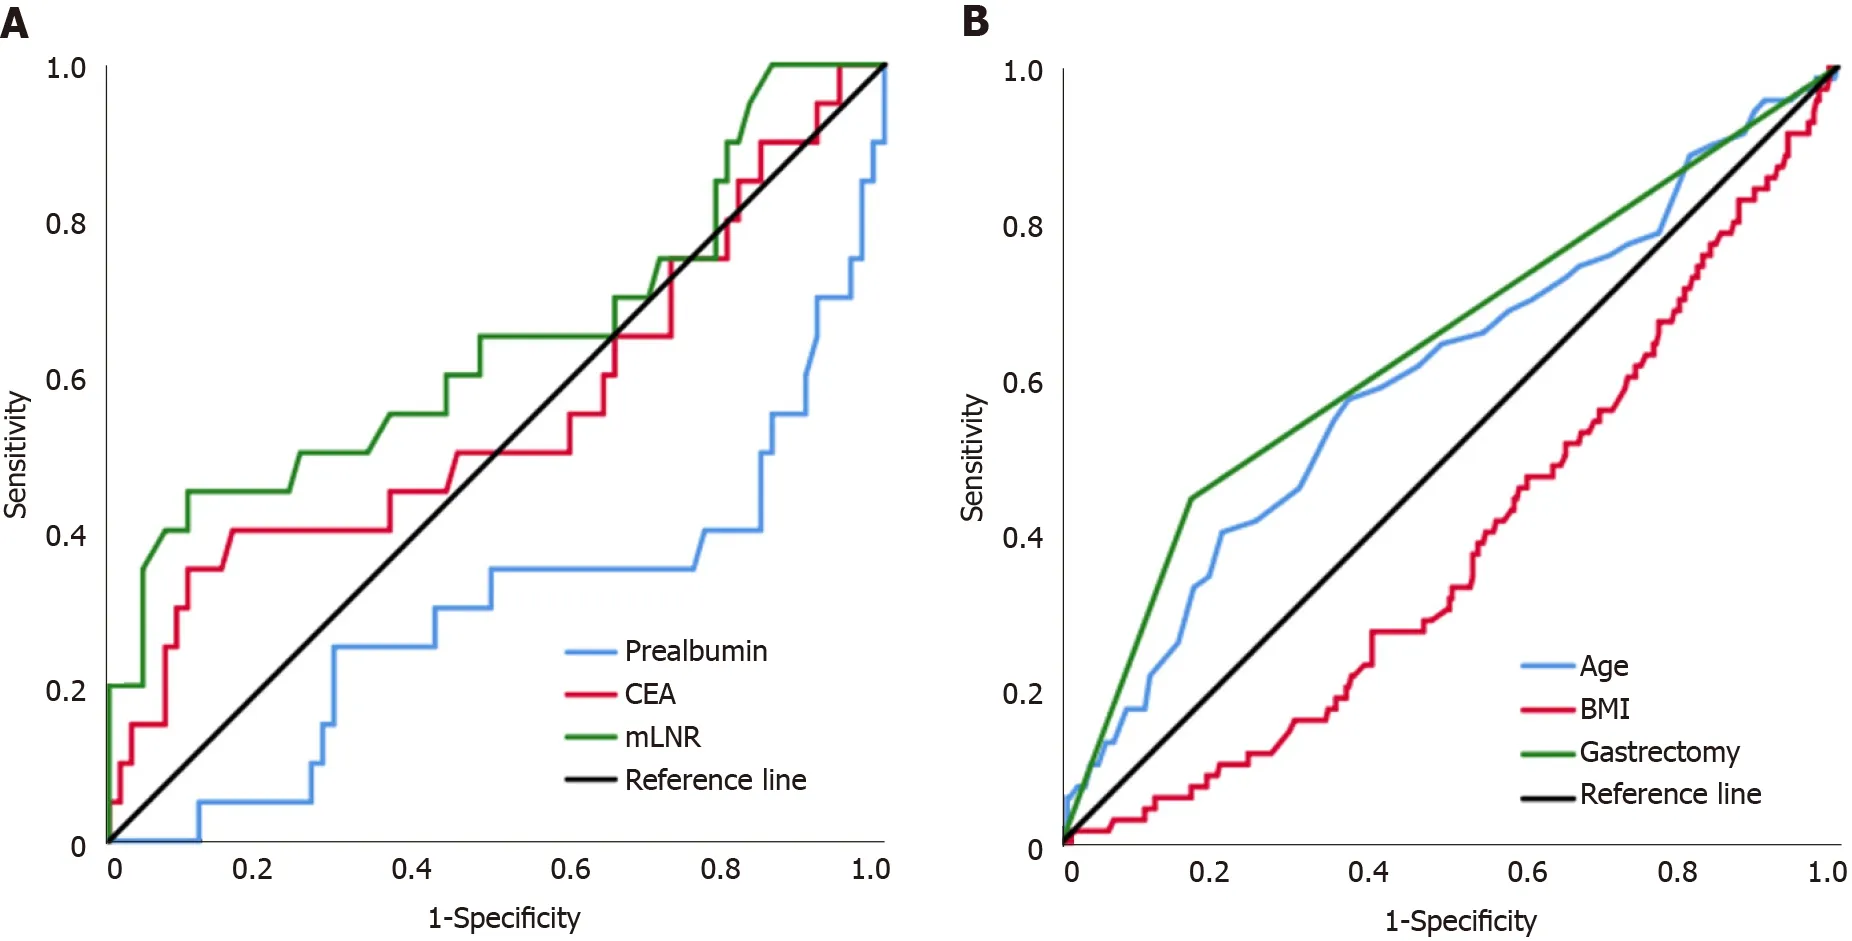
Figure 2 Receiver operating characteristic curves of clinicopathological factors of patients with pT1N2-3 and pT3N0 GC.A:Assessing the prognosis of patients with pT1N2-3 GC;B:Assessing the prognosis of patients with pT3N0 GC.CEA:Carcino-embryonic antigen;mLNR:Metastatic lymph node ratio;BMI:Body mass index.

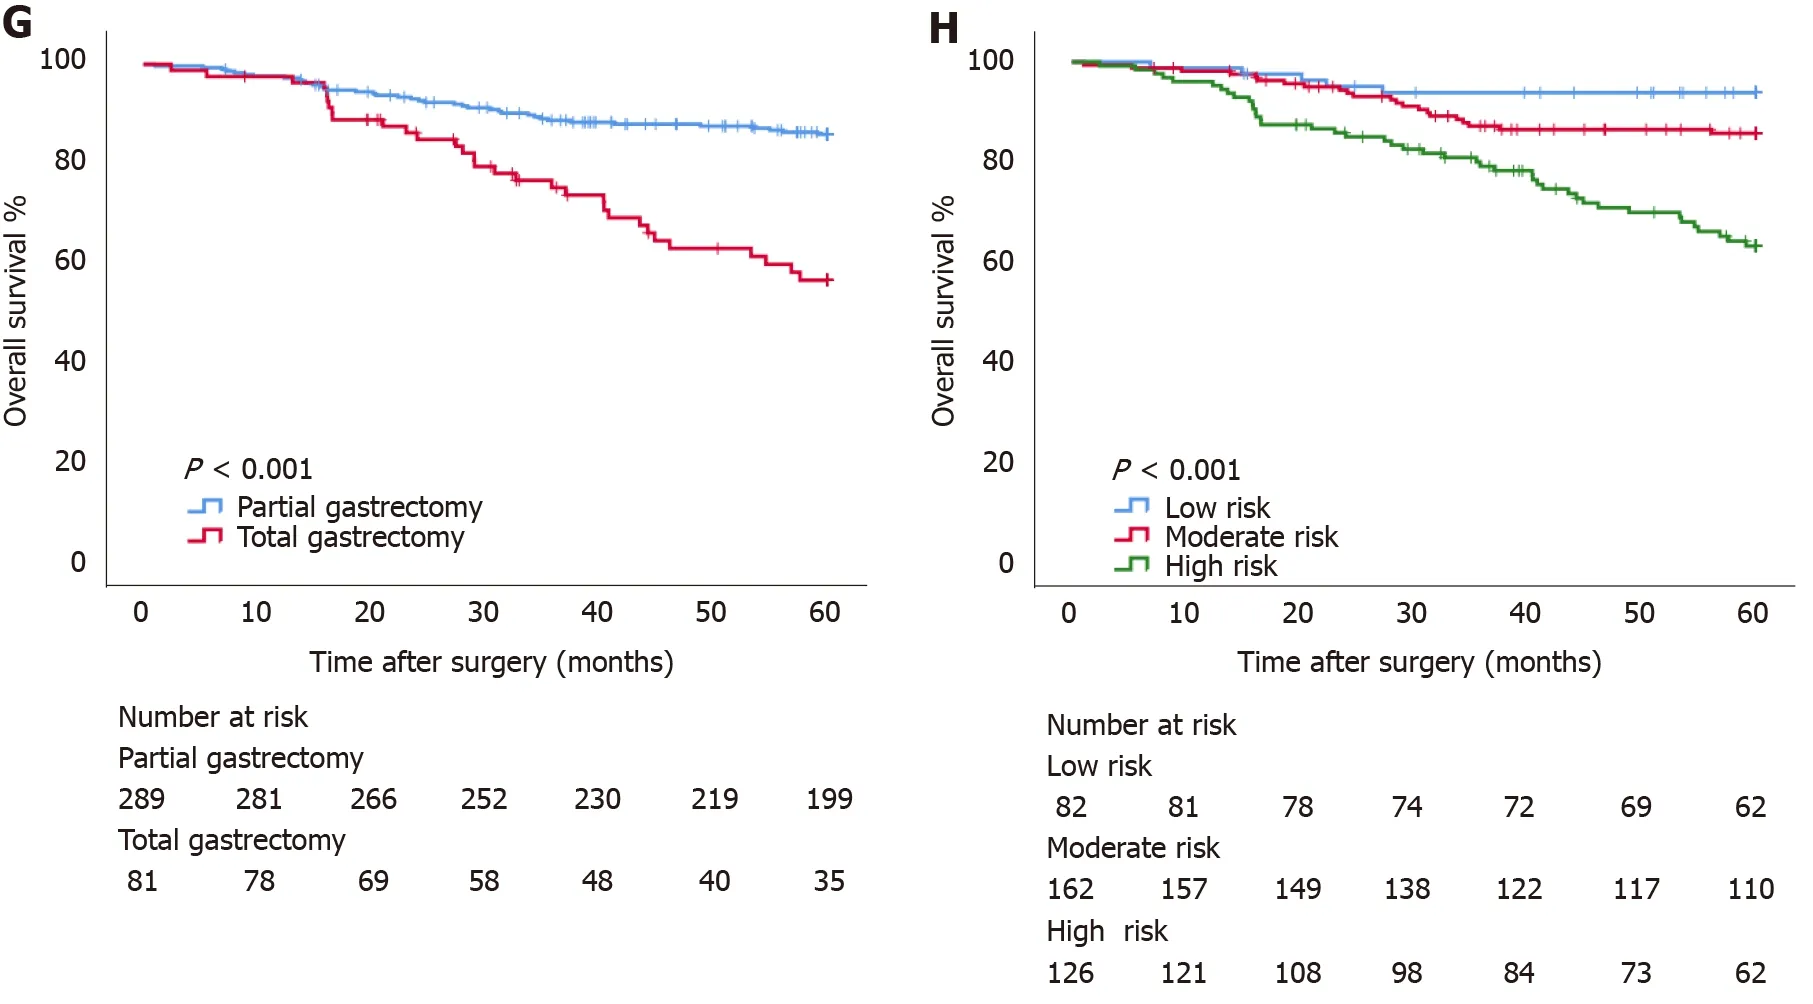
Figure 3 Survival curve subgroup analyses of patients.A:Overall survival curves for patients with prealbumin ≤ 222.35 mg/L and prealbumin > 222.35 mg/L in the pT1N2-3 group;B:Overall survival curves for patients with carcino-embryonic antigen(CEA)≤ 3.17 ng/mL and CEA > 3.17 ng/mL in the pT1N2-3 group;C:Overall survival curves for patients with metastatic lymph node ratio(mLNR)≤ 0.28 and mLNR > 0.28 in the pT1N2-3 group;D:Overall survival curves for patients with low risk,moderate risk,and high risk in the pT1N2-3 group;E:Overall survival curves for patients aged ≤ 60 years and aged > 60 years in the pT3N0 group;F:Overall survival curves for patients with body mass index(BMI)≤ 22.48 kg/m2 and BMI > 22.48 kg/m2 in the pT3N0 group;G:Overall survival curves for patients with partial gastrectomy and total gastrectomy in the pT3N0 group;H:Overall survival curves for patients with low risk,moderate risk,and high risk in the pT3N0 group.CEA:Carcino-embryonic antigen;mLNR:Metastatic lymph node ratio;BMI:Body mass index.
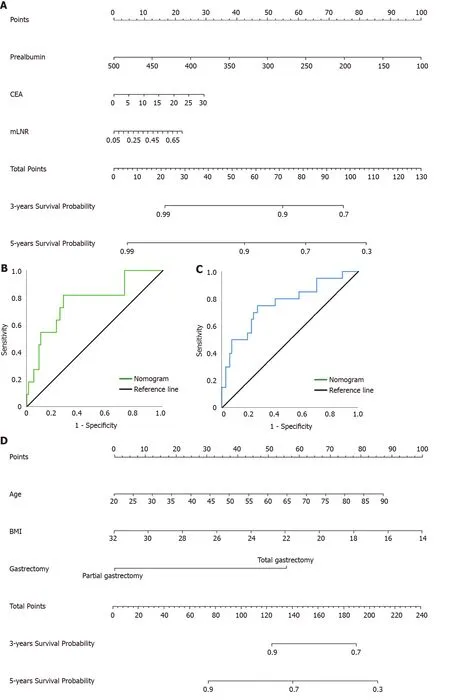
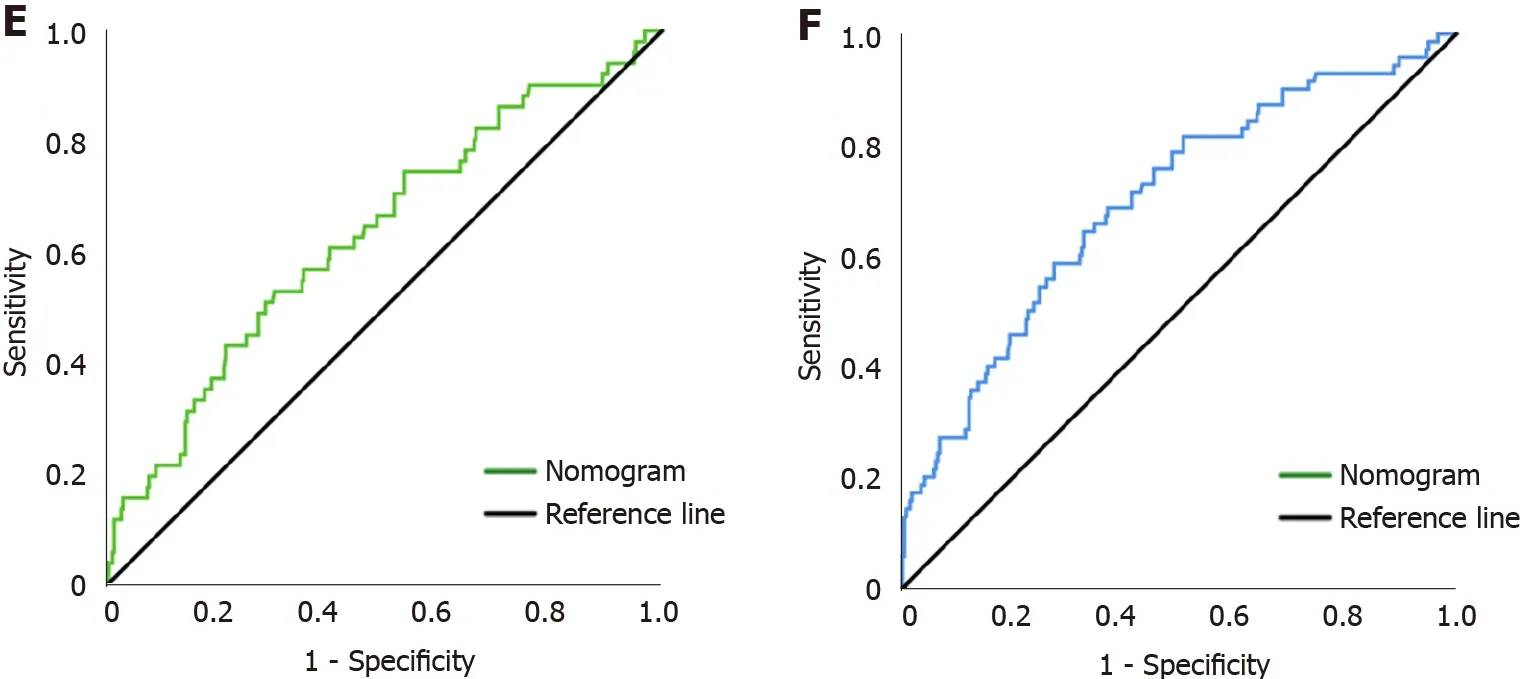
Figure 4 Nomogram models for predicting the survival of patients with pT1N2-3 and pT3N0 GC.A:Nomogram model predicting the 3- and 5-year survival of patients with pT1N2-3 GC;B:Receiver operating characteristic curve(ROC)of the nomogram model for predicting the 3-year survival of patients with pT1N2-3 GC;C:ROC of the nomogram model for predicting the 5-year survival of patients with pT1N2-3 GC;D:Nomogram model for predicting the 3- and 5-year survival of patients with pT3N0 GC;E:ROC of the nomogram model for predicting the 3-year survival of patients with pT3N0 GC;F:ROC of the nomogram model for predicting the 5-year survival of patients with pT3N0 GC.CEA:Carcino-embryonic antigen;mLNR:Metastatic lymph node ratio;BMI:Body mass index.
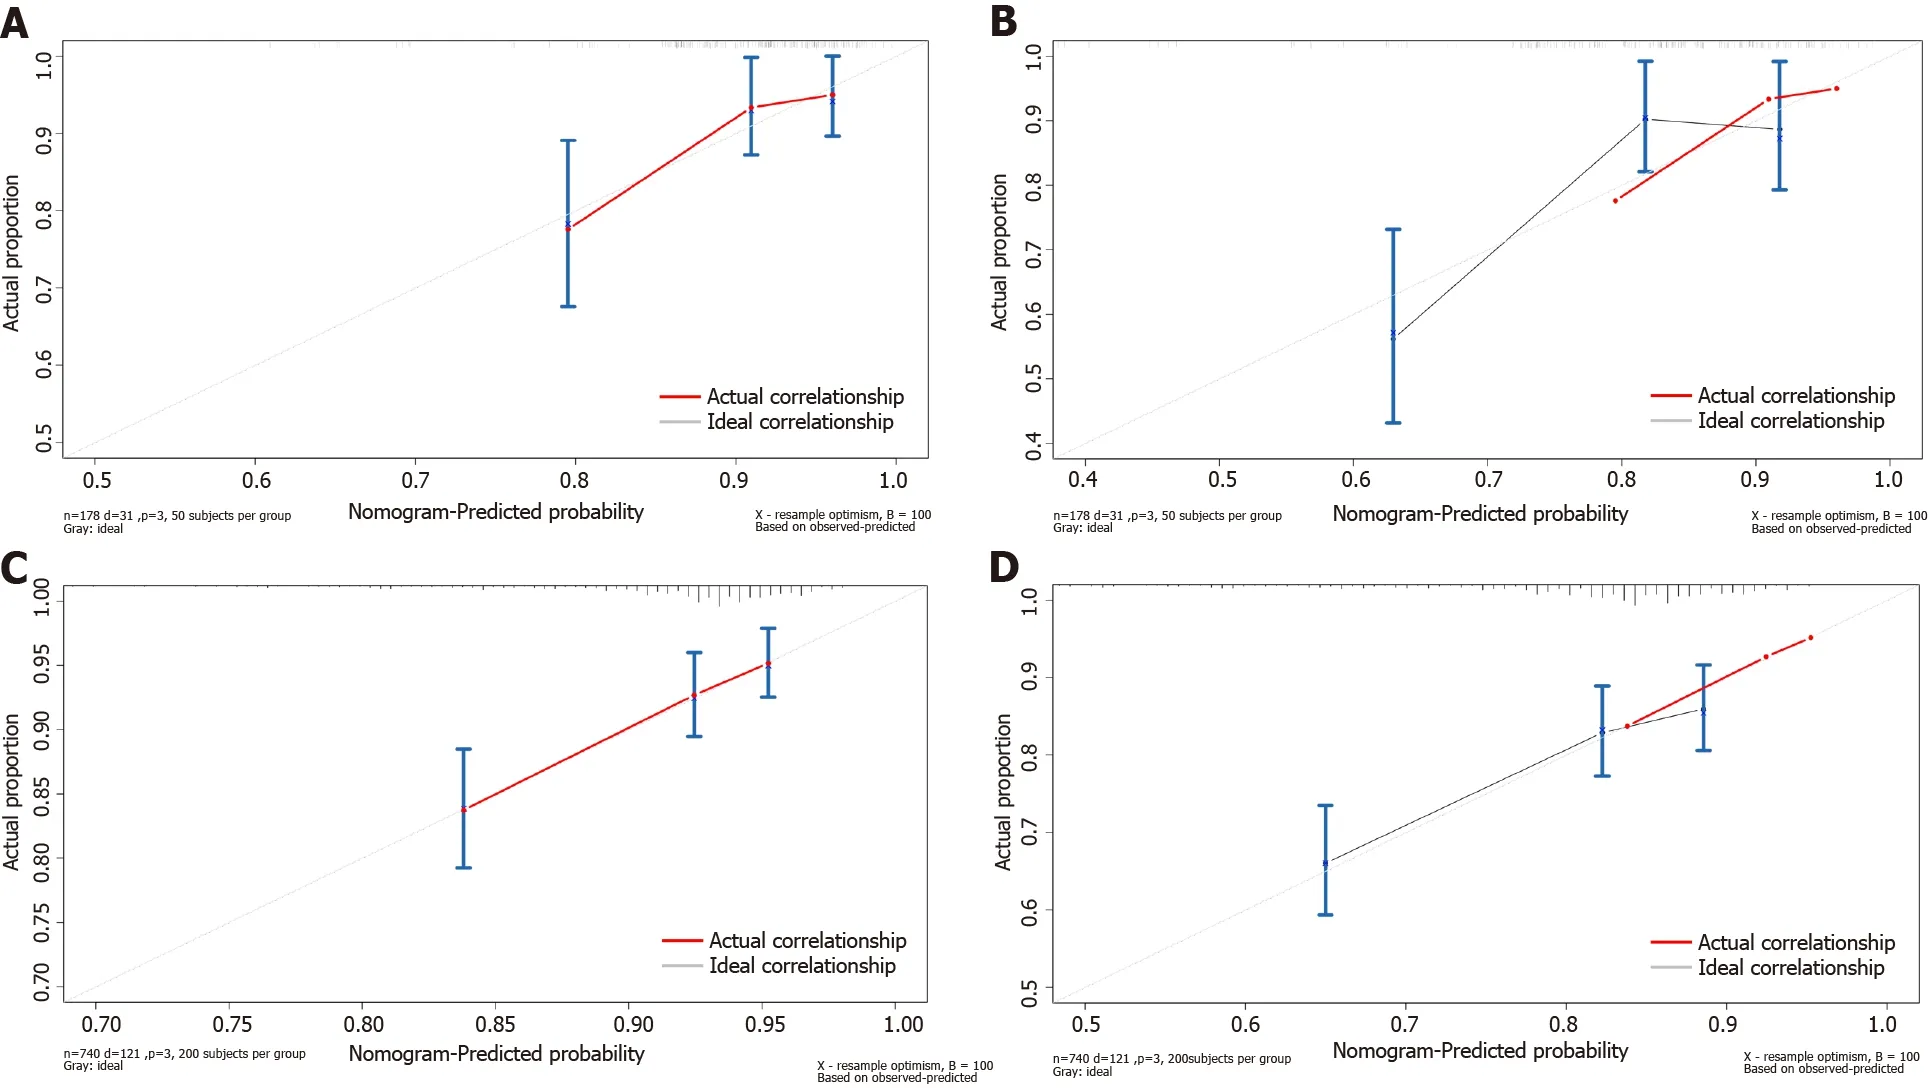
Figure 5 Calibration plots for the nomograms.Correlation between the predicted probabilities based on the nomograms and actual values is shown.A:3-year survival of patients with pT1N2-3 GC;B:5-year survival of patients with pT1N2-3 GC;C:3-year survival of patients with pT3N0;D:5-year survival of patients with pT3N0 GC.
DlSCUSSlON
To date,much evidence has been found indicating that appropriate postoperative adjuvant chemotherapy can improve the survival probability after radical resection[3,13-15].According to the results of the ACTS-GC trial[3],the indications for postoperative chemotherapy excluded pT1N2-3 patients who were classified as stage II/III due to pT1 and pT3N0 patients who were classified as stage IB based on the 13thedition of the Japanese Classification of Gastric Carcinoma[16].And in the current 14thedition,pT3N0 patients were classified as stage IIA[6].However,there are still patients with pTIN2-3 and pT3N0 GC who have a poor prognosis,and identifying them through a clinical retrospective study is of substantial value.
Based on the Cox hazards regression model,our study identified prealbumin,CEA,and mLNR as independent prognostic factors for pT1N2-3 patients,while age,BMI,and gastrectomy were independent prognostic factors for pT3N0 patients.Some studies have shown that,as an important indicator of nutritional assessment,prealbumin plays a key role in the complicated link among systemic inflammation,malnutrition,and the tumor immune microenvironment[17,18].Our study showed that low preoperative prealbumin levels may cause immunodeficiency in patients with stage T1 disease accompanied by extensive lymph node metastasis,leading to tumor progression[19].Consistent with the results of Qiaoet al[20],we found that high preoperative CEA level was associated with positive lymph node metastasis in patients with pT1 disease and predicted a poor prognosis.This is related to the function of CEA as an isotype of intercellular adhesion molecule that can promote the aggregation and distant metastasis of tumor cells[21].In addition,we found that advanced age,low preoperative BMI,and total gastrectomy,as independent prognostic risk factors for pT3N0 patients,were closely related to postoperative malnutrition,which was consistent with the results of the previous studies[22,23].Short- to medium-term postoperative malnutrition might weaken immune function throughout the body,resulting in an increased risk for cancer recurrence,infectious disease,and death[19].The mechanism by which immune function is weakened in malnourished individuals involves cytoplasmic nutrient sensors affecting T lymphocyte metabolism and intestinal dysfunction changing the pathway of nutrient sensing[24,25].Additionally,surgical stress compromises the activity of natural killer(NK)cells and causes immune dysfunction,which is associated with high cancer recurrence and mortality rates[26,27].Therefore,immune dysfunction due to surgical stress and malnutrition may increase the risk for early cancer recurrence after surgery.
However,contrary to the findings of Yuraet al[5],our findings suggested that mLNR is an independent prognostic factor for patients with pT1N2-3,rather than N stage.Schwarzet al[28]found that the prediction of survival based on N stage depended on the total number of lymph nodes resected and the quantity of negative nodes.However,there is considerable heterogeneity in the number of recovered lymph nodes due to differences in the skill level of the surgeons and the experience of the pathologists.Some researchers suggested that variability due to the difference in the number of recovered lymph nodes might be eliminated by mLNR,and they also found that mLNR was an independent prognostic factor[29,30].Therefore,we believe that for evaluating the prognosis of pT1N2-3 GC patients,mLNR is more suitable than N stage.Furthermore,we found that tumor diameter was not an independent prognostic factor for pT1N2-3 patients.Tumor diameter was included by Yuraet al[5]as a categorical variable,and thePvalue became significant only when the optimal cutoff value of tumor diameter was 30 mm.We included the tumor diameter as a continuous variable,which improved the reliability of the results.Previous studies have revealed that pT3N0 GC patients with vascular infiltration have a higher risk of tumor recurrence[6-8],indicating a poor prognosis,which was not consistent with our findings.In fact,determination of the presence or absence of postoperative vascular infiltration may vary due to different staining methods and diagnostic criteria between single centers[31].Therefore,in the future,a multicenter study that uses unified methods and standards is needed to more accurately determine the prognostic value of vascular infiltration in pT3N0 patients.
Our study showed that whether patients with pT1N2-3b and pT3N0 receive postoperative adjuvant chemotherapy has no significant effect on the OS,which was consistent with the results of previous studies[3,32].The JCOG8801 phase III trial compared adjuvant chemotherapy with mitomycin and fluorouracil to surgery alone.They found that for patients with pT1N+ or pT2-3N0 GC,adjuvant chemotherapy did not provide additional survival benefits compared with surgery alone and excluded pT1N2-3 and pT3N0 from the indications for postoperative adjuvant chemotherapy.In that trial,the subgroups of pT1N2-3 and pT3N0 were not examined.It was not known whether all patients with pT1N2-3 and pT3N0 who receive surgical treatment alone have a good prognosis.In this study,we evaluated the independent risk factors that affected the prognosis of patients in both groups and attempted to identify patients who would potentially benefit from adjuvant chemotherapy based on peripheral blood biomarkers and clinicopathological features.Our study found that pT1N2-3 patients with high-risk factors,such as low preoperative prealbumin level,high preoperative CEA level,and high mLNR,would potentially benefit from postoperative adjuvant chemotherapy,while surgical treatment alone was not guaranteed to improve prognosis.Therefore,appropriate use of adjuvant chemotherapy after surgery,as well as regular reexamination and close follow-up,is recommended.However,considering that independent risk factors for prognosis in pT3N0 patients,such as advanced age,preoperative low BMI,and total gastrectomy,are strongly associated with postoperative malnutrition,we recommend pT3N0 patients whose indicators mentioned above indicate a poor prognosis as candidates for active nutritional intervention.Furthermore,their tolerance to postoperative adjuvant chemotherapy is poor,and postoperative adjuvant chemotherapy may increase the risk for malnutrition among these patients[23].Therefore,postoperative adjuvant chemotherapy is not a preferred treatment strategy.Clinicians should pay more attention to the postoperative nutritional condition,complications,and infections of these patients,and select the appropriate time for postoperative adjuvant chemotherapy based on these factors.
Clinically,some experts have found that pTNM stage based on postoperative pathology can provide effective but incomplete information for treatment.Patients at the same stage show significant individual differences in prognosis.Many studies have shown that peripheral blood biomarkers and clinicopathological features can play effective complementary roles and are widely used in the early detection,clinical staging,treatment response monitoring,and prognosis prediction of GC.For example,Liuet al[33]constructed a nomogram based on inflammatory biomarkers and mLNR to predict the survival of patients with radical gastrectomy.Therefore,the predictive models constructed by combining peripheral blood biomarkers with clinicopathological features have the advantages of more accurate and individualized evaluation of patient prognosis and reducing the differences caused by heterogeneity.Based on the Cox hazards regression model,we found that prealbumin,CEA,and mLNR were independent risk factors associated with the prognosis of pT1N2-3 GC patients,and age,BMI,and gastrectomy were independent risk factors associated with the prognosis of pT3N0 GC patients.Then,we constructed nomogram models to predict the prognosis of patients with pT1N2-3 and pT3N0.ROC analysis showed that the AUC of the nomogram model in predicting the 3-year and 5-year prognosis of pT1N2-3 patients was 0.772(95%CI:0.617-0.926)and 0.765(95%CI:0.639-0.891),respectively;the sensitivity was 81.8% and 75.0%,respectively,and the specificity was 73.1% and 73.9%,respectively.The AUC of the nomogram model in predicting the 3-year and 5-year prognosis of pT3N0 patients was 0.632(95%CI:0.547-0.837)and 0.699(95%CI:0.629-0.768),respectively;the sensitivity was 52.9% and 64.3%,respectively,and the specificity was 69.9% and 67.3%,respectively.The lower AUC may be related to the fact that patients with pT3N0 tend to have a good prognosis and fewer significant clinicopathological factors.In addition,the calibration plots showed that the nomogram performed well for predicting the 3-year OS of the pT1N2-3 group and the 3- and 5-year OS of the pT3N0 group but did not perform well in predicting the 5-year OS of the pT1N2-3 group.This may be due to the small number of patients in the pT1N2-3 group included in our study.Our results showed that the predictive model constructed by peripheral blood biomarkers and clinicopathological features can evaluate the prognosis of patients with pT1N2-3 and pT3N0,which is worthy of further validation and promotion in clinical practice.
There were some limitations in this study.First,this was a retrospective study,and the sample size in the pT1N2-3 group was small.The results of this study need to be verified by more prospective studies.Second,this was a single-center study,focusing only on Asian populations.Whether these results are widely applicable to both White and Black populations needs to be further studied by enlarging the sample size.Third,because pT1N2-3 and pT3N0 GC patients are too rare,there is a lack of sufficient sample size for internal and external validation of nomogram model,which is also the direction of our further study in the future.
CONCLUSlON
The nomogram model based on prealbumin,CEA,and mLNR can be used to predict the prognosis of pT1N2-3 GC patients.The nomogram model based on age,BMI,and gastrectomy can be used to predict the prognosis of pT3N0 GC patients.
ARTlCLE HlGHLlGHTS
Research background
Gastric cancer(GC)is an important public health burden worldwide.The TNM staging system based on tumor infiltration,regional lymph node metastasis,and distant metastasis is considered as the conventional criterion for evaluating prognosis and guiding treatment after surgery.Adjuvant chemotherapy can effectively reduce the disease recurrence.Based on the results of the Adjuvant Chemotherapy Trial of TS-1 for Gastric Cancer(ACTS-GC),stage II/III disease as the standard target of adjuvant chemotherapy after surgery,with the exception of pathological stages T1N2-3(pT1N2-3)and pT3N0.However,in these two groups,there is still a portion of high-risk patients with a poor prognosis.
Research motivation
Analyzing the independent risk factors for the prognosis of pT1N2-3 and pT3N0 GC patients will provide a basis for clinicians to treat and predict the prognosis of these patients in the future.
Research objectives
To identify the high-risk group among these patients after radical surgery by analyzing biomarkers and clinicopathological features and construct prognostic models for them.
Research methods
This retrospective study analyzed the clinicopathological characteristics and long-term survival data of 459 patients with pT1N2-3/pT3N0 GC,all of whom underwent radical gastrectomy at the Harbin Medical University Cancer Hospital between January 2000 and April 2016.The chi–square test was used to analyze the differences in the clinicopathological features between the pT1N2-3 and pT3N0 groups.The Kaplan–Meier analysis and log-rank test were used to analyze overall survival(OS).The independent risk factors for patient prognosis were analyzed by univariate and multivariate analyses based on the Cox proportional hazards regression model.The cutoff values of continuous variables were analyzed by receiver operating characteristic curve.The nomogram models were constructed with R studio.
Research results
According to the postoperative pathology report,there were 89 and 370 patients in the pT1N2-3 group and pT3N0 group,respectively.There was no statistically significant difference in OS between the pT1N2-3 and pT3N0 groups(P= 0.374).Prealbumin(P= 0.040),carcino-embryonic antigen(CEA)(P=0.021),and metastatic lymph node ratio(mLNR)(P= 0.035)were independent risk factors for prognosis in the pT1N2-3b group.Age(P= 0.039),body mass index(BMI)(P= 0.002),and gastrectomy(P< 0.001)were independent risk factors for prognosis in the pT3N0 group.The area under the curve values of the nomogram models predicting the 5-year prognosis of the pT1N2-3 group and pT3N0 group were 0.765 and 0.699,respectively.
Research conclusions
The nomogram model based on peripheral blood biomarkers and clinicopathological features,including prealbumin,CEA,and mLNR,can be used to predict the prognosis of pT1N2-3 GC patients.Age,BMI,and gastrectomy can be used to predict the prognosis of pT3N0 GC patients.
Research perspectives
Further multicentric studies are needed to expand the sample size and external validation of the nomogram models will be performed to determine their predictive ability.
FOOTNOTES
Author contributions:Wang YF and Yin X designed and conceived this study,and they contributed equally to this work;Wang YF,Yin X,Fang TY,and Wang YM interpreted and analyzed the data;Xue YW revised the manuscript for important intellectual content;Wang YF,Yin X,Fang TY,Wang YM,Zhang DX,Zhang Y,Wang XB,and Wang H participated in the patient information collection;all authors read and approved the final manuscript.
Supported byNn10 Program of Harbin Medical University Cancer Hospital,China,No.Nn10 PY 2017-03.
lnstitutional review board statement:The study was approved by the Ethics Committee of the Affiliated Tumor Hospital of Harbin Medical University.
lnformed consent statement:All study participants or their legal guardian provided informed written consent about personal and medical data collection prior to study enrolment.
Conflict-of-interest statement:All the authors have no conflict of interest related to the manuscript.
Data sharing statement:Patients’ data were saved in the Gastric Cancer Information Management System v1.2 of Harbin Medical University Cancer Hospital(Copyright No.2013SR087424,http//:www.sgihmu.com).
Open-Access:This article is an open-access article that was selected by an in-house editor and fully peer-reviewed by external reviewers.It is distributed in accordance with the Creative Commons Attribution NonCommercial(CC BYNC 4.0)license,which permits others to distribute,remix,adapt,build upon this work non-commercially,and license their derivative works on different terms,provided the original work is properly cited and the use is noncommercial.See:http://creativecommons.org/Licenses/by-nc/4.0/
Country/Territory of origin:China
ORClD number:Yu-Fei Wang 0000-0002-1410-2716;Xin Yin 0000-0003-3587-371X;Tian-Yi Fang 0000-0002-5015-4898;Yi-Min Wang 0000-0002-9824-4097;Dao-Xu Zhang 0000-0002-2202-7437;Yao Zhang 0000-0002-3405-570X;Xi-Bo Wang 0000-0002-4141-8134;Hao Wang 0000-0003-4909-8937;Ying-Wei Xue 0000-0003-4525-8163.
S-Editor:Gong ZM
L-Editor:Wang TQ
P-Editor:Wu RR
杂志排行

World Journal of Gastrointestinal Surgery的其它文章
- Surgery for Cronkhite-Canada syndrome complicated with intussusception:A case report and review of literature
- Status of bariatric endoscopy–what does the surgeon need to know?A review
- lmpact of parenchyma-preserving surgical methods on treating patients with solid pseudopapillary neoplasms:A retrospective study with a large sample size
- Laparoscopic vs open total gastrectomy for advanced gastric cancer following neoadjuvant therapy:A propensity score matching analysis
- Choledocholithiasis characteristics with periampullary diverticulum and endoscopic retrograde cholangiopancreatography procedures:Comparison between two centers from Lanzhou and Kyoto
- Long-term outcomes of postgastrectomy syndrome after total laparoscopic distal gastrectomy using the augmented rectangle technique