Middle Jurassic climate oscillations from paleosol records of the Sichuan Basin,SW China
2022-03-25JunLiChengMinHuangGuoLinYangYuanYuanPanXingYueWen
Jun Li , Cheng-Min Huang , Guo-Lin Yang ,Yuan-Yuan Pan , Xing-Yue Wen
a College of Urban Environment, Lanzhou City University, Lanzhou 730070, Gansu Province, China
b Department of Environmental Science and Engineering, Sichuan University, Chengdu 610065, Sichuan Province, China
c BaiLie School of Petroleum Engineering, Lanzhou City University, Lanzhou 730070, Gansu Province, China
d School of Environmental Science and Engineering, China West Normal University, Nanchong 637002,Sichuan Province, China
Abstract The Middle Jurassic is characterized by major plate tectonic changes, variable atmospheric CO2 concentrations (pCO2), and climate oscillations in both marine and terrestrial realms. However, the limited evidence from the terrestrial sedimentary records hampers a comprehensive understanding of global climate state in this period. Well-exposed strata of the Shaximiao Formation in the Sichuan Basin, Southwest China,preserve successions of paleosols that offer the possibility of evaluating the terrestrial paleoclimatic changes during the Middle Jurassic (Bajocian to Callovian). A total of 151 paleosol profiles belonging to four paleosol types (Entisol-like, Inceptisol-like, Aridisol-like and argillic Inceptisol-like paleosols) were identified and characterized. The quantitative paleoclimate reconstructions based on the bulk geochemistry of paleosol horizons and depths of carbonate nodules indicate a generally semiarid-subhumid climate alternating with arid-humid and cool/warm-temperate climates during this time interval.This dynamic climate terminated in a dry,subhumid,humid/perhumid and superhumid moisture regime characterized by steppe/wet or rain forest floral provinces. We suggest that these climatic fluctuations may have been related to global geodynamic(e.g., the fragmentation of Pangea, “megamonsoonal” circulation, and bolide impacts) and regional tectonic uplift(e.g.,the uplift of the Longmenshan Mountains in the South China Block)during the Middle Jurassic.The pCO2 estimates suggest relatively low pCO2 levels within the range of~100 ppm-~890 ppm during the Bajocian to Callovian.Our results coincide with the threshold for the initiation of glaciation and may help to explain the occurrence of cool intervals in the generally warm Jurassic. These pCO2 fluctuations, which coincide with paleotemperature variations in the low paleolatitudes of the Northern Hemisphere, are possibly attributable to global geological events (e.g., wildfire events, eustatic sea-level oscillations, and the transient development of glaciations) in the Middle Jurassic.
Keywords Paleosols,Paleoprecipitation,Paleotemperature,Paleoatmospheric CO2,Shaximiao Formation,Bajocian-Callovian
1.Introduction
Understanding the Earth's past climatic conditions,particularly those that occurred on continents, is of paramount significance for studying the evolution of Earth's surface system in the deep geological past and for anticipating climate scenarios in the future (NRC,2011; Tierney et al., 2020). The Middle Jurassic Epoch (174.1-163.5 Ma), which lasted for approximately 10 million years, was characterized by a disturbed Jurassic interval and an important geological change in the Earth history (Dera et al., 2011). Abundant and diverse terrestrial vertebrate fauna (e.g.,dinosaurs;Li et al.,2011;Xu et al.,2018),major plate tectonic changes (e.g., the fragmentation of Pangea;Bartolini and Larson, 2001; Martini and Ortega-Guti′errez, 2018), large-scale geological and oceanic events (e.g., the widening and deepening of the Hispanic Corridor, and bolide impacts; Labails et al.,2010; Dera et al., 2015; Scotese et al., 2021), and warm background greenhouse climate states(Sellwood and Valdes, 2008; Holz, 2015) make this period a potential analog for future world.
Although Jurassic climates have been generally described as equable and warm“greenhouse”models representing a non-icehouse world associated with high atmospheric CO2concentrations(pCO2)(Hallam,1993; Sellwood et al., 2000; Sellwood and Valdes,2006, 2008; Holz, 2015), this traditional view has been increasingly challenged by the occurrence of a“cool mode” or the transient development of icehouse conditions, coupled with low pCO2, leading to changeable and oscillating climates in the Middle Jurassic(e.g.,Price,1999;Dromart et al.,2003;Dera et al., 2011; Korte et al., 2015; Alberti et al., 2020;Bodin et al.,2020).Notably,the finding of“icehouse”episodes or “cool modes” and low levels of pCO2during the Middle Jurassic concomitant with major global geological events(Dromart et al.,2003;Royer,2006;Bodin et al.,2017,2020;Krencker et al.,2019;Scotese et al., 2021) adds further interest to the study of this time interval, including the “Callovian Ice Age” ascribed to a drawdown in pCO2(Dromart et al., 2003), global cooling related to bolide impact events (Scotese et al., 2021), and correlations between pCO2changes and global sea-level oscillations (Bodin et al., 2020). Unfortunately, our knowledge of Earth's state during this period has mostly come from marine records (Dera et al., 2011; Korte et al., 2015; Alberti et al., 2020). For example, the Middle Jurassic (~174 Ma) seawater temperatures in mid-latitudes was cool to as much as 10°C in the north-south Laurasian Seaway and the cooling coincided with a large-scale volcanic event called the North Sea Dome which prevented the oceanic current and associated heat that it carried from the equator towards the North Pole region (Korte et al., 2015).Research focusing on terrestrial records or proxies is still relatively sparse for this time interval. Therefore, obtaining a detailed and precise paleoclimatic reconstruction from the continental record is of prime importance for promoting a better understanding of Middle Jurassic climate change.
Paleosols,formed at the surface of the Earth in the past, have been widely employed to quantitatively reconstruct paleoclimatic and paleoenvironmental conditions (e.g., Retallack, 2001; Sheldon and Tabor,2009; Tabor and Myers, 2015; Tanner and Lucas,2017; Beverly et al., 2018 and references therein),such as paleoprecipitation and paleotemperatures(e.g., Li et al., 2016; Delgado et al., 2021), paleoatmospheric pCO2and O2concentrations (e.g., Huang et al., 2012, 2013; Sheldon et al., 2021), paleohumidities and paleolandscapes (e.g., Gulbranson et al., 2011; Thornburg et al., 2019), as well as paleoelevations or paleoaltitude(e.g.,Quade et al.,2007;Hyland and Sheldon, 2016), by applying empirical relationships based on comparisons with modern soil analogs. Moreover, the paleopedological reconstruction of paleosols can also contribute to interpreting“paleo-Critical Zones” (e.g., Nordt et al., 2012;Ashley, 2020) and the depositional processes or other geological events that occurred throughout geologic time (e.g., Retallack and Huang, 2011; Driese et al.,2018; Li et al., 2020a). In China, studies focused on deep-time paleosols were conducted mainly in the Cretaceous Sichuan Basin and Songliao Basin (Huang et al., 2012; Gao et al., 2015, 2021; Li et al., 2016,2020b; Zhang et al., 2020a). In addition, paleosol morphologies and the stable isotope geochemistry of pedogenic carbonates have been used to reveal paleoenvironmental and paleoclimatic conditions of the Late Devonian Northwest China and the Early Jurassic Sichuan Basin (Guo et al., 2019; Li et al.,2020c).
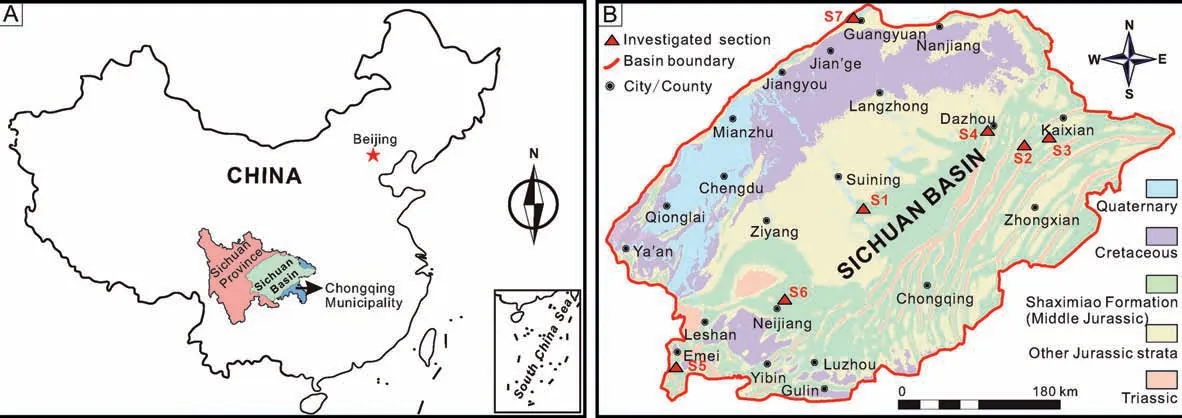
Fig.1 Location and geological maps of the Sichuan Basin,Southwest China.A)Sketch map of China(modified after http://bzdt.ch.mnr.gov.cn (maps No. GS(2016)1603 and No. GS(2016)2884) showing the location of Sichuan Basin in China; B) Geological map of the Sichuan Basin(modified from BGMRSP, 1991) illustrating the distribution of Shaximiao Formation and the location of investigated sections (S1-S7).
The Sichuan Basin is a large intracratonic basin located in Southwest China.The Shaximiao Formation,containing fluvial-lacustrine deposits of Middle Jurassic age(Wang et al.,2010;Li et al.,2011),crops out extensively within the Sichuan Basin (BGMRSP,1991; Wang et al., 2010). Although the Shaximiao Formation is well known for its various and wellpreserved vertebrate faunal fossils, particularly dinosaurs (Chen et al., 2006; Li et al., 2011; Tan et al.,2019), the terrestrial deposits of this formation yield a wealth of well-developed paleosols, providing excellent keys that can be used to evaluate terrestrial paleoclimatic signal responses to environmental perturbations during the Middle Jurassic.
Here,we focus on detailed field investigations and descriptions of paleosol profiles from well-exposed outcrops of the Middle Jurassic (Bajocian to Callovian) Shaximiao Formation in the Sichuan Basin,Southwest China, along with their geochemistry and micromorphologies; further, we employ quantitative paleoprecipitation, paleotemperature, and paleohumidity data using multiple paleosol-based proxies,paleoatmospheric CO2concentration data based on a paleosol CO2barometer, and published pCO2data to provide important insights into the analyses of atmospheric-climatic conditions that prevailed in the low-paleolatitude areas of the Northern Hemisphere during this time interval. Therefore, the aims of this study are to (1) quantitatively reconstruct the Middle Jurassic paleoclimate of the Sichuan Basin and (2)identify the relationships that existed between CO2-climate coupling and global geological events during the Middle Jurassic.
2.Geological setting and stratigraphy
The Sichuan Basin is a large rhomboid-shaped continental sedimentary basin situated in the eastern part of Sichuan Province and the western part of Chongqing Municipality in Southwest China (Fig. 1A;BGMRSP, 1991; Wang et al., 2010). The basin extends from northeast to southwest over an area of more than 180,000 km2(Fig. 1B) and comprises often red-bed or gray-bed continental strata of alluvial-lacustrine origin (BGMRSP, 1991; Wang et al.,2010).
The Middle Jurassic strata are well developed in the Sichuan Basin (Fig. 1B) and are subdivided into the Shaximiao and Xintiangou formations in a descending order (Fig. 2; BGMRSP, 1991; Wang et al., 2010).Generally, the Shaximiao Formation, unconformably overlying the Xintiangou Formation, consists predominantly of purplish-red mudstones,sandy mudstones and siltstones interbedded with yellow-gray sandstones,and is in turn conformably overlain by the Suining Formation of Upper Jurassic (Fig. 2). The Shaximiao Formation is also divided into two members by Estheria fossils, that is, the Lower Shaximiao and Upper Shaximiao members(Fig.2).The Upper Shaximiao member shows more conspicuous cyclicity of sedimentation than the lower member, expressed by alternating violetpurple mudstones with calcareous concretions and yellow-gray feldspar-quartz sandstones. The Lower Shaximiao member is made up of gray and greyishgreen or yellow medium-bedded to massive feldsparquartz sandstones, feldspar sandstones, reddishbrown siltstones and mudstones. The sedimentary environment of the Shaximiao Formation is identified as a shallow lake or meandering river environment according to their lithologic characteristics (Wang et al.,2010).

Fig.2 A)Upper and Middle Jurassic stratigraphical framework of the Sichuan Basin(A)(modified from BGMRSP,1991 and Wang et al.,2010),marked with the relative positions that the field photographs of B-E possibly occur;B)Shaximiao Formation in Suining.The person is~165 cm tall;C)Shaximiao Formation in Dazhou.The hammer is~28 cm long;D)Shaximiao Formation in Neijiang;the person in the upper-middle and middle parts were ~160 cm and ~165 cm tall, respectively; E) Shaximiao Formation in Dazhou; F) Root traces (paleosol KJJS40, Dazhou section); The hammer is ~28 cm long; G) Calcareous nodules (yellow arrows) (paleosol NJSXM14, Neijiang section); the lens cap is 6 cm in diameter for scale. Abbreviations: Fm = Formation; SYS = System; LOC = Location; Lith = Lithology; ss = Sandstone; mdst = Mudstone.
The age of the entire Shaximiao Formation has been estimated by means of many biostratigraphical indicators,such as bivalve,Estheria species,ostracod,spore/pollen,invertebrate,dinosaur,and plant fossils,that assigned a Bajocian-Callovian age to the formation (CGCMSPSBC, 1982; Lucas, 2001; Peng et al.,2005; Chen et al., 2006; Wang et al., 2010; Li et al.,2011); however, a recent study (Wang et al., 2018)suggested a basal Late Jurassic (Oxfordian) age based on detrital zircon dating of Lower Shaximiao sandstones.From the perspective of sequence stratigraphy,the Shaximiao Formation is certainly younger than the underlying Xintiangou Formation,which is regarded as early Middle Jurassic in age based on its palynological assemblages(Classopollis-Cyathidites-Callialasporites)and Euestheria characteristics (Wang et al., 2010).Recently, a preliminary age range of 180-170 Ma obtained via detrital zircon U-Pb dating suggested that the Xintiangou Formation corresponds to the Toarcian-Aalenian age (late Early to early Middle Jurassic) (Li et al., 2021). Therefore, the overlying Shaximiao Formation is not older than 170 Ma.
3.Materials and methods
3.1. Fieldwork
A total of 151 paleosol profiles were identified throughout the Middle Jurassic Shaximiao Formation of the Sichuan Basin according to their macroscopic diagnostic indicators (e.g., development of soil structures and horizons, evidence of root traces, and presence of textural variations) and bioturbation characteristics (Retallack, 2001). Detailed field descriptions of paleosol profiles were conducted based on the guidelines outlined in Retallack (2001) and Schoeneberger et al. (2012) as well as Tabor et al.(2017). The paleosol colors were assessed using the Munsell color classification (Munsell Color Co, 2000).Representative matrix samples and pedogenic calcite were collected from individual profiles. For each representative profile, bulk samples were taken for geochemical analyses from the uppermost B horizon(i.e., the zone of accumulation), while undisturbed,oriented thin-section samples of key features were collected for micromorphological observations. Paleosols classification was carried out based on the comparison with the approaches of USDA Soil Taxonomy(Soil Survey Staff, 2015), the modified classification system of paleosols (Retallack et al., 1993) and paleosol classification scheme (Mack et al., 1993).
3.2. Laboratory work
In this study, thirty-eight representative paleosol profiles were selected, from where samples are collected for the measurements and analyses,including 44 thin sections, 71 geochemical analyses(i.e., element abundances) of bulk paleosol samples taken by horizon, 90 carbon and oxygen isotope analyses of calcareous nodules collected from the Bk(accumulation of carbonate) horizon of the sampled paleosols, and 12 carbon isotope determinations of organic matter in bulk paleosol samples from the A(accumulation of humified organic matter) horizon.
Whole-rock element analyses were performed using X-ray fluorescence spectrometry (PW2403 X,Holland) at the Key Laboratory of West China's Environmental System at Lanzhou University, China. The thin sections were examined using standard petrographic techniques under a Nikon Eclipse plane/polarized optical microscope. The recording of micromorphological descriptions and the analyses followed the methods described in Stoops (2020).
The carbonate nodules were cut and made thin slices to identify micritic calcite for further analysis(Koch, 1998). The nodule samples were then drilled and analyzed for carbon and oxygen isotopes using a Thermo Scientific MAT 253 isotope ratio mass spectrometer at Nanjing Institute of Geology and Paleontology, Chinese Academy of Sciences, China. The standard deviations of the analyses were ±0.02‰ for carbon and ±0.05‰ for oxygen. The stable carbon isotope ratios in the organic matter preserved in the paleosols close to the soil surfaces were measured at Lanzhou Institute of Geology, Chinese Academy of Sciences, China, using a MAT 253 mass spectrometer.All sampled carbon isotope data were reported in per mil(‰)on the Vienna Pee Dee Belemnite(VPDB)scale,and the typical reproducibility of analytical replicates of the same sample was better than 0.2‰.
3.3. Weathering indices
Molecular weathering ratios, calculated by the compositions of major and minor elements in paleosols,were used to identify the main pedogenic process and reconstruct regional paleoclimate and paleoenvironment (e.g., paleoprecipitation, paleotemperature, and humidity province) (Sheldon and Tabor,2009; Gulbranson et al., 2011; Gallagher and Sheldon, 2013; Lizzoli et al., 2021). The proxies for the pedogenic alteration used in this study included clayeyness (Clayeyness = Al/Si; Ruxton, 1968), hydrolysis(ΣBases/Al=(Ca+Mg+K+Na)/Al;Ruxton,1968),paleosol weathering index (PWI = 100 × [(4.20 × Na) +(1.66 × Mg) + (5.54 × K) + (2.05 × Ca)]; Gallagher and Sheldon, 2013), chemical index of alteration minus potassium index (CIA-K = 100 × [Al/(Ca + Al + Na)];Maynard,1992),and leaching index(Leaching=Ba/Sr;Retallack, 2001). In addition, the chemical index of alteration (CIA = 100 × [(Al)/(Al + Ca + Na + K)];Maynard, 1992), salinization (SAL = (Na + K)/Al;Retallack,2001),PWI,and CIA-K indices were used for estimation of floral humidity province, mean annual precipitation (MAP), and mean annual temperature(MAT).
3.4. Pedotransfer functions and proxies for terrestrial paleoclimate reconstructions
3.4.1. Floral humidity province reconstruction
The floral humidity province (i.e., floral regime and effective moisture regime) was estimated using MAP proxies and estimated evapotranspiration (ET;calibrated from modern soils) based on the approach of Gulbranson et al. (2011). The evapotranspiration(ET) was calculated based on the relationship between the MAP and effective precipitation (P-eff),where ET = MAP−P-eff, and P-eff= 0.9075(MAP)−21.43.The MAP was estimated using the CIA-K proxy of Sheldon et al. (2002). The floral humidity province, a tool that uses the relationship between the MAP and ET, allows a paleosol to be plotted in a diagram showing ET versus the energy derived from precipitation (EPPT) (Gulbranson et al., 2011). The energy influx from precipitation(EPPT),termed EPPT=ENPP[1/(1−%EPPT)−1], was utilized in this study, where ENPP= −1.943(CIA)2+352.4(CIA)+28197. The CIA index was applied in the calculations to determine theenergy derived from net primary productivity(ENPP)in the 33°N region (Gulbranson et al., 2011), near which the Jurassic Sichuan Basin(paleolatitude,20°N-30°N)was located (Singsoupho et al., 2014). The values used for the energy derived from precipitation(%EPPT)were selected from Gulbranson et al. (2011, their table 2) according to the paleosol morphological classifications.
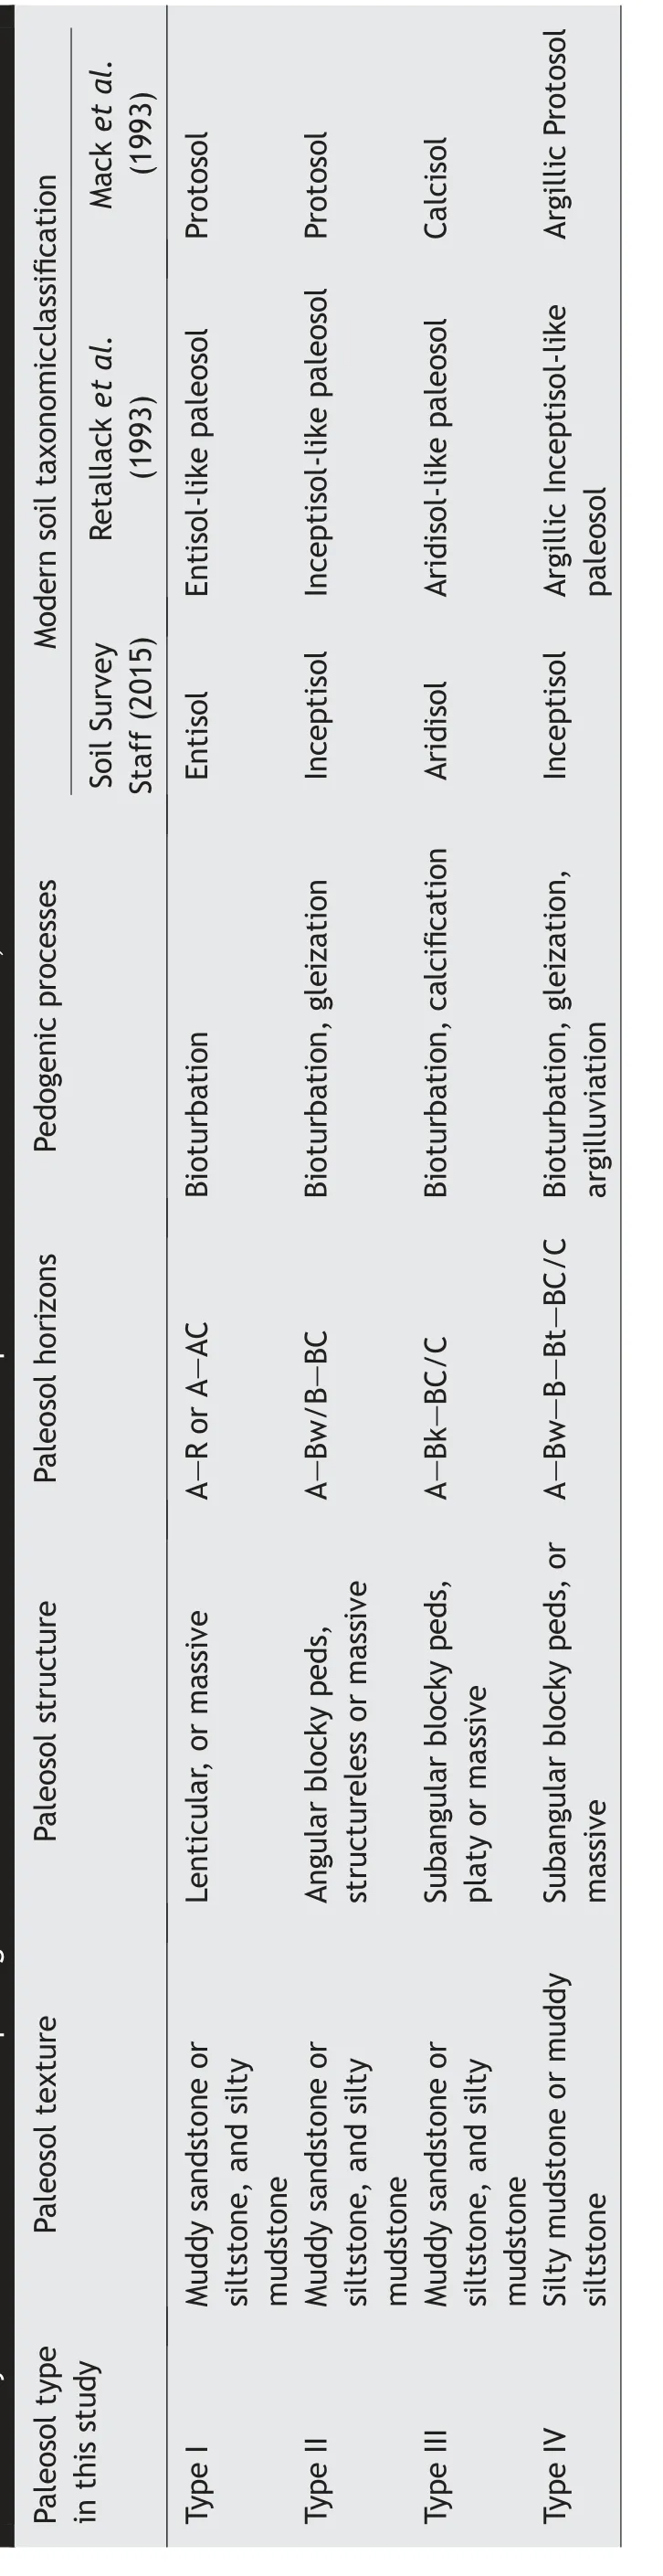
Table 1 Synthesis of the macromorphological characteristics of Shaximiao Formation paleosols in the Sichuan Basin, SW China.
3.4.2. Mean annual precipitation reconstruction
Two suites of climofunctions related to the depths of pedogenic carbonates below a paleosol surface and the weathering indices of a Bw/Bt horizon were used to reconstruct the MAP values in this study. Following the protocol of Sheldon and Tabor (2009), the factors that must be applied to determine the relationship of the MAP to paleosols include appropriate paleosol types(i.e.,not Vertisols),specific horizons(e.g.,Bw or Bt horizons), erosion of the paleosols prior to burial,burial history (i.e., decompacted values) of the paleosols, and the paleosol-forming geomorphic setting(i.e., lowlands).
One method used to obtain MAP reconstructions involves the relationship between the MAP and the depth to calcareous nodules, as proposed by Retallack(2005); this relationship is defined as MAP = 137.24 +6.45D−0.013D2(R2= 0.52, standard error = ±147 mm/yr). In this equation, D (in cm) refers to the original depth to the pedogenic carbonates in decompaction of the paleosols(Sheldon and Retallack,2001).The other method used to estimate the MAP in this study involves the relationship between the MAP and the chemical index of weathering (CIA-K; Maynard, 1992), which was developed by Sheldon et al. (2002) and is expressed as MAP = 221.1e0.0197(CIA-K)(R2= 0.72,standard error = ±182 mm/yr). This climofunction was designed for application to B horizons with CIA-K values at least 5 units greater than those of the associated C horizons (i.e., unaltered or unconsolidated parent material).
3.4.3. Mean annual temperature reconstruction
Two different proxies, that is, salinization and the paleosol weathering index, were applied to obtain more precise and robust MAT estimates. The first MAT calculation involved the salinization (SAL) transfer function and was defined as MAT = −18.5SAL+17.3(R2= 0.37, standard error = ±4.4°C). The salinization proxy is applicable to most paleosol orders with B horizons over the temperature range of 8-22°C(Sheldon et al., 2002).
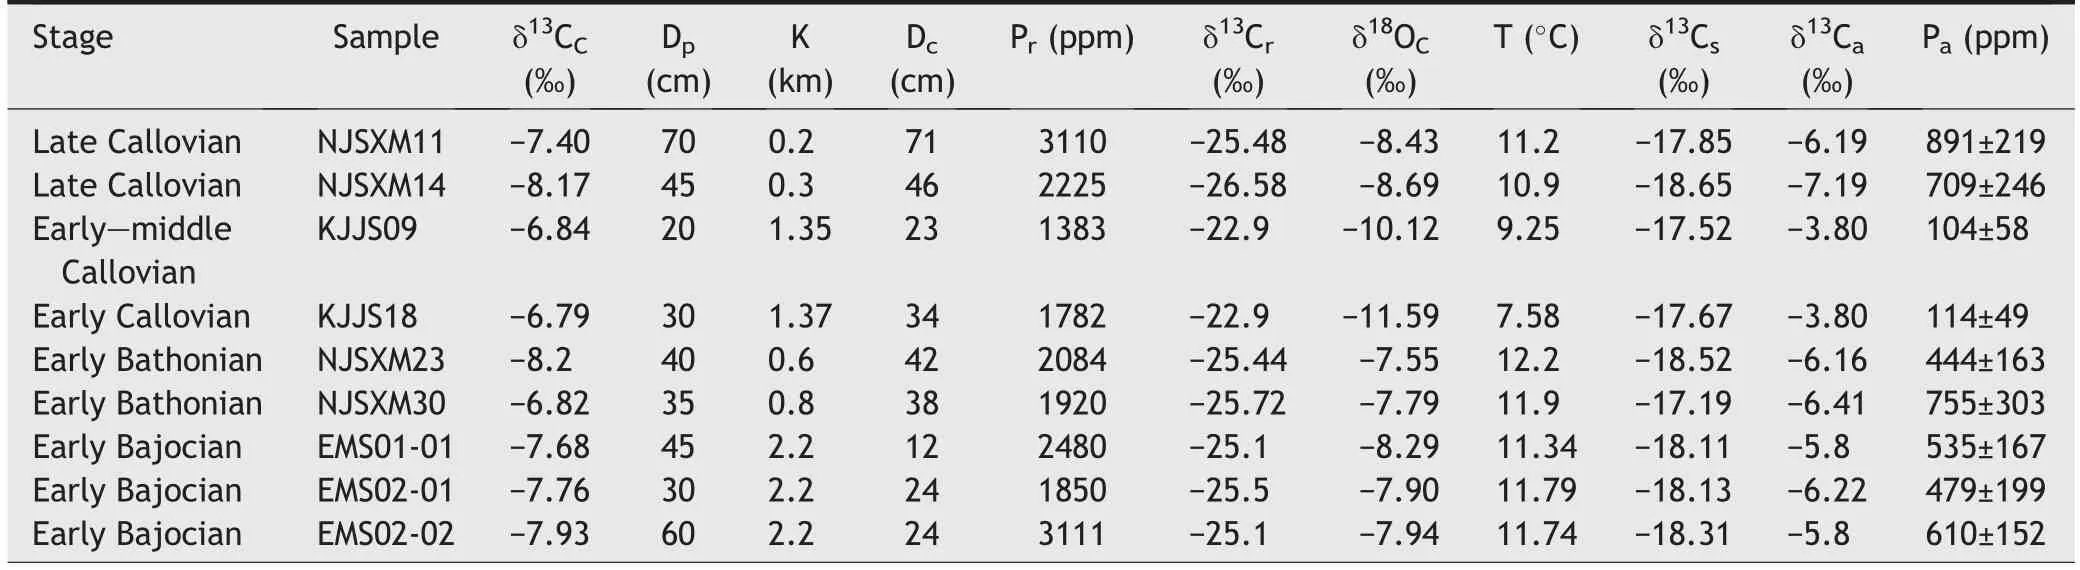
Table 2 The Middle Jurassic pCO2 levels estimated from paleosol-bearing carbonates in the Shaximiao Formation of the Sichuan Basin.δ13Cs, δ13Cr, δ13Ca, δ13Cc: Stable carbon isotopic compositions of soil CO2, soil-respired CO2, atmospheric CO2, and pedogenic carbonate,respectively; Dp: Depth to pedogenic nodules; Dc: Original depth to pedogenic carbonate in the decompaction of paleosols; K: Burial depth of paleosols; δ18Oc: Stable oxygen isotopic composition of pedogenic carbonate; Pr: Partial pressure of respired CO2 in soil; T: Temperature;Pa: Atmospheric CO2.
The second MAT proxy was the paleosol weathering index(PWI)paleothermometer proposed by Gallagher and Sheldon (2013), which is expressed as MAT = −2.74ln(PWI)+21.39 (R2= 0.57, standard error = ±2.1°C). This MAT estimation has an effective temperature range of 6-23°C.It is applicable for the B horizons of well-drained forest soils such as paleo-Inceptisols, paleo-Alfisols and paleo-Ultisols and is not used for paleosols with PWIs over 60(Gallagher and Sheldon,2013).
3.4.4. Paleoatmospheric CO2reconstruction
Paleoatmospheric CO2was estimated using a pedogenic CO2paleobarometer, a method that was developed by Cerling (1991) and reformulated by Ekart et al. (1999) and is defined as CO2(atm)=S(z)[(δ13Cs−1.0044δ13Cr−4.4)/(δ13Ca−δ13Cs)], where S(z)refers to the CO2contributed by soil respiration and δ13Cs, δ13Cr, and δ13Caare the stable carbon isotopic compositions of soil CO2, soil-respired CO2, and atmospheric CO2, respectively. The S(z)value is calculated from the relationship between the original depth to the calcic horizon and the top of the paleosol profile(Breecker and Retallack, 2014) and is corrected for compaction in paleosols following the equation of Retallack (2009a). The δ13Csvalue is estimated from the isotopic composition of paleosol-calcite nodules using the temperature-dependent fractionation equation(Romanek et al.,1992),and the δ13Crvalue is presumably equivalent to the measured δ13Corgvalue of organic carbon preserved in the A horizon(i.e.,the zone of leaching)of the paleosol profile(Cerling,1991;Breecker et al.,2015).Finally,the last calculation was that of the δ13Caproxy which was conducted based on the equation of Arens et al. (2000), where δ13Ca=(δ13Cr+18.67)/1.10 with a standard error of±0.4‰.
4.Results
4.1. Paleosols of the Shaximiao Formation
In total, 151 paleosol profiles were examined across five areas of the Sichuan Basin(Figs.1-3),i.e.,14 in Suining area,20 in Guangyuan area,74 in Dazhou area, 4 in Emei area, and 39 in Neijiang area, respectively (Fig. 3). These paleosols were classified as four major types(Type I-IV)based on macromorphological field-based observations (i.e., root traces, soil horizons, and soil structures) (Table 1), together with laboratory analyses (i.e., micromorphological information and major element concentrations of the paleosol matrix)and allowed for the reconstruction of paleoclimatic conditions in the study areas.
4.2. Macro- and micromorphological characteristics
4.2.1. Type I paleosols: Entisol-like paleosols or Protosols
This type of paleosols, accounting for 42% of the identified paleosols of the studied areas, has a thickness of 15-30 cm and commonly occurs as sequences of A-R or A-AC horizons(Table 1;Fig.4A and B).The paleosol texture is constituted of muddy sandstone or siltstone and silty mudstone.
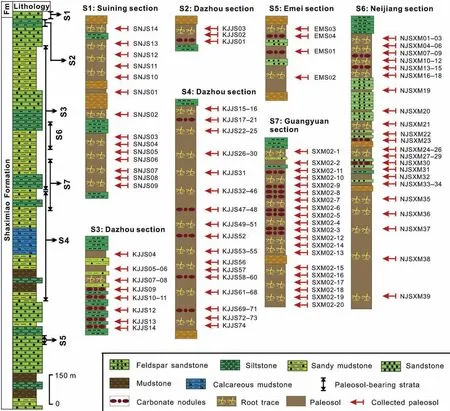
Fig.3 Paleosol profiles of the Shaximiao Formation in the Sichuan Basin(modified after Gu and Liu,1997,and Wang et al.,2010)showing the lithologies, stratigraphic distributions and the 151 paleosol profiles locations in the studied sections.S1-S7: Studied sections (see Fig. 1 for their location in Sichuan Basin). These sections are correlated to the lithological column according to their sequence-stratigraphic relationships (BGMRSP, 1991; Wang et al., 2010). Abbreviations: Fm = Formation.
The A horizons, varying from 3 cm to 5 cm in thickness, are thin and light greenish-gray (GLEY 1 5G8/1) to greenish-gray (GLEY 1 5G6/1) in color(Fig. 4A and B). In general, these horizons contain moderately few to common root-related structures that are preserved as light greenish-gray (GLEY 1 10Y7/1) and downward tapering root traces(5-15 mm diameter)(Fig.4A)or drab vermicular and irregular mottles (Fig. 4B), or appear to be horizontally coalesced (Fig. 4A and B), and should be identified as a slightly ochric epipedon. The A horizons generally show coarse sandy loam or fine sandy loam textures, and are dominated by coarse monic c/f(coarse versus fine) related distribution microstructures with a predominance of quartz (Fig. 4C). The boundary with underlying AC or R horizons is abrupt to clear in distinctness and smooth in topography(Fig. 4A and B). In the AC horizons, lenticular or massive soil structures prevail (Fig. 4A and B).Lenticular platy microstructures are between medium and coarse (15-50 mm) and the related distribution pattern (c/f) is concave gefuric (Fig. 4D). The color ranges from weak red (2.5YR5/2) to reddish brown (2.5YR4/3). Bioturbations are few in the R horizons, whereas the AC horizons are penetrated by drab-haloed root traces (Fig. 4A).
Type I paleosols are very weak soils, showing little or slight soil development. The presence of drab irregular mottles and root traces is the only indicator of minimal degree of soil development (Retallack,2001; Tabor et al., 2017). The macromorphological and micromorphological features of type I paleosols suggest that bioturbation is the main pedogenic processes. Therefore, the pedogenic features of type I paleosols, the presence of a thin and/or light-colored epipedon surface horizon, absence of pedogenic structures and other characteristics of any of the other soil orders, and very thin (15-30 cm) soil profile, are equivalent to modern Entisols(Soil Survey Staff,2015),and thus may be interpreted as Entisol-like paleosols(Retallack et al., 1993), or as Protosols in terms of paleosol classification scheme (Mack et al., 1993).

Fig. 4 Representative field photographs and photomicrographs of type I paleosols. A) Paleosol profile with A-AC horizons in Dazhou. The hammer is~28 cm long for scale;B)Paleosol sequences with A-R horizons in Dazhou.The pen is~14 cm long for scale;C)Coarse monic with quartz grains and dispersed organic matter in a surface horizon,single grain microstructure(paleosol KJJS04,Dazhou,plane polarized light);D) Lenticular platy microstructure in the AC horizon (paleosol NJSXM19, Neijiang, plane polarized light).
4.2.2. Type II paleosols:Inceptisol-like paleosols or Protosols
This kind of paleosol, representing 17% of the identified paleosols of the studied areas, consists of a sequence of horizons A-B-BC and is between 20 cm and 90 cm in thickness (Table 1; Figs. 5A-C and 6A).The structures of type II paleosols are constituted of fine-or medium-sized,moderately developed angular blocky peds, and structureless or massive horizons,while the paleosol textures are formed of muddy sandstone or siltstone and silty mudstone.
The A horizons, identified as an ochric epipedon,are greenish gray (GLEY 1 5GY6/1) or light greenish gray (GLEY 1 5GY7/1 or 8/1) in color, and range between 5 cm and 15 cm thick (Figs. 5A-C and 6A).Plenty of bioturbations, consisting of 2-8 mm wide and 5-12 cm long root-shaped traces,occur and a few irregular vughs are also observed within and between A horizons (Figs. 5A-C and 6A). These drab haloed root traces or gray rhizohaloes due to gleization are widespread in paleosols (Figs. 5A-C and 6A). The A horizon of the representative paleosols shows an Al/Si ratio of~0.16,and a ΣBases/Al ratio of~0.61.The PWI value is~37, the CIA-K value is~85, and the leaching value is~2.13(Fig. 6A).
The boundary between A horizon and the underlying Bw or B horizons is very abrupt in distinctness and is smooth to wavy in topography (Figs. 5A-C and 6A).The Bw or B horizons have a thickness of 10-45 cm and display fine-or medium-sized weak-developed angular blocky peds, which in some profiles are massive and structureless (Figs. 5A-C and 6A). They are characterized by color ranging from reddish brown(2.5YR5/3 or 2.5YR5/4),dark reddish-gray(7.5R4/1 or 2.5YR4/1)to dark reddish gray(5YR4/2)(Figs.5A-C and 6A).Few to common root traces with variable diameters(2-5 mm)and lengths(10-25 cm)that are vertical to subvertical, lateral and bifurcating morphologies are present(Fig.5A-C).These bioturbations exhibit form of root pores or channels and chambers in thin sections(Fig. 5D and E). In some occurrences, compressed carbonized root structures (black features) are still visible to the naked eye (Fig. 5A). The geochemistry data shows an Al/Si ratio of~0.17,a ΣBases/Al ratio of~0.61. The PWI value is ~36, the CIA-K value is ~84,and the leaching value is ~2.16(Fig. 6A).
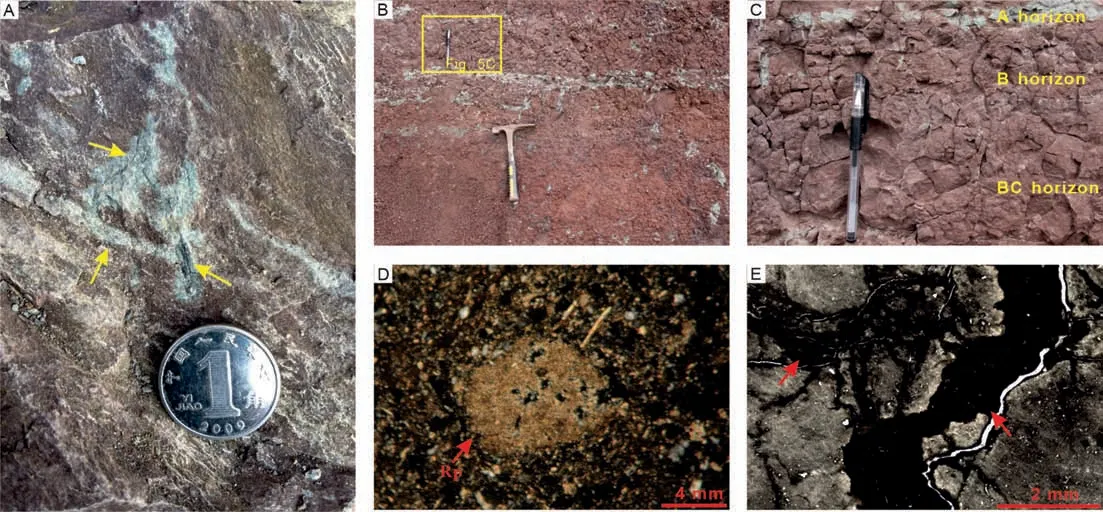
Fig.5 Representative field photographs and photomicrographs of type II paleosols.A)Branching carbonized root structures(yellow arrows)surrounded by gray rhizohaloes. The coin is 1.9 cm in diameter; B) Paleosol sequences in Dazhou section. The hammer is ~28 cm long; C)Paleosol profile with A-B-BC horizons in Dazhou section.The pen is~14 cm long;D)Transverse cross-section of the root pore(Rp,red arrow)in the B horizon (paleosol SNJS13, Suining section, plane polarized light); E) Bioturbation channels and chambers in the B horizon (paleosol NJSXM09, Neijiang section, plane polarized light).
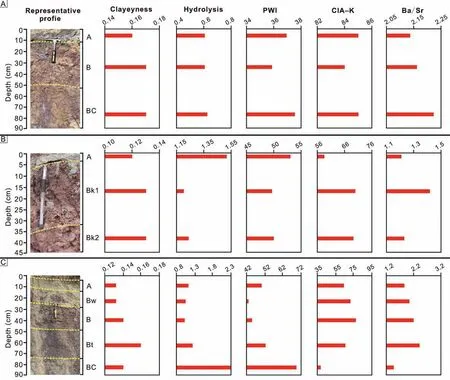
Fig. 6 Selected geochemical weathering ratios of the representative profiles for different types of paleosols. A) Type II paleosols (paleosol SXM02-13, Guangyuan section); B) Type III paleosols (paleosol KJJS69, Dazhou section); C) Type IV paleosols (paleosol NJSXM11, Neijiang section).
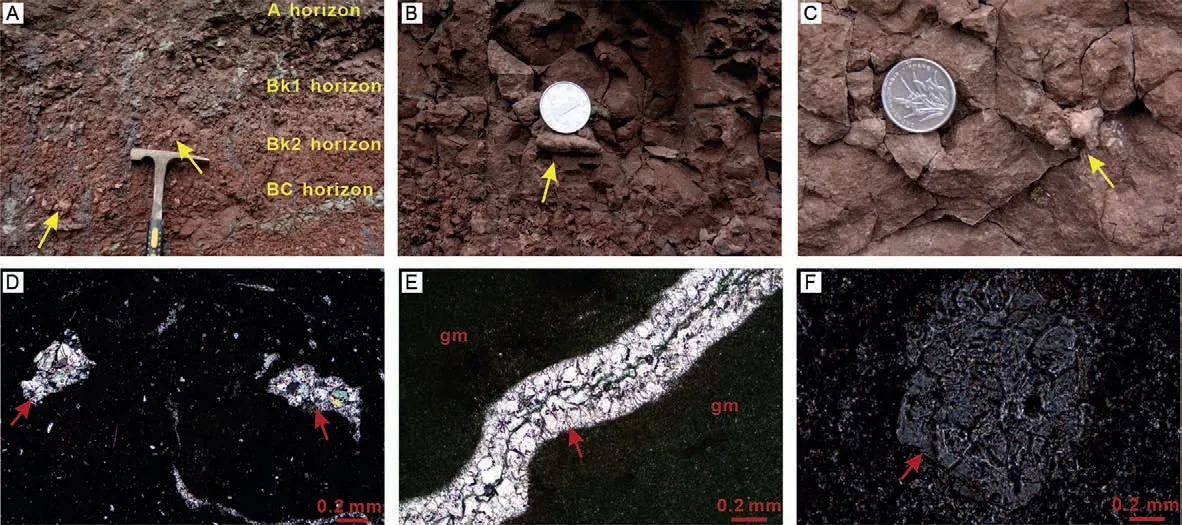
Fig.7 Representative field photographs and photomicrographs of type III paleosols.A)Paleosol profile with abundant and vertically-stacked carbonate nodules (yellow arrows) developing A-Bk-Bc horizons observed in Dazhou section. The hammer is ~28 cm long; B) Calcareous nodules (yellow arrow; paleosol KJJS20, Dazhou section). The coin is 1.9 cm in diameter; C) Calcareous nodules (yellow arrow; paleosol KJJS71, Dazhou section). The coin is 1.9 cm in diameter; D) Microcrystalline calcite (red arrows) in a carbonate nodule (paleosol KJJS13,Dazhou section, cross polarized light); E) Calcitic crystallitic (red arrow) b-fabric in the groundmass (gm) (paleosol KJJS14, Dazhou section,plane polarized light); F) Calcite biospheroid (red arrow) in a carbonate nodule (paleosol EMS02, Emei section, plane polarized light).
The distinctness between Bw or B horizons and the underlying BC horizon is gradual, whereas the topography is smooth (Figs. 5C and 6A). This is a massive horizon with thicknesses of 5-40 cm, and hosted in light yellowish-brown (2.5Y6/3) to reddish brown (2.5YR5/4). Bioturbation in the form of scarce light greenish gray (GLEY 1 10Y7/1) mottles is sparse(Fig. 5B and C). Geochemically, this horizon of the representative paleosol is characterized by an Al/Si ratio of~0.17,and a ΣBases/Al ratio of~0.64.The PWI value is ~37, the CIA-K value is ~85, and the Ba/Sr ratio is ~2.2 (Fig. 6A).
Type II paleosols are thicker and better developed than type I paleosols, and are characterized by incipient development of pedogenic features(e.g.,poorlydeveloped ped structure,root traces or mottles).The main pedogenic horizon (i.e., Bw horizon) has been recognized as cambic horizon that does not present any typical characteristics of other specific subsurface horizons. The moderate ΣBases/Al ratio, PWI and CIA-K values in the B horizon suggest paleosols underwent a moderate degree of chemical weathering,and the moderate Al/Si ratio represents a slightly clayey B horizon.In addition,slight or no variations of the Ba/Sr ratios in the representative profile represent minimal leaching. These pedogenic features observed in type II paleosols are similar to Inceptisols in modern soil taxonomic classification (Soil Survey Staff, 2015),and therefore may be classified as Inceptisol-like paleosols (Retallack et al., 1993), or as Protosols according to Mack et al. (1993) paleosol classification scheme.
4.2.3. Type III paleosols: Aridisol-like paleosols or Calcisols
This type of paleosols, accounting for 32% of the identified paleosols of the studied areas,is made up of a sequence of horizons A-Bk-BC/C (Table 1; Figs. 6B and 7A), and generally between 25 cm and 120 cm thick. The paleosol texture is constituted of muddy sandstone or siltstone and silty mudstone, and shows medium- or coarse-sized angular or subangular blocky peds parting to platy or massive structure.
The A horizons,3-10 cm thick,light greenish-gray(GLEY 1 10Y7/1)or greenish-gray(GLEY 2 10G6/1),are easily recognizable in the field due to the development of abundant, downward-tapering and laterally branching root traces(10-20 cm long and 5-10 mm in diameter), and irregular mottles in these horizons(Figs.6B and 7A).This A horizon may be recognized as an ochric epipedon.These ochric surface horizons are marked by medium-sized, very weakly-developed platy structures that are outlined by laminar muddy sandstone (Fig. 6B) or have fine or medium moderately-developed angular or subangular blocky peds that are formed of silty mudstone (Fig. 7A). The geochemistry for the representative horizon displays an Al/Si ratio of~0.12,and a ΣBases/Al ratio of~1.51.The PWI value is ~54, the CIA-K value is ~58, and the leaching value is ~1.2 (Fig.6B).
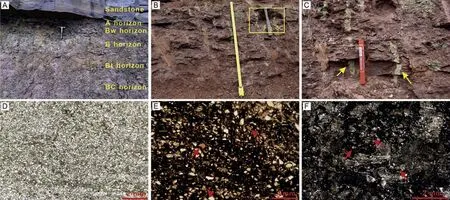
Fig. 8 Representative field photographs and photomicrographs of type IV paleosols. A) Paleosol type IV with gray and yellow mottles truncated sharply by overlying sandstone in Guangyuan section.The hammer is~28 cm long;B)Paleosol type IV with abundant root traces in Suining section;the hammer is~28 cm long;C)Deeply penetrating root traces(yellow arrows).The pen is~14 cm long;D)Single-to doublespaced enaulic c/f related distribution pattern in the A horizon(paleosol NJSXM11,Neijiang section,plane polarized light);E)Bt horizon with yellow-brown fragments of clay coatings (red arrows), organic residues, and single-grain microstructures (paleosol SXM02-13, Guangyuan section, plane polarized light); F) Angular blocky microstructures and fragments of yellowish clay coatings (red arrows) in the Bt horizon(paleosol NJSXM36, Neijiang section, plane polarized light).
The Bk horizons,which gradationally underly the A horizons,vary from 15 cm to 50 cm in thickness and are distinguished by the presence of large quantities of pedogeniccarbonatenoduleswhichhave 10 mm-50 mm in diameter and elliptical or sphericalto-subspherical in shape (Figs. 6B and 7A-C). These calcic carbonate nodules,corresponding to the stage II or III morphology following the proposal of Gile et al.(1966) and Machette (1985), are composed entirely of microcrystalline calcite that exhibits “mottled” or irregular crystal mosaics (Fig. 7D) and are present at shallow levels(<1 m)within some profiles(Figs.6B and 7A).Calcitic pedofeatures are present as complete-toincomplete infills in the groundmasses. The presence of micritic calcite determines a calcitic crystallitic bfabric (Fig. 7E), and calcite biospheroids secreted by earthworms are observed in some cases (Fig.7F).The distinctness of the Bk horizons with the overlying A horizons is smooth and wavy. The Bk horizons are hosted by silty mudstone or muddy siltstone and preserve fine or medium moderately-developed angular or subangular blocky peds (Figs. 6B and 7A-C).
In addition, the Bk horizons in some profiles can also be subdivided into sub-horizons (e.g., Bk1, Bk2,and Bk3) based on the variations in color, the differences in structures, and amounts and morphologic differences in carbonate nodules (Fig. 6B). The color varies from light reddish brown (2.5YR6/3), reddish brown (2.5YR5/4) to dark reddish gray (5R3/1). Bioturbations (i.e., mottling and root traces) are generally decreasing down profile and take the form of root structures that taper and branch horizontally and coalesce laterally(Figs.6B and 7A).The Bk horizon in the representative profile is characterized by a ΣBases/Al ratio ranging between 1.19 and 1.22, with an average of 1.21; and the Al/Si ratio is close to~0.13. The PWI value is between 49 and 50, with an average of 49.5;the CIA-K value is between 72 and 71,with an average of 71.5; and the Ba/Sr value is between 1.44 and 1.27,with an average of 1.36(Fig.6B).
The BC or C horizon is commonly absent,but occurs in several profiles.Once occurs,this horizon,5-50 cm thick,is dominated by dusky red(7.5R3/2)or weak red(2.5YR4/2)color and exhibits massive or structureless structure. No bioturbation is present in the BC or C horizon.
Type III paleosols are soils, commonly exhibiting two specific suborders,that is,an ochric epipedon and a calcic horizon. The macromorphological and micromorphological features of this type of paleosols suggest that calcitic pedofeatures (i.e., subsurface accumulations of calcium carbonate) are the most distinctive characteristics. The low values of PWI and CIA-K represent moderate weathering, while the hydrolysis values are higher than 1, in agreement with interpretation as Aridisols(Dal'B′o et al.,2009).These pedogenic characteristics observed in type III paleosols may be equivalent to modern Aridisols in the USDA scheme(Soil Survey Staff,2015),and consequently can be classified as Aridisol-like paleosols(Retallack et al.,1993),or as Calcisols according to the classification of Mack et al. (1993).
4.2.4. Type IV paleosols: argillic Inceptisol-like paleosols or argillic Protosols
This kind of paleosols, accounting for 9% of the identified paleosols of the studied areas, commonly consists of a sequence of horizons A-Bw-B-Bt-BC/C(Table 1;Figs.6C and 8A-B)and is generally between 70 cm and 220 cm thick. The paleosol texture is constituted of silty mudstone or muddy siltstone, and displays medium- or coarse-sized subangular blocky peds or massive structures (Figs. 6C and 8A-B).
The A horizons, 5-10 cm thick, are light greenish gray (GLEY 1 10Y7/1 or 8/1) in color and have abundant downward-branching or deep tap silt-filled structure root traces (Figs. 6C and 8A-B). Most paleosol profiles contain an A horizon,but in some paleosol profiles, part of this horizon is truncated sharplycontacted by overlying sandstone (Figs. 6C and 8A).Some A horizons are entirely or partially gray-green in paleosols (Figs. 6C and 8A-B), and are attributed to burial gleization of roots and other remnant organic matter. The related distribution pattern is single-to double-spaced enaulic (Fig. 8D). The distinctness with the underlying horizons is clear with smooth topography (Figs. 6C and 8A-B). The underlying horizons (i.e., cambic subsurface (Bw) horizons) are dark reddish gray (5YR4/2) to reddish brown (2.5YR5/3) in color, usually of, 20-25 cm thick. The structure is medium to very coarse subangular blocky peds (Figs.6C and 8A-B). The bioturbation traces are common to a few silt-filled vertically and lateral branching or deep tap root traces(20-50 mm in diameter and more than 200 mm long).
The distinctness of boundary between Bw and B horizons is clear with smooth topography. The B horizons have a thickness of 20-40 cm, and basically consist of medium to coarse subangular blocky peds.The B horizons is weak red (2.5YR4/2), reddish brown(2.5YR5/3) or brown (7.5R4/2) in color, associated with few root traces (Figs. 6C and 8C). The boundary between B and Bt horizons is abrupt to clear in distinctness and is smooth in topography(Figs.6C and 8A-C).The Bt horizons vary in thickness from 20 cm to 40 cm and have the same color as the B horizons. The Bt horizons present fine to medium subangular blocky peds, and are characterized by moderatelybioturbated and mainly light greenish-gray (GLEY 1 5GY7/1) root traces. In thin sections, disseminated organic matter and clay coatings are observed in the Bt horizons(Fig.8E and F).Fragments of yellow-brown or yellowish clay coatings, associated with organic residues, are distributed within the angular blocky microstructures or around the subangular,well-sorted quartz grain groundmasses with coarse monic c/frelated distribution patterns (Fig. 8F). The distinctness of the Bt horizons with underlying BC/C horizons(15-90 cm) is also abrupt to clear with smooth topography. These horizons show fine to coarse lenticular structures, reddish brown (2.5YR5/3) in color, and exhibit no bioturbation (Figs.6C and 8A).
Geochemically,type IV paleosols are characterized by an Al/Si ratio that ranges from 0.13 to 0.16,with an average of 0.14; and a ΣBases/Al ratio ranging between 0. 91 to 2.33, with an average of 1.3. The PWI value is between 49 and 71,with an average of 52;the CIA-K value is between 37 and 77,with an average of 62.8; and the leaching value is between 1.3 and 2.48,with an average of 2.01 (Fig. 6C).
Type IV paleosols usually contain a clay-enriched subsurface (Bt) horizon. In the representative profile(Fig. 6C), the Bt horizon shows an increase in clayeyness ratio,and has a maximal leaching in Ba/Sr ratios.And co-variation in inverse relation is observed between hydrolysis and CIA-K values, indicating the minimal chemical weathering. In addition, the PWI values also suggest moderate weathering conditions.The geochemistry data indicate that they underwent moderate weathering process and increase of clay during soil formation. Macro- and micromorphological features show that argilluviation, gleization, and calcification were the main pedogenic processes for this kind of paleosols.Therefore,type IV paleosols are equivalent to modern Inceptisols (Soil Survey Staff,2015), and accordingly may be classified as argillic Inceptisol-like paleosols (Retallack et al., 1993), and as argillic Protosols according to Mack et al. (1993).
4.3. Reconstruction of floral humidity,paleoprecipitation, and paleotemperature estimates for the Shaximiao Formation paleosols
4.3.1. Floral humidity regimes within the Shaximiao Formation
The paleoflora and paleohumidity province reconstructions obtained from the paleosols collected from the Middle Jurassic Shaximiao Formation using the method of Gulbranson et al. (2011) indicate that these examined paleosols formed under a wide range of effective moisture regimes and floral regimes ranging from superhumid/rain forests to dry subhumid/steppe climates (Figs. 9 and 10D). Several effective moisture fluctuations between superhumid and humid/perhumid moisture regimes accompanying floral shifts from rain forests to wet forests are also revealed by these paleosols (Fig. 9). All these variations in effective moisture and floral regimes suggest that the moisture regimes, along with the floral regimes, were changeable in the study areas during the time of paleosol formation, implying oscillating climate states during paleosol formation.
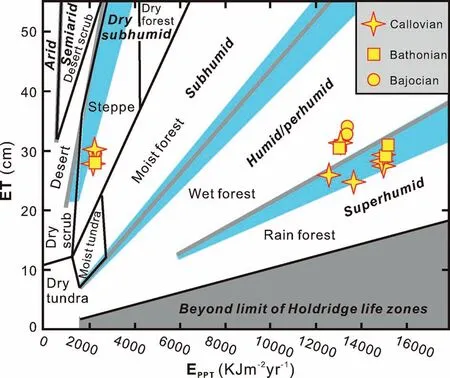
Fig. 9 Paleoflora and paleohumidity province reconstructions for the Middle Jurassic Shaximiao Formation of the Sichuan Basin using the model of Gulbranson et al.(2011).The blue and gray shaded areas correspond to the latitudinal range represented in Gulbranson et al.(2011)and the zone that would exceed the maximum ET/MAP ratio of Holdridge (1947), respectively.
4.3.2. MAP reconstruction for the Shaximiao Formation
The mean annual precipitation (MAP) estimates of Middle Jurassic Sichuan Basin obtained from the Shaximiao Formation paleosols using the CIA-K model ranged from 512±182 mm/yr to 1140±182 mm/yr with an average of 830±182 mm/yr (Fig. 10B), indicating subhumid to humid conditions. These calculated MAP values are systematically higher than the MAP estimates calculated from the depth to carbonate nodules proxy, yielding a fluctuating range between 140±147 mm/yr and 530±147 mm/yr with a relatively low average value of 245±147 mm/yr (Fig. 10B),implying arid, semiarid and subhumid climates.Nonetheless, there was an overall synchronous trend for Bk-depth-based and CIA-K-based estimates of variation (Fig. 10B).
4.3.3. MAT reconstruction for the Shaximiao Formation
The mean annual temperature (MAT) reconstructions obtained from the Shaximiao Formation paleosols in Sichuan Basin using the salinization (SAL)index and PWI proxies showed average values of 10.93±4.4°C and 10.67±2.1°C, respectively. The MAT values estimated based on the SAL index ranged from 9.63±4.4°C to 12.68±4.4°C (Fig. 10C), showing a slightly fluctuating trend, whereas the MAT calculations obtained from the PWI proxy varied within the range between 10.34±2.1°C and 11.94±2.1°C(Fig. 10C), showing a nearly steady pattern. Interestingly, the MAT values obtained from the Shaximiao Formation paleosols of the Sichuan Basin showed little difference when calculated using the two independent proxies (Fig. 10C), suggesting that a cool climate or warm-temperate climate prevailed during the formation of the paleosols.
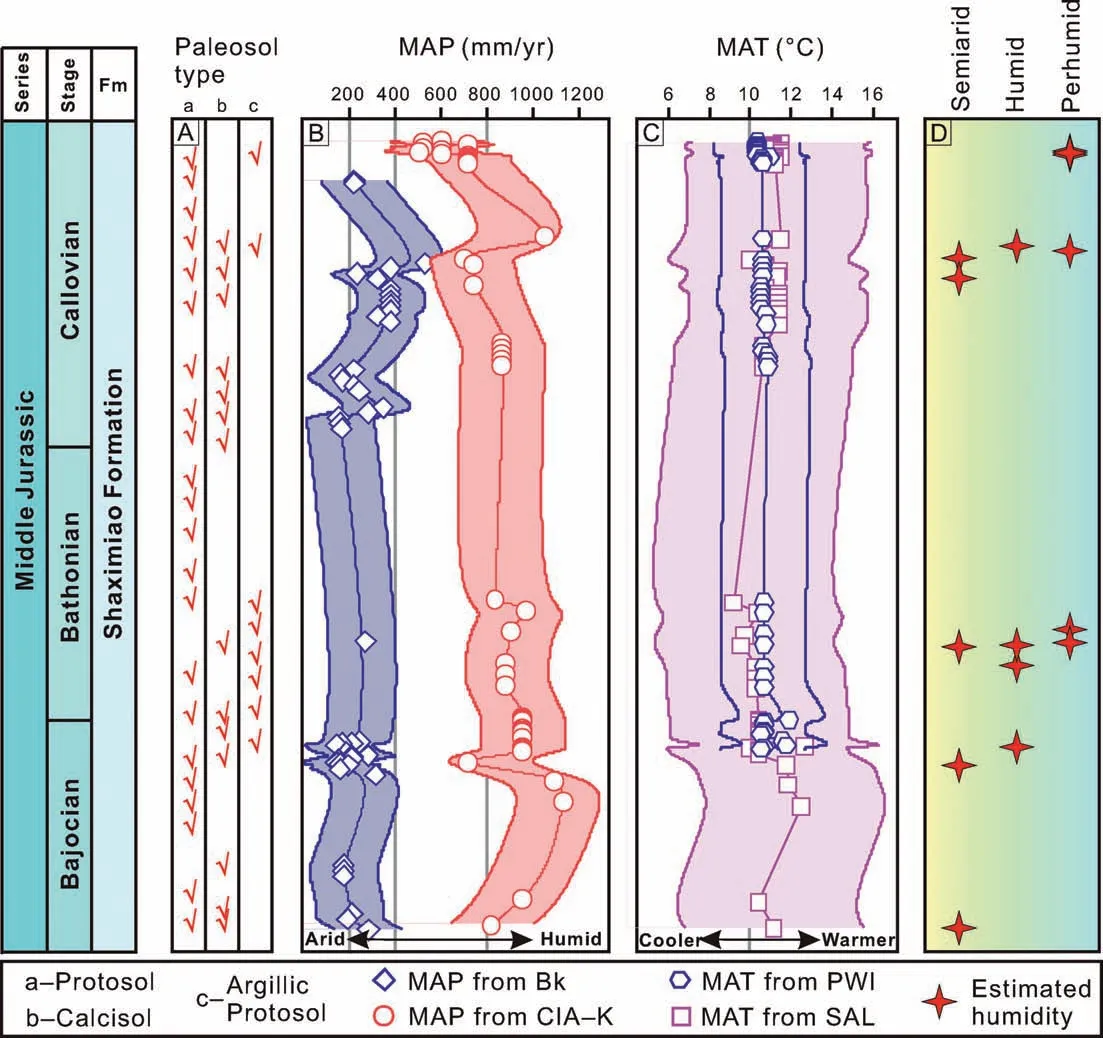
Fig.10 Paleoclimate reconstruction for the Middle Jurassic Sichuan Basin.The shaded area of each curve corresponds to the standard error of each climofunction. A) Distribution of paleosols (check marks) in the Shaximiao Formation; B) The MAP estimated from the paleosols; C)The MAT estimated from the paleosols; D) Estimated humidity values are from Fig. 9 based on the paleosols.
4.3.4. pCO2variations within the Shaximiao Formation
The estimated pCO2levels of the Middle Jurassic Shaximiao Formation pedogenic carbonates obtained using the carbonate isotope-based CO2paleobarometer displayed a low range between ~100 ppm and~890 ppm(Table 2).The calculated pCO2levels in the Early Bajocian yielded small variations between~480 ppm and~535 ppm,while the only two results of the pCO2estimates during the Early Bathonian yielded values of ~444 ppm and ~755 ppm (Table 2). The reconstructed pCO2levels during the Callovian ranged from ~100 ppm to ~890 ppm, showing large variations(Table 2). Interestingly, a minimum pCO2level of~100 ppm was calculated in the middle-late Callovian, whereas a maximum pCO2level of ~890 ppm was estimated in the late Callovian (Table 2).
The largest uncertainty when applying the carbonate isotope-based CO2paleobarometer is the concentration of soil-respired CO2, which is usually often assumed to be ±766 ppm (Breecker and Retallack, 2014). The values of this parameter range from ±49 ppm to ±301 ppm based on Gaussian error propagation in the quadrature (Breecker and Retallack, 2014). Second, temperature estimates with an uncertainty of±4°C can also add uncertainty to the calculation of pCO2in paleosols, which has a minimum range of ±4 ppm and ±37 ppm. Last, the uncertainties resulting from analytic errors, such as carbonate carbon or organic carbon isotopic analyses,contribute very little to the pCO2estimations(Retallack, 2009b; Huang et al., 2013).
5.Interpretations and discussion
5.1. Pedogenic processes and paleoclimate estimates
The paleosols identified in the Shaximiao Formation are characterized by abundant in situ root traces,mottles and carbonate nodules, and distinctive soil horizons. The lower and upper parts of the investigated Shaximiao Formation are mainly characterized by Protosols. In the middle part of the investigated Shaximiao Formation,Protosols,Calcisols,and argillic Protosols are developed (Fig. 10A). The macromorphological and micromorphological features of these paleosols suggest that four types of paleosols related to the main pedogenic processes, that is, bioturbation, gleization, argilluviation (clay illuviation),and calcification can be identified in the Middle Jurassic (Bajocian-Callovian) Shaximiao Formation of the Sichuan Basin (Table 1).
Bioturbation is the widespread pedogenic process and present among the four major types of paleosols(Table 1). The presence of different kinds of root traces,mottles,and biological remains(i.e.,burrows)in the paleosol profiles (Figs.2D, 4A-B, 5A-C, 6A-C,7A and 8A-C), particularly in the surface horizons,indicates the occurrence of bioturbation. Moreover,the gray or green colors that were observed to have developed in the upper horizons of the paleosol profiles may suggest higher organic matter production(Beverly et al.,2018)resulting from the accumulation and decomposition of organic matter (i.e., bioturbation activity). Finally, the thin sections further confirmed this type of pedogenic process; the occurrence of root pores and organic matter infillings in channels and chambers(Figs.5D-E and 8D),as well as the presence of calcite biospheroids(Fig.7F)resulting from earthworm activity (Kooistra and Pulleman,2010; Canti and Brochier, 2017), were clearly visible under the microscope.
The development of drab-haloed root traces and drab mottles in the paleosurface horizons of the argillic Inceptisol-like and Inceptisol-like paleosols are evidence for burial gleization(Table 1;Figs.2D,5B-C,6C and 7B-C); these features were formed from chemical matrix reductions that occurred when anaerobic bacteria decomposed organic matter after a paleosol was buried below or near the water table(Retallack, 2001). Argilluviation is observed in the argillic Inceptisol-like paleosols (Table 1) and is indicated by the presence of clay coatings in the thin sections (Fig. 8E and F), and observations of clay illuviation in the field (Figs. 6C and 7A-B) support this interpretation.
The occurrence of abundant pedogenic calcium carbonates, such as calcium carbonate coatings and micritic calcite(Figs.2E and 7),was interpreted to be related to subhumid, semiarid and arid climates(Srivastava et al., 2002), suggesting that calcification was another main pedogenic process that occurred in the Aridisol-like paleosols(Table 1).In either subhumid or semiarid to arid climate environments, there may be sufficient water to remove some exchangeable cations (i.e., Na+, K+, Mg2+) from a paleosol profile;however, calcium (i.e., Ca2+) is not removed, causing the accumulation of pedogenic carbonates within the subsurface horizons of the profiles (Retallack, 2001;Dal' B′o et al., 2009; Pan and Huang, 2014).
In the study areas, the abovementioned pedogenesis, that is, bioturbation, gleization, argilluviation, and calcification, observed in the paleosol profiles, were related to climatic conditions because climate, as one of the five pedogenic factors, has a significant impact on pedogenesis in general.Currently, the climatic reconstruction results show that both proxy values obtained from the MAT reconstructions based on the Middle Jurassic Shaximiao Formation paleosols in the Sichuan Basin were almost the same(Fig.10C).The overall variations of the MAP estimates using the CIA-K and Bk-depth proxies varied synchronously (Fig. 10B). Moreover, the MAP estimates are also roughly in accord with the paleohumidity reconstruction ranging from dry subhumid to superhumid climates using the method of Gulbranson et al. (2011). Arid-semiarid climatic states in MAP estimates correspond to dry subhumid for moisture regimes while subhumid-humid climatic conditions correspond to superhumid. Furthermore,our paleofloral and paleohumid interpretations are in concert with those of Wang et al. (2001), who investigated and analyzed molecular fossils detected from the Middle Jurassic red clastic strata of the Sichuan Basin and concluded that the paleovegetation in the region was dominated by woody plants with minimal herbaceous plant cover,supporting a floral shift from a forest landscape to a grassland landscape. This interpretation was further supported by the occurrence of calcification, suggesting that vegetation types such as open grasslands or grassy woodlands(Retallack, 2001) developed in the study areas. As a consequence, these parameter reconstructions are reliable for the climatic reconstruction of the study areas.

Fig.11 A)Climatic zones(Boucot et al.,2013)and paleogeographic map(Scotese,2014)during the Middle Jurassic(Bajocian-Bathonian);the warm and cold current is from Li and Jiang (2013) and monsoonal circulation is from Parrish (1993);B) Paleogeographic map of the East Asia (modified from Li, 1998) during the Middle Jurassic (170 Ma). Abbreviations: NCB = North China Block; SCB = South China Block.
5.2. Middle Jurassic climate change in the Sichuan Basin
The global climate during the Middle Jurassic was characterized by zonal climates with arid/tropical/boreotropical/warm-temperate/cool-temperate environmental conditions from the equator to the poles (Fig. 11A; Boucot et al., 2013). The Middle Jurassic (Bajocian-Callovian) Sichuan Basin, located between 20°N and 30°N (Fig. 11B; Singsoupho et al.,2014), was in the boreotropical climate zone(Fig. 11A). Our reconstructed values employing multiple paleosol-based proxies indicate that a generally semiarid-subhumid climate alternating with an arid-humid and cool/warm-temperate climate prevailed in this region during this period.Moreover,these estimated values are similar to those of a humid subtropical(temperate)climate(Zhang et al.,2016)with dry seasons, marked by the occurrence of pedogenic calcium carbonates(Retallack,2001;Tabor and Myers,2015), and may also correspond to a dry cold steppe climate according to the criteria of K¨oppen (1923).
The combination of data inferred from the Shaximiao Formation paleosols of the Sichuan Basin demonstrates that the Middle Jurassic(Bajocian-Callovian)climate in Southwest China, with a paleolatitude of 20°N-30°N (Fig. 11B; Singsoupho et al., 2014), was a generally semiarid-subhumid climate alternating with arid-humid and cool/warm-temperate climates.These new paleoclimatic data confirmed the climate reconstructions that were previously interpreted from palynological assemblages dominated by Cheirolepidiaceae (indicated by the abundance of Classopollis in the palynomorph assemblages; Wang et al.,2008), which are commonly considered as indicators of arid-adapted environments (Alvin, 1982; Li et al.,2020d),together with the low numbers and limited diversity of cool-adapted representatives of Coniopteris pollen(Wang et al.,2008).Moreover,this result accords with the geochemical characteristics of the Shaximiao Formation in the western margin of the Sichuan Basin(Qian et al., 2012), which suggested that an overall subtropical arid and semiarid climate punctuated by brief cool pulses. In addition, the climatic conditions reconstructed herein are also supported by evidence from the geochemical characteristics of Shaximiao Formation detrital rocks in the southwestern margin of the Sichuan Basin and the Chongqing Municipality of the Sichuan Basin reported by Li et al. (2019) and Zhang et al. (2020b) that a warm-humid or subhumid and semiarid climate occurred in these regions.
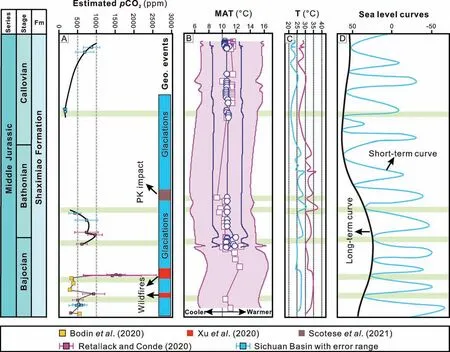
Fig. 12 Correlations among the estimated pCO2 data, geological events, marine temperatures, global sea level variations and terrestrial succession in the Sichuan Basin during the Bajocian-Callovian.A)Estimates of pCO2 from the present study and previously published studies as well as geological events.Glaciations taken from Price(1999)and Dromart et al.(2003);and wildfire records derived from Xu et al.(2020);PK impact came from Scotese et al. (2021); B) MAT values estimated from paleosols in the Sichuan Basin; C) Seawater temperatures reconstructed from western Asia derived from Alberti et al.(2020).Blue line represents the average value for δ18Osea value of −1‰,purplish red line represents the average value for δ18Osea value depending on paleolatitude (see Alberti et al., 2020); D) Global sea level changes derived by Haq (2018). Abbreviations: Fm = Formation; Geo. = Geological; PK = Puchezh-Katunki.
Such climate states were reconstructed and described for the first time herein, and their occurrence may be related to the cumulative effects of global geodynamic and regional tectonic events that occurred in the Middle Jurassic. First, it is likely that major fragmentation of Pangea took place during the Jurassic, resulting in paleogeographic reorganizations(when Laurasia rifted from Gondwana and Africa separated from Antarctica/Australia; Holz, 2015),affected the distribution of paleoclimatic zones(Fig.11;Jenkyns et al.,2002;Dera et al.,2011,2015;Boucot et al.,2013)and thus influenced the climate of the Sichuan Basin. In particular, the variations in relative plate movements and spreading rates between western Gondwana (i.e., Africa) and western Laurasia(i.e.,North America)(Fig.11A;Labails et al.,2010;Scotese,2014)brought about a further widening and deepening of the Hispanic Corridor during the Middle Jurassic (Aberhan, 2001; Labails et al., 2010;Dera et al., 2015); these changes may have promoted enhanced upwelling along the Tethyan margin(Wiggan et al., 2018). Consequently, these paleoceanographic changes were accompanied by a general rise in sea level on a global scale(Müller et al.,2008;Haq,2018)and thereby may have brought new sources of moisture from the southeastern Tethys and the Panthalassa Ocean via the Hispanic Corridor to the interior of Asia during the Middle Jurassic(Fig.11A),resulting in more temperate and humid conditions (Donnadieu et al.,2006). Moreover, the “megamonsoonal” circulation that prevailed in the earlier Mesozoic (Fig. 11A;Parrish,1993;Wang et al.,2014)was still in place but showed signs of weakening(Scotese et al.,2021).The influx of moisture under the influence of the megamonsoon may have caused temperate and humid-subhumid climatic states on the Sichuan Basin located on the southeast coast of the paleo-Tethys Ocean during the Mesozoic Era (Fig. 11). Argillic Protosols occurred in the Middle Jurassic Shaximiao Formation probably indicate humid-subhumid climates as result of invasion of the megamonsoon into the inland(Sichuan Basin). Petrified woods and coal-bearing sequences in the Middle Jurassic Junggar Basin influenced by a strong monsoonal circulation (Li et al.,2014), together with coal-accumulation in the Qaidam Basin during the Bathonian-Callovian linked with a potential monsoonal circulation(Wang et al.,2005),maybe in some way prove the influence and existence of the megamonsoon in East Asia during the Middle Jurassic.
In addition, a notable bolide impact named the Puchezh-Katunki impact, which occurred in Russia during the Bathonian (167 Ma) and was likely responsible for the short-lived development of global cooling(Park and Royer, 2011; Scotese et al., 2021), could have been the reason for the brief cool pulses punctuating a generally warm climate during the Bathonian(Fig.12).Finally,the spread of aridity was linked to a regional tectonic event, called the uplift of the Longmenshan Mountains (Fig. 11B; Wang and Xu, 2001;Wang et al., 2010), which may have constituted a topographic barrier to atmospheric circulation, thus creating a rain shadow effect. Thick accumulation of the Shaximiao Formation in the basin showed the main episode of the subsidence, indirectly indicating that Longmenshan Mountains experienced uplifting (Meng et al., 2005). These changes in atmospheric circulation over the Sichuan Basin, partly leading to oscillating climates, were also supported by the relatively unstable moisture regimes that occurred during soil formation based on the effective moisture model(Gulbranson et al., 2011).
In summary, the generally semiarid-subhumid climatealternatingarid-humidandcool/warm-temperate climates that prevailed in the Middle Jurassic (Bajocian-Callovian) Sichuan Basin were very likely to be due to global geodynamic and regional tectonic events.
5.3. Correlation of pCO2 variations and environmental changes
The paleoatmospheric CO2estimations obtained using the carbonate isotope-based CO2paleobarometer(Cerling, 1991; Ekart et al., 1999) indicated that low pCO2levels between~100 ppm and~890 ppm occurred during the Middle Jurassic(Bajocian-Callovian);these values roughly fell within the error envelope of the paleoatmospheric CO2values that were reconstructed based on the GEOCARBULF and GEOCARB II models(Berner,1994,2008)and the 95%confidence intervals of a new CO2compilation (Foster et al., 2017) but were much lower than those reported previously (Ekart et al., 1999; Sun et al., 2008; Retallack, 2009a; Yan et al., 2009; Wu et al., 2016). However, more recent studies have reported reconstructed pCO2for the early Bajocian between~345 ppm and~520 ppm based on the model of Schubert and Jahren (2015) (Fig. 12A; Bodin et al., 2020) and between ~355 ppm and ~1706 ppm during the Bajocian-Bathonian using a recalibrated transfer function based on the Ginkgo stomatal index proxy (Fig. 12A; Retallack and Conde, 2020). Based on data from well-preserved Ginkgo leaves observed in Northwest China(Inner Mongolia),the pCO2during the Middle Jurassic was 405±71 ppm (Sun et al., 2018).Although our estimates obtained from paleosols were considerably lower than those reported in previously published studies, our calculations also supported a recent study that proposed values“below 1000 ppm for most of the Phanerozoic, from the Devonian onwards”(Fig. 12A; Franks et al., 2014). Concurrently, we highlight here that these pCO2estimates should be treated with caution due to the uncertainties present in pCO2proxies (e.g., the soil respiration rate and temperature). Nonetheless, these estimations provide new evidence for low pCO2levels during the Middle Jurassic.
Generally, a coupling relationship exists between pCO2and climate in Earth's history (Steinthorsdottir et al.,2013;Royer et al.,2014;Li et al.,2016;Richey et al., 2020). In the present study, a rough coupling relationship between the present pCO2estimates, the published pCO2and the estimated paleotemperatures can be observed during the Bajocian-Callovian(Fig.12A and B). Interestingly, similar covariations also exist in seawater temperatures reconstructed from the same low latitudes (western Asia) using bivalve and brachiopod shells (Fig. 12A,C; Alberti et al., 2020). In addition,a correspondence between the pCO2fluctuationsandglobalsea-levelchangesalsoexistedduringthe Bajocian-Callovian, that is, periods of low pCO2occurred in accordance with periods of global sea-level lowstand (Fig. 12B-D). More recently, Landwehrs et al. (2021) found that the lower sea level and larger land area during the Triassic-Jurassic would have contributed to relatively low temperatures. To some extent,this reinforces the idea of a correlation between low pCO2, low sea level, and low temperatures during the Middle Jurassic.However,all these estimations are subject to caution due to the limitations of poor age control and the uncertainties inherent in pCO2proxies.Nevertheless,correlations between marine and terrestrial temperature changes, eustatic sea-level oscillations and pCO2variations are indeed found during the Middle Jurassic in this study (Fig. 12), and thus, we tentatively conclude that the atmospheric carbon dioxide concentration played a considerable role in marine and terrestrial climate changes(i.e.,controlled the Earth's surface temperatures). In addition, our reconstructed pCO2dropped below the simulated threshold(~500 ppm)for the initiation of continental glaciations(Royer, 2006) on several occasions (Fig. 12A). Recent work performed by Bodin et al.(2020)proposed that the relatively low CO2levels during the Middle Jurassic should be linked to the fluctuation of average global temperatures and their effect on the waxing and waning of polar ice caps. Therefore, our work here provides additional evidence for the occurrence of cool pulses or cold intervals in generally warm Jurassic greenhouse climates.Last,the rapid increase estimated in the pCO2in the early-middle Bajocian may correspond with the occurrence of ancient wildfire events that may have caused rapid increases in pCO2(Fig.12A).In Northwest China,coal samples and rock samples obtained from the roofs and floors of coal seams indicated that widespread wildfire events occurred in the early Middle Jurassic and may have injected volumes ofCO2up to,1926Gt intothe atmosphere,thus increasing the pCO2(Xu et al.,2020).
To summarize,albeit with the numerous limitations inherent to this correlation, the relationship between CO2-climate coupling and global geological events seems to be validated by the present study. Further investigations, notably the precise dating of paleosol samples, is required to confirm that the observations presented herein are reproducible and therefore represent the regional expression of a global signal.
6.Conclusions
The Middle Jurassic (Bajocian-Callovian) Shaximiao Formation across five areas of the Sichuan Basin contained 151 paleosol profiles of four distinct paleosol types (i.e., Entisol-like, Inceptisol-like, Aridisollike, and argillic Inceptisol-like paleosols) examined by conducting field outcrop observations combined with laboratory analyses. The mean annual precipitation estimates calculated from the depth to carbonate nodules proxy and the CIA-K index yielded ranges of 140±147 - 530±147 mm/yr and 12±182 -1140±182 mm/yr, respectively. The paleotemperatures calculated by the PWI index showed MATs ranging from 10±2.1°C to 12±2.1°C, while those calculated by the SAL index show MATs ranging from 10±4.4°C to 13±4.4°C. These MAP and MAT values suggest that, at paleolatitudes of 20°N-30°N during the Bajocian-Callovian interval, a generally semiarid-subhumid climate alternating arid-humid and cool/warm-temperate climates occurred.These inferred climatic shifts were accompanied by relative humidity and floral changes from superhumid/wet forests and humid/perhumid/rain forests to dry subhumid/steppe conditions.
The breakup of Pangea resulted in paleogeographic reorganizations,bringing about a further widening and deepening of the Hispanic Corridor associated with the“megamonsoonal” circulation and causing humid and subhumid climatic states in the Sichuan Basin during the Middle Jurassic. Moreover, the Puchezh-Katunki impact that occurred during the Bathonian (167 Ma)resulted in brief cool pulses punctuating a generally warm climate during the Bathonian.Furthermore,the occurrence of aridity was linked to the uplifting of the Longmenshan Mountains in South China;this uplift may have created a rain shadow effect.
The paleoatmospheric CO2estimates suggested remarkably low paleoatmospheric CO2levels,yielding a range of 100-890 ppm during the Bajocian-Callovian.These new CO2reconstructions were consistent with the threshold for the initiation of glaciation on some occasions, providing new evidence for the occurrence of“cool modes”in the Middle Jurassic.Combining with the published pCO2data and seawater paleotemperature reconstructions from the same low-altitude areas, a rough coupling can be observed in the CO2-climate relationship.Therefore,we concluded that CO2forcing played an important role in climate change during this time interval and that variations in low pCO2levels could also be linked to the occurrence of global geological events.
Abbreviations
CIAChemical index of alteration
CIA-K Chemical index of alteration minus potassium
ENPPEnergy from net primary productivity
EPPTEnergy from precipitation
ETEvapotranspiration
MAPMean annual precipitation
MATMean annual temperature
pCO2Atmospheric CO2concentrations
P-effEffective precipitation
PWIPaleosol weathering index
SALSalinization
USDA United States Department of Agriculture
VPDB Vienna Pee Dee Belemnite
Funding
We acknowledge the support of the National Natural Science Foundation of China(Grant Nos.41901066 and 41771248) and the National Basic Research Program of China (Grant No. 2012CB822003).
Availability of data and materials
Information of data and materials was in figures and tables of the manuscript.
Authors’ contributions
Collection and analysis of the data from outcrop was through collaboration among all authors. The writing of the final manuscript was also through collaboration among all authors. All authors read and approved the final manuscript.
Competing interests
The authors declared that they have no competing interests.
Acknowledgements
The authors thank Zhi-Hui Yue, Zheng Gong and Mao-Chao Zhang (Chongqing Vocational Institute of Engineering) for their assistance in the field and to Qian Jin for sample preparation. We are also grateful to Jing Liu (Nanjing Institute of Geology and Paleontology, Chinese Academy of Sciences) for isotope analytical assistance, and Erik Gulbranson (Gustavus Adolphus College) for his help in determinations of humidity province.
杂志排行

Journal of Palaeogeography的其它文章
- Giant ooids of microbial origin from the Zhangxia Formation (Cambrian Miaolingian Series) in North China
- Bioturbation enhanced petrophysical properties in the Ordovician carbonate reservoir of the Tahe oilfield, Tarim Basin, NW China
- Book Review on River Planet:Rivers from Deep Time to the Modern Crisis by Martin Gibling
- Palaeoenvironmental reconstruction for the Permian (lower Gondwana) succession of the Godavari Valley Coalfield in southern India based on a combined palynofacies, carbon isotope, and biomarker study
- Lagoonal carbonate deposition preceding rifting-related uplift: evidence from the Bartonian-Priabonian (Eocene) of the northwestern Gulf of Suez (Egypt)
- Silurian ostracods from the Nyalam region,southern Tibet,China and their implications on palaeoenvironment and palaeobiogeography