Theoretical Calculation and Analysis of Muffler Based on Multilayer Sound Absorbing Material
2022-03-08ZHUCongyun朱从云LIURongji刘镕基
ZHU Congyun(朱从云), LIU Rongji(刘镕基)
School of Mechanical Science & Engineering, Zhongyuan University of Technology, Zhengzhou 450007, China
Abstract:The multilayer impedance composite sound absorption structure of the new muffler is proposed by combining the microporous plate structure with the resonant sound absorption structure of the porous material. Firstly, the acoustic impedance and acoustic absorption coefficient of the new muffler structure are calculated by acoustic electric analogy method, and then the noise attenuation is calculated.When the new muffler structure parameters change, the relationship among the noise frequency, the sound absorption coefficient and the noise attenuation is calculated by using MATLAB. Finally, the calculated results are compared with the experimental data to verify the correctness of the theoretical calculation. The variation of resonance peak, resonance frequency and attenuation band width of each structural parameter is analyzed by the relation curve. The conclusion shows that it is feasible to use multilayer sound absorbing materials as the body structure of the new muffler. And the influence relationship between the change of various parameters of the sound absorption structure with the sound absorption coefficient and noise attenuation is obtained.
Key words: muffler; micro-perforated plate; multilayer sound absorbing material; sound absorption coefficient; noise attenuation
Introduction
At present, although the rapid popularization of cars in China has basically ended, the new car market is still in the new normal of lowly speed growth. The noise pollution caused by cars is still one of the most serious environmental problems in China and even in the world. Experimental data show that the exhaust noise accounts for about 30% of engine noise source; in the process of automobile vibration reduction of noise reduction, sound absorption is a very important way;sound absorbing material or sound absorbing structure has been widely used in engineering application. At present, mufflers can be roughly divided into dissipative muffler, resistance muffler and impedance compound muffler according to the silencer mechanism[1]. Many experts and scholars at home and abroad have done a lot of research on these kinds of mufflers. In terms of resistant mufflers, de Keyetal.[2]simulated and optimized cavities with different expansion cavities by finite element analysis. Lee[3]compared different noise reduction effects in the range of high noise frequency by means of experiment and simulation, which made efforts to study the ideal model of expansive muffler. Xieetal.[4]obtained the appropriate length wavelength tube by using the method of calculating transfer loss based on simulation for specific noise frequency, and the tube was applied in practice. Xueetal.[5]used U-shaped bellows instead of intubation resistant muffler design scheme, which aimed at using band-elimination filter characteristic of the U-shaped bellows ascend above the frequency band of resistant muffler noise elimination performance and verifying the feasibility of corrugated pipe used in resistant muffler. They provided a new train of thought for design of resistant muffler. Lu and Wan[6]used a compact micro-perforated panel(MPP) muffler with a pass-through coupling mode to reduce the sound. By using the optimized serial coupled MPP muffler, the intake noise of the wide-band engine in the medium and high frequency range is significantly reduced, which provide a good solution for vehicle and other noise control. In terms of resistive mufflers. Deniaetal.[7]used two-dimensional analysis method and finite element analysis method to analyze the influence of inlet and outlet pipes length on the muffler effect through experiments, and proved that appropriately extending the length of inlet and outlet pipe can improve the muffler effect. Deniaetal.[8]experimentally studied the noise reduction characteristics of resistive muffler under different intake air temperatures. In recent years, domestic research on resistive muffler has also made some progress. Zhao and Gu[9]used Gamma technologies power(GT-POWER), which was one-dimensional fluid dynamics software to study the influence of design parameters of resistive muffler on engine performance. Lietal.[10]conducted an experimental study on the influence of the density of the filling material with resistive noise cancellation on the noise cancellation effect, and the results showed that in different noise frequency domains, different filling densities had certain differences on the noise cancellation effect. Qu and Jiao[11]determined the noise reduction scheme from noise measurement location selection, noise frequency and the amplitude analysis reason, successfully solved the supercharged air intake system noise anomalies also outdoor supercharged air intake system for diesel engine sound design and installation provided valuable experience. Jiang and Gong[12]used the method of laboratory measurement, the insertion loss of the array resistive muffler with other muffler lengths(the section form and spacing of the muffler unit column remain the same) was measured. The measured value was compared with the predicted value of the fitting function, and the results showed that the predicted error of insertion loss of each frequency band was within ±3 dB. In terms of impedance compound muffler. Chiu[13]studied the impedance and all kinds of factors influencing the effect of resonant cavity muffler. The position number of resonator and the resistance of nozzle diameter of muffler inlet pipe were analyzed by simulated annealing transfer matrix method. The optimum internal structure size is obtained by simulating the perforation rate of the pipe wall and the influence factors of the perforation diameter and length of the acoustic absorbing material of the impedance muffler. Wangetal.[14]applied for a patent of impedance-resonance composite muffler, using 1/4 wavelength tube and resonator to absorb medium and high frequency noise and resistive materials to absorb low frequency noise. Wangetal.[15]changed the structure of muffler and designed an impedance compound muffler, and analyzed it based on GT-POWER software. The study showed that the muffler’s effect was improved. Wang[16]studied the acoustic performance of a composite exhaust muffler based on MATLAB and COMSOL software. It is found that when the length of expansion cavity is constant, increasing the length of inlet intubation can make the transfer loss curve move to low frequency direction, and the increase of inlet intubation length is beneficial to control the low frequency noise. The length of the intubation is constant, the transfer loss curve almost does not change when the length of the expansion cavity is changed. It shows that adjusting the length of inlet intubation is more effective to control the low frequency noise. Most of the mufflers are resistant mufflers,which reduce sound by changing the structure of the muffler. Mufflers such as expansion muffler and quarter wave tube have good noise attenuation in the low and medium frequency range. The muffler that simply uses the porous sound absorbing material in the silencer pipe to absorb sound is called the dissipative silencer. The characteristic of the dissipative muffler is that it has a better silencer effect on the noise within the range of medium and high frequency. The frequency range of exhaust noise of automobile engine is mainly concentrated in 125-4 000 Hz and its noise frequency band includes both low frequency band and high frequency band. Therefore, it is impossible to achieve better noise elimination effect by only using either of the above two mufflers for noise elimination. But the research and application of the impedance compound muffler on the automobile is less. At present, no research has been done based on the muffler by combining multilayer sound absorbing materials. The resonant cavity structure formed by the combination of micro-perforated plate and cavity is a common method to prevent low frequency noise. When the high frequency noise passes through the porous sound absorbing material, the high frequency sound makes the air in the hole move quickly, thus consuming more sound energy, so the porous sound absorbing material is often used to control the high frequency noise. In this paper, a sound absorption method is presented by combining multilayer sound absorbing materials.And the sound absorption coefficient and noise attenuation are obtained by using the equivalent acoustoelectric analogy diagram. The influence of the parameters of each structure on the sound absorption coefficient and noise attenuation is analyzed.
1 Acoustic Impedance Calculation of Multilayer Sound Absorbing Materials
1.1 Calculation of acoustic impedance of micro-perforated plates
The acoustic impedance calculation formula of the micro-perforated plate is[17]
(1)
wheremis the relative sound quality;rthe is relative acoustic resistance;ωis the circular frequency;Dis the cavity depth;C0is the speed of sound.
In Eq.(1), the relative sound mass and the relative acoustic impedance are[17]
(2)
(3)
(4)
(5)
(6)
where,his the thickness of micro-perforated plate, mm;Pmis the perforation rate,%;kris acoustic resistance coefficient;kmis the acoustic reactance coefficient;dis the aperture of micro-perforated plate, mm;fis the frequency.
1.2 Calculation of acoustic impedance of porous sound absorbing materials
The acoustic impedance calculation formula of porous sound absorbing material is
Za=Z′acoth(kala).
(7)
The empirical formulas of sound propagation constant and characteristic impedance of porous sound absorbing materials are[18]
(8)
(9)
whereρ0is the air density,kg/m3;C0is the speed of sound, m/s;fis sound frequency, Hz;lais the thickness of porous sound absorbing material, mm;Ris the flow resistance of porous sound absorbing materials, N/m2.
1.3 Calculation of acoustic impedance of cavity layer
The acoustic impedance calculation formula of the cavity layerZciwithout a rigid wall behind is[19]:
Zci=ρ0C0coth(kclci),i=2,3,
(10)

The acoustic impedance calculation formula of the cavity layer with the rigid wall behind is[19]
Zc1=-jρ0C0cosh(klc1),
(11)
wherelc1is the cavity depth of the first layer.
2 Calculation of Absorption Coefficient and Noise Attenuation
2.1 Calculation of acoustic impedance of combined structure 1
The first combined form of muffler body structure: the first layer is a porous sound absorbing material, the third layer is a micro-perforated plate, the second and fourth layers are cavity, and the back of the fourth layer is a rigid wall. Thus, the structure of "acoustic absorption layer-resonant cavity" is produced. Its two-dimensional plan is shown in Fig. 1. A-A stands for sectional view. According to its combining form, the equivalent acoustoelectric analog diagram is drawn to facilitate the calculation of its acoustic impedance. The combined structure diagram and acoustoelectric analogy diagram are shown in Fig. 2.

Fig. 1 Two-dimensional plan of combination structure 1
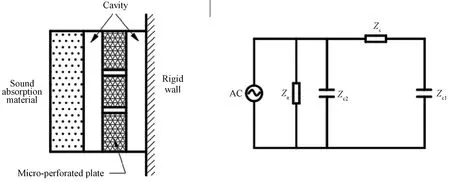
Fig. 2 Structural diagram and acoustoelectric analogy diagram of combination structure 1
According to Fig. 2, the calculation formula of the total acoustic impedance of the combined structure 1 can be written as
Z=
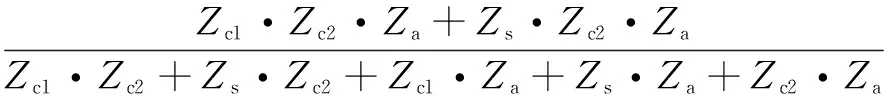
(12)
2.2 Calculation formula of acoustic impedance of combined structure 2
The second combined form of muffler body structure: the first and fourth layers are micro-perforated plates, the third layer is porous sound absorbing material, and the second and fifth layers are cavity. Thus, the structure of "resonant cavity-acoustic absorption layer-resonant cavity" is produced. Figure 3 is a planar two-dimensional diagram of combination structure 2. According to the sound absorption structure, the equivalent acoustoelectric analog diagram is drawn, and then the acoustic impedance of the combined structure is calculated. The combined structure and the corresponding acoustoelectric analogy diagram are shown in Fig. 4.

Fig. 3 Two-dimensional plan of combination structure 2
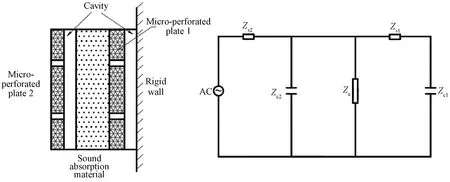
Fig. 4 Structural diagram and acoustoelectric analog diagram of combination structure 2
According to Fig. 4, the total acoustic impedance calculation of the combined structure 2 can be obtained as
(13)
2.3 Calculation of absorption coefficient and noise rduction of combined structures 1 and 2
From the above derivation, the acoustic impedanceZof the sound absorbing structure can be obtained, which can be expressed in the form of the relative acoustic impedance rate:
Z=ρ0C0(r+jx),
(14)
whereris the relative acoustic resistance to air;xis the relative acoustic reactance to air, the obtainedrandxare substituted into the formula for calculating the sound absorption coefficient of the sound absorption structure[19]:
(15)
Thus, the sound absorption coefficientαcan be calculated when the positive side of the noise is incident on the sound absorption material.
It is assumed that the normal acoustic impedance rate of the rigid wall is a pure resistance. The relative acoustic impedance ratexis set to be zero, which can be obtained from Eq.(15)[20-22, 23].
(16)
wheregsis the relative acoustic conductivity.
Cross-sectional area is
S=πD2/4.
(17)
Then, the formula of noise attenuation is
(18)
where the diameter of the muffler isD=0.2 m. The length of the muffler ish=0.65 m; then the muffler’s perimeter isF=πD.
3 Experimental, Theoretical Calculation and Analysis of Combined Structure 1
The basic values of each structural parameter of combined structure 1 are shown in Table 1. The porous sound absorbing material is ultra-fine glass wool. The sound absorption coefficient and noise attenuation were calculated by MATLAB[24]. The test ranges from 0 Hz to 4 000 Hz and the step length is set to 500 Hz. The test value was used to verify the results of MATLAB simulation calculation. In the experiment, the sound absorption coefficient of noise attenuation was measured by the standing wave tube method[23]. The schematic diagram of test method[25]for sound absorption coefficient and sound attenuation is shown in Figs. 5 and 6 respectively. In order to facilitate the measurement and comparison of sound absorption performance, the standing wave tube method is adopted. The muffler is expanded into a flat plate and measured as the material to be measured in Fig. 5. When measuring sound attenuation, the measured muffler is connected with the impedance tube, the impedance tube is connected with the sound source and the computer terminal, and the measurement effect is achieved by changing the frequency of the sound source.
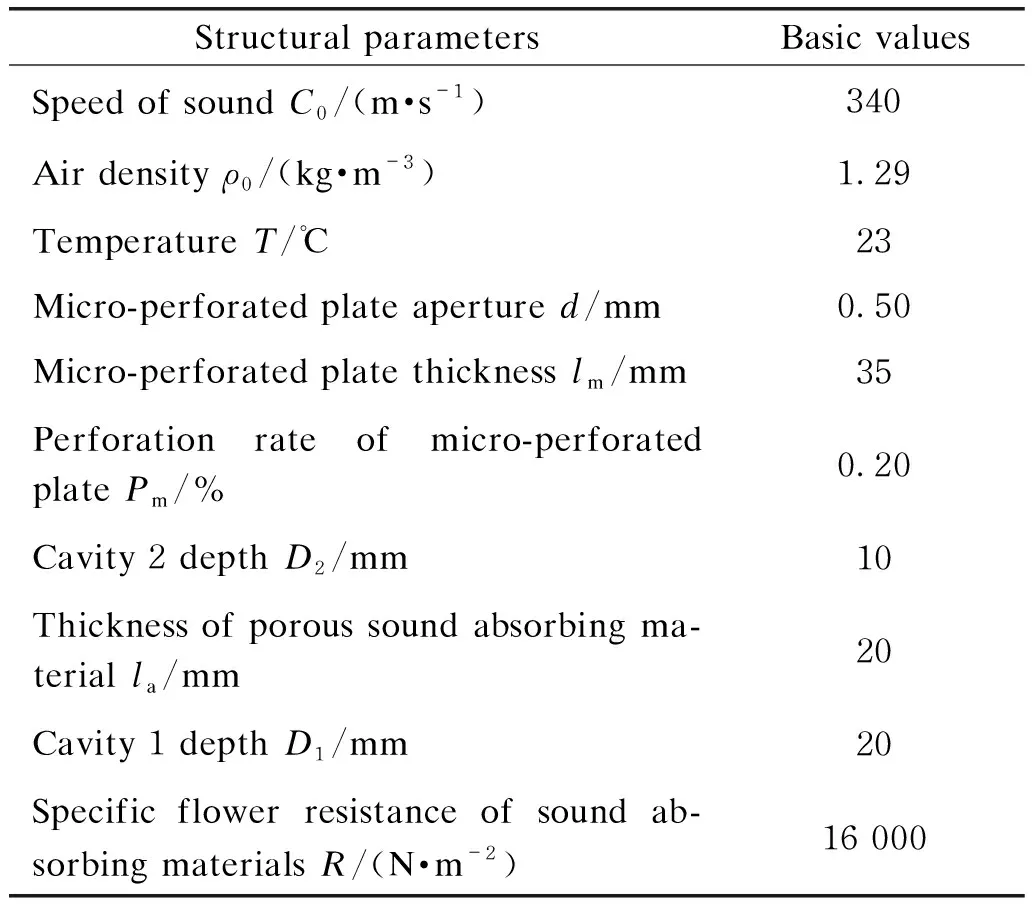
Table 1 Basic values of structural parameters in combination structure 1

Fig. 5 Standing wave tube test device

Fig. 6 Diagram of muffler noise reduction test
3.1 Influence of micro-perforated aperture on muffling effect
In order to explore the influence of the aperture of the micro-perforated plate on the sound absorption coefficient, only the aperture changes, other structural parameters remain unchanged, anddis 0.5, 0.6, 0.7, and 0.8 mm, respectively. The influence of aperture change on sound absorption coefficient is studied. Figure 7 shows the comparison of sound absorption coefficient and noise attenuation under different micro-perforation apertures.

Fig. 7 Comparison of (a) sound absorption coefficient and (b) noise attenuation in different micro-perforation apertures
As can be seen from Fig. 7, when other parameters are fixed, the maximum value of the sound absorption coefficient of the multi-layer sound absorption material, namely the formant, increases successively with the increase of the diameter of the micro-hole, and the resonance frequency(the frequency when the sound absorption coefficient is maximum) increases gradually. The absorption band width(the absorption band when the sound absorption coefficient is formant) gradually narrows. But the absorption band width of each value can reach quite high value.
In the low frequency area, the sound absorption coefficient decreased significantly with the increase of the aperture of micro-perforation. While in the high frequency area, the sound absorption coefficient increased slightly with the increase of the aperture of micro-perforation. Considering comprehensively, it is better to choose the micro-perforated plate with the apertured=0.5 mm to control the low frequency noise, and it is better to choose the micro-perforated plate with the apertured=0.9 mm to control the high frequency noise. This is because whend=0.5 mm andd=0.9 mm, the acoustic impedance of the multi-layer sound absorption structure relative to the air is closer to 1, it can better match with the acoustic impedance of the air. It can be intuitively seen from Fig. 7 that the noise frequency is before 1 500 Hz, and when the aperture of micro-perforation isd=0.5 mm, the noise attenuation capacity is the largest. Between 1 500 and 4 000 Hz, the maximum muffler is achieved when the aperture of micro-perforation isd=0.8 mm.
3.2 Influence of thickness of micro-perforated plate on noise attenuation effect
The thicknesslmof micro-perforated plate is 30, 35, 40, and 45 mm, respectively. The influence rule of its change on the sound absorption coefficient of micro-perforated plate is analyzed. Figure 8 shows the comparison of sound absorption coefficient and noise attenuation under different thicknesses of micro-perforated plate.
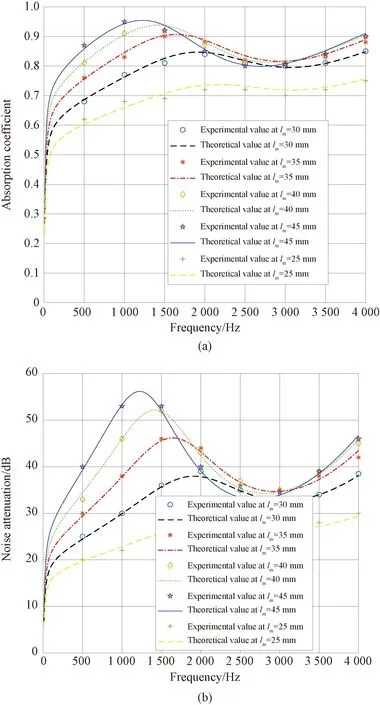
Fig. 8 Comparison of (a) sound absorption coefficient and (b) noise attenuation under different thicknesses of micro-perforated plates
As can be seen from Fig. 8, when the thickness of the microperforated platelmis 35-45 mm, with the increase of the thickness of the micro-perforated plate, the resonance peak of the multilayer sound absorbing material increases gradually, and the resonance frequency increases gradually, but the width of the absorption frequency band becomes narrower. Whenlm=25 mm, the sound quality of the sound absorption structure of the micro-perforated plate is insufficient due to the slightly smaller value, which leads to the low sound absorption coefficient in the full frequency band. However, whenlm=25 mm, the width of the absorption band is ideal. Therefore, it can be seen from Fig. 8 that when the noise frequency is below 1 500 Hz,lm= 45 mm, the resonance frequency and absorption band width are larger; when the noise frequency is above 1 500 Hz,lm=30 mm; the sound absorption band is larger,lm=45 mm, and the resonance frequency is larger. It can be seen from Fig. 8 that the maximum noise attenuation can be achieved whenlm=45 mm, which is about 52 dB. It is appropriate to chooselm=45 mm after comprehensive consideration.
3.3 Influence of different perforation rates of micro-perforated plates on noise elimination effect
In order to investigate the influence of perforation ratePmon the sound absorption coefficient and noise attenuation △Lof the anechoic structure. Keeping other parameters unchanged, the perforation ratePmof micro-perforated plates is 0.15%, 0.20%, 0.25%, and 0.30%, respectively. Figure 9 shows the comparison of sound absorption coefficient and noise attenuation under different perforation rates of micro-perforated plates.
It can be seen from Fig. 9 that it is within the range of 0.15% -0.30%. The resonance peak value of the sound absorption coefficient decreases with the increase of the perforation rate of the micro-perforated plate. The resonant frequency moved to the high frequency direction, and the absorption band width was also improved. Under different micro-perforation rates, the muffled amount reached the maximum atPm=0.15%, and the maximum muffled amount was 58 dB.

Fig. 9 Comparison of (a) sound absorption coefficient and (b) noise attenuation under different perforation rates of micro-perforated plates
3.4 Influence of different depths of cavity 2 behind porous sound absorbing material on noise attenuation effect
With other parameters unchanged, the cavity depth of the porous sound absorbing material is 5, 10, 15 and 20 mm, respectively. The effect of cavity depth on sound absorption coefficient and muffling capacity of sound absorption structure is analyzed. Figure 10 shows the comparison of sound absorption coefficient and noise attenuation at different depths of cavity 2.

Fig. 10 Comparison of (a) sound absorption coefficient and (b) noise attenuation under different depths of cavity 2
We can know from Fig. 10, when other parameters are fixed, the resonant peak of the sound absorption coefficient of the sound absorption structure decline with the increase of the cavity depthD2behind the porous sound absorption material. The resonance frequency moves slightly to the low frequency direction. At the same time, the absorption frequency band width of the sound absorption structure also narrows. WhenD2=5 mm, the sound absorption structures in the vicinity of 1 750 Hz maximum decrease approximately 51 dB. So we can draw the following conclusion. In the above four kinds of different depths of the cavity 2,D2=5 mm noise elimination effect is optimal, the value ofD2has obvious influence on the resonance peak of the absorption coefficient. But the resonance frequency and the influence of the absorption band width is not too wide.
3.5 Influence of different thicknesses of sound absorbing material on noise attenuation effect
Keeping other parameters unchanged, only the thickness of the porous sound absorbing material is changed. The thicknesslais 20, 30, 40, and 50 mm, respectively. The effects of the thickness of porous sound absorption material on the sound absorption coefficient and muffling capacity are analyzed. Figure 11 shows the comparison of sound absorption coefficient and noise attenuation under different thicknesses of sound absorption materials.

Fig. 11 Comparison of (a) sound absorption coefficient and (b) noise attenuation under different thicknesses of sound absorbing materials
It can be seen from Fig. 11 that under this sound absorption structure, different thickness of sound absorption material has little influence on the resonance peak of its sound absorption coefficient. But it has certain influence on the resonance frequency and absorption band width.It can be seen from Figs. 11(a) and 11(b) that whenla=30 mm andla=40 mm, the noise attenuation reaches resonance peak values around 3 000 Hz and 3 700 Hz, respectively, and the noise attenuation value is about 72 dB. Therefore, the thickness of porous sound-absorbing material can be selected within 30 -40 mm according to the distribution range of the main frequency of noise.
3.6 Influence of the depth of the cavity behind the micro-perforated plate on the muffling effect
With other structural parameters unchanged, taking cavity depth 1D1is 10, 20, 30, and 40 mm, respectively. As shown in Fig. 12, the comparison diagram of sound absorption coefficient and noise attenuation at different depths of cavity 1 behind the micro-perforated plate can be obtained.

Fig. 12 Comparison of (a) sound absorption coefficient and (b) noise attenuation under different depths of cavity 1
As can be seen from Fig. 12, with the increase of cavity 1 depth, the resonance peak value of sound absorption coefficient gradually decreases and the maximum noise attenuation is achieved whenD1=5 mm, but the change of noise attenuation frequency band width and resonance frequency is small. Therefore, among the cavity 1 with the above four depths,D1=5 mm can achieve the best sound attenuation effect.
3.7 Influence of noise attenuation under optimal structural parameters
According to the above analysis, for each structural parameter of combination 1,d=0.5 mm,lm= 45 mm,Pm= 0.15%,D2=5 mm,la= 30 mm,D1=5 mm, we can obtain the effect picture of sound absorption coefficient and noise attenuation of combination 1 in Fig. 13 under the optimal structural parameters.
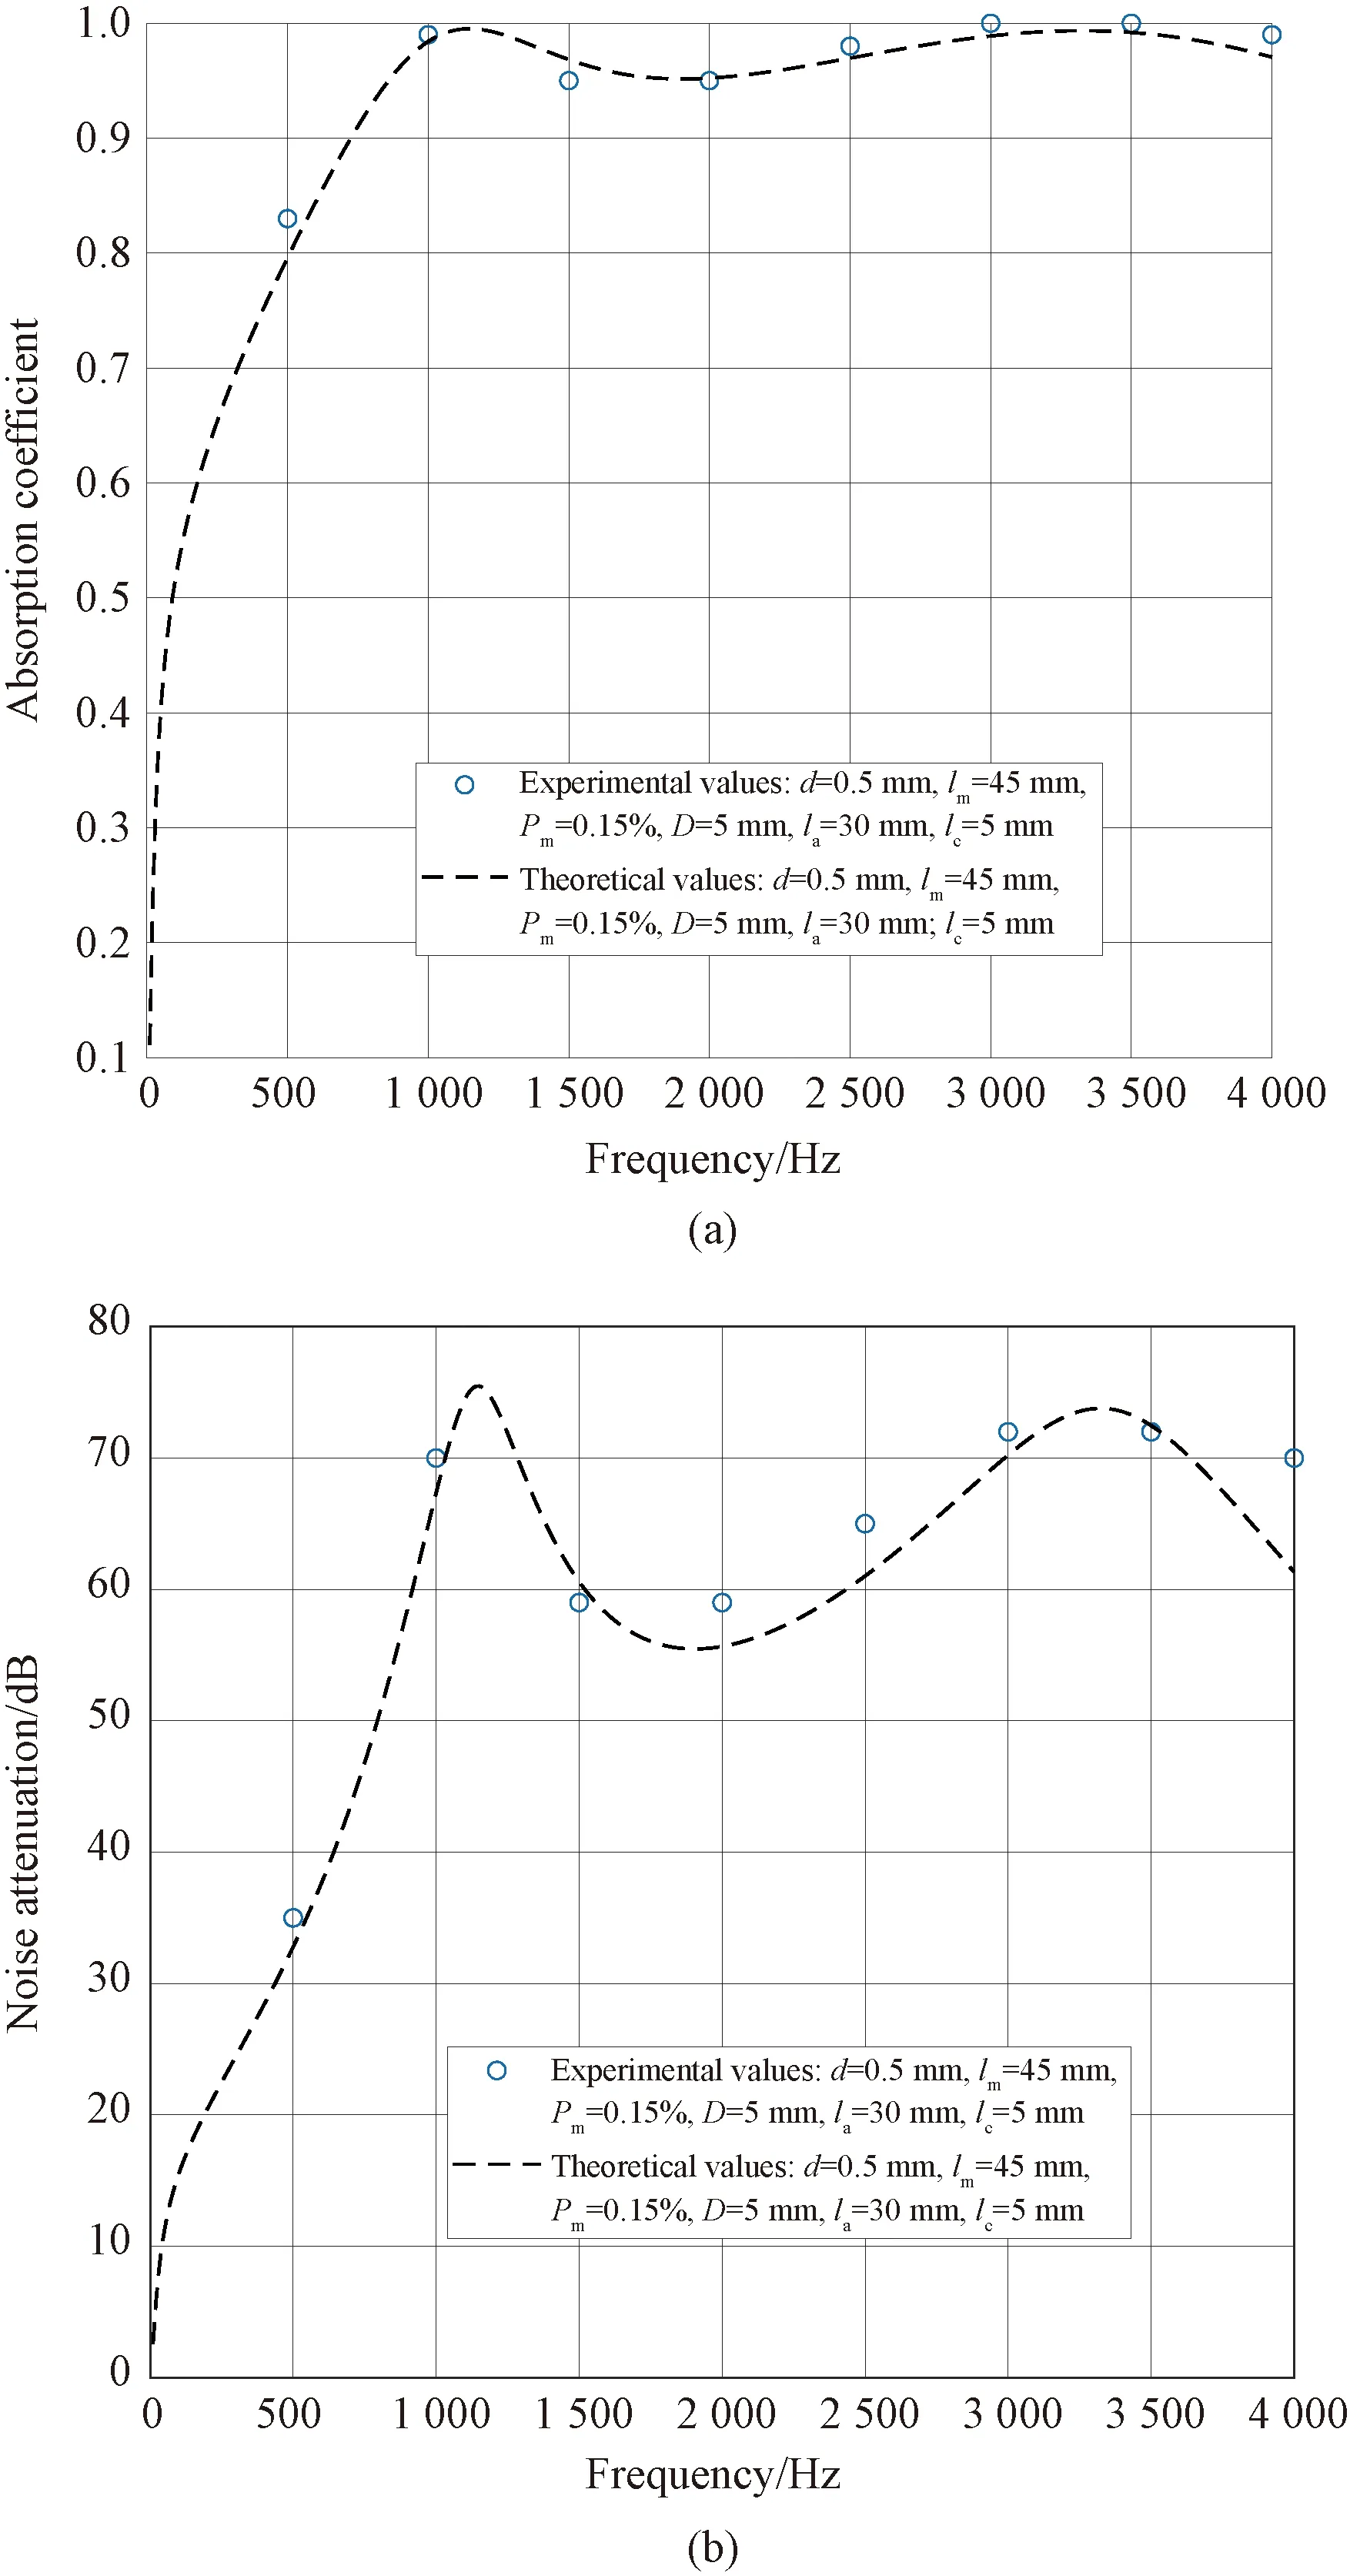
Fig. 13 Effect diagram of (a) sound absorption coefficient and (b) noise attenuation under optimal structural parameters of combination structure 1
4 Experimental, Theoretical Calculation and Analysis of Composite Structure 2
The basic values of each structural parameter of combination 2 are shown in Table 2. The sound absorption coefficient and noise attenuation calculated by MATLAB, the test ranges from 0 Hz to 4 000 Hz and the step is set to 500 Hz.The test value was used to verify the results of MATLAB simulation calculation.

Table 2 Basic values of structural parameters in combination structure 2
4.1 Influence of different apertures on noise elimination effect of micro-perforated plate 1
Making the above parameters remain unchanged, only changed the size of the apertured1of the micro-perforated plate 1d1is 0.5, 1.0, 1.5, and 2.0 mm, respectively. As shown in Fig. 14, the comparison diagram of sound absorption coefficient and noise attenuation under different apertures of micro-perforated plate 1 can be obtained.

Fig. 14 Comparison of (a) sound absorption coefficient and (b) noise attenuation under different apertures of micro-perforated plate 1
As we can be seen from Fig. 14, the resonance peak of sound absorption coefficient decreases with the increase of aperture before 2 000 Hz, and the resonance frequency increases slightly with the increase of aperture. However, the width of the sound-absorbing band decreases slightly with the increase of the aperture of micro-perforated plate 1. The frequency ranges from 2 000 Hz to 4 000 Hz, the sound absorption coefficient reaches the maximum value when the apertured1=1 mm, and the resonance peak value at 2 200 Hz. When the aperture of micro-perforated plate 1 isd1=1 mm, the noise elimination effect is better.
4.2 Influence of different apertures of micro-perforated plate 2 on noise elimination effect
With other parameters unchanged, only the apertured2of micro-perforated plate 2 is changed,d2is 0.5, 1.0, 1.5, 2.0 mm, respectively. As shown in Fig. 15, the comparison of sound absorption coefficient and noise attenuation under different apertures of micro-perforated plate 2 can be obtained.
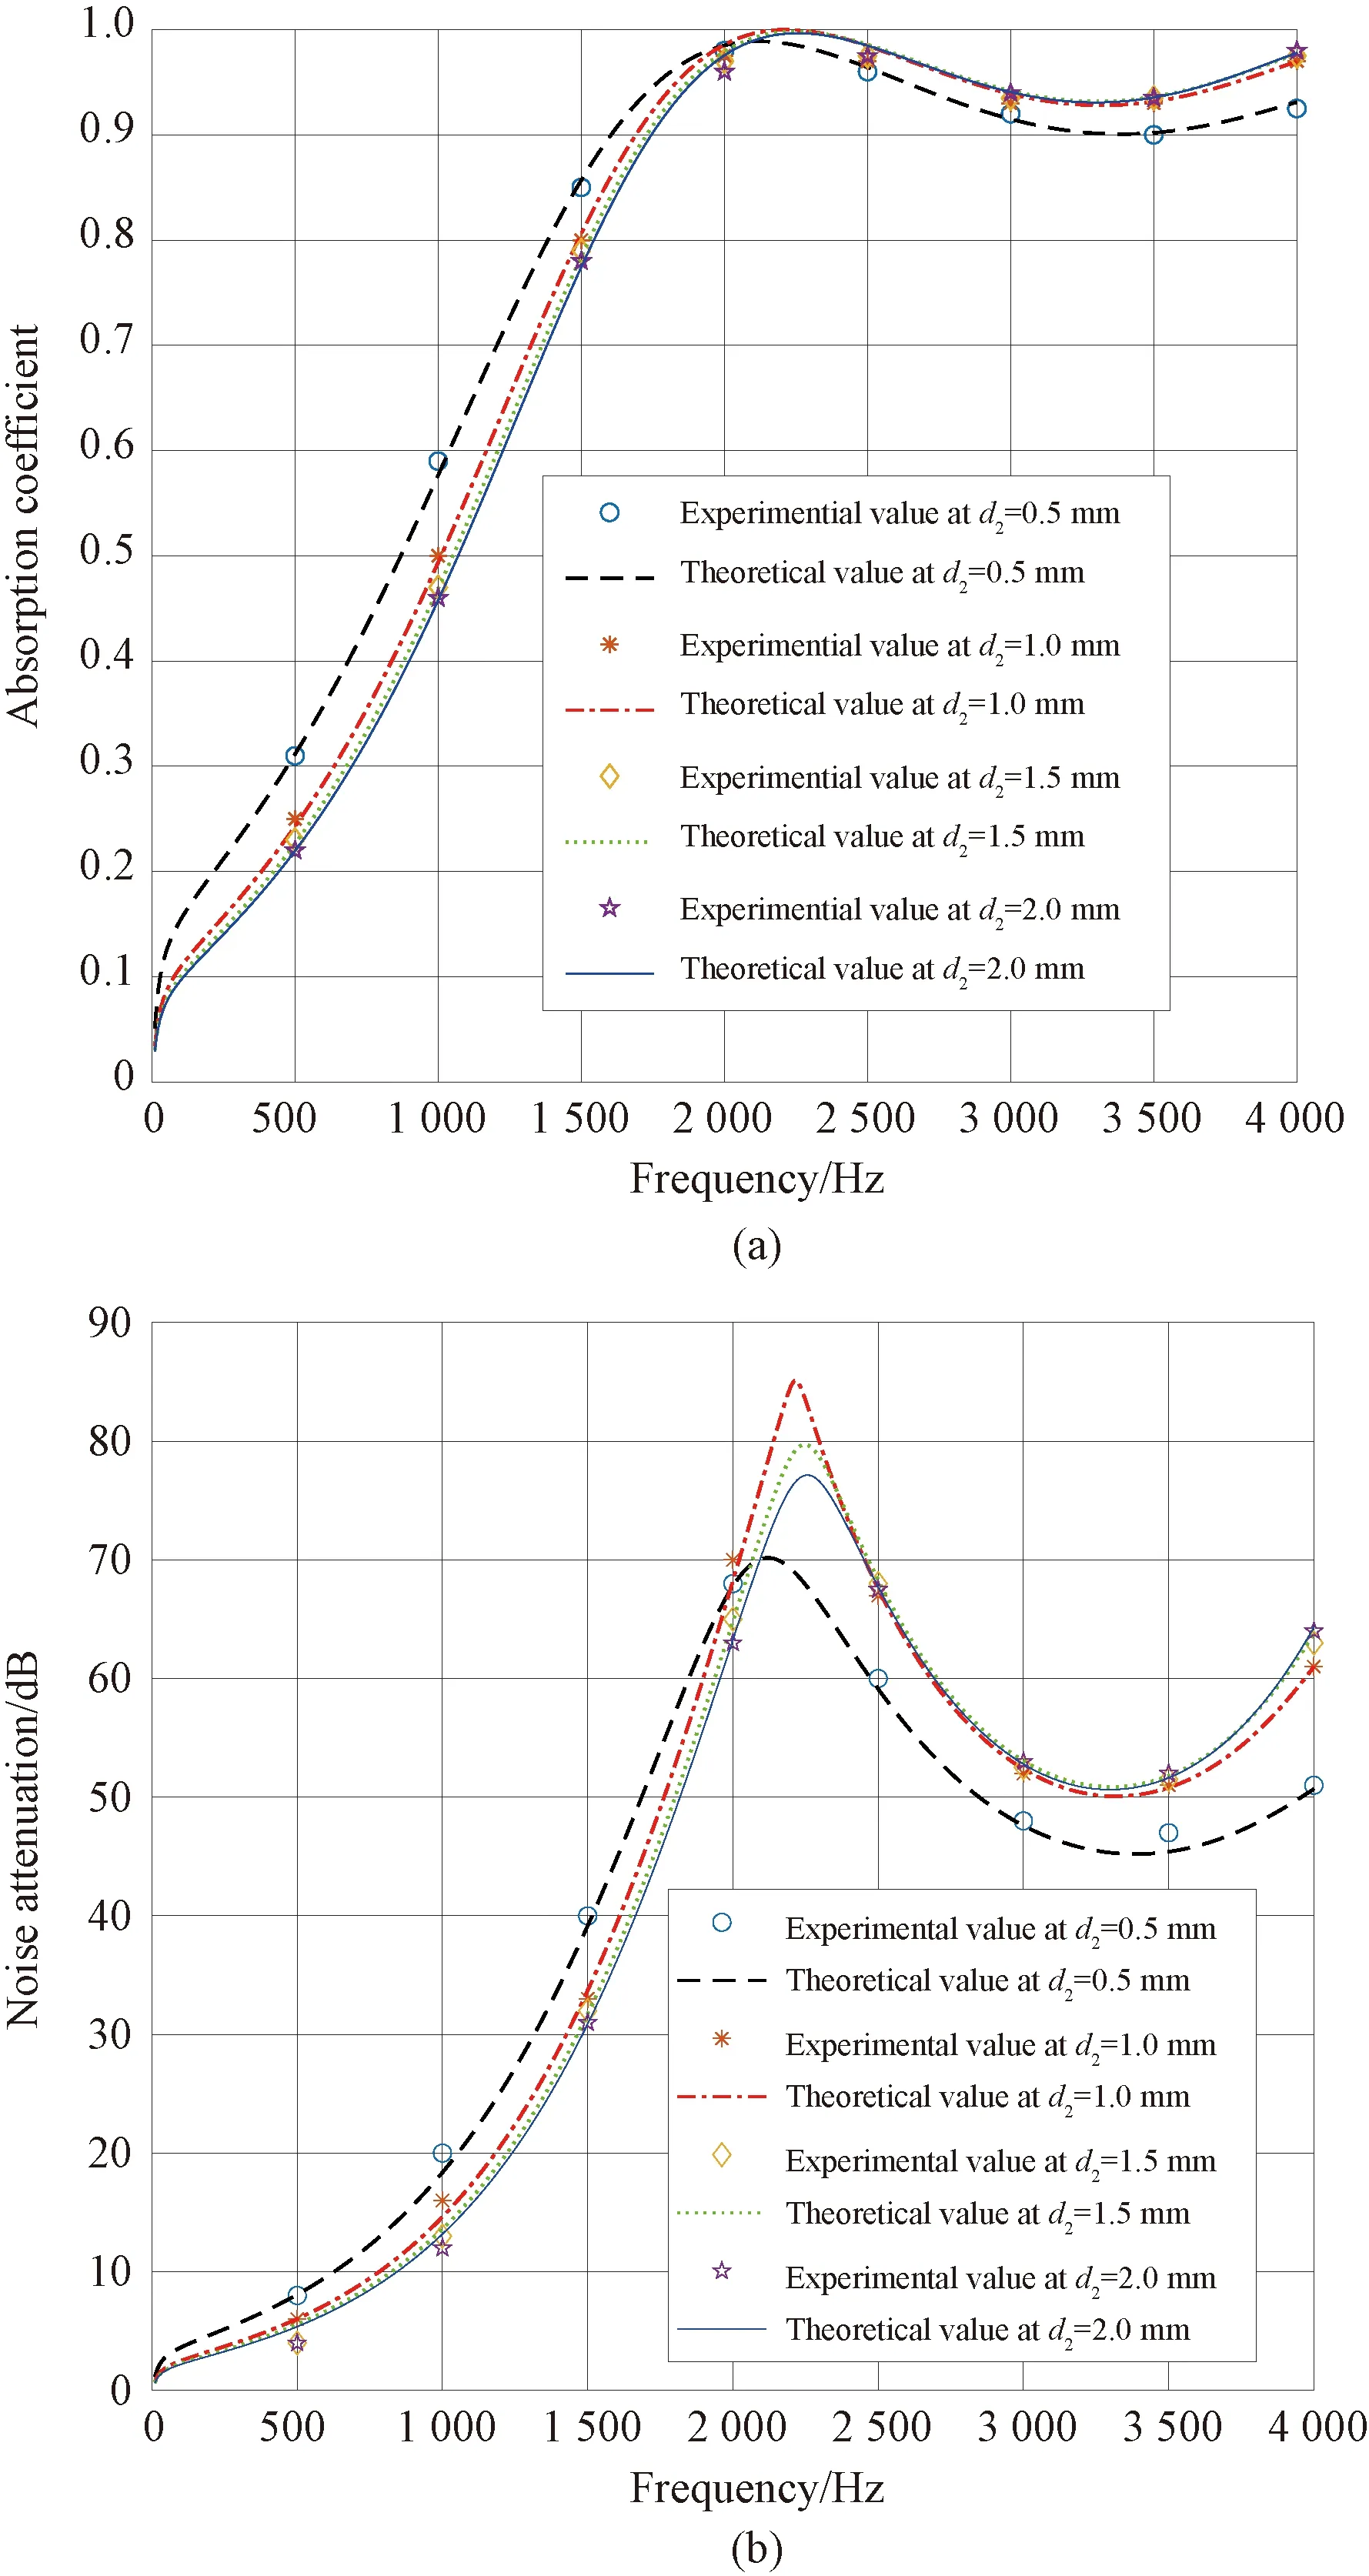
Fig. 15 Comparison of (a) sound absorption coefficient and (b) noise attenuation under different apertures of micro-perforated plate 2
We can know from Fig. 15, for the micro-perforated plate 2 with different apertures, the same resonance peak is basically achieved at 2 200 Hz, and the resonance frequency is the same as the resonance peak. The width of the sound absorption band reduce slightly with the magnify of the aperture of the micro-perforated plate 2, whend2=1.0 mm, and the sound elimination effect is the best.
4.3 Influence of different thicknesses of micro-perforated plate 1 on noise elimination effect
To keep other structural parameters unchanged, the thickness of micro-perforated plate 1l1is 20, 25, 30, and 35 mm, respectively. As shown in Fig. 16, the comparison of sound absorption coefficient and noise attenuation under different thicknesses of micro-perforated plate 1 can be obtained.

Fig. 16 Comparison of (a) sound absorption coefficient and (b) noise attenuation at different thicknesses of micro-perforated plate 1
In Fig.16, whenl1is in the range of 20-35 mm, the resonance frequency decreases with the increase oflm. Whenl1is in the range of 25-35 mm, the resonance peak value is basically the same. Whenl1=20 mm, the sound quality of the sound absorption structure of the micro-perforated plate may be insufficient due to the slightly lower value ofl1, which leads to the low sound absorption coefficient in the full frequency band. As can be seen from Fig. 16,l1has the best sound attenuation effect when it is valued at about 25 mm. Further tests showed thatl1=27 mm was the best choice.
4.4 Influence of different thicknesses of micro-perforated plate 2 on noise elimination effect
Making other parameters remain unchanged, the thicknesses of the micro-perforated plate 2l2is 20, 25, 30, and 35 mm, respectively. As shown in Fig.17, the comparison of sound absorption coefficient and noise attenuation of micro-perforated plate 2 with different thickness can be obtained.

Fig. 17 Comparison of (a) sound absorption coefficient and (b) noise attenuation under different thicknesses of micro-perforated plate 2
As can be seen from Fig. 17, the resonance frequency decreases with the increase ofl2, the resonance peak value almost does not change with the increase ofl2, the width of the sound absorption band decreases obviously with the increase ofl2. As can be seen from Fig. 17, before the resonance peak, the muffled amount is larger whenl2=35 mm; after the resonance peak, the noise attenuation is larger whenl2is 20 mm; and the muffled amount atl2=20 mm increases significantly compared with that at other thickeness. Overall,l2=20 mm has the best noise elimination effect.
4.5 Influence of different perforation rate of micro-perforated plate 1 on noise elimination effect
With other parameters unchanged, only the perforation ratePm1of micro-perforated plate 1 is changed. AndPm1is 0.15%, 0.20%, 0.25%, and 0.30% respectively. Figure 18 shows the comparison of sound absorption coefficient and noise attenuation under different perforation rates of micro-perforated plate 1.

Fig. 18 Comparison of (a) sound absorption coefficient and (b) noise attenuation under different perforation rates of micro-perforated plate 1
As can be seen from Fig. 18, whenPm1is 0.15% and 0.20%, the resonance peak increases slightly. WhenPm1=0.30% it decreases slightly. At the same time, whenPm1is in the range of 0.15%-0.25%, the sound absorption band width increases with the increase of perforation ratio 1. However, whenPm1=0.30%, the width of the sound absorption band decreases when the perforation rate of micro-perforated plate 1 is too big. WhenPm1is in the range of 0.15%-0.3%, the resonance frequency increases with the increase of microperforation rate. Therefore, the sound absorption coefficient is the best atPm1=0.25%. As shown in Fig. 18, the best noise attenuation volume also is achieved whenPm1=0.25%.
4.6 Influence of different perforation rates of micro-perforated plate 2 on noise elimination effect
With other parameters unchanged, only the perforation ratePm2of micro-perforated plate 2 is changed, which is set asPm2is 0.15%; 0.20%; 0.25%; 0.30%, respectively. Figure 19 shows the comparison of sound absorption coefficient and noise attenuation under different perforation rates of micro-perforated plate 2.

Fig. 19 Comparison of (a) sound absorption coefficient and (b) noise attenuation under different perforation rates of micro-perforated plate 2
As can be seen from Fig. 19, with the increase of the perforation rate of micro-perforated plate 2, the resonance peak value of sound absorption coefficient is almost constant, and the resonance frequency and the width of sound absorption band increase as well. Therefore, whenPm2is in the range of 0.15%-0.30%, the best perforation rate can be obtained if the range of the main noise frequency is known, but for the sound absorption band width and the high frequency noise between 2 500 Hz and 4 000 Hz,Pm2≥0.30% is appropriate. The best perforation rate isPm2=0.50% by further experiment.
4.7 Influence of different depths of cavity 1 on muffling effect
With other parameters unchanged, cavity 1 depthD1is 19, 20, 21, and 22 mm, respectively. Figure 20 shows the comparison of sound absorption coefficient and noise attenuation at different depths of cavity 1.

Fig. 20 Comparison of (a) sound absorption coefficient and (b) noise attenuation under different depths of cavity 1
As can be seen from Fig. 20, the resonance peak and sound absorption band width of sound absorption coefficient and noise attenuation increase slightly with the increase of cavity 1 depth. But when the depth increases to a certain extent, the resonance peak value and sound absorption band width decrease. The resonance frequency will move to the high frequency direction with the increase of cavity 1. It can be seen from Fig. 20 that the noise attenuation effect is the best whenD1is 21 mm. It can be concluded that the value of cavity 1 depthD1has little influence on the resonance peak value of its sound absorption coefficient, but it has certain influence on the resonance frequency and the width of the absorption frequency band. Therefore, the value of the cavity depthD1can be adjusted to meet the different requirements of the resonance frequency in the actual working conditions.
4.8 Influence of different depths of cavity 2 on noise attenuation effect
Only the depthD2of cavity 2 is changed,D2is 10, 20, 30, and 40 mm, respectively. Figure 21 shows the comparison of sound absorption coefficient and noise attenuation at different depths of cavity 2.

Fig. 21 Comparison of (a) sound absorption coefficient and (b) noise attenuation under different depths of cavity 2
As can be seen from Fig. 21, when other structural parameters are fixed, the change of cavity 2 depth has little influence on the resonance peak, the resonance frequency and the width of the sound absorption band, which can be almost ignored. However, after enlarging the calculated figure, it can be seen that the sound absorption coefficient and noise attenuation are the largest whenD2=40 mm. Therefore, it can be concluded that adjusting the depth of cavity 2 can not meet the different requirements of the main sound absorption band width and resonance peak of the resonant frequency in the actual working conditions.
4.9 Influence of different thicknesses of porous sound absorbing materials on noise attenuation effect
Making other structural parameters are unchanged, only the thickness of porous sound absorbing material is changed, andlais 10, 20, 30, and 40 mm, respectively. And the comparison diagram of sound absorption coefficient and noise attenuation as shown in Fig. 22 under different thicknesses of porous sound absorption materials is obtained.

Fig. 22 Comparison of (a) sound absorption coefficient and (b) noise attenuation under different thicknesses of porous sound absorbing materials
As can be seen from Fig. 22, when the thickness of sound absorbing material is small, the sound absorption effect is not good and the sound attenuation is low. However, when the thickness of sound absorbing material is rise, the sound absorption effect is improved, but the increase is limited. From the perspective of cost saving, it is more appropriate to choose 30 mm thickness of porous sound absorbing material.
4.10 Influence of noise attenuation under optimal structural parameters
According to the above analysis, each structural parameter of combination 2 is set asd1=1 mm,d2= 1 mm,l1= 27 mm,l2= 20 mm,Pm1= 0.25%,Pm2= 0.50%,D1= 20 mm,D2= 40 mm,la= 30 mm. The sound absorption coefficient and the noise attenuation of combination 2 in Fig. 23 can be obtained under the optimal structural parameters.

Fig. 23 Effect diagram of (a) sound absorption coefficient and(b) noise attenuation under optimal structural parameters of combination structure 2
5 Conclusions
In this paper, the research method of acoustic and electric analogy is adopted, and the structural parameters of the two new composite structures are compared and analyzed through MATLAB calculation, and the following conclusions are drawn: (1) Within a certain value range, the resonance frequency, the resonance peak and the sound absorbing band width of the sound absorption coefficient will increase or decrease with the change of the corresponding structural parameters in accordance with its law. Once the value range is exceeded, it will change in the opposite direction.
(2) The combined structure 2 has one more layer of micro-perforated plate than the combined structure 1, but the resonance peak value of the sound absorption coefficient and the maximum noise attenuation under the optimal structural parameters are both higher than that of the combined structure 1. The maximum noise attenuation of the combined structure 1 is about 75 dB, and the maximum noise attenuation of the combined structure 2 is about 87 dB. It shows that the more the layer of the sound absorbing material is, the more obvious the sound elimination effect is. However, the muffling frequency band width of the combined structure 2 is not as large as that of the combined structure 1, so the main muffling frequency band width of the combined structure 2 needs to be controlled by further changing its structural parameters. It also shows that it is feasible to use the multilayer sound absorbing materials as the body structure of the muffler.
杂志排行
Journal of Donghua University(English Edition)的其它文章
- Sentiment Lexicon Construction Based on Improved Left-Right Entropy Algorithm
- Expert Knowledge-Based Apparel Recommendation Question and Answer System
- Molecular Modulation of Structure and Ferroelectric Performance of Poly(vinylidene fluoride) Free Standing Films from Aspects of Molecular Weight and Crystallization Temperature
- Global Existence and Decay of Solution to Parabolic-Parabolic Keller-Segel Model in Rd
- Preparation of Polyaniline/Cellulose Nanofiber Aerogel for Efficient Removal of Cr(VI) from Aqueous Solution
- Consensus for High-Order Linear Multi-Agent Systems with Unknown but Bounded Measurement Noises