A Data Pipeline for Optical and Near-infrared Solar Eruption Tracer*
2022-01-10WangXinhuaChenDongDengTaoDaiHongbingXiangYongyuan
Wang Xinhua, Chen Dong, Deng Tao, Dai Hongbing, Xiang Yongyuan
(1. Yunnan Observatories, Chinese Academy of Sciences, Kunming 650216, China; 2. University of Chinese Academy of Sciences, Beijing 100049, China; 3. School of Information, Yunnan University, Kunming 650504, China)
Abstract:With the advent of large astronomical equipments, the traditional development model for data reduction faces problems such as redundancy of programs and conflicting environmental dependencies; Besides as a cluster is a highly coupled computing resource, serious environmental conflicts can lead to the unavailability of the entire cluster. To address this problem, we have developed a new pipeline framework using the concept of microservices. This paper presents the ONSET (Optical and Near-infrared Solar Eruption Tracer) data pipeline developed through this framework. To achieve near real-time data processing, we optimize the core program using MPI and GPU technologies and evaluate the final performance. The results show that this development model can be built in a short time to meet the requirements of the pipeline, and we believe that this development model has implications for future multi-band and multi-terminal astronomical data processing.
Key words: ONSET; data pipeline; container; GPU
1 Introduction
Large astronomical facilities lead astronomy to the era of big data. How to process these data become a major problem before the astronomical community at present. Hence, data pipeline is one of the key means for astronomers to understand the data.
Normally, a data pipeline will be developed in either monolith or modular way. The pros and cons of these 2 approaches has been discussed for years. And modulization design for data pipeline is the main stream up to now. Besides, deploying a data pipeline is troublesome problems for most of time, as the dependency and other problems may arise with regard to OS of your platform.
In order to tackle this situation, we try to apply a new framework based on virtualization technology for data pipeline development for ONSET at FSO (Fuxian Lake Solar Observatory). Some details of this new framework will be discussed in this paper. In section 2, we introduce the basic information of ONSET, some details of data pipeline based on new framework is presented in section 3. Then in section 4 and 5, we show result of using CUDA for near-realtime data processing. Finally, we briefly discussed some possible improvements for the data pipeline for ONSET.
2 Overview of ONSET
The Fuxian Lake Solar Observatory is located in Yunnan, China. FSO has two telescopes, Optical and Near-infrared Solar Eruption Tracer (ONSET)[1]and 1 m New Vacuum Solar Telescope (NVST). ONSET is jointly developed by Yunnan Observatories and Nanjing Institute of Astronomical Optics Technology, and funded by Nanjing University. Its effective diameter is 275 mm and observe the sun in three wavelength: He I 1 083 nm, Hα and white-light at 360 nm and 425 nm. Table 1 lists the channels of ONSET. The corona, chromosphere and photosphere can be observed simultaneously in a full-disk or partial-disk solar with a field of 10″. At present,
there are two acquisition cameras,namely Andor Neo and Flash4.0 V3. Neo′s conventional observation mode is to collect 10 sets of full-plane or partial images of the sun every minute, with an image size of 852 × 852; Flash′s regular observation mode is to collect 10 sets of full-plane or partial images of the sun every 30 s, with an image size of 1 700 × 1 700.150 frames per group.Data volume is shown in Table 2.

Table 1 Channels of ONSET
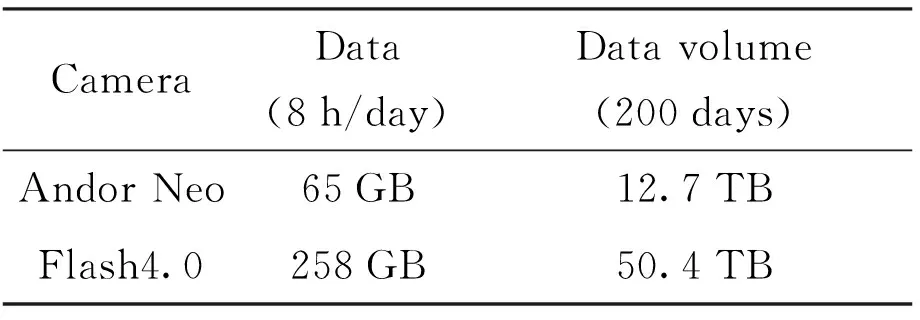
Table 2 Sampling rate of ONSET
Since the data of ONSET and NVST have similar data processing flow, the pipeline framework designed can be used to develop the pipeline of ONSET. This has the advantage of reducing repetitive work and accelerating pipeline deployment. Next we describe the development of the ONSET pipeline.
3 Data pipeline for ONSET
At present, data products of ONSET are classified into three levels:
• Level 0 data: raw data, unprocessed data collected by the cameras.
• Level 0.5 data: level 0 data calibrated by flat and dark processing, then using frame selection and reconstruction by speckle interferometry and speckle masking.
• Level 1 data: According to filed situation of observations, add headers to level 0.5 data and save them in FITS format. Level 1 data is science-ready data and can be used for scientific research.
Transfer Node is responsible for saving the raw data to the storage device and sharing the mounting point to computing center via a high-performance network (10 GbE). Finally, the raw data is processed into science-ready data by computing center. Then science-ready data is archived through distribution node that show in Fig.1.
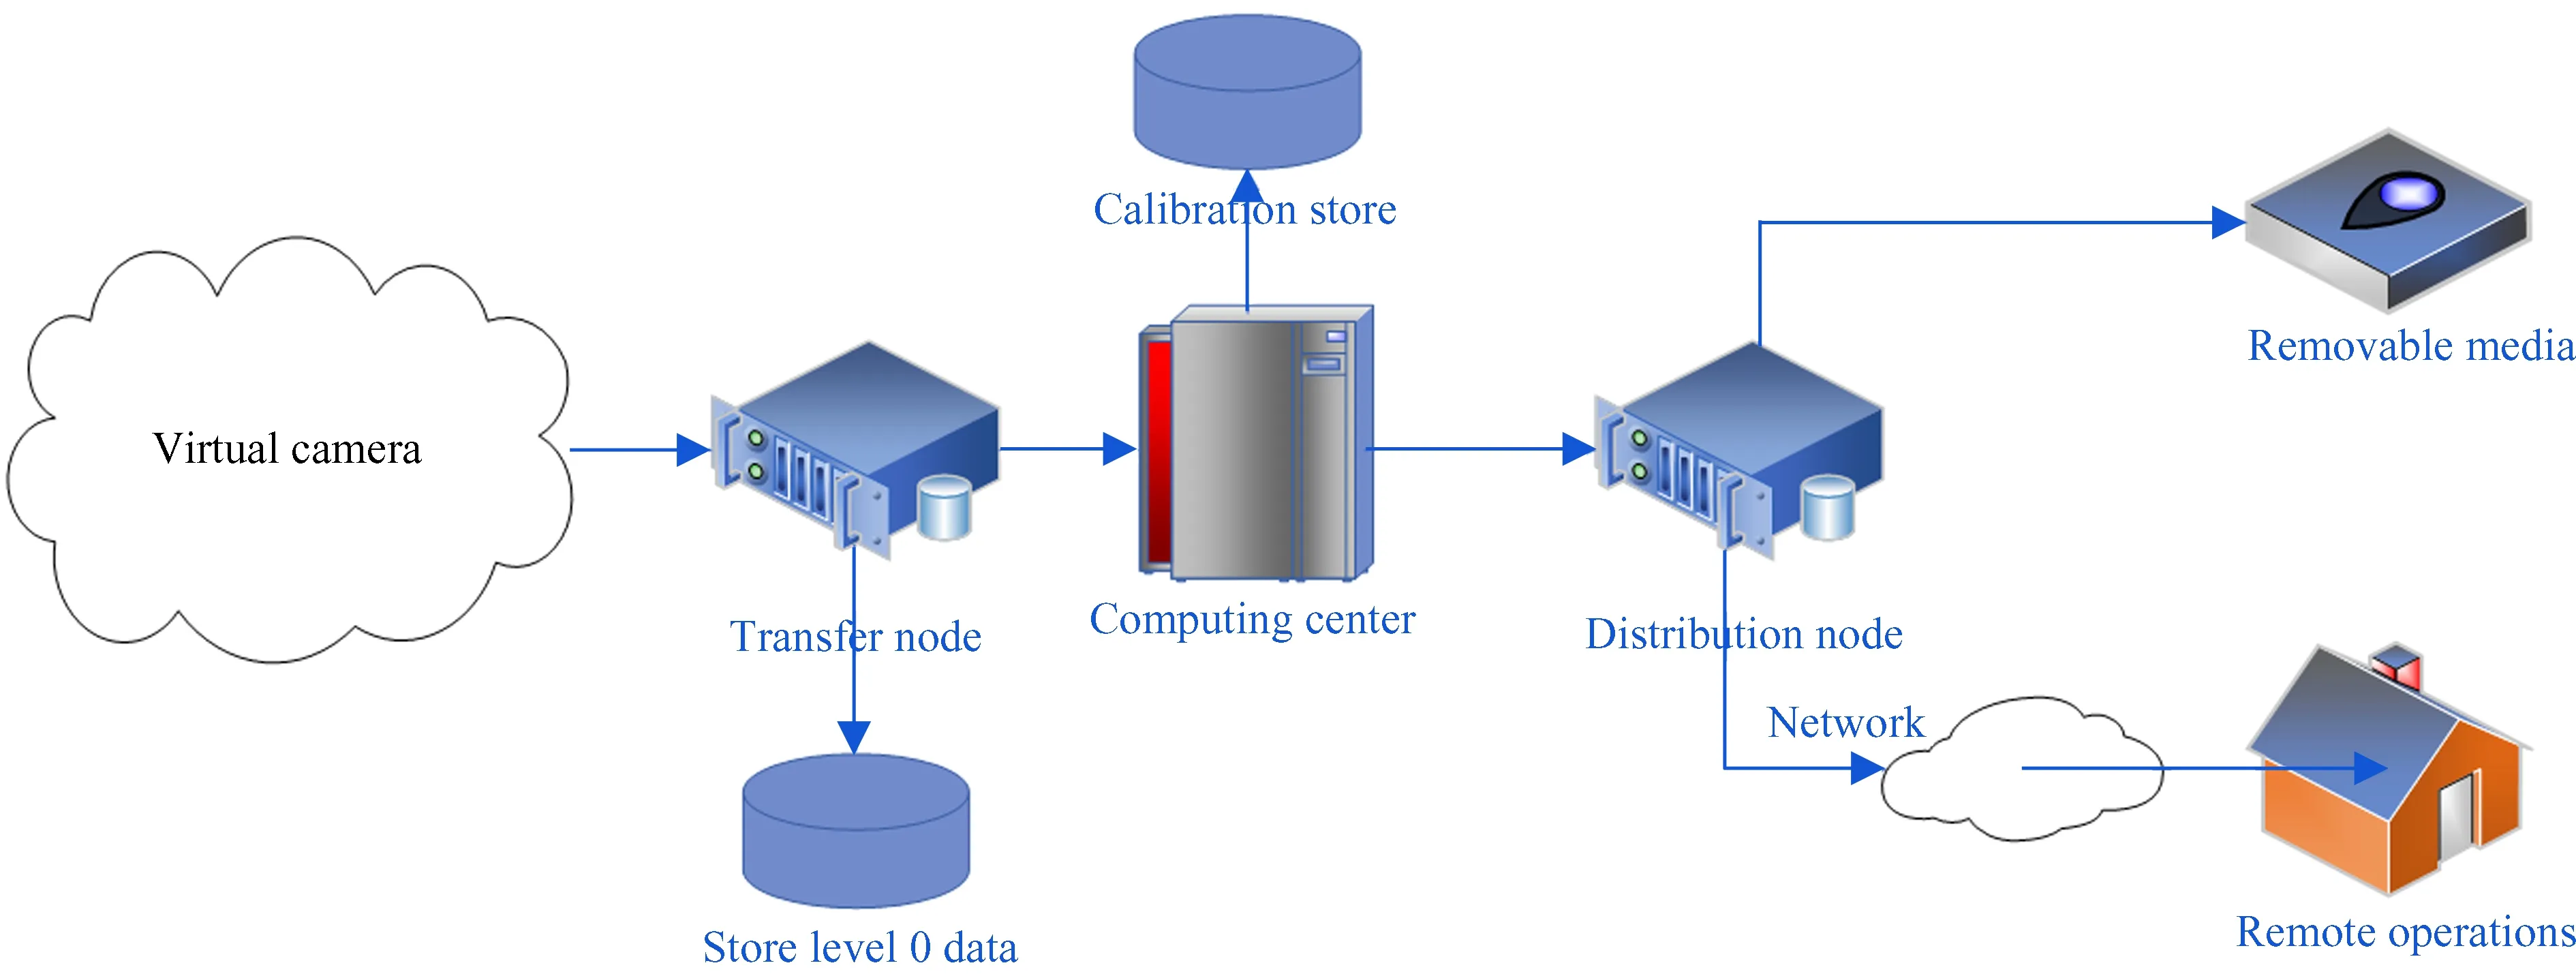
Fig.1 Diagram of ONSET hardware structure
In October 2020, ONSET decided to develop a new data pipeline. The requirements of this new pipeline is as follows:
(1) Using speckle-masking method to process all the data acquired at ONSET;
(2) At the beginning of development, ONSET will provide a Dell R730 server (56 cores + K40 GPU) for test; and finally the 8 h daily observation is required to be processed within 3-5 days after observation;
(3) The development of data pipeline will be based on Python;
(4) The quality of science-ready data will be assessed by the scientist from ONSET;
3.1 Algorithm
At present, speckle mask[2]and speckle interferometry[3]are the most widely used in high-resolution solar image reconstruction. The implementation is as follows. Speckle interferometry is used to reconstruct amplitude and the speckle masking reconstructs the phase. The high-resolution reconstructed images with this algorithm were termed Level 0.5 data at ONSET, or science-ready data. The algorithm flow chart is shown in Fig.2[4].

Fig.2 Level 0.5 algorithm of ONSET
3.2 Pipeline configuration file
The pipeline configuration file provides the ability for a user-defined pipeline structure in YAML format. The YAML format is a highly readable format for expressing data serialization and is ideal for writing configuration files. The keywords of pipeline configuration file is shown in Table 3.

Table 3 Pipeline configuration file keywords
The data exchange of microservices in data pipeline is based on ZeroMQ′s message forwarding mechanism, so users need to determine the connection relationship between microservices and bind ports and required resources through pipeline configuration file then pipeline parser will generate executable script according to the pipeline configuration file, support scaling and automatically submit tasks.
3.3 Containerization of microservices
The most important concept in our new framework is microservices, which first came from the Internet and refers to applications that can handle specific requests and are relatively independent of each other. One of the benefits of microservices-based development is to decouple complex functional relationships into multiple subfunctions that are single-functional and easy to maintain, so that the number of corresponding microservices can be dynamically increased or decreased to achieve scaling when the load changes. More and more programs moved from the original host environment or virtual machine environment as a carrier to the container as a carrier[5-6]. After research we choose Singularity, a high-performance container technology developed by Lawrence Berkeley National Laboratory specifically for large-scale, cross-node HPC (High-Performance Computing) and DL (Deep Learning) workloads[7].
Our framework is to combine the term of micro-
services and functions of pipelines wrapped with Singularity. Each microservices is a function in the data reduction wrap in a Singularity image. Besides other known advantages, another advantage of this framework is to increase the performance of the pipeline through scaling by using message passing model. In theory, GPU have more computing power than CPU but to achieve 100% GPU performance requires proficiency in grid computing and other professional GPU programming knowledge. In order to release the power of GPU, our solution is to use message preemption mechanism, which could increase GPU resource utilization through scaling by means of peripheral acceleration and significantly reduce data processing time. The data processing speed is linearly related to the number of microservices without exceeding the graphics memory, as shown in Fig.3. It can significantly improve GPU resource utilization when GPU resource utilization is low.

Fig.3 Utilization rate of the GPU
The carrier of microservices is containers. The introduction of container technology in the pipeline solves the environment dependency problem that has long plagued developers and further increases the portability. The data pipeline consists of two modules:
• Coordinator: prepare data for other microservices
• Pipeline parser: parse the defined pipeline configuration file, turn it into a PBS, slurm or standalone script and submit the task
We decouple the pipeline into microservices as follows
• Dark: dark fielding the raw data.
• Flat: flat fielding the raw data.
• matching: matching the data with off band.
• core1: level1 algorithm for 656.3 nm.
• core2: level1 algorithm for 360 nm and 425 nm
The pipeline structure diagram based on the container is shown in the Fig.4.

Fig.4 The pipeline structure diagram based on the container
Microservices bind port through Pipeline_API, the main programs are shown in Table 4.

Table 4 Code implementation of bind port through Pipeline_API
4 GPU processing within mpi4py
It will take a large number of short-exposure images with high-frequency information during every observation at ONSET. Then we adopt the speckle masking method to reconstruct the phase of the image, and speckle interferometry to reconstruct the amplitude of the image. The speckle mask method involves the calculation of a 4-dimensional double spectrum and phase recursion, which are very time-consuming. Hence we tried to use GPU and MPI technology to speed up the processing time of the program. The flow chart of core algorithm is shown in Fig.5.
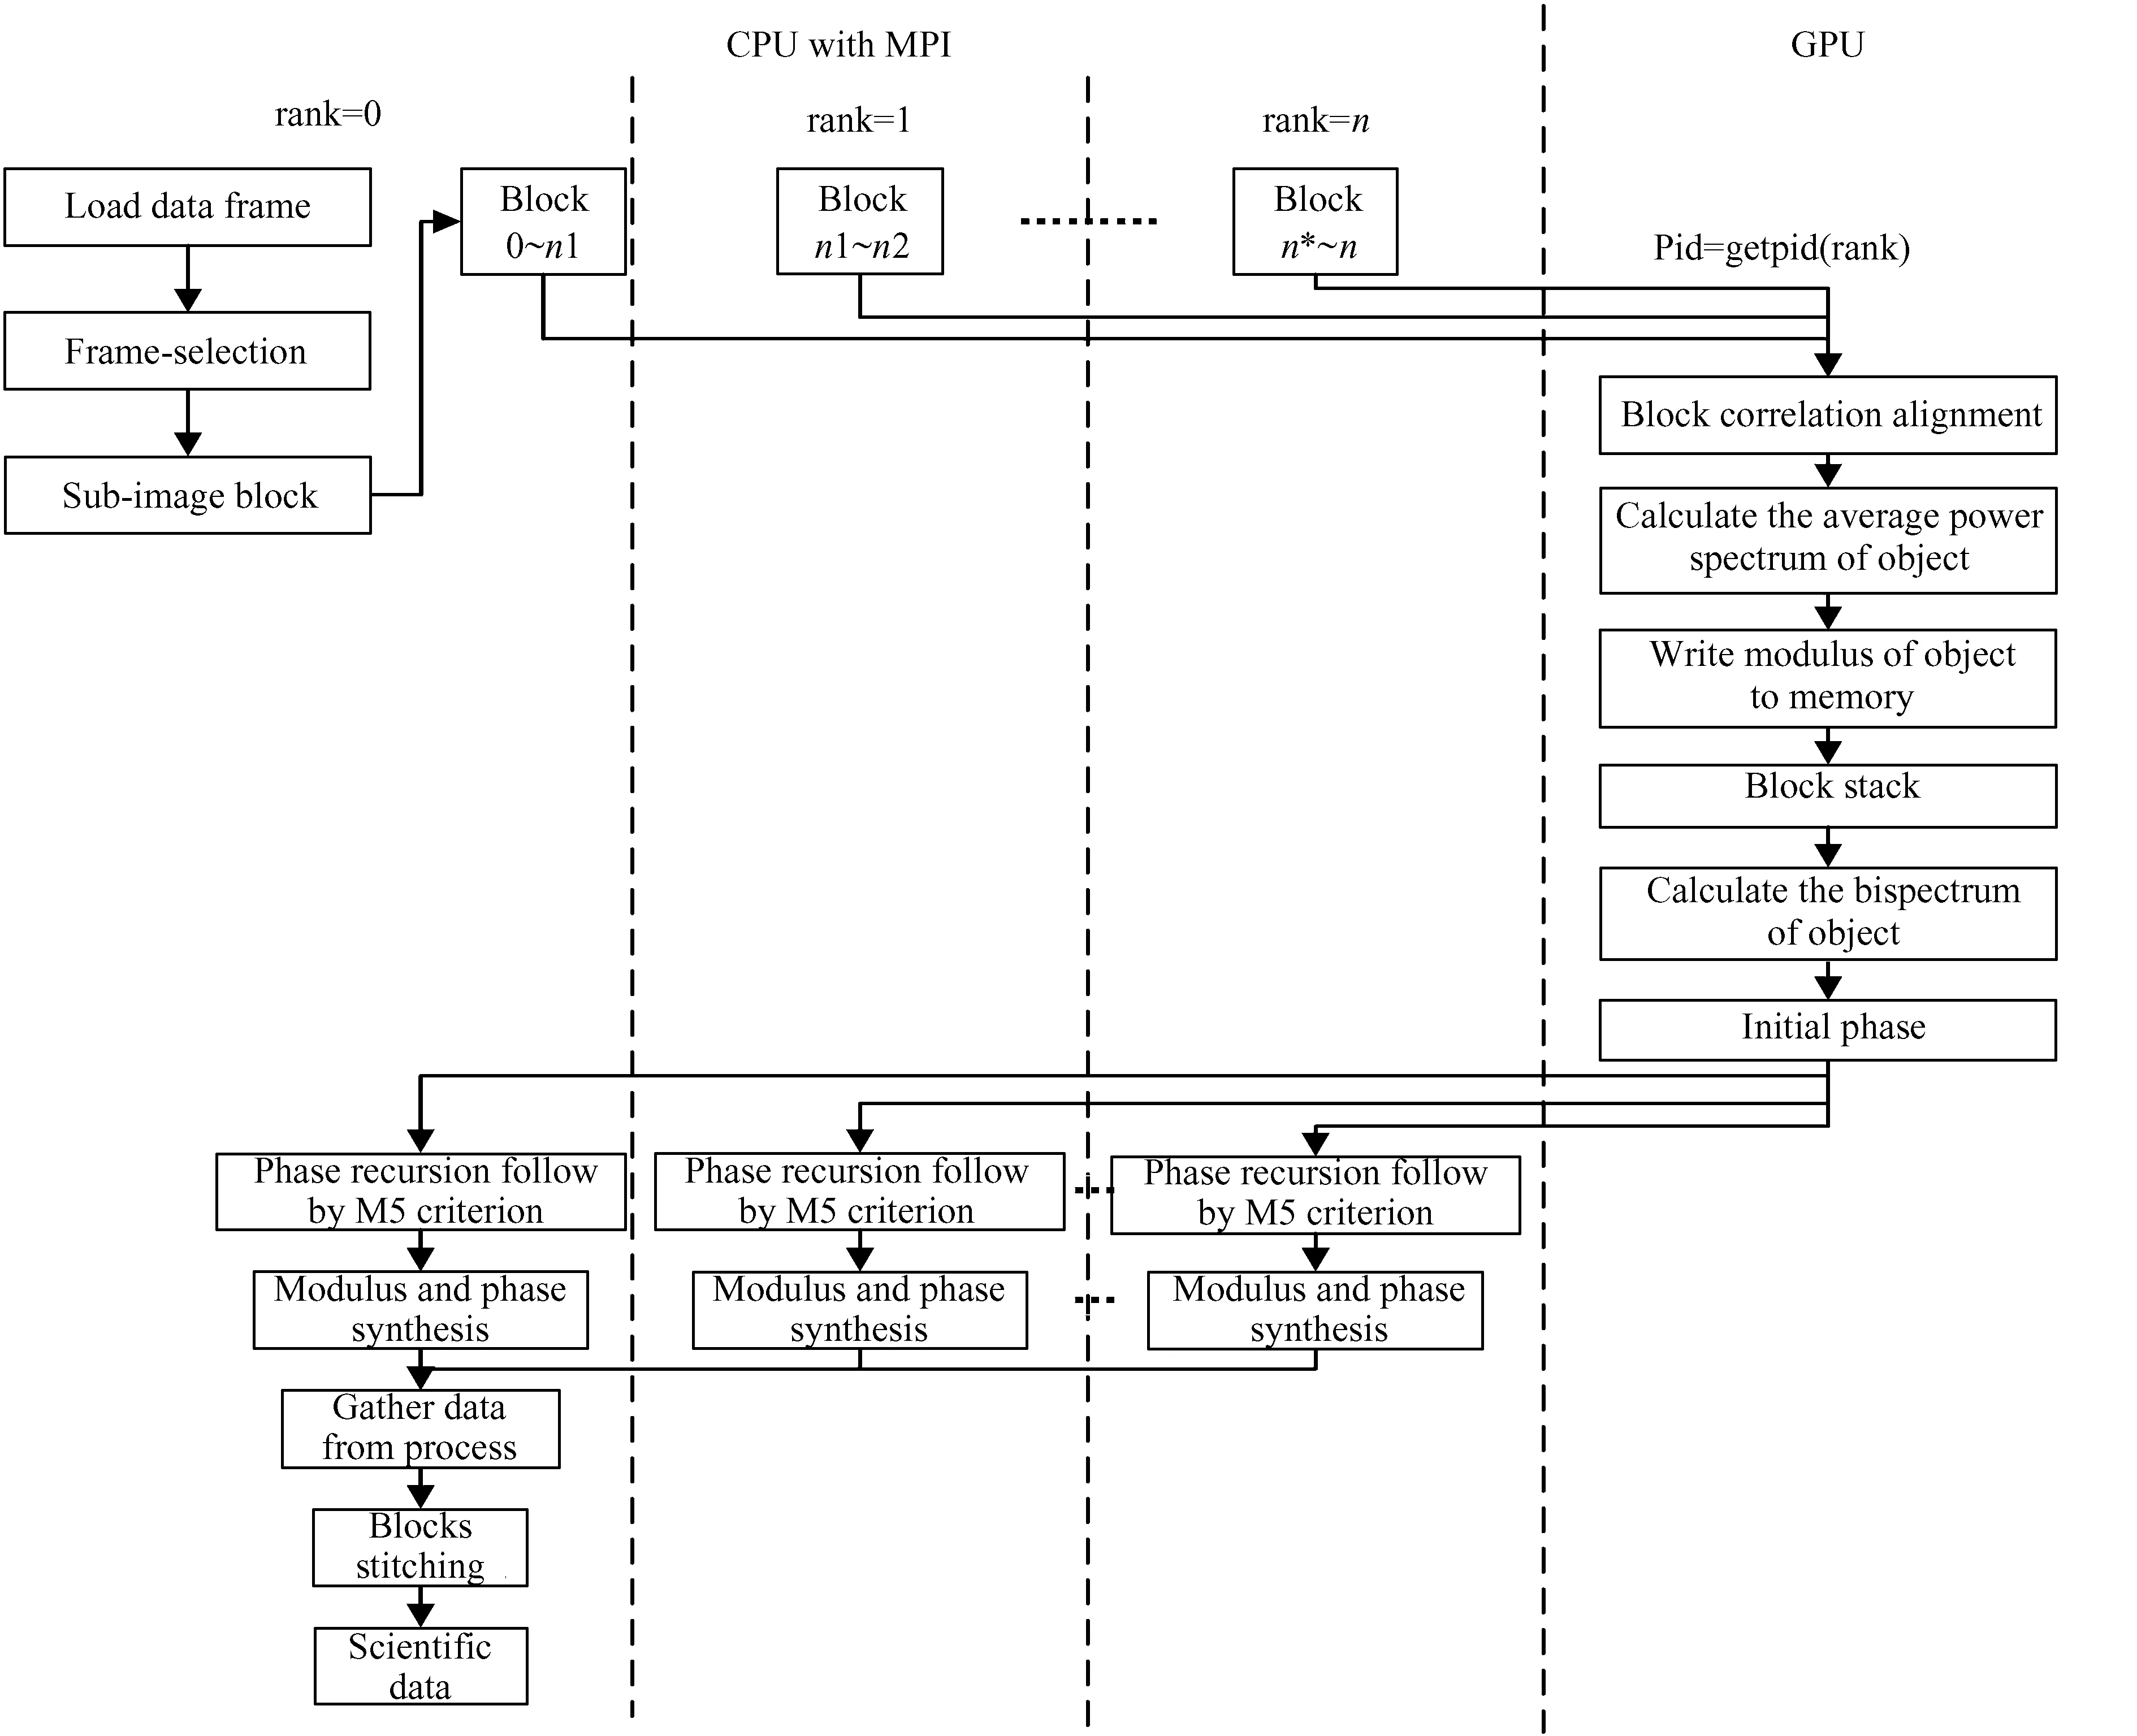
Fig.5 Flow chart of core algorithm based on MPI and GPU
Within the ONSET program, the whole flow includes these steps: image preprocessing, initial image alignment, seeing estimation, speckle interferometry transfer function calculation, image block processing, image stitching, and one of the most time-consuming process in the entire program is the image block processing. After analysis, we decide to use the CUDA architecture from Nvidia GPU to execute block processing in parallel. While improving GPU utilization, we also found that CPU utilization is at a low level. In order to improve CPU utilization, the MPI programming model is adopted. Fig.6 provides common methods of MPI.
In MPI programing model, one important thing to do is to scatter tasks to each node. In our case, that means to scatter the tasks of image sub-block processing all over the nodes. The master node will divide the aligned observation images into sub-block groups; then it will assign the sub-block calculation tasks to the slave nodes. The master and slave nodes are responsible for calculating the sub-block processing, and the results of the master and slave node calculation will return to master node. But there is a limitation in MPI which impedes parallelization of data chunks with more than 231=2147483648 elements because the MPI standard uses Cintfor element count, which has a maximum value of 231for positive value[8]. When object is bigger than that, the function will report an error. To avoid this, we divide the whole data into two part for separate processing. To make a reasonable task allocation, it will first need to calculate the length of the task by the master node, and divide the length of the task by the number of cores involved in the calculation. If it can be divided, we use the scatter function and send it to each slave node evenly. If it can′t be divided, this article uses the method of adding an empty array to make it can be divided, and then use the scatter function to evenly send it to each slave node. The subsequent calculations will start, and each node returns the corresponding result part to the master node, and pseudo code is shown in algorithm 1.

Algorithm 1 Strategy for scatter1: procedure DIVIDE_TASKS(tasks_list, cores)12: end if2: task1_list ← None13: end if3: task2_list ← None14: thread_tasks=scatter(task1)4: cores ← cores15: result_mid1=startReconstructed(thread_tasks)5: if comm_rank == 0 then16: result_final=gather(result)6: task1_list ← tasks[:int(0.5*len(tasks_list))]17: thread_tasks=scatter(task2)7: task2_list ← tasks[int(0.5*len(tasks_list)):]18: result_mid2=StartReconstructed(thread_tasks)8: if len(task1_list)//cores !=0 then19: result_mid3=gather(result)9: Padding(task1_list,0,cores)20: APPEND(result_final,result_mid3)10: else if len(task2_list)//cores !=0 then21: return result_final11: Padding(task2_list,0,cores)22: end procedure
5 Result
In order to test our data pipeline, we used GPU + CPU and CPU to process the WH data for test. The whole environment is list here:
Hardware: Intel(R)Xeon(R)Gold 5115 CPU @ 2.40 GHz x2, 128 GB RAM, GeForce RTX 2080Ti 11 GB x4;
Software: Ubuntu 16.04.6 LTS, CUDA 10.1, GPU driver 430.40, Singularity 3.5.0, OpenMPI 1.10.7, Python 3.6.10.
Ten sets of 50 frames (1 700 × 1 700 pixel) of WH-band data on October 10, 2020 were selected, and each frame was chunked in an overlapping fashion with 2 704 blocks (96 × 96 pixel) in each set. The execution time is averaged for ten sets of data. Experiments have shown that CPU + GPU can improve program execution speed compared to CPU mode,and the results are shown in Table 5.The introduction of MPI and
GPU not only brings about performance improvement, but also consumes some time due to data preparation and MPI initialization. The statistical results are shown in Table 6. The result is that a small amount of data transfer between the CPU and the GPU does not incur significant performance costs, but using MPI to collect data and initialize parameters imposes a significant performance overhead.
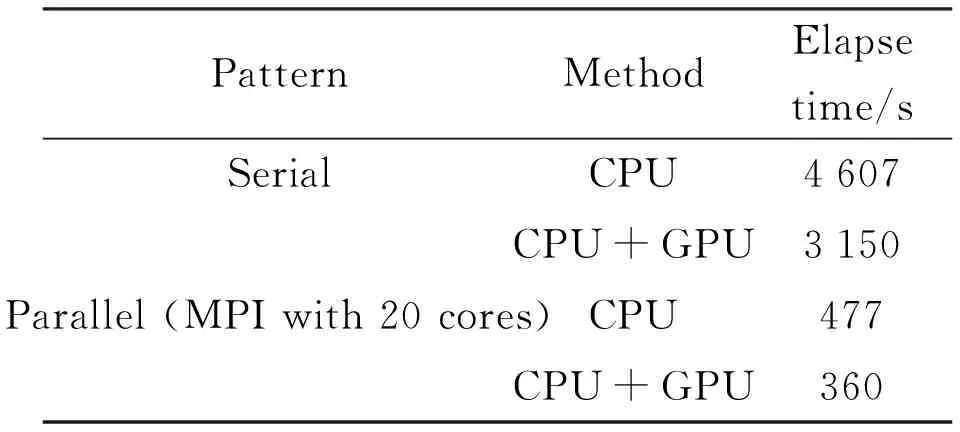
Table 5 Optimization results in two methods
To test the efficiency of the program optimization, we tested the effect of the number of processes on execution efficiency in GPU + CPU mode and CPU mode, and the results showed that the program running efficiency was less sensitive to the number of processes than in CPU mode when using GPU + CPU mode. Fig.7 shows the result. In order to show the reconstruction results, we selected Hα and white band data respectively. The result is shown in Fig.8.

Fig.7 Acceleration ratio (a) and execution time (b) in CPU and CPU + GPU mode with different number of processes

Fig.8 Original images (left) vs Reconstructed images (right)
6 Conclusion & discussion
In this article, we develop the prototype data pipeline using a container-based pipeline framework for ONSET and optimized the original CPU program using the GPU, resulting in a significant speedup of the original program. We are planning to deploy the data pipeline in near future. ONSET′s GPU server contains a tesla K40m GPU and Xeon (R) CPU E5-2680 v4 @2.4 GHz (56 cores). It takes 53 s to reconstruct a set of Hα-band images and 250 s to reconstruct a set of WH-band images in this environment, so a day′s worth of data (8 h) takes about 14 h (Hα) and 66 h (WH) to process respectively. And the timing requirement for data reduction at ONSET is reached.
For the whole image reconstruction at ONSET, the multiple layers of judgement and loops required by the image phase reconstruction is the most time-consuming. Obviously this logical operation is more efficiently executed by the CPU than the GPU, we are working on how to speed up this process with CPU now. In general, further improvements to the algorithm are necessary to enable near-realtime processing.
From our practice, it is found that this development model allows flexible modifications to the microservices, which enables to add more required functionality to the pipeline in time without having to modify the entire program. We believe that this container-based development model will save a lot of time both in the development and deployment of the astronomical data pipelines, while astronomical facilities are now moving towards multi-terminal and multi-wavelength.