Fast Marching Method for Microseismic Source Location in Cavern-Containing Rockmass: Performance Analysis and Engineering Application
2021-12-25RuochenJingFengDiYiLiuAngLi
Ruochen Jing, Feng Di,*, Yi Liu, Ang Li
a State Key Laboratory of Hydraulics and Mountain River Engineering, College of Water Resource and Hydropower, Sichuan University, Chengdu 610065, China
b School of Highway, Chang’an University, Xi’an 710064, China
ABSTRACT
Keywords:Fast marching method Microseismic event location Cavern-containing complex rock mass Runge–Kutta method Microseismic (MS) event locations are vital aspect of MS monitoring technology used to delineate the damage zone inside the surrounding rock mass. However, complex geological conditions can impose significantly adverse effects on the final location results.To achieve a high-accuracy location in a complex cavern-containing structure,this study develops an MS location method using the fast marching method(FMM) with a second-order difference approach (FMM2). Based on the established velocity model with three-dimensional (3D) discrete grids, the realization of the MS location can be achieved by searching the minimum residual between the theoretical and actual first arrival times. Moreover, based on the calculation results of FMM2, the propagation paths from the MS sources to MS sensors can be obtained using the linear interpolation approach and the Runge–Kutta method. These methods were validated through a series of numerical experiments. In addition, our proposed method was applied to locate the recorded blasting and MS events that occurred during the excavation period of the underground caverns at the Houziyan hydropower station.The location results of the blasting activities show that our method can effectively reduce the location error compared with the results based on the uniform velocity model.Furthermore, the obtained MS location was verified through the occurrence of shotcrete fractures and spalling, and the monitoring results of the in-situ multipoint extensometer. Our proposed method can offer a more accurate rock fracture location and facilitate the delineation of damage zones inside the surrounding rock mass.
1. Introduction
Underground excavation activities can inevitably result in a stress redistribution of the surrounding rock,incurring the generation of cracks and an elastic energy release of rocks.As an effective real-time monitoring method, the microseismic (MS) monitoring technique can be used to detect released stress waves by MS sensors installed inside the rock-mass and obtain rock fracture features based on various geophysical inversion strategies. It can also provide an early warning of impending geo-hazards such as rockbursts and allow certain real-time support measures to be taken in advance to ensure the safety of a construction [1–3]. At present, this real-time and three-dimensional (3D) monitoring technology has been widely applied in various fields of rock engineering, such as mines [4–6], deep tunnels [1,3], rock slopes[7–9], and underground powerhouses [10–12].
The MS source location is of great importance and lays the foundation for the application of MS monitoring technology in engineering projects [13,14]. The interpretation of MS activities incurred during rock engineering depends significantly on the accuracy of the MS source location.An accurate and quick location method can be used as a guide to precisely portray the distribution of the fracture network in the surrounding rocks.Further inversion based on the fracture sources reveals the deformation or failure pattern of the surrounding rock mass, which can offer an early warning of rock instability to reduce the casualties and damage to the equipment. Research on MS fracture source locations has been a subject of intense interest in the field of MS monitoring.
The determination of the velocity model plays a vital role in the MS source location. Under the condition of a small monitoring range and uniform lithology, a single-velocity model is usually adopted to locate MS events by virtue of a fast and stable realization, which is widely applied in numerous rock engineering projects.The earliest source location method based on mathematical calculations is the so-called Giger method,which converts the location problem to solve linear equations based on the arrival time of the collected MS signals[15].Subsequently,with the rapid development of calculation methods and techniques, some improved approaches have been proposed and developed based on this idea [16–18]. These classical improved location methods,such as the relative location method and join hypocenter determination, further improve the location accuracy, as summarized in Ref. [19]. However, this may cause significant location errors in relatively complex geological environments.
In recent years,some methods have been proposed to meet the needs of MS source locations in rock engineering projects affected by complex geological environments. Dong et al. [20,21] proposed several source location methods applied in underground mines,including multi-step location and 3D comprehensive analytical methods.Subsequently,Dong et al.[22]and Hu and Dong[23]proposed a velocity-free MS/acoustic emission (AE) source location method for irregular complex structures using the A* search algorithm. Feng et al. [24] developed a sectional velocity model to locate the MS fracture source and systematically studied the feasibility of two location methods, significantly reducing the average location error [25]. Castellanos and Van der Baan [26] proposed a cross-correlation location method based on a similar waveform in mines.Gong et al.[27]developed an anisotropic velocity model in the MS event location of a coal mine, which can offer a more accurate fracture location compared with the single velocity model.In addition,some researchers have converted the MS source location into high-dimensional optimization problems and used an equivalent velocity model to locate MS events. This approach inevitably introduces additional variables into the search process,and heuristic algorithms, such as the genetic algorithm [28] and gravitational search algorithm [29], have therefore been introduced to obtain the fracture source and equivalent velocity [30].However,there are still some challenges when an MS location task is conducted in large-scale underground caverns.First,the existing methods cannot accurately locate MS events in arbitrarily complex velocity models. Second, the excavation of underground caverns,particularly large-scale models, produces large empty areas with irregular shapes.Simple equivalent models cannot deal with these factors, thereby negatively affecting the final location results.
In this study, we develop a new MS source location method to achieve MS event locations in a complex cavern-containing velocity model.A grid-based model is established in which different grid nodes are given different P-wave velocities to reflect the complex velocity distribution. Subsequently, a fast marching method(FMM)with a second-order difference(FMM2)is introduced to calculate the theoretical arrival time of waves radiated from fracture sources.Based on the MS signals collected in the field,the location realization can be achieved by searching for the optimal grid node with the smallest residual between the theoretical and actual arrival times. The methodologies used in this study are introduced in Section 2, the performance of which are analyzed based on some numerical experiments in Section 3.Representative cases of blasting and MS event locations at the Houziyan hydropower station during an underground cavern excavation are presented to further demonstrate the potential application of the proposed method.Finally, the main conclusions are summarized in the last section.
2. Methods
In this section,we present the calculation of the theoretical arrival time using FMM2. A certain target function is employed to obtain the residual between the theoretical and actual arrival times to achieve the MS event location. Furthermore, the linear interpolation strategy and Runge–Kutta method are adopted to obtain the ray paths between the fracture sources and MS sensors.
2.1. FMM2
For MS monitoring in underground caverns, the arrival time of P-waves is usually employed to locate MS events. In this study,FMM2 is adopted to calculate the theoretical first arrival time,which is a practical grid-based technique using the finite difference approach within the discretized domain [31,32]. This method can effectively avoid some inherent problems existing in other ray tracing methods based on shooting [33] or bending [34]approaches. In an isotropic medium, the elastic wave equation of the P-wave can be expressed as

where φ is the scalar potential function, v is the P-wave velocity,and t is time. The general solution of differential Eq. (1) can be expressed as follows:

where i is the imaginary unit, A is the amplitude function,ω is the angular frequency,and T is the first arrival time.The set of the same T values indicates the equiphase surface of MS/seismic waves. The value of ∇2φ is expressed as follows:
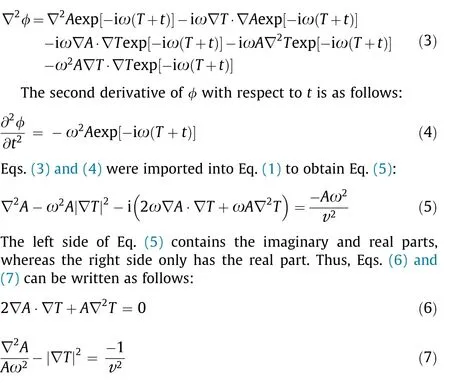
Eq. (6) is the propagation equation and is used to calculate A.Eq. (7) can be simplified as an Eikonal equation (Eq. (8)) based on a ‘‘high-frequency approximation” (ω →∞).

where T and v indicate the first arrival time of the MS/seismic Pwave and the P-wave velocity, respectively, which are functions of position (x, y, z).
At present, the Eikonal equation cannot be analytically solved,although some numerical solution methods are available. FMM uses Eq. (8) to obtain T by converting a differential equation into a difference equation based on the finite difference approach.Consequently,the original calculated region is converted into grids and nodes. According to relevant geological survey data, the corresponding grid nodes of the rock mass and empty areas are assigned corresponding P-wave velocities.Sethian and Popovici[35,36],and Chopp [37] further introduced the entropy satisfying upwind scheme to deal with the‘‘gradient discontinuities”problem,which helps the FMM accurately simulate the propagation of P-waves.The difference form of the Eikonal equation can be written as follows:
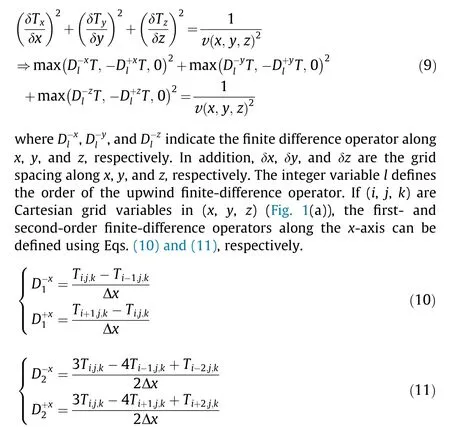
Furthermore, the same difference schemes were employed along the y- and z-axes (Fig. 1(a)). In FMM2, the operator used depends on the availability of the second-order allowed. Secondorder schemes revert to first-order schemes if T is unavailable,for example,near a source point or on the boundary of the region.
Eq.(9)describes the difference approach for calculating the first arrival time in certain grid nodes. A successful implementation of this approach requires the correct order in which the calculated nodes are consistent with the direction of the P-wave. For FMM,the propagation of P-waves can be achieved using a narrow-band approach to calculate the arrival time from the upwind to downwind areas, the concept of which is illustrated in Fig. 1(b). All grid nodes are labeled as either alive, close, or far. The arrival time of alive points is obtained and lies upwind of the narrow band. Close points lie in the narrow band and obtain trial values of the arrival time using Eq. (9). Far points lying downwind of the narrow band have no calculated arrival times. The narrow band is expanded by finding a close node with the minimum arrival time, labeling it as alive, and converting all neighboring far points as close points.Then, the arrival times of all close points adjacent to the new alive points can be calculated using Eq. (9). The shape of the narrow band can be regarded as the first arrival wavefront of the Pwave, and the above calculation process is repeated until all grid nodes are labeled as alive.
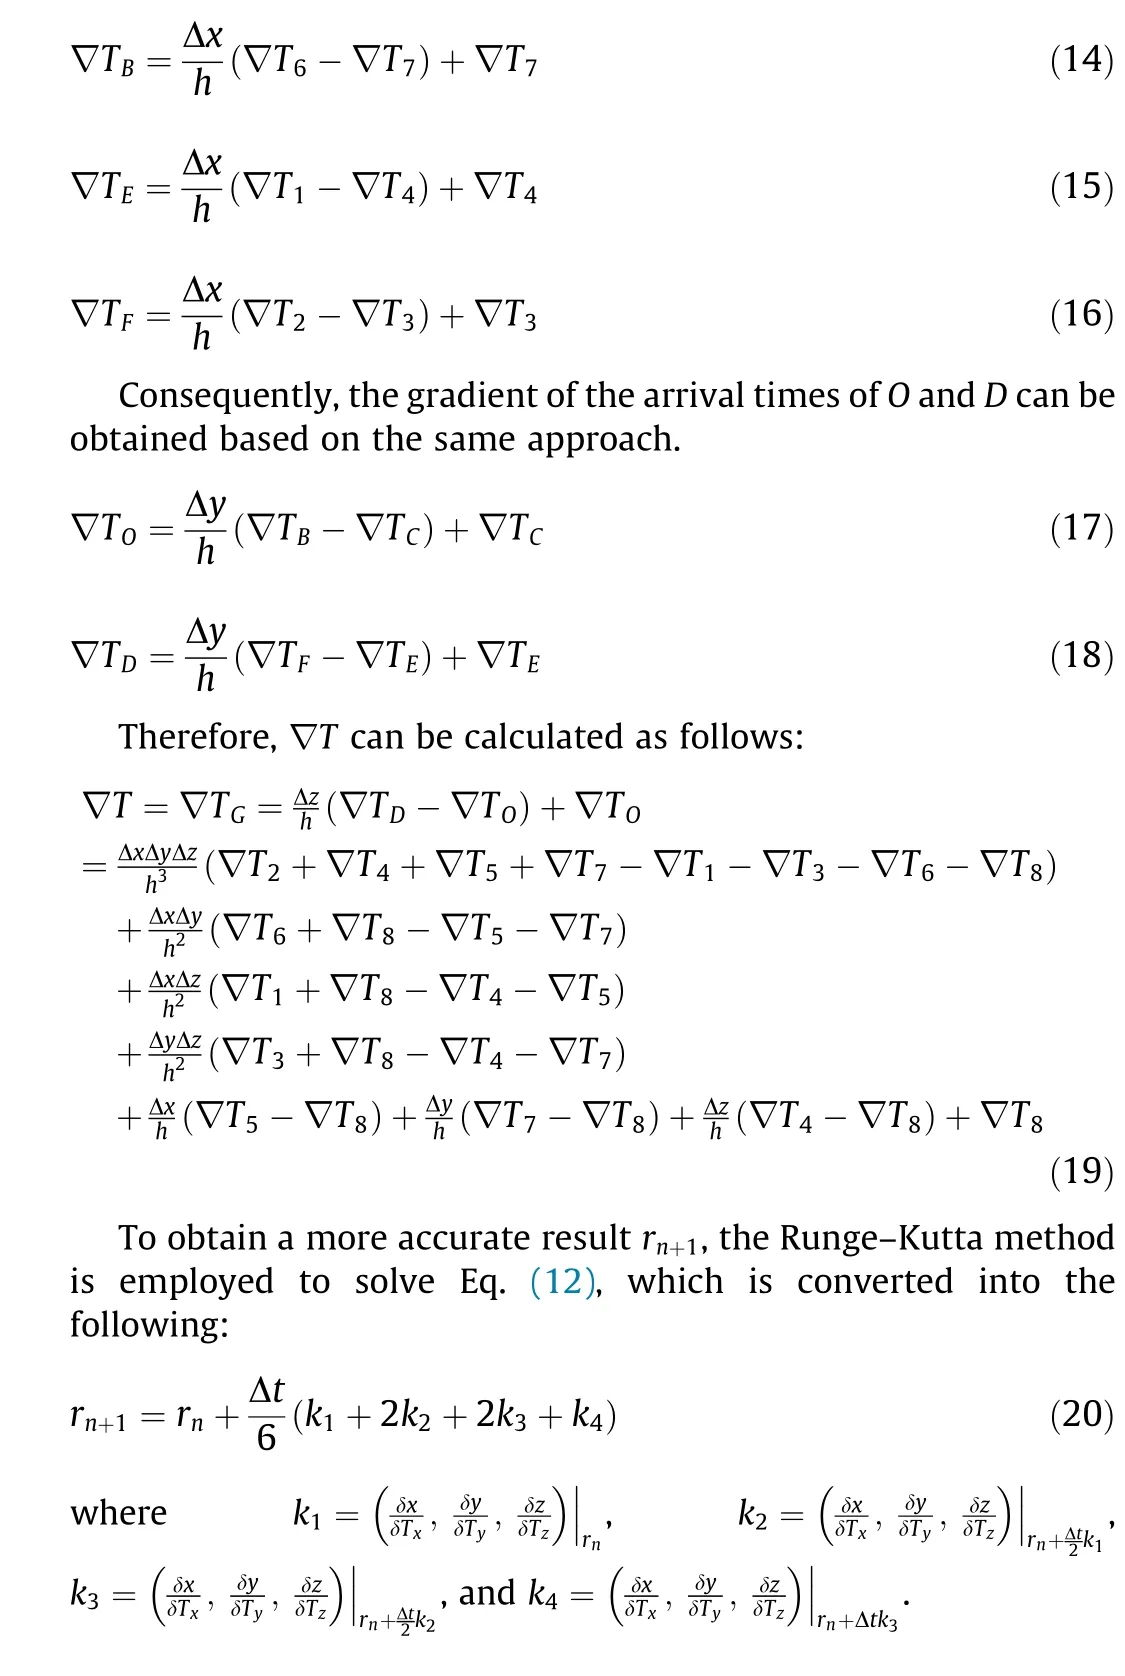
2.2. Ray-path tracing
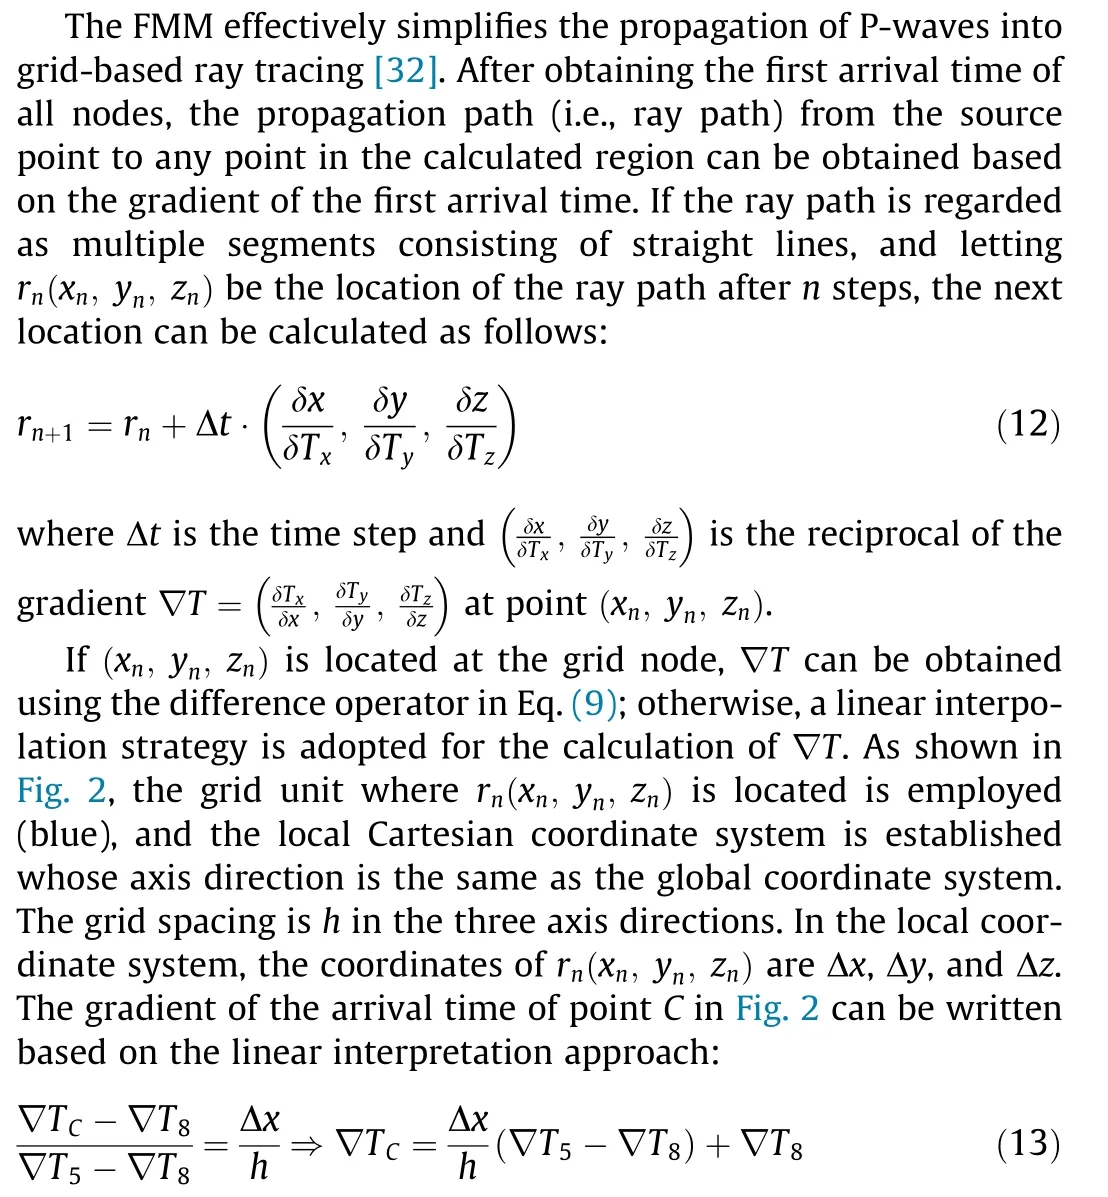
where h is the grid spacing.Similarly,the gradient of arrival time of B, E, F can be expressed as follows:
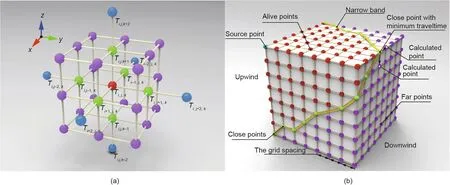
Fig.1. The realization of FMM2 calculation.(a)Scheme of second-order difference approach in FMM2;(b)the global implementation strategy of FMM using the narrow band technique.

Fig. 2. The calculation of the gradient based on linear interpolation strategy.
2.3. Location strategy
The realization of the MS source location is achieved by searching the minimum residual between the theoretical and actual first arrival times. If the induced MS event that occurs at time t0goes through Δtiand reaches the ith MS sensor at time ti, the residual ξifor the ith MS sensor between the theoretical and actual arrival times should satisfy the following:

where tican be obtained by picking the actual arrival time of the collected MS signal in rock engineering projects, Δtiis calculated using FMM2 in this study, and t0cannot be obtained using only one MS sensor. To eliminate the negative impact of t0on the MS location, multiple MS sensors should be adopted, and the residual for different sensors can be defined as follows:

where ξiand ξjare the residuals for the ith and jth MS sensors,respectively. Although ξi,jis equal to zero under ideal conditions,it cannot be achieved owing to various factors (e.g., P-wave picking and the calculation of Δtiand Δtj). However, compared with other points in the monitoring region, the MS source point can result in the absolute value of ξi,jreaching the minimum. Therefore, the realization of the MS source location can be achieved by searching the point at which the residual for different sensors reaches the minimum. In other words, Δt from all grid nodes in the velocity model to each MS sensor is calculated using FMM2, and the MS source can be located by searching the minimum residual and the corresponding point based on the selected actual arrival time. Herein, we take the target function f to quantify the residual based on the least squares method, as shown in Eq. (23):

where (x, y, z) is the coordinate of any grid node in the velocity model. The MS source point can result in f reaching the minimum.
The complete location process is summarized as follows:
Step 1: The velocity model is built and P-wave velocities are assigned to all grid nodes.
Step 2: The theoretical arrival time is calculated from all grid nodes to each MS sensor using FMM2.
Step 3:The value of the target function f is calculated based on the actual arrival time in practice.
Step 4:The first few minimum values of f and the corresponding points are searched.The average coordinates were regarded as the MS source location.In this study,we take the first ten minima and their corresponding nodes.
Step 5:The ray paths from the MS source to each MS sensor are obtained using the method described in Section 2.2.
3. Numerical experiments
In this section, various numerical experiments conducted to demonstrate the performance of FMM2 and the ray-path tracing method are described. Furthermore, a numerical location experiment was applied to verify the rationality of the proposed method.
3.1. FMM2
In this section, a comparative experiment using FMM with first- and second-order differences (FMM1 and FMM2) conducted to show their calculation performance on the first arrival time is described.Thesizeofvelocitymodelusedis 100 m × 100 m × 100 m (length × width × height) with a grid spacing of 1 m. The source point is located at (0, 0, 0), and the P-wave velocities of all grid nodes were taken as 4000 m∙s-1. The analytic solution is the result of the distance between two nodes divided by the P-wave velocity, and the numerical solution can be obtained using FMM1 and FMM2. In addition, ξtiis used to quantify the calculation errors, which are defined in Eq. (24).

Fig. 3. The calculation results of FMM1 and FMM2 in the 100 m × 100 m × 100 m uniform velocity model. (a) The results of analytical solution; (b) the results of FMM1;(c) the results of FMM2.

where ξtiis the error at the ith grid node, and tNiand tAiare the numerical and analytical solutions at ith grid node, respectively.
The results are presented in Fig.3.Fig.3(a)shows the analytical solution for the arrival time used in this velocity model.The calculation errors are presented in Figs.3(b)and(c).Clearly,FMM2 has a better performance and effectively reduces the calculation errors owing to the application of the higher order difference approach.In Fig. 4, the boxplot, which is a statistical tool, was employed to further quantify the error distribution of the calculation results.Compared with FMM1, FMM2 can produce smaller errors, which are distributed over a narrow range. The median error of FMM1(4.1 × 10⁻⁴s) is more than four times as much as that of FMM2(1.0 × 10⁻⁴s), and the lower quartile error of FMM1(3.15 × 10⁻⁴s) is obviously larger than all errors obtained by FMM2. Therefore, FMM2 can obtain more accurate calculation results.
3.2. Ray-path tracing
In this section, a two-layer velocity model and a caverncontaining velocity model are established to verify the reasonability of the ray-path tracing method based on the calculation results of FMM2.
The size of the two-layer velocity model with a 1 m grid spacing is 200 m×200 m×200 m(length×width×height),in which the P-wave velocities of 0–100.5 m and 101–200 m heights are 6000 and 4000 m∙s-1, respectively. The source point is located at (100,100,0),and ten MS sensors are installed,the coordinates of which are shown in Table 1. The ray paths between the source point and all MS sensors are presented in Fig. 5. According to ray theory in seismology, the Snell law should be satisfied on the interface of the two regions, as shown in Eq. (25):

where θ1and θ2are the angles of incidence and refraction, respectively,and v1and v2are the corresponding P-wave velocities in the two regions. In this section, v1and v2are 6000 and 4000 m∙s-1,respectively, and thus v1/v2=6000/4000=1.5. Herein, Riis used to quantify the errors in the calculation of the ray paths, as shown in Eq. (26):

where Riis the error of the ith MS sensor, and θ1iand θ2iare the angles of incidence and refraction for the ith MS sensor, respectively. In Table 1, the maximum value of R is less than 1.5%, and most values of R are no more than 1%, which is negligible. Thus,the ray path calculated based on the concept described in Section 2.2, can satisfy Snell’s law at stratification.

Fig.4. The boxplots of the obtained errors using FMM1 and FMM2.The number of outlier of FMM1 and FMM2 are 9247 and 2701,respectively.Q1:the lower quartile point; Q3: the upper quartile point; IQR: Q3-Q1.
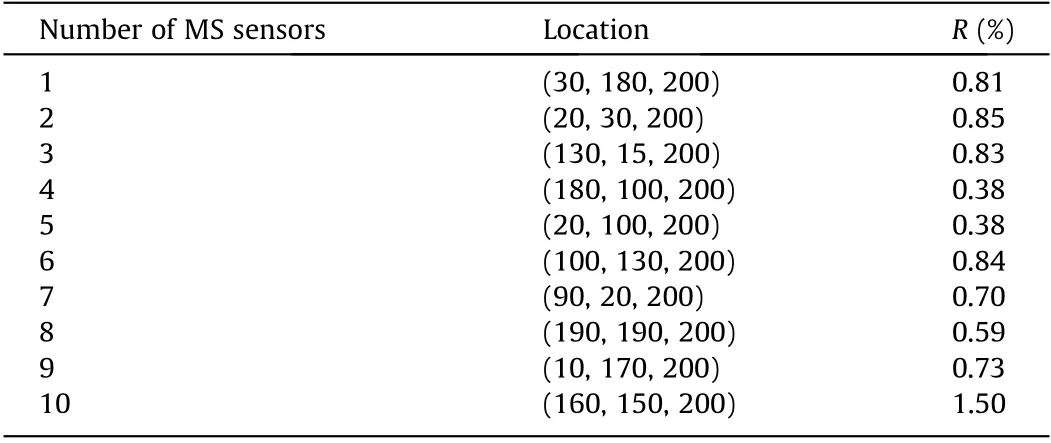
Table 1 The error results of Ri.
The cavern-containing velocity model with 200 m × 200 m ×200 m(length×width×height)is shown in Fig.6,the grid spacing of which is 1 m.The P-wave velocity of the empty area is 340 m∙s-1,and that of the rest of the model is 5000 m∙s-1. The size of the empty area is 25 m × 65 m (radius × length) and the central axis of this cylinder goes through (50, 35, 50) and (50, 100, 50). Three source points are located at (45, 5, 50), (45, 55, 95), and (70, 70,20), and four MS sensors are installed at (25, 45, 65), (25, 45, 35),(75, 45, 65), and (75, 45, 35), respectively. The ray paths obtained are shown in Fig. 6. In the relatively far area, the rays travel along straight lines,as in the uniform velocity model.Near the cavity,the rays travel close to the outside of the empty area. These results show that a reasonable ray path can still be obtained using our proposed method within the vicinity of the void region.

Fig. 5. The ray paths from the source point to various MS sensors in the two-layer velocity model.
3.3. Numerical location
A 383 m×100 m×121 m cavern-containing complex velocity model with a 1 m grid spacing was established to test the proposed location method (Fig. 7). This model was developed based on the Marmousi model in the geophysical field. Three tunnels with dimensions of 15 m×100 m(radius×length)are arranged parallel to the Y-axis, and their central axes go through (75, 50, 50),(176,50,50),and(330,50,65),respectively.The calculation results obtained using FMM1 from the source points to each MS sensor are regarded as the actual arrival time picked from the P-waves (that is, tiand tjin Eq. (23)). All theoretical arrival times, namely, Δtiand Δtjin Eq. (23), is calculated using FMM2. The realization of the MS location is based on Eq. (23), and the final location results are the average of the corresponding grid nodes of the first ten minima(Fig.7).Table 2 shows all location results,and their corresponding errors are all less than 4 m,which indicates that the proposed method can determine the MS location even in such a complex velocity model.
4. Application in rock engineering
4.1. Engineering project description
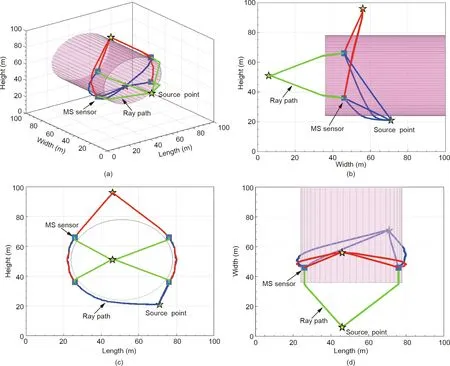
Fig. 6. The ray paths from three source points to four MS sensors in the void-containing velocity model. (a) 3D view; (b) right view; (c) front view; (d) top view.
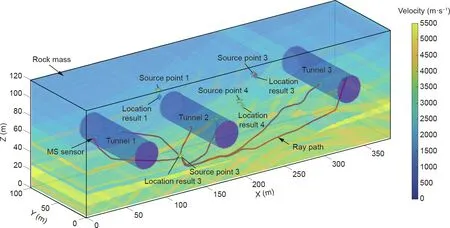
Fig. 7. The MS location results using FMM2 in cavern-containing complex velocity model.
The proposed method is applied to the Houziyan hydropower station to locate blasting and MS events induced by excavation unloading during the construction period. The Houziyan hydropower station is a typical large-scale hydropower project located on the Daduhe River,approximately 450 km southwest of Chengdu City in Sichuan Province,China.The group of underground powerhouse caverns at Houziyan hydropower mainly consists of the main powerhouse, main transform chamber, tailrace surge chamber, and busbar tunnels. The three main underground caverns,including the main powerhouse, main transform chamber, and tailrace surge chamber, feature high sidewalls and long spans,which are arranged in parallel with axes of N61°W.The excavation size of the main powerhouse is approximately 219.5 m × 29.2 m× 68.7 m (length × width × height) whose minimum vertical and horizontal depths are~380 and~250 m,respectively.The main transformer chamber is 141.1 m in length, 18.8 m in width, and 25.2 m in height,and the tailrace surge chamber is 60 m in length,23.5 m in width, and 73.98 m height. According to various in situ engineering geological explorations, some structural planes,including small faults and compression-crushed zones, pass through the excavation area [38]. The maximum principal stress is roughly east–west direction, and the rock mass surrounding unground caverns is given priority over complete and hard metamorphic limestone[39].A detailed introduction of the engineering and in situ geological conditions can be found in the literature[39].
4.2. MS monitoring system configuration
To monitor the excavation-induced seismicity inside the rock mass, a high-resolution MS monitoring system produced by the Engineering Seismology Group (ESG), Canada, was installed in the underground caverns (Fig. 8). The ESG MS monitoring system mainly consists of a paladin digital signal acquisition system, a Hyperion digital signal processing system, and multiple MS accelerometers. The installed MS accelerometers with a frequencyresponse range of 50–5000 Hz were installed at the end of the diamond-drilled boreholes in the sidewalls, as shown in Fig. 8.The MS signals acquired were digitized using the Hyperion processing system with a sampling frequency of 10 000 Hz. The coordinates of the MS sensors are (41.70, 62.00, 1706), (71.55,62.20, 1706), (97.80, 62.30, 1706), and (128.95, 56.80, 1703.5),respectively. The P-wave velocity was 5239 m∙s-1based on the joint investigation of on-site blasting tests and digital sound wave tests. The monitoring signals were exported using ESG Wavevis software in the form of a .txt file and analyzed using Python.Typical MS waveforms were manually identified by researchers,and the onset time of the MS signals was automatically picked using the Akaike information criterion (AIC) [40,41] in this study.

Table 2 The location error in the numerical location experiment.
4.3. MS activity subjected to excavation
A large number of MS events were captured through the ESG MS monitoring system installed in the area between the main powerhouse and busbar tunnels during the period of 5 December 2013 to 16 January 2014. During this period, excavation activities were carried out using a borehole-blasting method combined with a mechanical excavation.Fig.9 shows the areas where the excavation was completed prior to the collection of MS monitoring data.The spatial distribution of the induced MS events was mainly near the downstream sidewall of the main powerhouse and was located between busbar tunnels 2# and 3#. The location results were obtained based on the uniform velocity model, which neglected the negative influence of the empty areas (i.e., the excavated areas). Consequently, some MS events were located inside the empty area (Fig. 9), which may negatively affect the delineation of the excavation-induced zones.
4.4. MS location based on FMM2
4.4.1. Establishment of cavern-containing velocity model
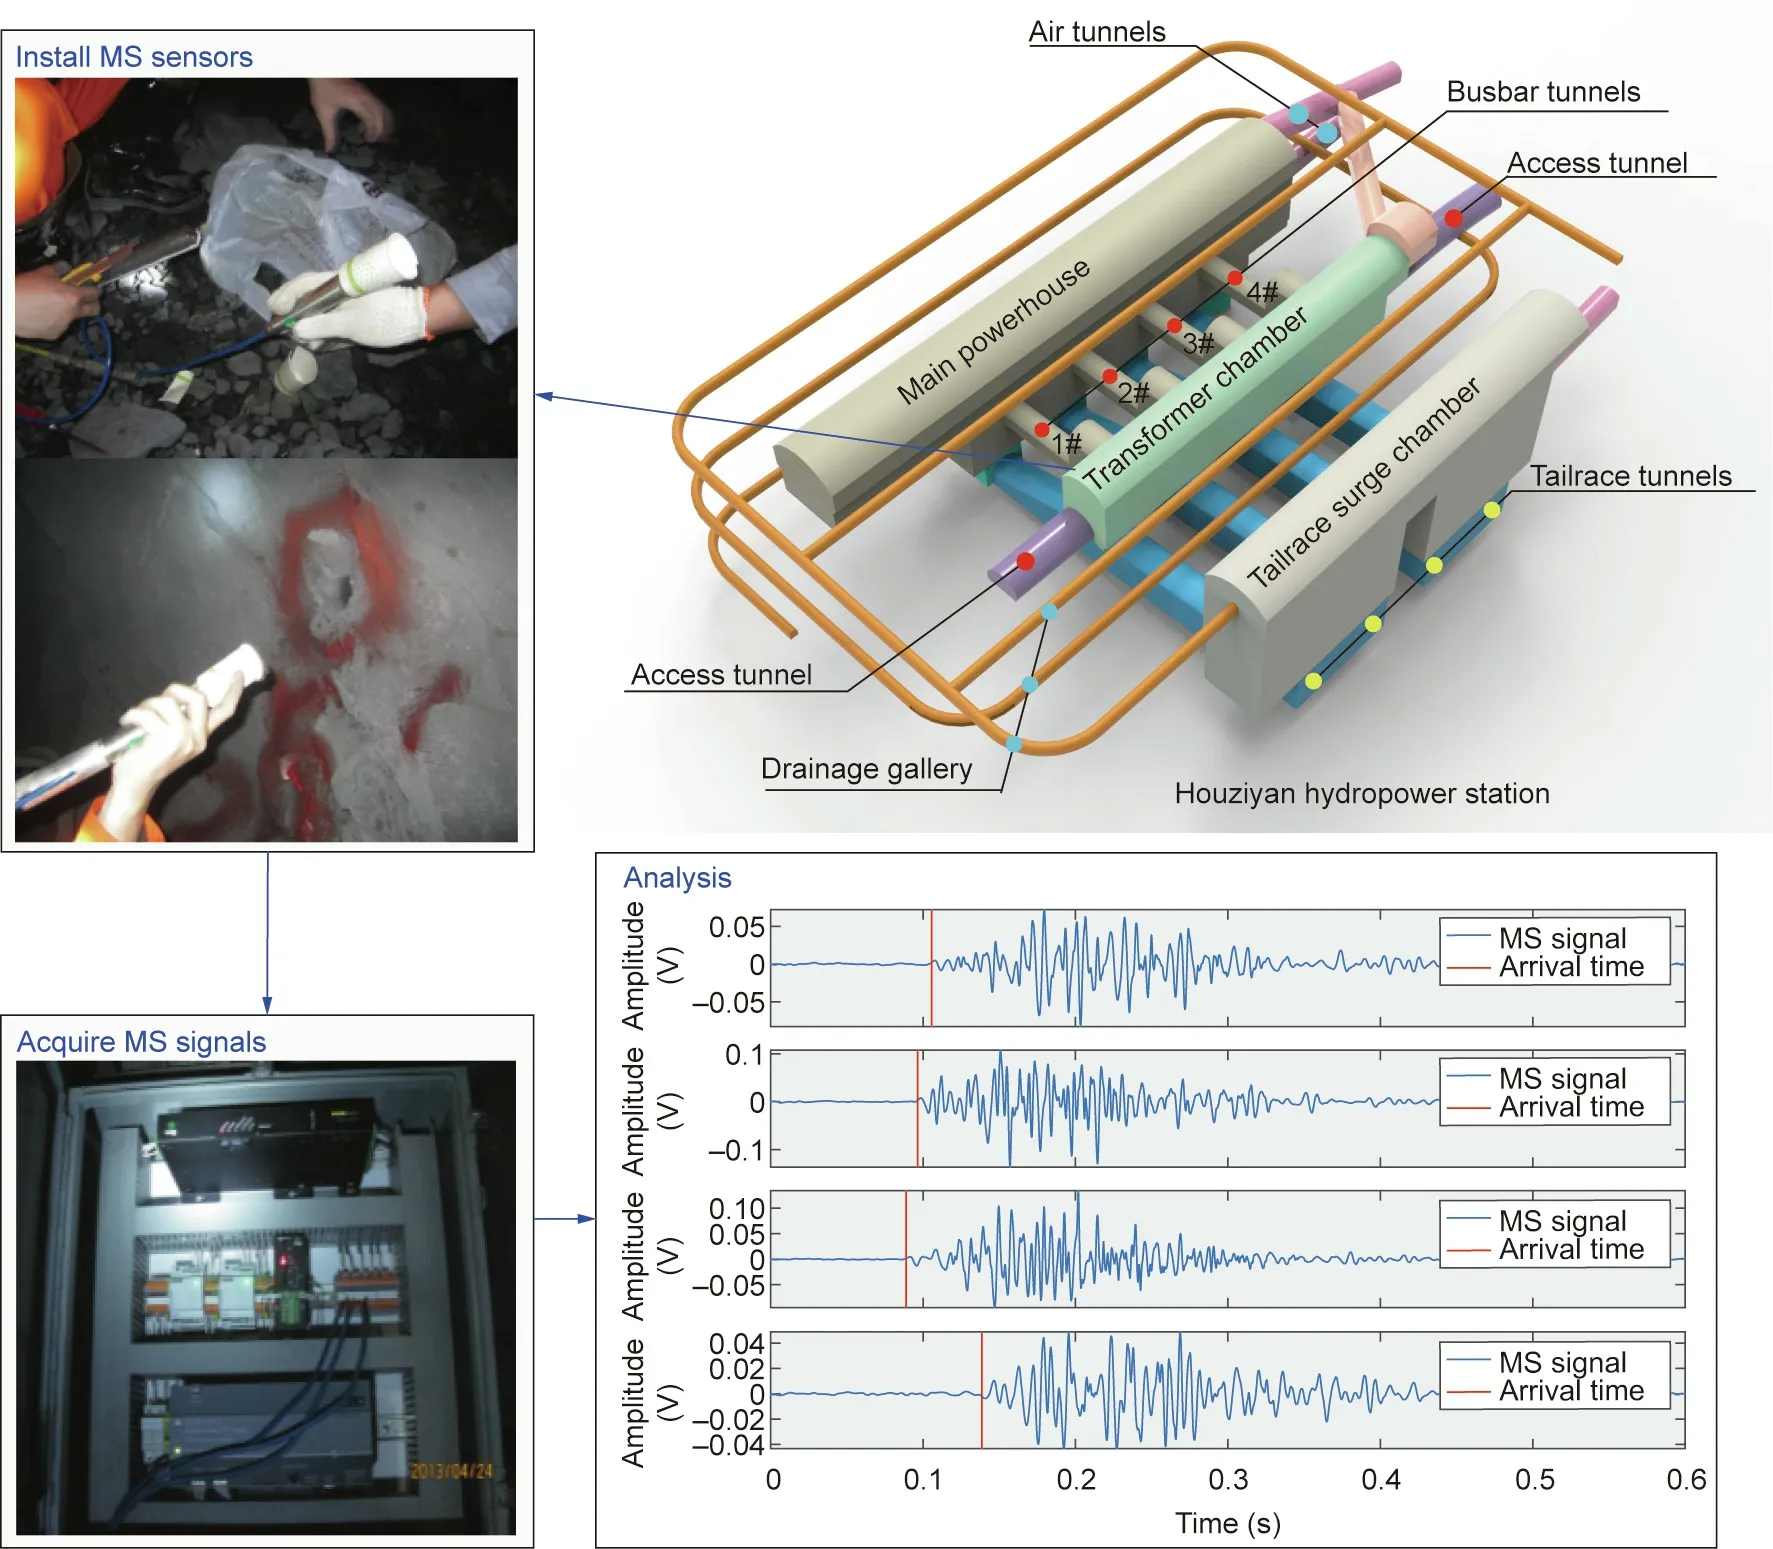
Fig. 8. The layout of the underground caverns at Houziyan hydropower station and the construction of ESG MS monitoring system in the field.
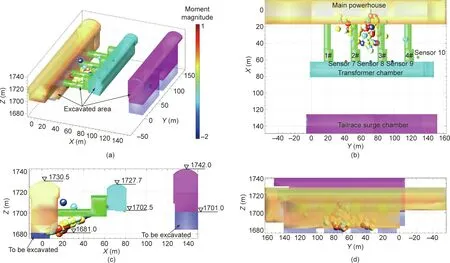
Fig.9. The location of MS events determined based on the uniform velocity model in the area between 2#and 3#busbar tunnels.(a)The spatial distribution of MS events;(b) the top view; (c) the front view; (d) the left view.
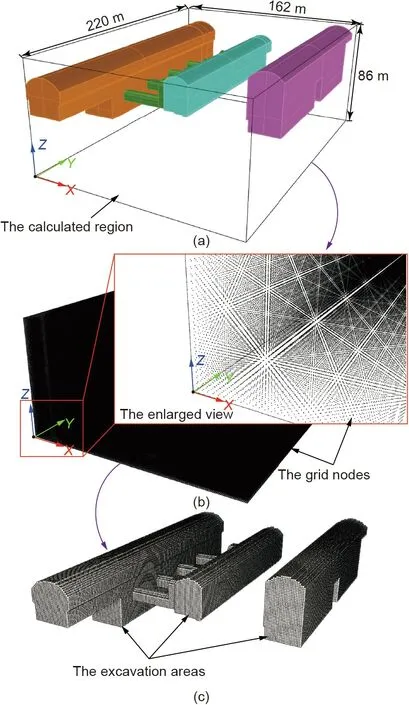
Fig. 10. The establishment of cavern-containing velocity model. (a) Delineate the calculated region;(b)generate grid nodes;(c)obtain nodes in the excavation areas.
The cavern-containing velocity model of the underground caverns was established, as shown in Fig. 10. First, the 3D cavern models are built using 3D design software (e.g., Blender and AutoCAD), and the calculated region is determined according to engineering project progress to ensure that it contains all empty areas. The Cartesian coordinate system is established as shown in Fig.10,in which the Y-axis is parallel to the axis of the central line of the caverns, and the Z-axis travels straight up. The size of the complete calculated area is 162 m × 220 m × 86 m (Fig. 10(a))and the region is discretized into cube grids with 1 m spacing(Fig. 10(b)). The coordinates of all grid nodes were recorded, and the P-wave velocity in the entire region was taken as 5239 m∙s-1based on the investigation of on-site blasting tests and digital sound wave tests. Next,the Boolean operation is applied to obtain the intersection between the excavation areas and the full calculation region (Fig. 10(c)). Consequently, the 3D coordinates of the nodes in the intersection area were obtained. According to their coordinates, the P-wave velocity of the nodes in empty areas is changed to 340 m∙s-1.
4.4.2. Blasting location tests
In this section, the use of the proposed method to locate two recorded drill blasting activities based on monitoring the signal data is described. The first arrival time of the P-wave of the recorded signals was chosen using the AIC method. The location results and errors are presented in Table 3. The location errors of the two blasting events are reduced by approximately 9 and 3 m,which are closer to the actual blasting location. It can be clearly seen that the proposed method can achieve relatively more accurate location results owing to the consideration of empty areas.
4.4.3. MS location
The proposed method was used to locate the MS events induced through excavation activities from 5 December 2013 to 16 January 2014.The spatial distribution of MS events is shown in Fig.11.The ray paths of one MS event are presented as an example to demonstrate the propagation of P-waves in the cavern-containing model.The rays travel along straight lines in the region far from the void areas and bypass the excavated area once near the void areas.Compared with the location results based on the uniform velocity model (Fig. 9), no MS event is located in the interior of the empty area,which is mainly distributed near the downstream sidewall of the main powerhouse and the area between busbar tunnels 2#and 3#.The MS events in cluster 1 are concentrated at the downstream toe of the main powerhouse with elevations of 1680–1690 m(Fig. 11), which are induced through a stress concentration owing to the excavation activities. The MS events in cluster 2 are mainly distributed between busbar tunnels 2#and 3#with an elevation of 1698–1710 m,which indicates excavation-induced fractures inside the surrounding rock mass.The reasonability of the location results was validated using the conventional monitoring technique(Fig. 12) and in situ shotcrete fractures (Fig. 13). The location of the in situ multipoint extensometer is presented in Fig. 12(a),which is above the #2 busbar tunnel with an elevation of 1706.5 m. The absolute displacement process graph of its orifice increases during the period from 1 January 2014 to 9 January 2014 (Fig. 12(b)), during which the number of MS events shows an obvious upward trend. The relative displacement graph(Fig. 12(c)) of different segments further indicates that obvious deformation occurred in the segment of 24 m fix point,whose location is close to cluster 2 of the MS events(Figs.11 and 12).In addition, the shotcrete fractures and spalling at the sidewall of the 2#busbar tunnel, as shown in Fig. 13, further highlight the relationship between in situ damage and cluster 2 of MS events, which verifies the feasibility of the proposed MS location method.
5. Conclusions
Accurate MS event locations play a vital role in MS monitoring technology in the delineation of damaged areas in rock masses.The complex conditions in the field adversely affect the final results of the MS location. In this study, a new MS location method is proposed to achieve the MS location in the cavern-containing complex area based on the residual between the theoretical and actual arrival times of P-waves of MS signals.The FMM2 is applied to obtain the theoretical arrival time of the P-wave by solving the Eikonal equation using a second-order difference approach and a narrowband technique. Based on the arrival time obtained, the ray path from the fracture source to the MS sensors can be solved using a linear interpolation approach and the Runge–Kutta method. After picking the actual arrival time of the MS signals using the AIC method, the MS location can be achieved by searching the grid node to allow the target function to reach the minimum.
The proposed location method was verified through numerical experiments and applied at the Houziyan hydropower station during the excavation of the three main caverns. The location resultsof the recorded blasting events show that our method can effectively reduce the errors existing in the location using a uniform velocity model. In addition, the location results of the excavation-induced MS events were validated through the in situ monitoring results of the installed multipoint extensometer and the shotcrete fractures and spalling at the sidewall of the 2# busbar tunnel. The proposed method can be used to locate MS events in a cavern-containing complex environment and effectively facilitate the delineation of the damaged area inside the surrounding rock mass.

Table 3 The location results of blasting events using different velocity model.
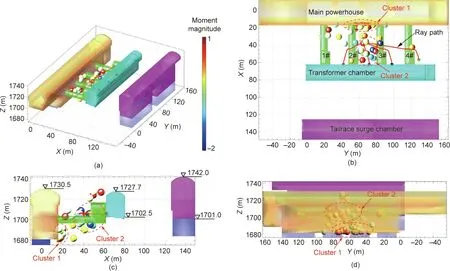
Fig. 11. The location of MS events based on the cavern-containing velocity model in the area between 2# and 3# busbar tunnels. (a) The spatial distribution of MS events;(b) the top view; (c) the front view; (d) the left view.

Fig. 13. Shotcrete fractures and spalling occurred at the sidewall of 2# busbar tunnel.
Acknowledgements
The authors thank the Key Program of National Natural Science Foundation of China (52039007) for providing financial support.
Compliance with ethics guidelines
Ruochen Jiang, Feng Dai, Yi Liu, and Ang Li declare that they have no conflict of interest or financial conflicts to disclose.
杂志排行
Engineering的其它文章
- COVID-19 Vaccine Allocation: Modeling Health Outcomes and Equity Implications of Alternative Strategies
- Quantitative Investigation of Tomographic Effects in Abnormal Regions of Complex Structures
- Non-Communicable Diseases During the COVID-19 Pandemic and Beyond
- Next Steps for Efficacy Evaluation in Clinical Trials of COVID-19 Vaccines
- Facilities for Centralized Isolation and Quarantine for the Observation and Treatment of Patients with COVID-19
- Temporal Profiles of Antibody Responses, Cytokines, and Survival of COVID-19 Patients: A Retrospective Cohort
