Position Vectors Based Efficient Indoor Positioning System
2021-12-16AyeshaJavedMirYasirUmairAlinaMirzaAbdulWakeelFazliSubhanandWazirZadaKhan
Ayesha Javed,Mir Yasir Umair,*,Alina Mirza,Abdul Wakeel,Fazli Subhan and Wazir Zada Khan
1Department of Electrical Engineering,Military College of Signals,National University of Sciences and Technology,Islamabad,44000,Pakistan
2Department of Computer Engineering,National University of Modern Languages(NUML),Islamabad,44000,Pakistan
3Department of Computer Science and Information Security,Jazan University,Jazan,45142,Saudi Arabia
Abstract:With the advent and advancements in the wireless technologies,Wi-Fi fingerprinting-based Indoor Positioning System(IPS)has become one of the most promising solutions for localization in indoor environments.Unlike the outdoor environment,the lack of line-of-sight propagation in an indoor environment keeps the interest of the researchers to develop efficient and precise positioning systems that can later be incorporated in numerous applications involving Internet of Things(IoTs)and green computing.In this paper,we have proposed a technique that combines the capabilities of multiple algorithms to overcome the complexities experienced indoors.Initially,in the database development phase,Motley Kennan propagation model is used with Hough transformation to classify,detect,and assign different attenuation factors related to the types of walls.Furthermore,important parameters for system accuracy,such as,placement and geometry of Access Points (APs)in the coverage area are also considered.New algorithm for deployment of an additional AP to an already existing infrastructure is proposed by using Genetic Algorithm(GA)coupled with Enhanced Dilution of Precision(EDOP).Moreover,classification algorithm based on k-Nearest Neighbors(k-NN) is used to find the position of a stationary or mobile user inside the given coverage area.For k-NN to provide low localization error and reduced space dimensionality,three APs are required to be selected optimally.In this paper,we have suggested an idea to select APs based on Position Vectors(PV) as an input to the localization algorithm.Deducing from our comprehensive investigations,it is revealed that the accuracy of indoor positioning system using the proposed technique unblemished the existing solutions with significant improvements.
Keywords:Indoor positioning systems;Internet of Things;access points;position vectors;genetic algorithm;k-nearest neighbors
1 Introduction
Indoor Positioning Systems (IPS) determine the position of a person or an object in an indoor environment [1]as depicted in Fig.1,and such systems have been implemented for various applications [2-4].IPS uses numerous positioning approaches,which vary in terms of accuracy,cost,technology,scalability,robustness and security [2].Unlike the outdoor positioning systems,indoor positioning systems can be analyzed on metrics such as,system accuracy [3],coverage area,building’s infrastructure and error due to signal interference and reflection [5,6].Being an active research area among the scholars,various techniques for indoor environment have been reported in literature with the practice of,inertial measurement unit [7],acoustic/sound,ultrasonic [8],Radio Frequency (RF) ID tags [9,10],magnetic field [11],Wi-Fi [12],etc.In general,there are two categories for IPS:Infrastructure based and non-infrastructure based.The infrastructure-based system is restricted,due to limitation of visibility and transmission distance [13].On the other hand,cost is the major drawback for the non-infrastructure-based stream [14]and it uses RSSI values for positioning.
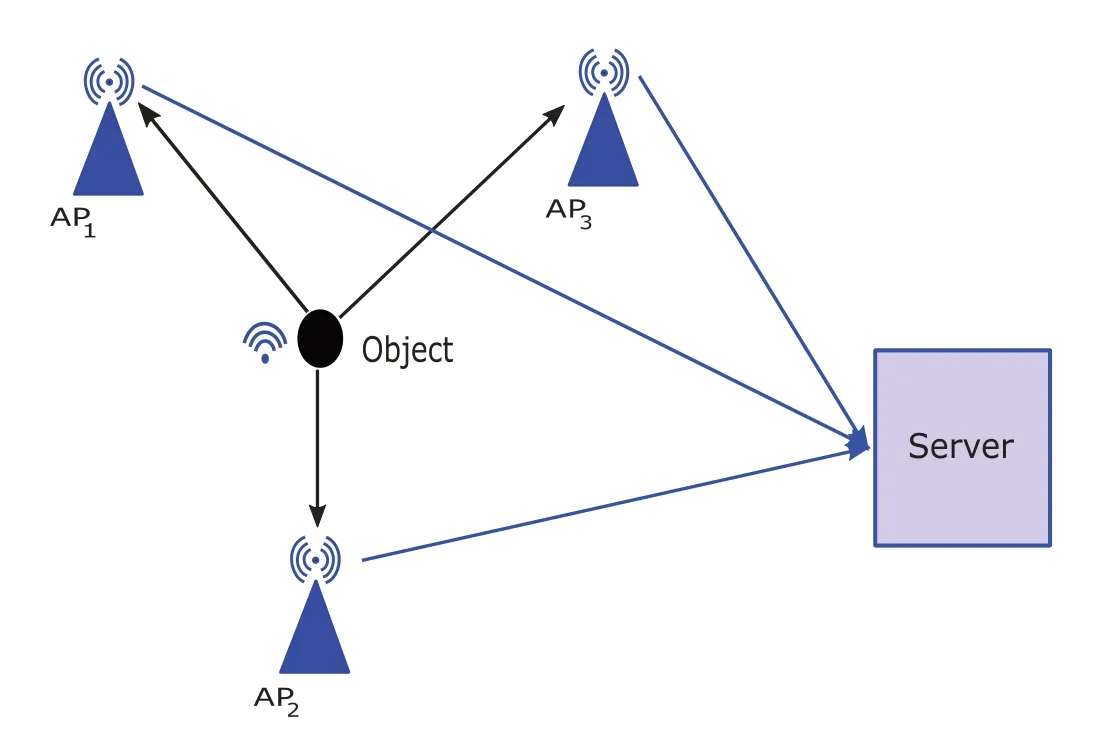
Figure 1:General indoor positioning system
Over the years,Global Positioning System (GPS) has provided satisfactory results for outdoor environments [15],however,it lacks accuracy indoors being dependent on Line-of-Sight (LOS)propagation.For indoor environment,Wi-Fi based localization has emerged as the most suitable alternative to GPS [16],however,Wi-Fi signals tend to get attenuated by multi-path propagation effects resulting in an increase of complexity in the IPS.Methods based on Received Signal Strength Indicator (RSSI) fingerprinting effectively reduce multi-path propagation effect and LOS complexities [15].Optimal placement of Access Points (APs) in a service area play a vital role in enhancing the positioning accuracy of IPS and can minimizes the cost of using extra APs.Number of studies has been carried out to analyze the influence of APs deployment in regards with number of APs and their positions in an indoor environment [17].A Genetic Algorithm(GA) based scheme for rapid optimal APs placement that maximizes the Euclidean Distance (ED)of Received Signal Strength (RSS) vector among all the Signal Test Point (STPs) is presented in [18].Alsmady et al.[19]has also developed a GA based approach,that can find the global optimal solution.However this approach does not differ between the types of the wall which can actually deploy the new AP at a same place in two same size buildings even they have different types of wall.Another GA based framework,Geno placement [20],is reported to solve APs placement problem with solving some of the scalability concerns of the past researchers.In 2016,the authors in [21]presented an APs placement optimization model based on Particle Swarm Optimization (PSO).Moreover,a mathematical representation and solution of the problem of APs placement is presented in [22]which has suggested deploying an additional AP and it achieved increased system accuracy,however,the proposed system was not tested for real-time applications.Further,Aomumpai et al.[23],highlighted that the positioning error can decrease up to 35% with the optimal deployment of APs.However,after an optimal deployment of APs,excessive APs can also cause issues in localization system by increasing the processing time and space complexity [24].In [25],AP selection method based on the combination of information gain and mutual information entropy was proposed to reduce the computational cost and the system complexity.In [26],the authors utilized the strongest RSS value to locate the user in IPS and reduced the computational complexity of positioning algorithm.However,multipath fading was a major concern in their findings which can actually vary the RSS values.Further,another indoor localization technique based on fingerprinting and weighted centroid localization was presented in [27],which reduces the number of required fingerprint reference points by more than 40%compared to traditional fingerprinting localization method with a similar localization estimation error.However,the authors were unable to address the concerns that can rise once there is a disaster and beacons would cease to work.Visible Light Communication (VLC) based indoor positioning using the received optical power levels from emitting LEDs is investigated in [28].
At present,different machine learning techniques are also used for resolving localization problem in the Wi-Fi indoor positioning method.In [29],the authors have proposed predictive modeling method using online machine learning to improve the performance of localization of reference RFID tags in a non-static environment.The wireless signals from time-critical items can be captured constantly.The online positioning model is built and updated by using the sensor data stream.In [30],a method for fingerprint feature extraction and a hybrid localization model was proposed.A feature extraction method Fisher Score-Stacked Sparse Auto Encoder (Fisher-SSAE) was suggested to obtain robust fingerprint features,which improved localization accuracy.Authors also established a hierarchical model that employed the clustering approach,constructed sub models for sub regional localization,and tested the effects of hierarchical localization caused by sub regional positioning errors.Authors in [31]presented a comprehensive review of deep learning methods in indoor positioning.The advantages and disadvantages of various fingerprint types for indoor positioning are discussed.The solutions proposed in the literature are then analyzed,categorized,and compared against various performances evaluation metrics.
An indoor positioning system based on the automatic generation of radio maps of the indoor environment uses Wi-Fi compatible IoT sensors was proposed in [32].Propagation loss parameters are automatically estimated from the online feedback of deployed sensors and the radio maps are updated periodically without any physical intervention.The proposed system leverages the raster maps of an environment with the wall information only,against computationally extensive techniques based on vector maps that require precise information on the length and angles of each wall.Experimental results show that the proposed system has achieved an average accuracy of 2 m,which is comparable to the survey-based Wi-Fi fingerprinting technique.
An indoor localization system is presented to enhance the user experience in a museum [33].In particular,the proposed system relies on Bluetooth Low Energy (BLE) beacons proximity and localization capabilities to automatically provide the users with cultural contents related to the observed artworks.At the same time,a received signal strength-based technique is used to estimate the location of the visitor in the museum.An Android application is developed to estimate the distance from the exhibits and collect useful analytics regarding each visit and provide a recommendation to the users.Moreover,the application implements a simple Kalman filter in the smart phone,without the need of the cloud,to improve localization,precision and accuracy.Effectiveness of proposed solution through experimental results in terms of distance estimation,location,and detection accuracy depict that BLE beacon is a promising solution for an interactive smart museum.
The main contributions of this paper are as follow.
• We have proposed a technique that combines different algorithms which,thus,increases efficiency and accuracy at the same time.
• This research contains multiple stages:In the deployment stage,we deployed an additional AP using GA with Enhanced Dilution of Precision (EDOP),and then with these APs created a database by using a Motley Kennan propagation model [34].
• Further,for auto-detection of walls and their position from the blueprint image,different image processing techniques were used.Here,distinct walls were assigned different attenuation factors.
• Heat maps were also used to verify these databases in the proposed methodology.
• An advance and extensive strategy was also proposed which can limit the large-scale errors for Wi-Fi fingerprinting and ameliorating the precision of results by Position Vectors (PV)based APs selection with k-NN localization algorithm.The proposed approach identifies the APs and ranks them according to their PV distances.As per the available literature,no other technique deploys this mechanism to counter large scale errors.
• In the second phase,k-NN algorithm [35]investigates all APs and trials them one by one iteratively to find the most suitable value from the list of APs to localize the user.
• Moreover,to validate the superior performance of the proposed methodology,a comparative analysis of the proposed solution along with the RSSI based selected APs and existing APs based localization techniques was carried out.The comparison remains the evidence of better results achieved.
Machine learning and related applications that are IoT based [36-40]have become part of our lives as the devices are predominantly getting smarter and smaller,and are available in everyone’s range.These handheld devices can further be used in a hybrid manner with our proposed technique to allow secure and optimal localization processes.
The remainder of the paper is structured as follows:Section 2 explains the proposed methodology for the deployment of AP,Wi-Fi fingerprinting database and verification,and selection of APs.Results of the proposed technique are discussed in Section 3 followed by the performance analysis and conclusion in Sections 4 and 5,respectively.
2 Proposed Methodology
The proposed work comprises of three stages which are:
I.Deployment of an additional AP,
II.Creation of database using Motley Kennan propogation model and its verification through the heat map,
III.Selection of APs for thek-NN algorithm to localize the user.
A flowchart,as shown in Fig.2,categorizes the three phases of our research.The three processes run in succession with user localization being the metric for error calculation in all Cumulative Distribution Function (CDF).Starting with GA which optimizes Geometric Dilution of Precision (GDOP) to a minimum and maximizes the Euclidean Distance (ED) with each iteration,candidate locations for APs are found,followed by deployment of APs at the same time.Further,the user localization is performed after the AP selection.The selection is based on:
I.RSSI
II.PV
The three stages of proposed methodology are explained in detail in the following subsections.
2.1 Deployment of Additional Access Point
In an efficient indoor positioning system,the angular position of APs should be such that the receiver is surrounded by a certain number of APs covering the whole area [41].GDOP becomes the presiding feature,if position and range of APS in the target area are not optimally schemed.It is reported in [13]that degradation of the system performance occurs with an increased interference among the APs and GDOP.Therefore,GDOP should be minimum for the optimal placement of an AP.In the first phase of this research work,GA along with EDOP is used for deployment of an additional AP.The proposed deployment algorithm selects the position of the 4th AP,in addition to the already deployed APs,based on maximum point of EDOP,which is the quotient between the maximum ED between two closest APs and minimum GDOP,resulting in reduction of the positioning error.
The ED and EDOP are computed as [13]

where (xr,i,xa,i) and (yr,j,ya,j) are the x and y-coordinates of ith RP and jth AP respectively.
DOP coefficient matrix is computed by

GDOP is calculated by taking square root of the trace of the DOP coefficient matrix,i.e.,

Further,the quotient of ED and GDOP form an enhanced DOP which can be written as

where EDOPxis for thexth RP and for all RPs average of EDOP is taken.Value of EDOP is averaged over 300 GA iterations for each deployable AP location.The final maximum value of EDOP is the candidate location for the new AP.This is defined as

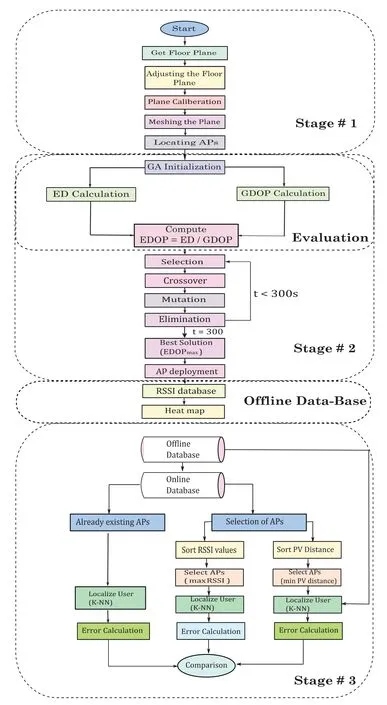
Figure 2:Flow chart of system with proposed methodology
The block diagram of the proposed AP deployment algorithm is shown as Stage-2 in Fig.2.For the position of newly deployed AP,the GA algorithm calculates the coordinates of AP for computing EDOP coefficient.Initially,total of 256 specimens are generated as population.The elite solutions are gray coded to make up a set of chromosomes,where each chromosome contains two genes,i.e.,thex-andy-coordinates of the new APs to be deployed.The coordinates are stored to be used in later stage,before being subjected to crossover to form a new specimen with the crossover occurring at random bit locations.One bit at random is altered from crossover solution to avoid repetition of resultant solutions,the process is called mutation.The crossover and mutation probabilities determine the number of solutions remains unchanged in the next generation and the number of new specimens is modified by one bit.Further,the final set of specimens is examined and the specimen that deviates from the fitness function is discarded.
The stepwise AP deployment algorithm is given as in Algorithm 1.
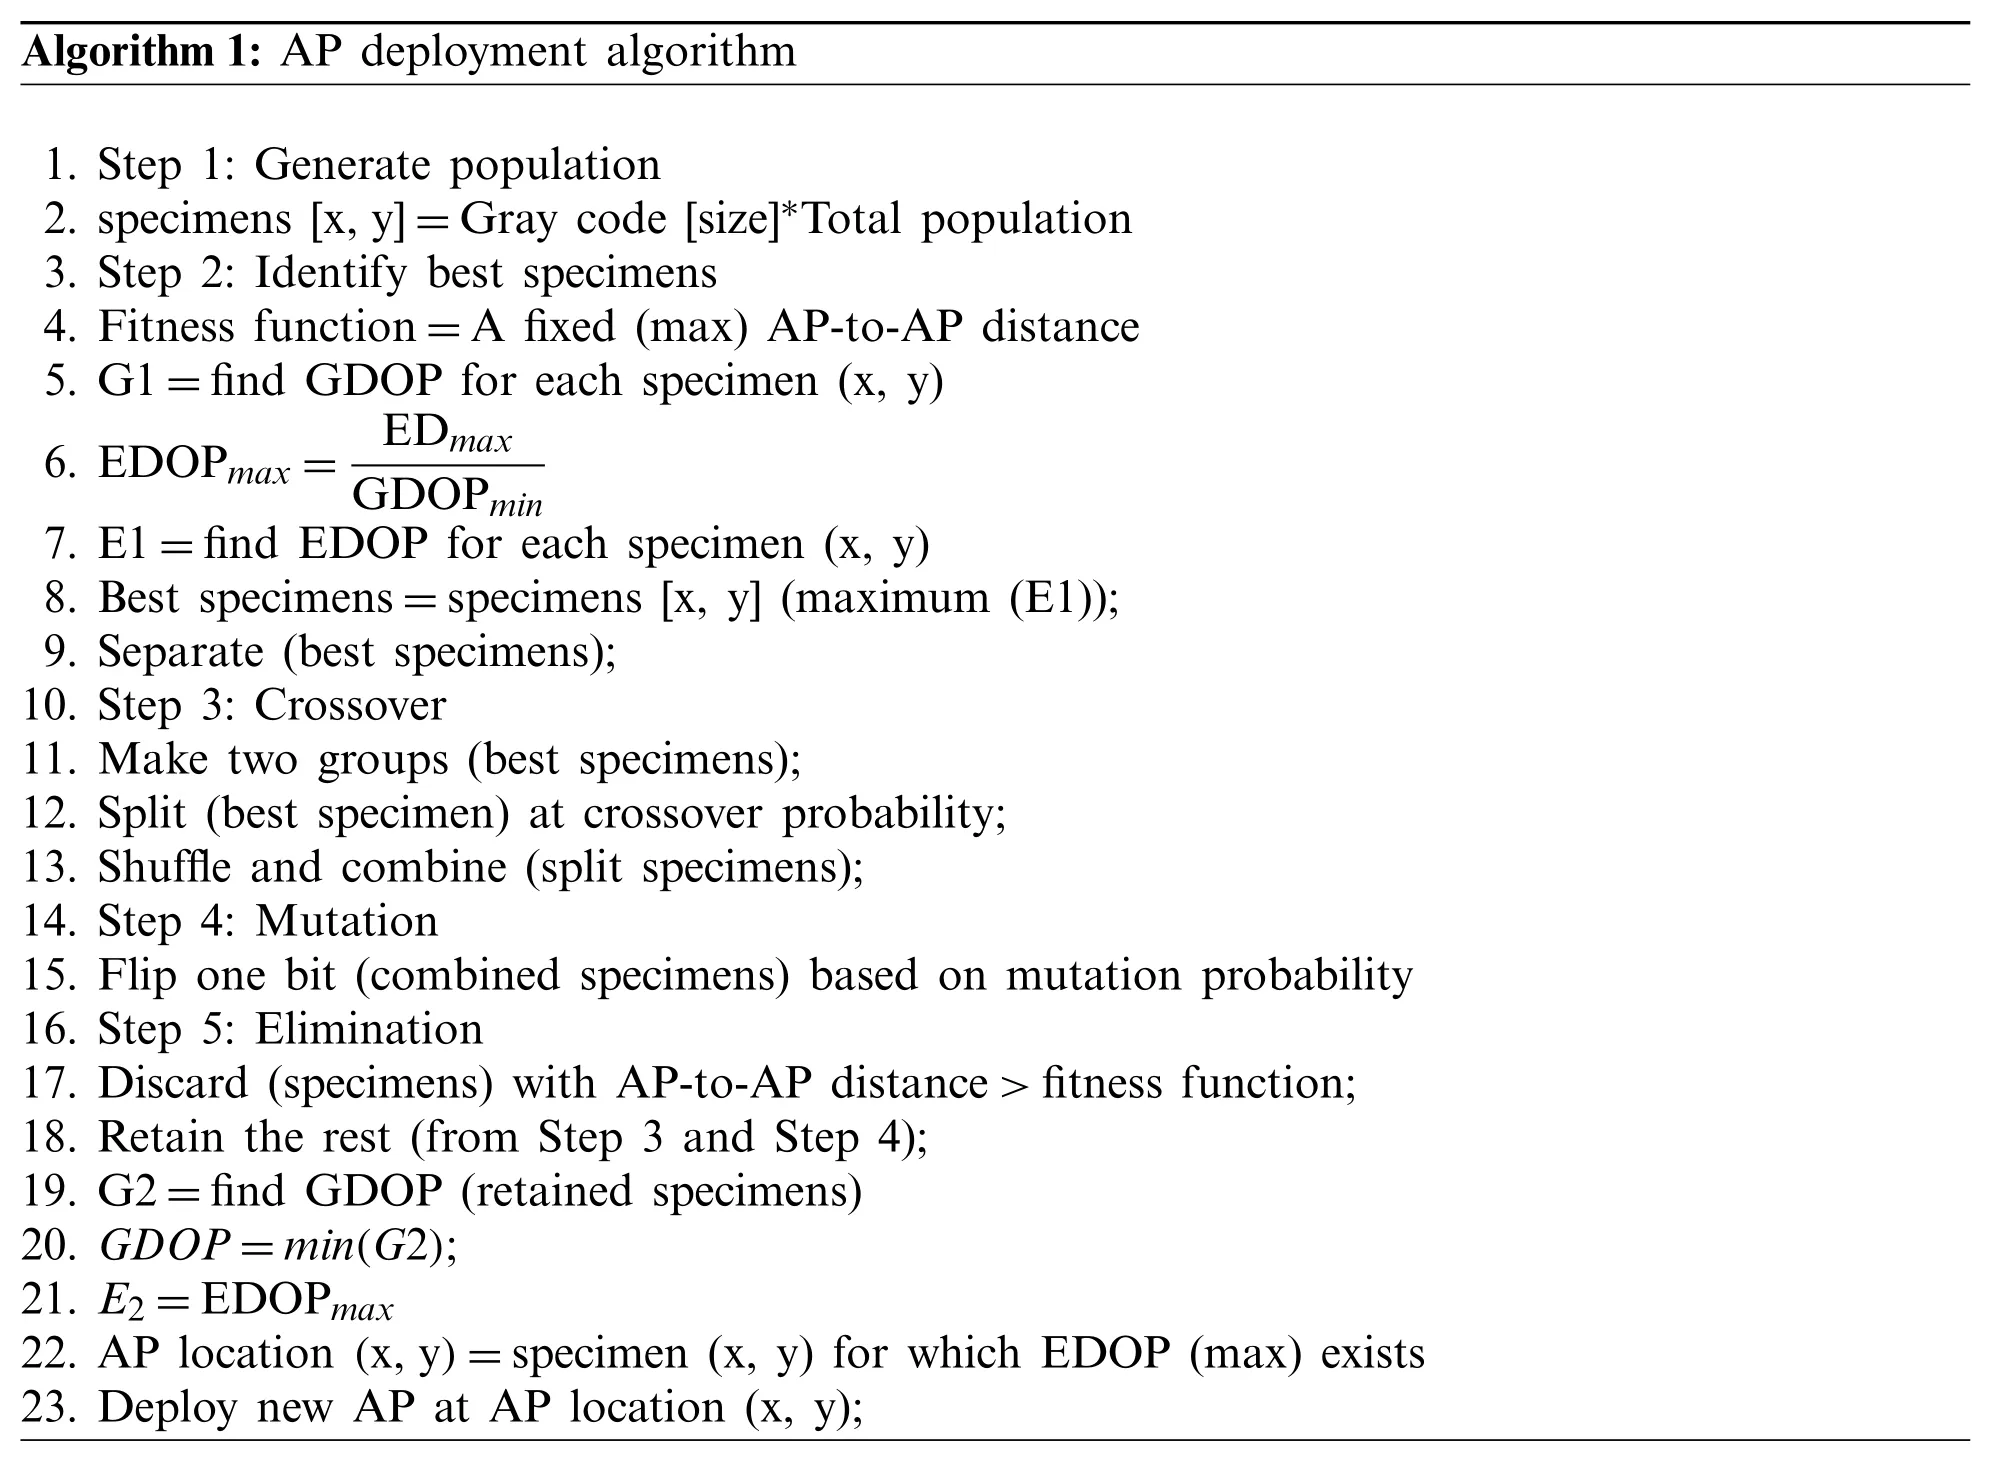
Algorithm 1:AP deployment algorithm 1.Step 1:Generate population 2.specimens [x,y]=Gray code [size]∗Total population 3.Step 2:Identify best specimens 4.Fitness function=A fixed (max) AP-to-AP distance 5.G1=find GDOP for each specimen (x,y)6.EDOPmax=EDmax GDOPmin 7.E1=find EDOP for each specimen (x,y)8.Best specimens=specimens [x,y](maximum (E1));9.Separate (best specimens);10.Step 3:Crossover 11.Make two groups (best specimens);12.Split (best specimen) at crossover probability;13.Shuffle and combine (split specimens);14.Step 4:Mutation 15.Flip one bit (combined specimens) based on mutation probability 16.Step 5:Elimination 17.Discard (specimens) with AP-to-AP distance>fitness function;18.Retain the rest (from Step 3 and Step 4);19.G2=find GDOP (retained specimens)20. GDOP=min(G2);21. E2=EDOPmax 22.AP location (x,y)=specimen (x,y) for which EDOP (max) exists 23.Deploy new AP at AP location (x,y);
2.2 Wi-Fi Fingerprinting Database and Verification
After the deployment of an additional AP in the existing infrastructure,Wi-Fi fingerprinting off-line database is created using the Motley Kennan propagation model [14].Initially,the algorithm divides the surface area into a specific number of nodes which are separated one meter from each other.Moreover,the algorithm detects the number of walls from a blueprint image using Hough transformation.After obtaining information about the orientation of walls,different attenuation factors for different kinds of walls are assigned.Moreover,the distance between each reference point and APs is separately calculated along with the propagation loss using following equation;

where,Lis total loss in dB at a specific point,L0is loss in dB atd0andΓkrepresent transmission coefficient which is a function of the incident angle.RSS value at every point is later verified using the heat map.
2.3 Access Point Selection
For a fixed set of APs,the probability of a user to be closer to any three out of the four APs is greater than that of being at equal distances from each of the APs.At every user location,the updated list of three APs based on maximum RSSI and minimum PV distances are utilized in thek-NN search to get the least localization error.Maximization of the RSSI objective function is computed as

whereasminED is defined as

whereEDiis the Euclidean distance among the ith RP and surrounding RPs andNidefines the aggregate of surrounding RPs with cardinal number N.Another metric is the minimization of the PV distances,returned by the position vectors from the users to the APs,which is represented as

where(xi−xa)and(yi−ya)represents thexandy-coordinates of the ith AP and ath user,respectively.The process of AP selection algorithm based on PV and RSSI is as follows:

Algorithm 2:AP selection algorithm 1.Step 1 Sorting 2.Sort descending [RSSI]3.Calculate PV distances by using Eq.(9)4.Sort ascending [PV]5.Step 2 Selection 6.Select APs [greatest RSSI,smallest PV]7.Step 3 Return selected APs index 8.Step 4 Select AP coordinate for index value returned in Step 3
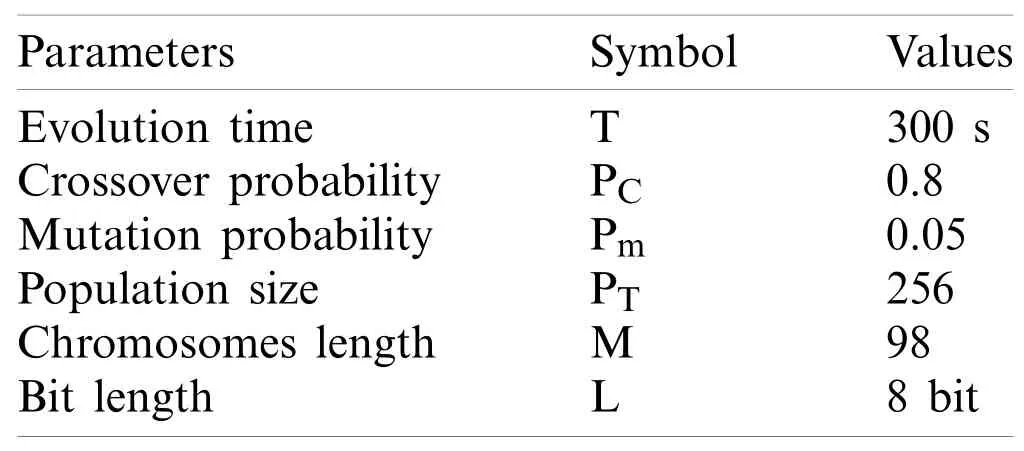
Table 1:Parameter set for simulation based on genetic algorithm
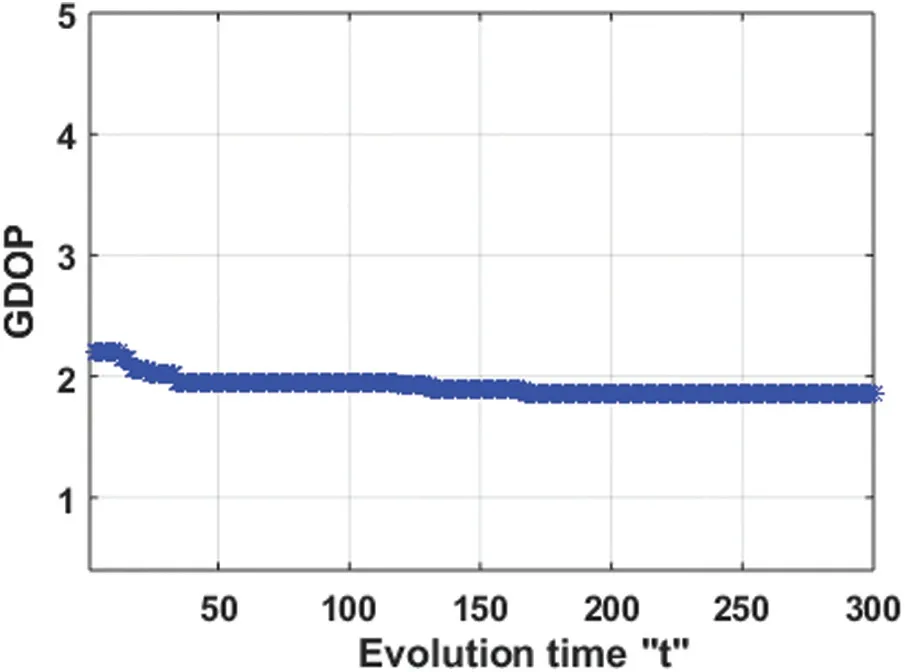
Figure 3:GDOP vs. Evaluation time
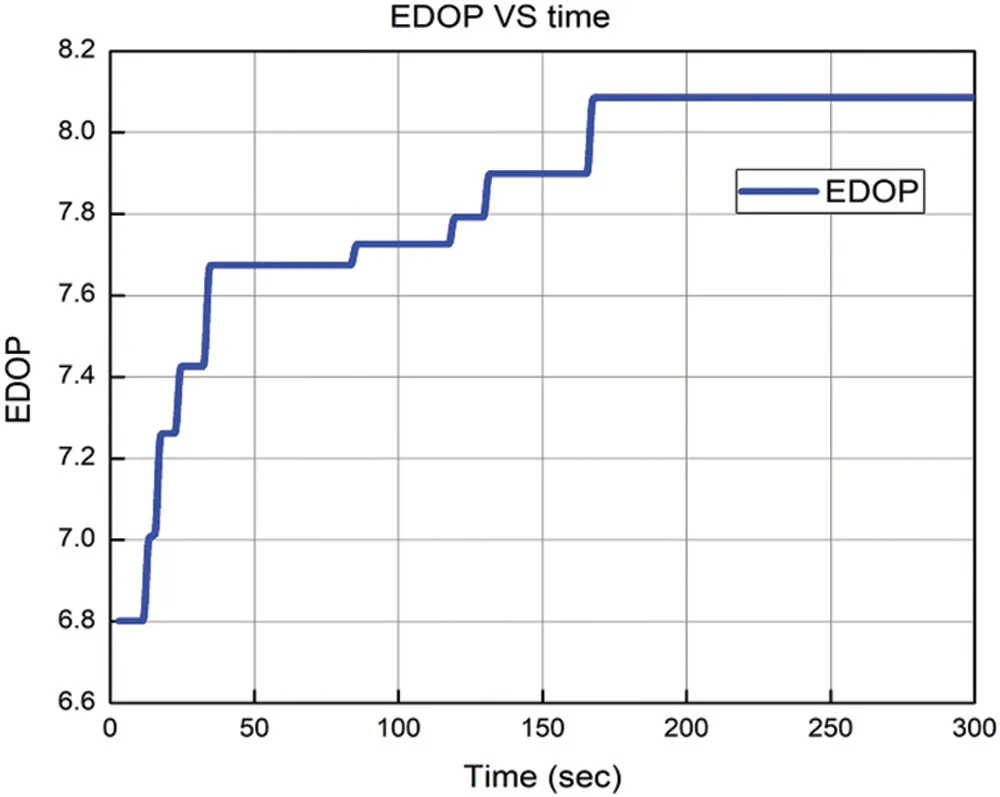
Figure 4:EDOP vs. evaluation time
3 Results and Discussion
The simulations were carried out in MATLAB.As outcome of the proposed work,significant improvement in localization error are achieved with the deployment of an additional AP in the already existing infrastructure of APs.Further,PV and RSSI based APs selection algorithm selects APs for localization of the user withk-NN algorithm.Moreover,comparative analysis of the proposed technique with already existing techniques is carried out to validate its superiority.
3.1 Analysis of Access Point Deployment
Initial system parameters used for simulating GA are tabulated in Tab.1.The position of APs is calculated through GA with the evaluation time.Fig.3 confirms that GDOP decreases with each iteration of the GA.After each iteration of the GA,the GDOP optimizes to its lowest value with maximum ED as a fitness function.Furthermore,EDOP is calculated which gets maximized with each iteration as shown in Fig.4,with updated coordinates of the candidate AP location.Fig.5 shows the location of the new AP calculated through maximum EDOP.
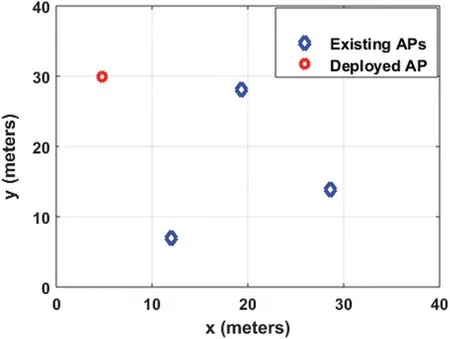
Figure 5:Deployment of an additional AP
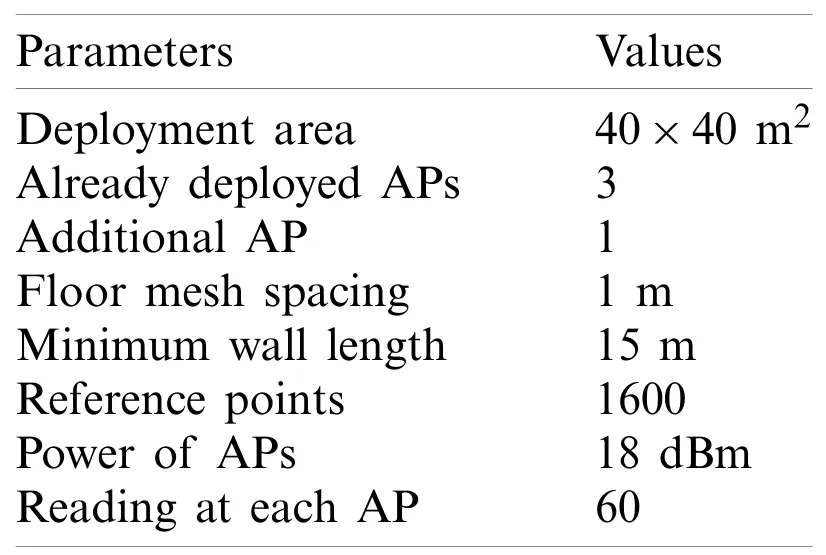
Table 2:System parameters
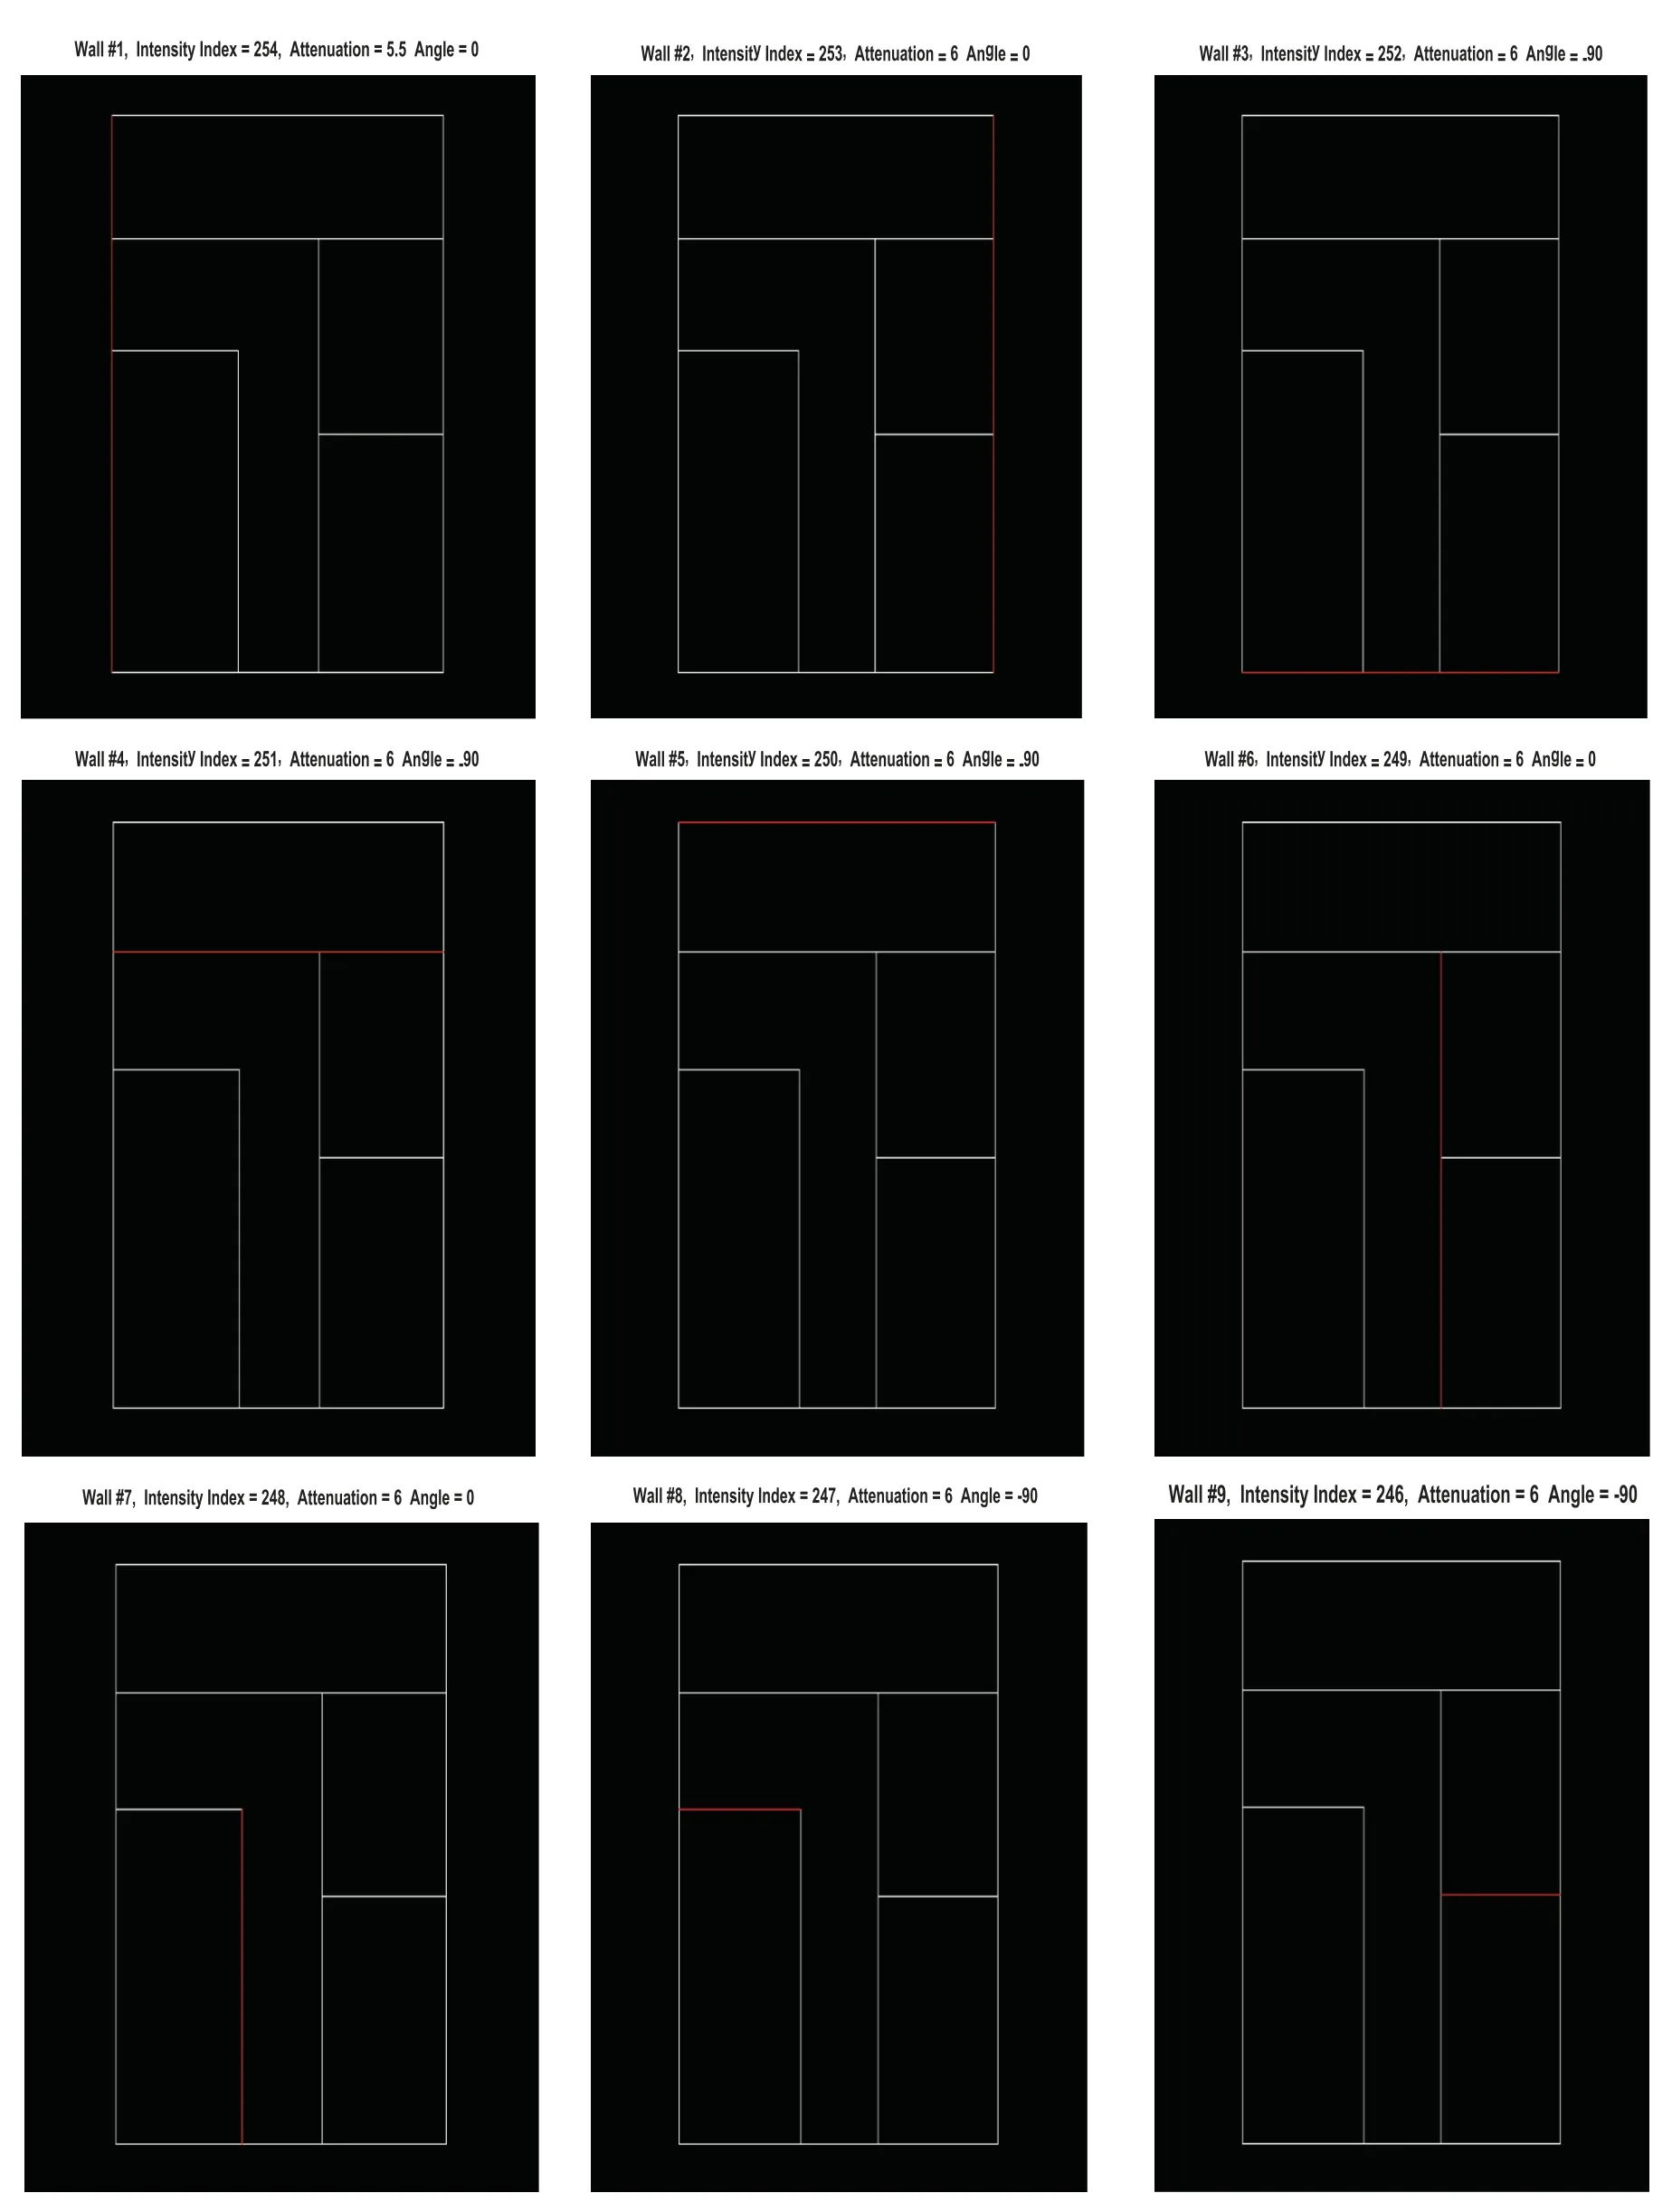
Figure 6:Wall detection via Hough space
3.2 Analysis of Fingerprinting Database and Verification
A Wi-Fi fingerprinting database is created using Motley Kennan propagation model [34].The system parameters are mentioned in Tab.2.The steps used in creating a validated database are as follows:
1.Wall detection
2.Distance map
3.Verification of database
3.2.1 Wall Detection
Hough transformation algorithm is used for detection of walls [22].It detects the number of walls from the blueprint image in the Hough space.Further,algorithm assigns different attenuation factors to different type of walls according to their intensity levels.Fig.6 shows the detection of all the nine walls from the blueprint image.
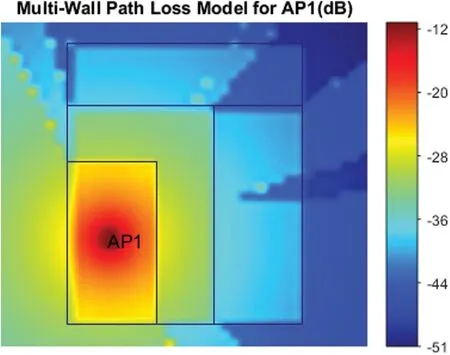
Figure 7:Heat map of AP1
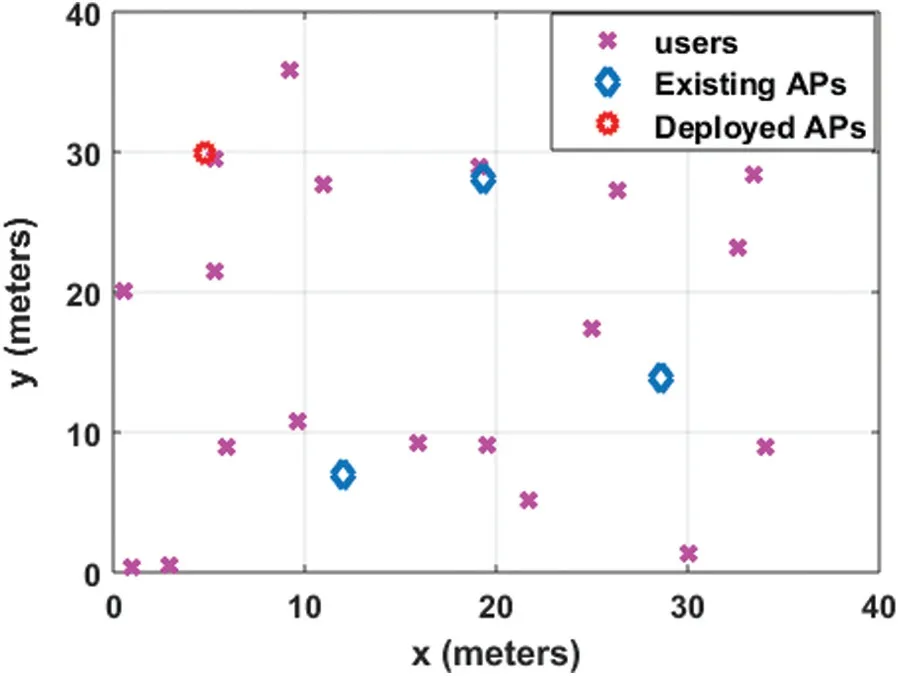
Figure 8:Random users and APs in interested area
3.2.2 Distance Map
After the deployment of initial set up APs,distance is calculated from each RP to all the APs using Eq.(10).

where,xiand yiare the coordinates of RPs andxjandyjare the coordinates for APs.
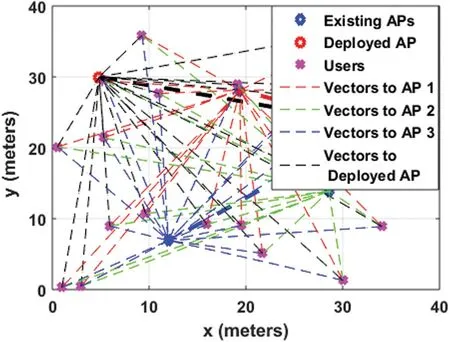
Figure 9:Formation of PV
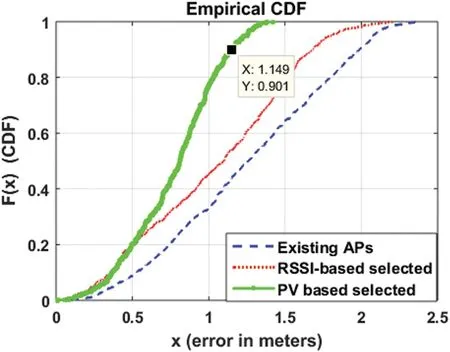
Figure 10:CDF comparison of the investigated algorithms (Case 1)
3.2.3 Database Verification
After calculating the RSSI values in dBs,a database is generated.Verification and validation of database for further steps of the proposed technique is carried out through the heat maps.Fig.7 shows the heat map for AP1.The red region depicts the strongest RSSI value of AP1 which decreases as the user moves away from it (color changes from yellow to blue).
3.3 Analysis of Selection of Access Point
This section illustrates the MATLAB simulation results for an indoor Wi-Fi test bed of 1600 RPs and 1000 users.The number of users can vary in the coverage area depending on time.For busy hours,there can be more users in the coverage area whereas less number of users at leisure hours.Nevertheless,an estimate has been made on a random fixed number of users in the given area.Fig.8 shows 15 random users in the coverage area.In the simulation,the PVs formed from each of the users to the APs are shown in Fig.9.Minimization of the distance determined through PV is the framework for the second phase of the AP selection;the first being the maximization of RSSI at the users.Fig.10 shows the CDF plots for localization error with a total of 3 localizing APs.Evidently,the PV based selection has produced the least error of 1.149 m at the 90th percentile;the RSSI-based selection yielded an error of 1.62 m whereas the initial set up of APs gave an error of 2.1 m.It is due to the noise present in the RSSI based selected APs by the reflection from walls and obstacles.It is intimating to calculate the direct paths between the APs and RPs.The RSSI based algorithm performs the AP selection which is nearer to the users as RSSI values decrease due to these obstacles and results in high localization error.

Table 3:Different values of crossover mutation probabilities for further investigations
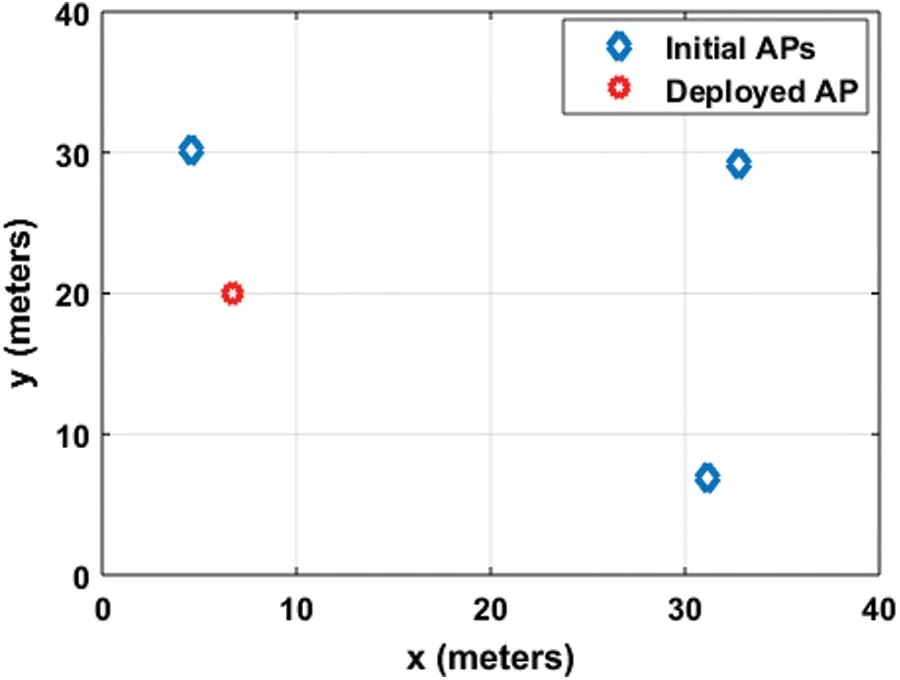
Figure 11:AP deployment after changing probabilities Case 2
PV based selection of APs solves this problem as it calculates a direct path between APs.PV has the ability to change its direction and magnitude with the user and select those AP which are nearer to the user,hence yields low localization error.Comparison with already existing APs is carried to show that by the deployment of the 4th AP in the system,localization accuracy is improved for both the selection algorithm,which ultimately favors the importance of deployment of 4th AP.
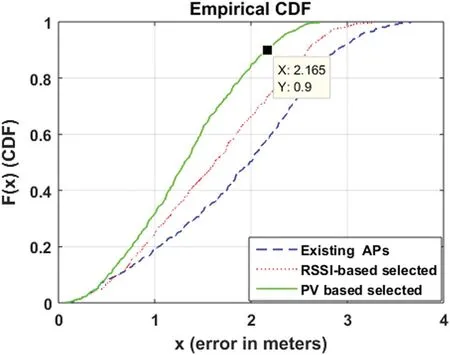
Figure 12:CDF of investigated algorithms for Case 2
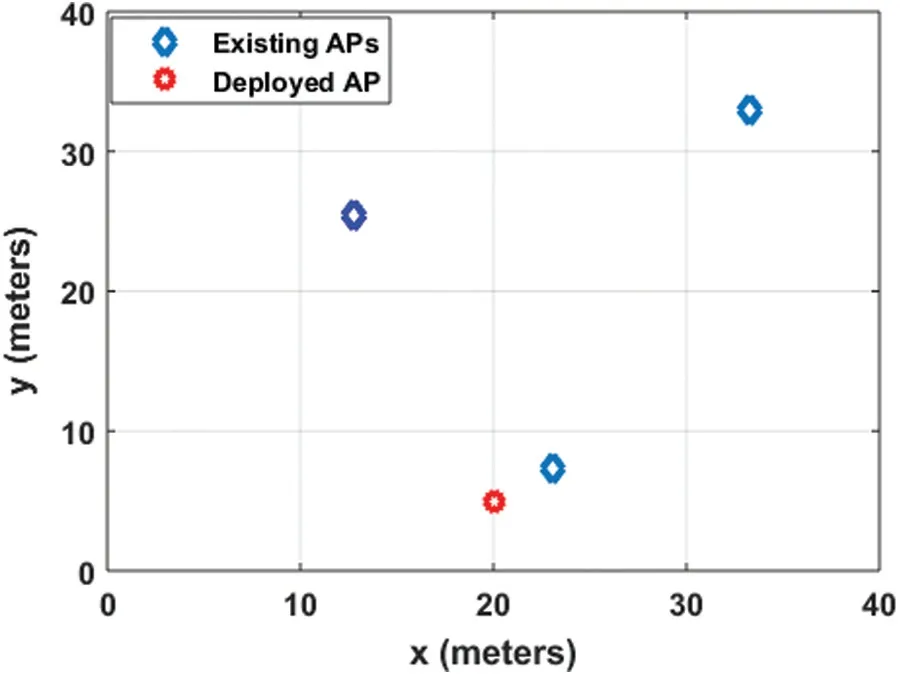
Figure 13:AP deployment after changing probabilities Case 3
3.4 Performance Analysis
Further investigations are carried out to verify the effect of different parameters on the localization accuracy of the proposed technique.Crossover and mutation probabilities help to select the best solution among the population in GA.If these probabilities are not carefully chosen,then an optimized deployment of the AP is not possible,which highly affects the localization accuracy of the system.Here,the values ofk(k-NN) and gray code bit length (L) remain constant.Tab.3 shows different values of crossover and mutation probabilities presented as Case 1 to Case 3.Case 1 is already discussed in Section 3.3 and PV based result of Case 1 will be further compared in this section.Figs.11 and 13 present the effect of deployment of additional APs for the other two cases.Figs.12 and 14 show a comparison of the accuracy of the proposed technique with the other two traditional methods.In both,Case 2 and Case 3,the PV based proposed technique outperforms the other two methods as depicted in Fig.15.
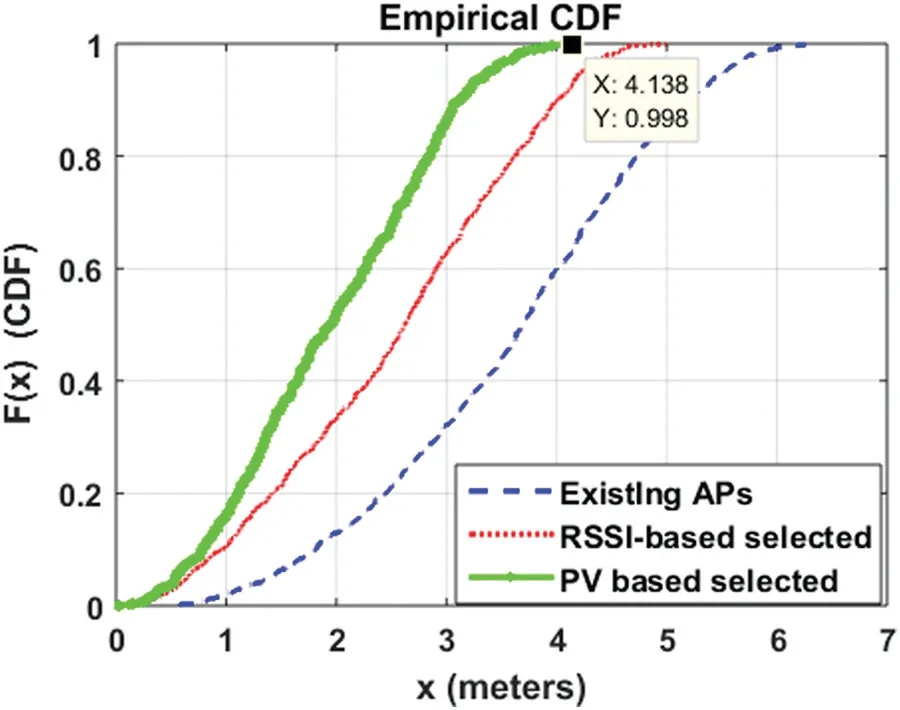
Figure 14:CDF of investigate algorithms for Case 3
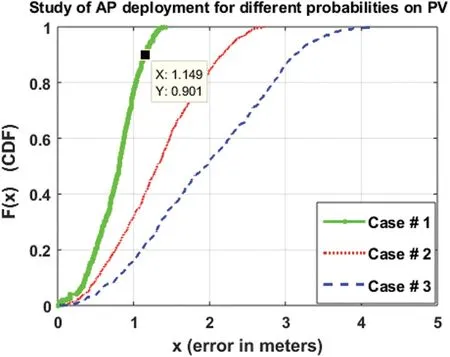
Figure 15:Comparison of CDF of three cases for PV based methods
4 Conclusion
This research work focuses on mitigating the non-line of sight propagation complexities,for locating a user,in an indoor environment while locating a user.We have proposed a technique combining the capabilities of different algorithms for AP deployment and AP selection processes,separately.Herein,GA along with EDOP is used for the deployment of an additional AP in the already existing infrastructure,while the AP selection is implemented using PV based algorithm.An RSSI database was created using Motley Kennan propagation model as a framework for EDOP based AP deployment.For classification and detection of the walls of the coverage area in the simulation,Hough transformation has been applied.Furthermore,attenuation factors were assigned to the walls to reduce multi-path effects and heat maps were utilized to validate the precision of the database.In the subsequent phase,PV based method ranked all the APs within the coverage area based on minimum PV distance and maximum RSSI value.After ranking of the APs,localization process is initiated with the three top ranked APs to completek-NN algorithm.In our research,the proposed AP selection algorithm effectively has reduced the localization error.We have evaluated the PV based results with the existing algorithms and our proposed method outperforms others in all cases.As a future work,we intend to apply adaptive filters on our database to minimize the errors in the offline phase that will eventually increase positioning accuracy.
Acknowledgement:The authors extend their appreciation to National University of Sciences and Technology for funding this work through Researchers Supporting Grant,National University of Sciences and Technology,Islamabad,Pakistan.
Funding Statement:The authors extend their appreciation to National University of Sciences and Technology for funding this work through Researchers Supporting Grant,National University of Sciences and Technology,Islamabad,Pakistan.
Conflicts of Interest:The authors declare that they have no conflicts of interest to report regarding the present study.
杂志排行
Computers Materials&Continua的其它文章
- Recognition and Detection of Diabetic Retinopathy Using Densenet-65 Based Faster-RCNN
- Adaptation of Vehicular Ad hoc Network Clustering Protocol for Smart Transportation
- Computational Microfluidic Channel for Separation of Escherichia coli from Blood-Cells
- A Fractal-Fractional Model for the MHD Flow of Casson Fluid in a Channel
- Simulation,Modeling,and Optimization of Intelligent Kidney Disease Predication Empowered with Computational Intelligence Approaches
- Prediction of Time Series Empowered with a Novel SREKRLS Algorithm
