Completion and stimulation trends in North American unconventional plays and resulting impact on well productivity
2021-11-12RomanGalchenkoQingLiuYanGaoYuLiuDavidHeJoshZhangHuailiangLiuXiaohuaKe
Roman Galchenko,Qing Liu,Yan Gao,Yu Liu,David He*,Josh Zhang,Huailiang Liu,Xiaohua Ke
(1.CNPC USA,Houston TX 77042,USA;2.CNPC Engineering Technology R&D Company Limited,Beijing 102206,China;3.College of Petroleum Engineering,China University of Petroleum(Beijing),Beijing 102249,China)
Abstract:Over the past decade,unconventional oil and gas exploration and development expanded considerably worldwide.Continuous technological progress and innovations in horizontal drilling and multi⁃stage hydraulic fracturing enabled extended⁃reach lateral wells,which coupled with high intensity multi⁃stage completions allowed operators to maximize both reservoir contact area and stimulated reservoir volume(SRV).However,challenges in completion optimization still remain and operators continue experimenting with various combinations of completion and stimulation parameters to ensure economic viability of developing unconventional reservoirs.Selecting optimal fit⁃for⁃purpose completion and stimulation parameters is a highly critical and field specific task.This paper summarizes the 2014-2020 fracture stimulation trends in 9 major North American unconventional plays:Marcellus,Haynesville,Barnett,Utica,Bone Spring,Bakken,Wolfcamp Midland,Eagle Ford,Scoop/Stack.The overall evolvement and trends of several key completion and stimulation parameters have been analyzed for each play.In addition,the influence of individual completion and stimulation parameters,such as stimulated lateral length,proppant intensity,stage spacing etc.,on well productivity has been evaluated.The initial post frac well productivity(average 90⁃day initial production rate)was analyzed to evaluate the impact of each completion parameter on well performance and determine the optimal range for each completion parameter leading to best well performance.
Key words:hydraulic fracturing;multistage completion;stimulation trends;well productivity;lateral length;proppant intensity;fluid intensity;stage spacing;well spacing;unconventional oil and gas;North American
0 Introduction
In the modern era of highly volatile oil prices and increasingly stringent environmental regulations the development of the largest unconventional oil and gas reservoirs all over the world is facing many challenges. The asset performance becomes paramount and in order to survive operators have to adapt to constantly changing market environment and adopt new technologies,processes,completion and stimulation practices and development strategies.Uniqueness of each reservoir defines the range of applicability for each completion and stimulation parameter that is measured up against its final contribution to well performance.To meet the new challenges,it’s highly important to identify the optimal applicability range for each completion and stimulation parameter specific to the reservoir.
The vast experience of North American operators to adjust their completion and stimulation strategies in accordance with market fluctuations is a highly valuable source of data.Thorough analysis of recent trends and evolutionary changes in well completion and stimulation practices can provide valuable insight and help assess the viability,cost,and benefits associated with each completion and stimulation parameter.
This study provides a comprehensive summary of the most recent trends in well completion and stimulation practices applied in North American unconventional oil and gas plays in 2014-2020.In addition,the initial 90⁃day post frac well productivity was analyzed to evaluate the impact of each completion parameter on well performance.
1 Well selection criteria
For the purpose of this study a total of 9 North American unconventional oil and gas plays have been selected which are listed below(see Fig.1):

Fig.1 Selected Nor th Amer ican plays
Gas fields:
(1)Marcellus NE—Northern Appalachian Basin
(2)Haynesville—North Louisiana Salt Basin
(3)Barnett—Fort Worth Basin
(4)Utica—Appalachian Basin
Oil fields:
(5)Bone Spring—Delaware Basin
(6)Bakken—Williston Basin
(7)Wolfcamp Midland—Midland Basin
(8)Eagle Ford—Texas Gulf Coast Basin
(9)Scoop/Stack—Anadarko Basin
Table 1 and Table 2 summarize key properties for each gas and oil play selected for this study.
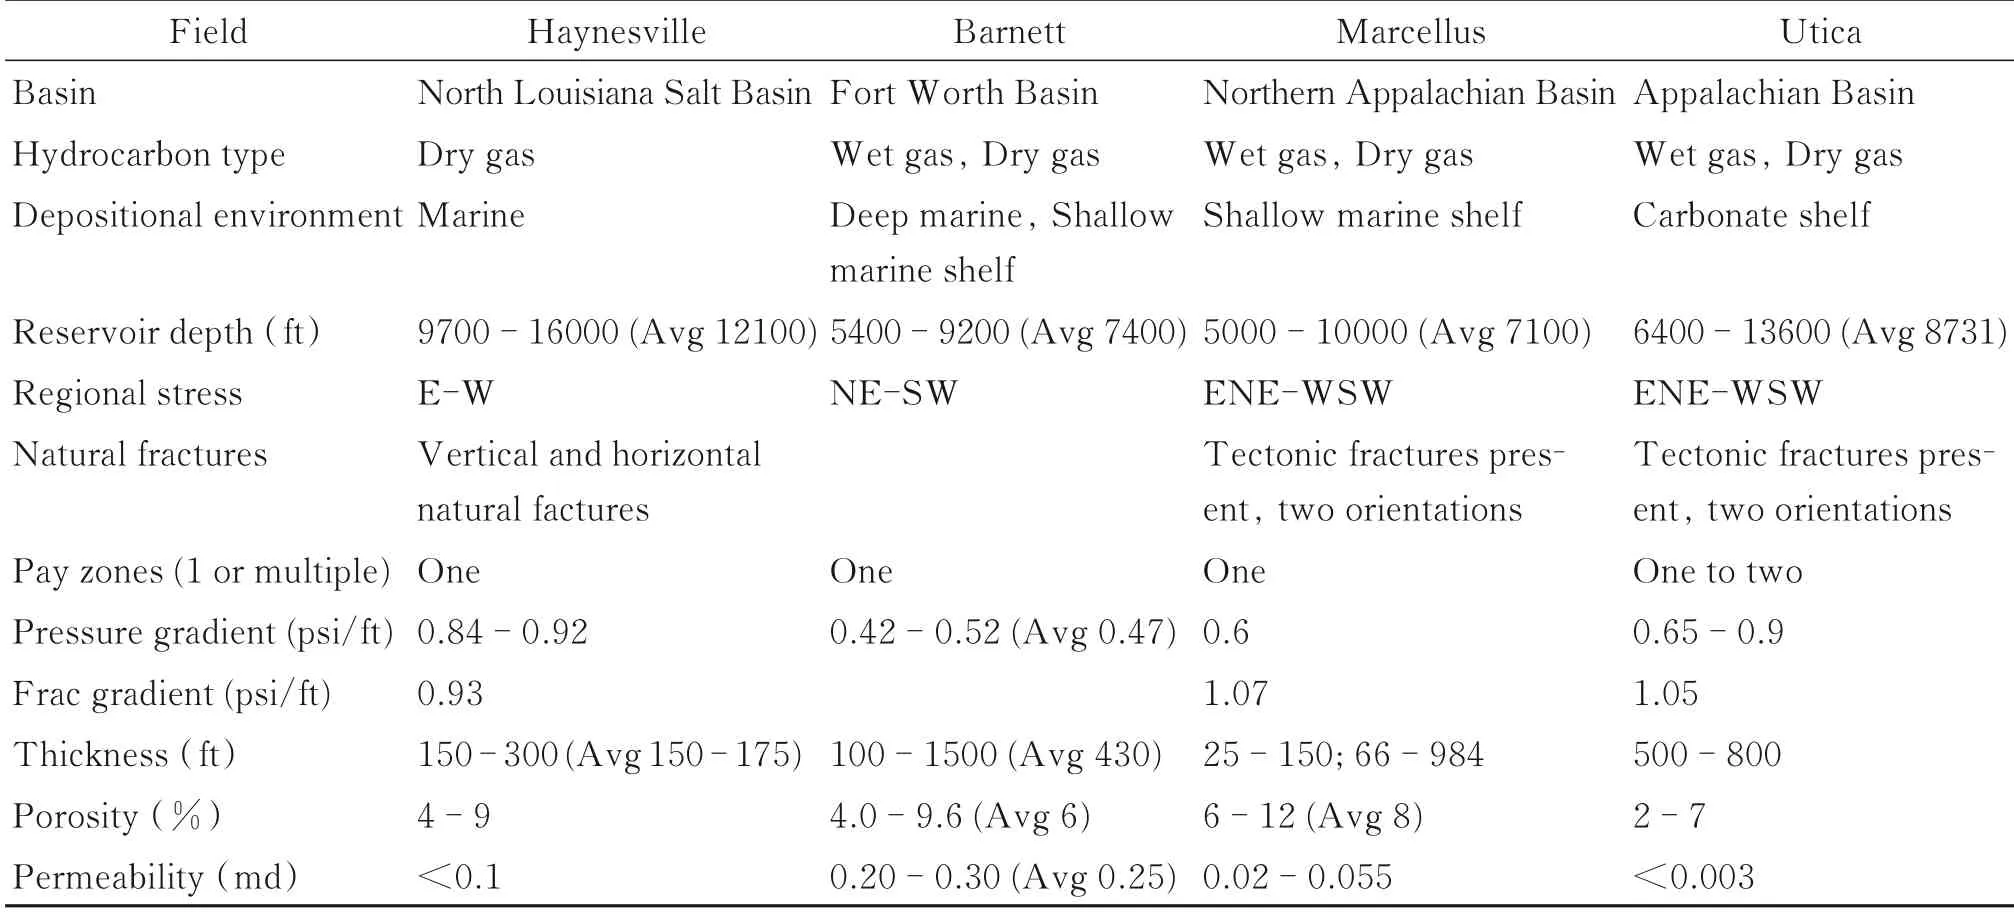
Table 1 Selected Nor th Amer ican plays—gas plays summary
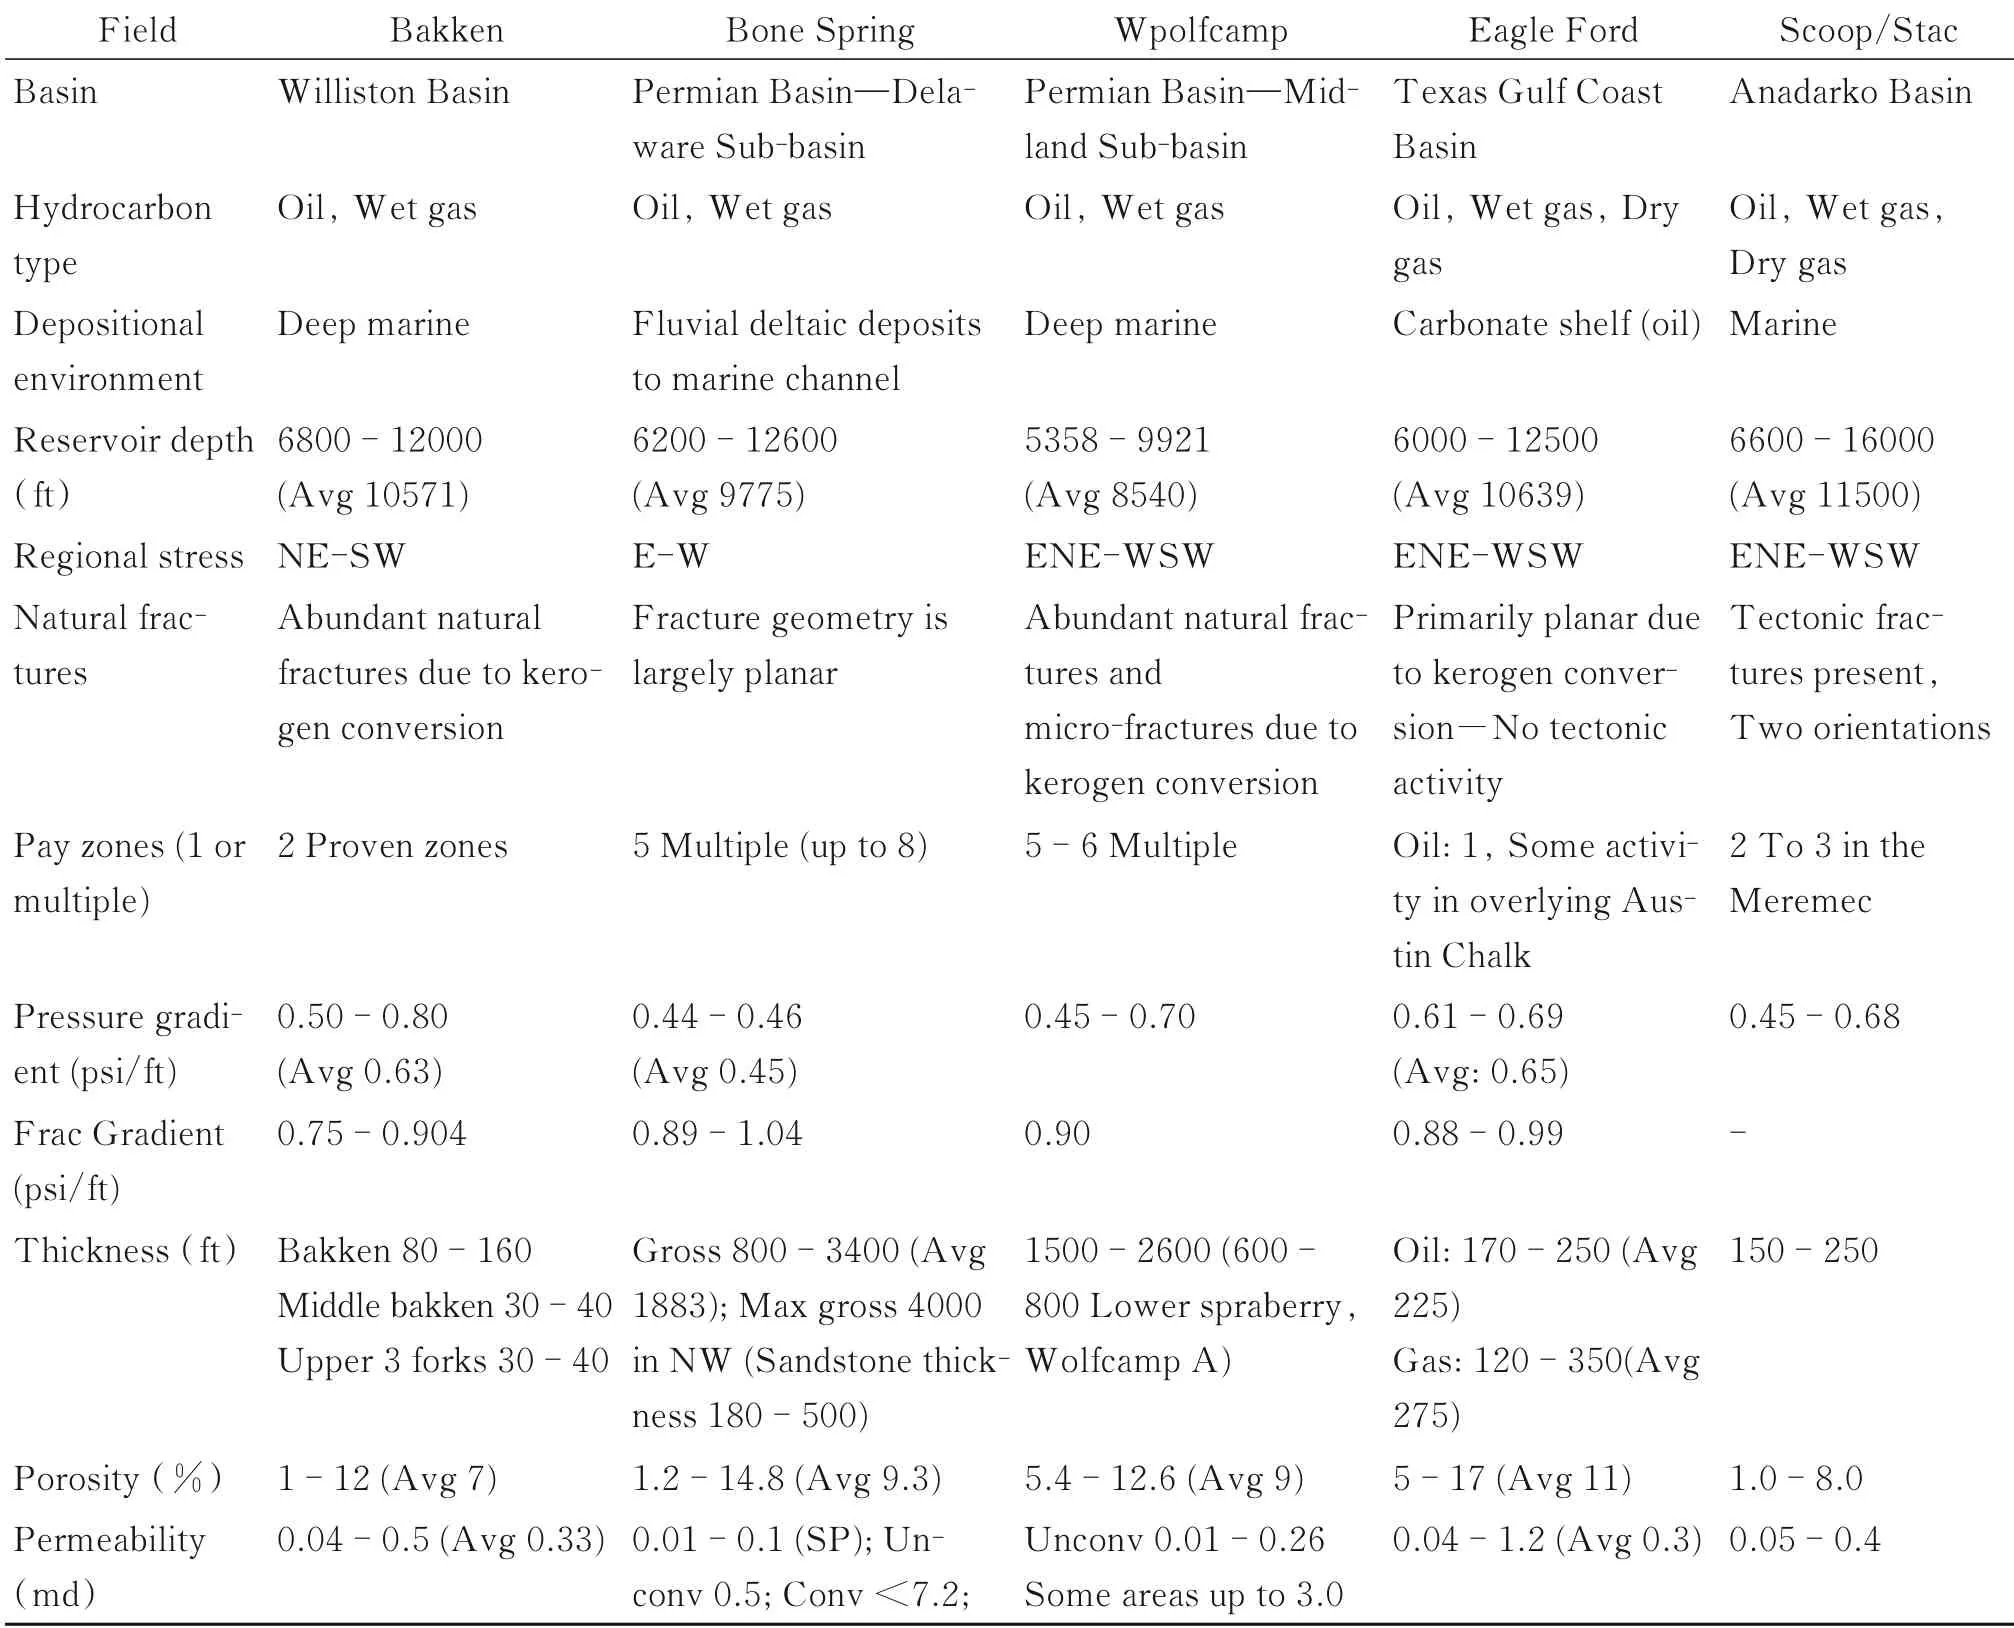
Table 2 Selected North American plays—oil plays summary
Step 1:All data sources were evaluated for well data availability for each selected unconventional oil and gas play.The initial well screening was performed selecting horizontal wells completed within 2014-2020 time period.
Step 2:The detailed well data was gathered from several data sources:IHSM EDM Database,FracFocus Chemical Database and IHSM Internal Frac Database.The overall unconventional play well list comprised around~62000 wells[1].
Step 3:The stage level completion data was unified and filtered.
Step 4:Finally,well data was organized together(~3600 wells)applying the following guidelines to finalize selection:(a)For each year and each play,minimum 5 wells were selected.(b)A subset of criteria is calculated for filtering purpose.The selection criteria were based on the data availability of the following:First 12 months of production,Length of lateral,Proppant intensity,Fluid intensity,Number of stages,Difference in%of well level average 12⁃month production vs play level average 12⁃month production.As a result,the final list comprised a total of 624 wells[1].
2 Fractur e stimulation trends
Trends of key completion and fracture stimulation parameters were analyzed first prior to reviewing its impact on well performance.The 2014-2020 changes in the following key completion parameters have been reviewed:Lateral length,Stage spacing, Proppant intensity and fluid intensity[1-5].
2.1 Lateral length and stage spacing
The average stimulated lateral length from 2014 to 2020 increased in the majority of the oil plays,except Bakken(see Fig.2).In Bakken,stimulated lateral length remained relatively stable at+/-9500 ft.Bone Spring(+/-8300 ft in 2020)and Scoop Stack(+/-8500 ft in 2020)had the most significant lateral length increase of more than 60%compared to 2014[1,6].
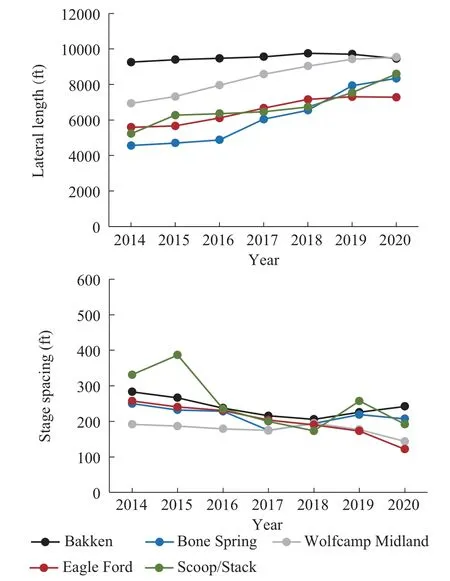
Fig.2 Fr actur e stimulation trends 2014-2020—Lateral length and stage spacing for oil plays
Among the reviewed gas plays(see Fig.3),the Barnett play in 2020 vs.2014 had the most dramatic average lateral length increase of~104%reaching~8500 ft.Marcellus and Utica plays in 2020 also increased the average lateral length compared to 2014 to~9000 ft(70%increase)and~11000 ft(80%increase)respectively[1,7-8].

Fig.3 Fracture stimulation trends 2014-2020—Lateral length and stage spacing for gas plays
2.2 Proppant intensity
In all reviewed oil plays,the amount of proppant pumped per foot of lateral gradually increased year⁃to⁃year since 2014,except for Bakken and Wolfcamp,where it appears to plateau in 2017(see Fig.4).In 2020,proppant intensity in oil plays varied from~1000 lbs/ft in Bakken to~2000 lbs/ft in Bone Spring,Wolfcamp,Scoop/Stack and~2500 lbs/ft in Eagle Ford.In 2020 vs.2019 the proppant per foot increased additional 2%in Bone Spring,5%in Eagle Ford and 2%in Scoop Stack.In general,all oil play operators determined that higher proppant concentrations per foot of lateral result in improved well productivity.Sand has become the dominant proppant across all oil plays.Resin coated sand(RCS)and ceramic proppant use has been relatively minimal since 2016[9-11].
In all reviewed gas plays the amount of proppant pumped per foot of lateral in 2020 remained stable relative to 2019 except for Barnett,where it dropped a drastic 38%from~1800 lbs/ft in 2019 down to~1000 lbs/ft in 2020,returning back to 2017-2018 levels as operators attempting to cut costs(see Fig.4).The lowest proppant intensity in reviewed gas plays in 2020 was in Barnet(~1000 lbs/ft)and the highest in Haynesville(~3200 lbs/ft).In Utica operators have found the optimal proppant intensity at~2000 lbs of proppant per foot of lateral.The total proppant volumes per well in gas plays have increased significantly over the years,reaching in 2020 about 26 MM lbs in Haynesville,~9 MM lbs in Barnett,~18 MM lbs in Marcellus and~21 MM lbs in Utica.In gas plays sand has become the primary proppant as well[1,7,12].
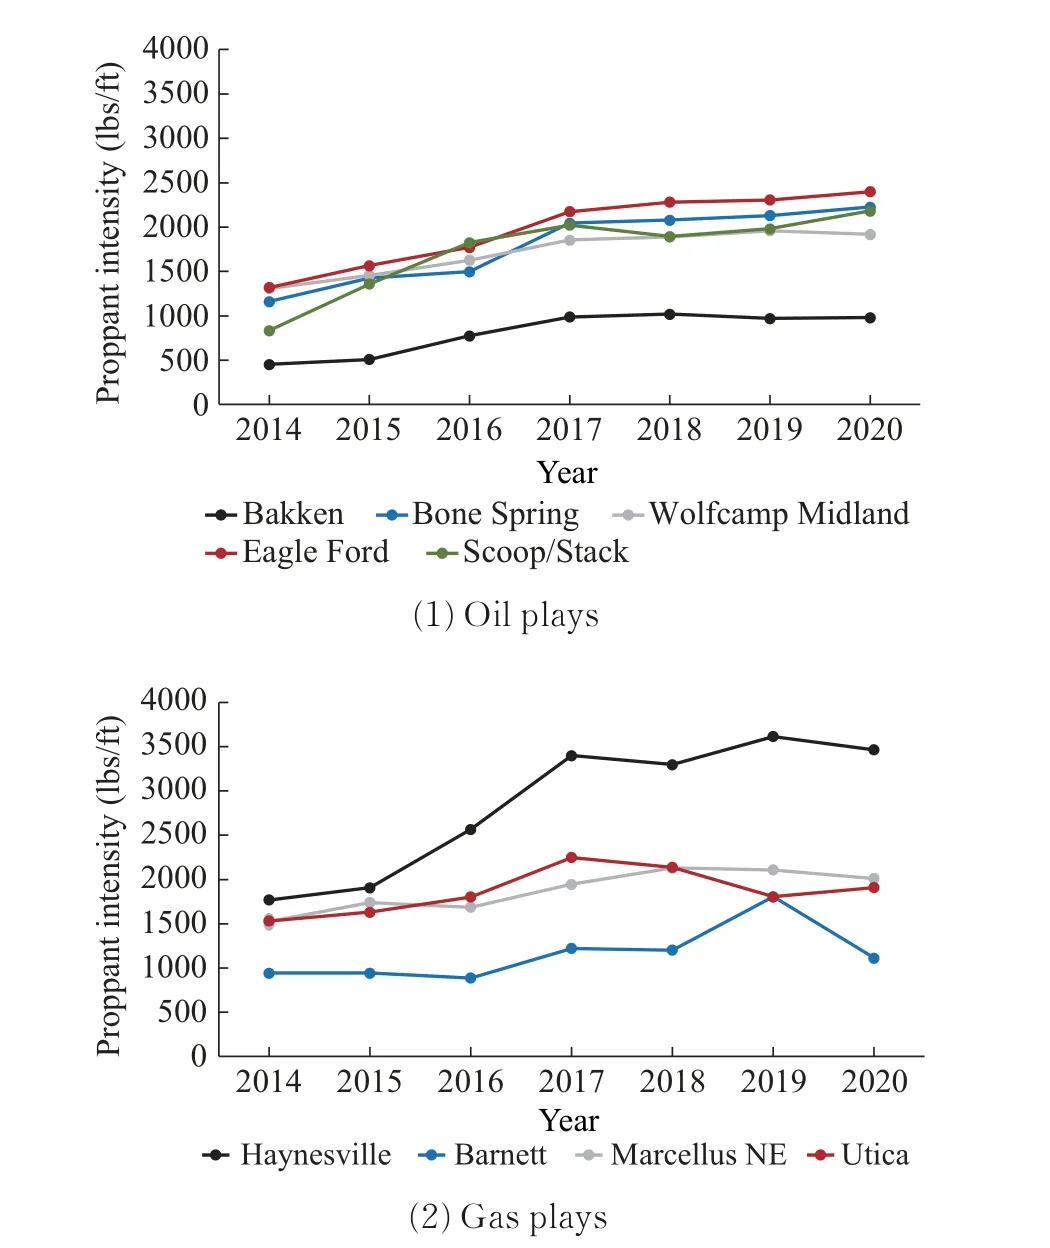
Fig.4 Fracture stimulation trends 2014-2020—Proppant intensity
2.3 Fluid intensity
In all oil plays the volume of fluid pumped per foot of lateral increased gradually since 2014 reaching maximum values in 2017 where it appears to plateau.In 2020 the volumes decreased slightly relative to 2019 levels except Scoop Stack,where it increased slightly to~2000 gal/ft(3%increase compared to 2019).In other oil plays fluid intensity in 2020 decreased down to~900 gal/ft in Bakken(-8%compared to 2019),~1900 gal/ft in Bone Spring(-4%),~2000 gal/ft in Wolfcamp(-3%),and~1800 gal/ft in Eagle Ford(-7%compared to 2019)(see Fig.5)[13-16].

Fig.5 Fracture stimulation trends 2014-2020—Fr ac fluid volume
In Haynesville and Marcellus NE gas plays the volume of fluid pumped per foot of lateral in 2020 slightly increased compared to 2019 levels reaching~3500 gal/ft in Haynesville(5%increase)and~1600 gal/ft in Marcellus NE(2%increase).In Barnett the fluid intensity dropped dramatically in 2020 down to~1100 gal/ft(-48%decrease compared to 2019).In Utica the volume of fluid pumped per foot of lateral also decreased down to~1700 gal/ft(-11%decrease compared to 2019)[1,12].
3 Impact of stimulation parameters on well productivity
This section will study the dependency between a single stimulation parameter and normalized well productivity per 1000 ft of stimulated lateral length.The well productivity distribution charts were utilized to identify the optimal range for any given completion parameter that results in best well performance for each selected play.The well productivity was analyzed against the following stimulation parameters:Lateral length,Proppant intensity,Fluid intensity,Stage spacing,Well spacing[1].
To properly compare the well productivity between different completion types and plays,the well productivity was normalized per 1000 ft of lateral length and reported in barrels of oil equivalent per day units(boe/d).Combined oil and gas production have been used for analysis,where gas production have been normalized to boe units utilizing gas to oil conversion factor of 6∶1(MCF to BOE)based on thermal equivalency(6 mcf of gas produces the same amount of heat energy as 1 barrel of oil).Normalized well productivity—i.e.initial daily production averaged for months 2-4 and normalized for 1000 ft of stimulated lateral length(normalized 3⁃month IP)was evaluated to analyze normalized well productivity trend[1].
3.1 Normalized well productivity
The well productivity trends for reviewed North American oil plays for the period 2014 through 2020 normalized per 1000 ft of lateral are shown in Fig.6.As can be seen on Fig.6 the normalized well productivity per 1000 ft of lateral reached its maximum in 2017-2018 in all oil plays,except Scoop/Stack where it peaked in 2016 year.After 2018,the normalized productivity per 1000 ft began to gradually decline in all plays,except the Wolfcamp(Midland)where it stabilized at+/-80 boe/d/1000 ft.Compared to its peak values in 2017-2018,the normalized productivity in 2020 dropped~14%in Bakken(85-73 boe/d/1000 ft),~19%in Bone Spring(153-124 boe/d/1000 ft),~12%in Eagle Ford(101-89 boe/d/1000 ft)and~44%in Scoop/Stack(102-57 boe/d/1000 ft).
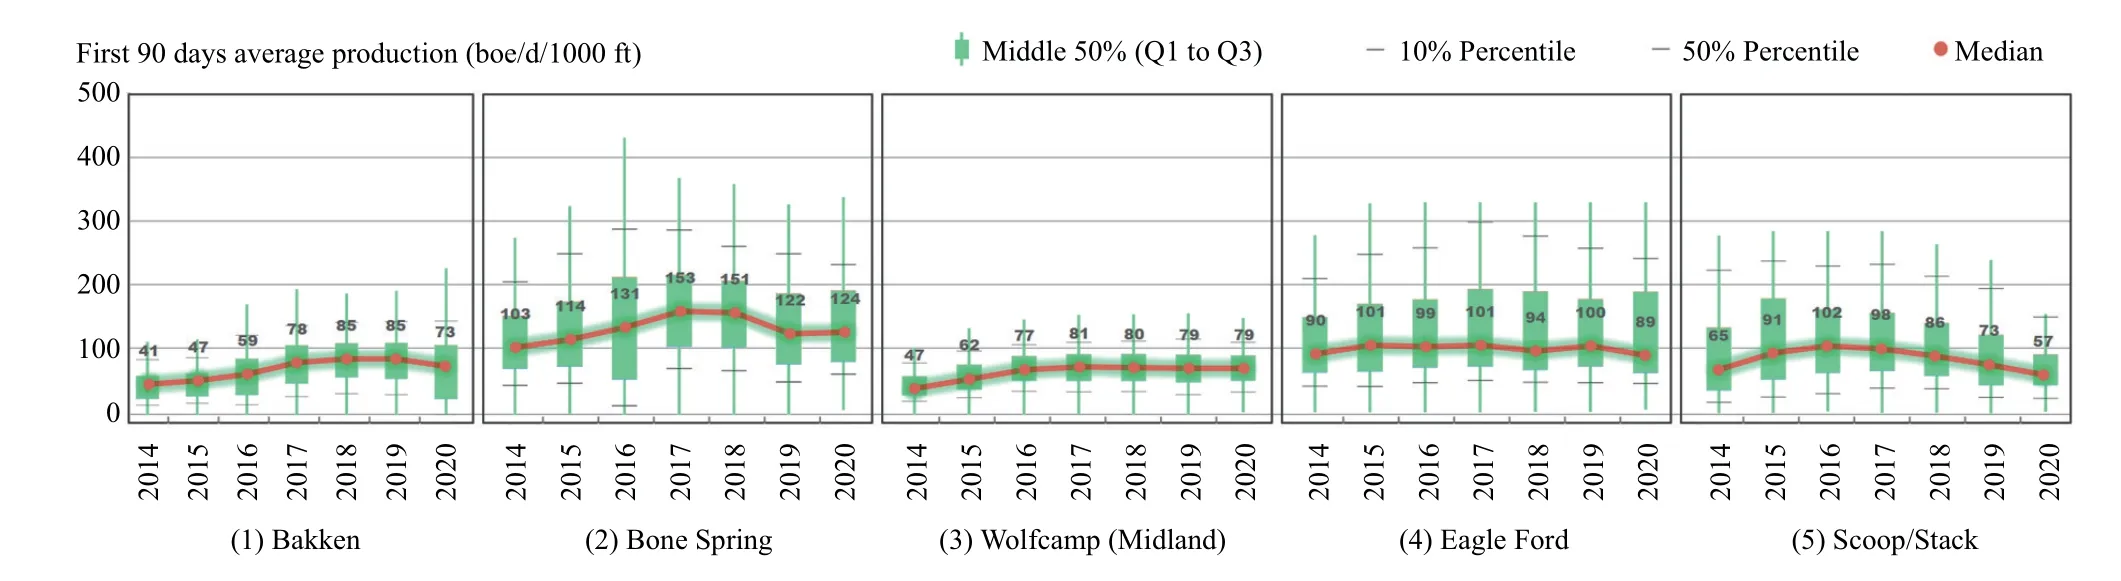
Fig.6 Normalized well performance—Oil plays
Likewise,in all reviewed gas plays the normalized well productivity per 1000 ft of lateral length reached its maximum levels in 2017-2018,except Haynesville,where it peaked in 2020 reaching+/-378 boe/d/1000 ft)(see Fig.7).Barnett demonstrated significantly lower normalized well productivity compared to other gas plays,but more consistent ranging in 2016-2020 from 69 to 87 boe/d/1000 ft.Compared to its peak values,the normalized well productivity in 2020 decreased~38%in Marcellus NE(266-165 boe/d/1000 ft)and~35%in Eagle Ford(271-176 boe/d/1000 ft).
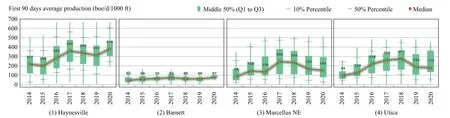
Fig.7 Nor malized well per for mance—Gas plays
3.2 Lateral length
The dependency between a single stimulation parameter and normalized well productivity was analyzed using distribution charts,where ranges of productivity are plotted for wells grouped into several bins based on the value of selected completion parameter,such as lateral length,stage spacing interval,proppant intensity,etc.Each bin shows the range of productivity for wells,where the value of selected completion parameter lies within a range of values that define that bin—e.g.wells with lateral length from 9000 to 10000 ft or wells with stage spacing from 100 to 200 ft.Consequently,the well productivity for varies bins can be compared to identify the optimal range of values for a given completion parameter.
The green bar for each year shows the middle productivity range(from Q1⁃25% to Q3⁃75%percentile)representing the range where the middle 50%of all well productivities in boe per day fall into—i.e.the range after excluding 25%of the highest and 25%of the lowest values of well productivity.The red dot corresponds to the Median well productivity value for each year—i.e.50% of the wells in the play had better productivity and 50%of wells had lower productivity in that year.
It has been found out by most oil play operators that after~10000 ft of lateral the productivity per foot appears to plateau or drop. In Bakken,Wolfcamp and Eagle Ford the normalized well productivity plateaued after 10000 ft.As can be seen for each of these oil plays,the initial 90 days well productivity for 10000 ft,12000 ft and 14000 ft laterals normalized per 1000 ft remained quite consistent.In Bone Spring and Scoop Stack the normalized well productivity declined for the wells with laterals beyond 10000 ft and 8000 ft respectively(see Fig.8).

Fig.8 Well per formance vs lateral length—Oil plays
As can be seen on Fig.9 the well productivity vs.lateral length trends in gas plays varies from play to play.Haynesville operators have found that 10000 ft laterals outperform the longer 12000 and 14000 ft laterals in terms of productivity per foot.In Marcellus NE,on the other hand,the best productivity per foot demonstrated laterals in 12000-14000 ft length range,and 8000-10000 ft laterals were 25%less productive compared to 4000 -6000 ft laterals.Operators in Barnett have found that 10000 ft laterals outperform 6000-8000 ft laterals.Utica showed productivity increase of 56%for the 10000-12000 ft lateral length compared to 6000-8000 ft lateral length range.

Fig.9 Well performance vs later al length—Gas plays
3.3 Proppant intensity
All oil plays demonstrated improved well productivity at higher proppant concentrations per foot of lateral from 3000 to 3500 lbs/ft.In Scoop/Stack the highest productivity observed at~4000 lbs/ft.In general,the linear dependency of well productivity vs.proppant pumped was observed in all plays(see Fig.10).
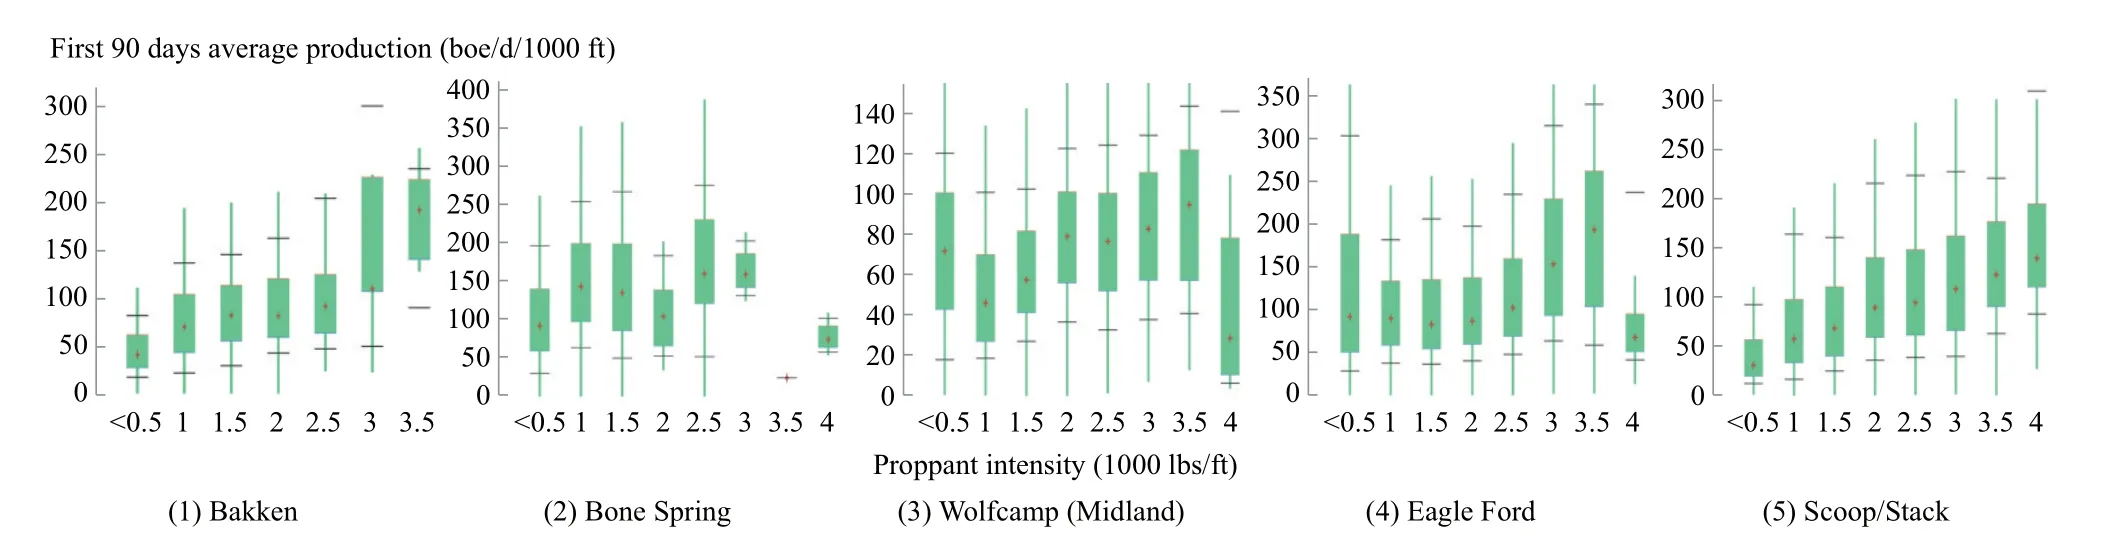
Fig.10 Well performance vs proppant intensity—Oil plays
Similar situation in gas plays. The well productivity improves at higher proppant concentrations per foot of lateral.Haynesville and Utica plays showed best increase of productivity for proppant volumes above 3000 lbs/ft of lateral.Increased proppant intensity in Barnett has some positive impact but optimum is considered to be between 1000-1500 lbs/ft of lateral.In Marcellus shale the more dramatic productivity increase observed at concentrations above 2500 lbs/ft,excluding the extreme proppant concentration of 4000 lbs/ft where normalized productivity dropped(see Fig.11).

Fig.11 Well performance vs proppant intensity—Gas plays
3.4 Fluid intensity
The comparison of fluid intensity or fluid volume pumped per foot of lateral for gas plays is shown in Fig.12.Bakken,Bone Spring and Eagle Ford demonstrated mostly linear increase of well productivity with increase of fluid volumes pumped per foot all the way up to 5000 gal/ft of lateral.Wolfcamp and Scoop Stack have found the best productive range of around 4000 gal/ft of lateral.
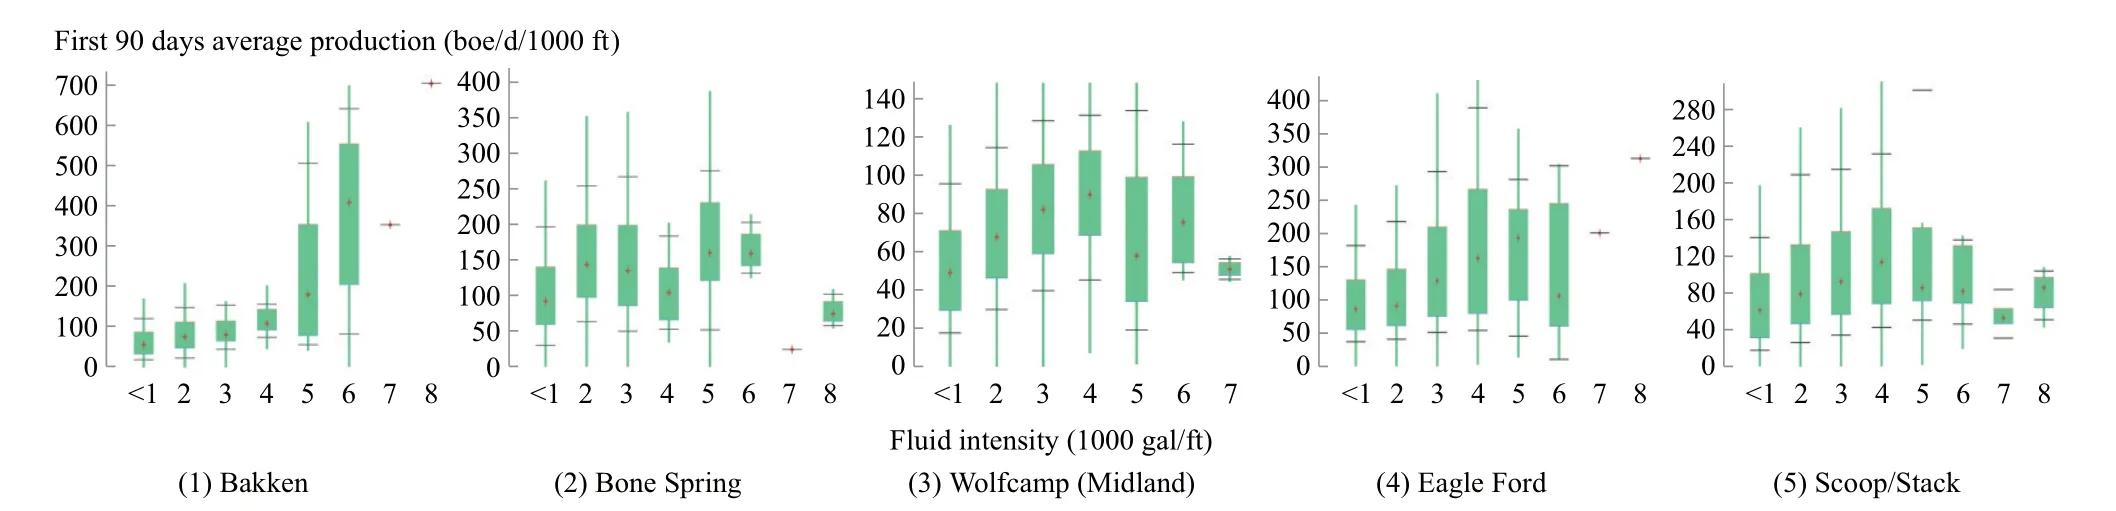
Fig.12 Well performance vs fluid intensity—Oil plays
Similar linear dependency of well productivity vs fluid volume pumped per foot observed in all gas plays except Marcellus.Operators in Haynesville,Barnett and Utica have found that 6000-7000 gal/ft fluid volumes result in the highest well productivity.In Marcellus the range between 2000-3000 gal/ft fluid volumes resulted in the best normalized well productivity(see Fig.13).
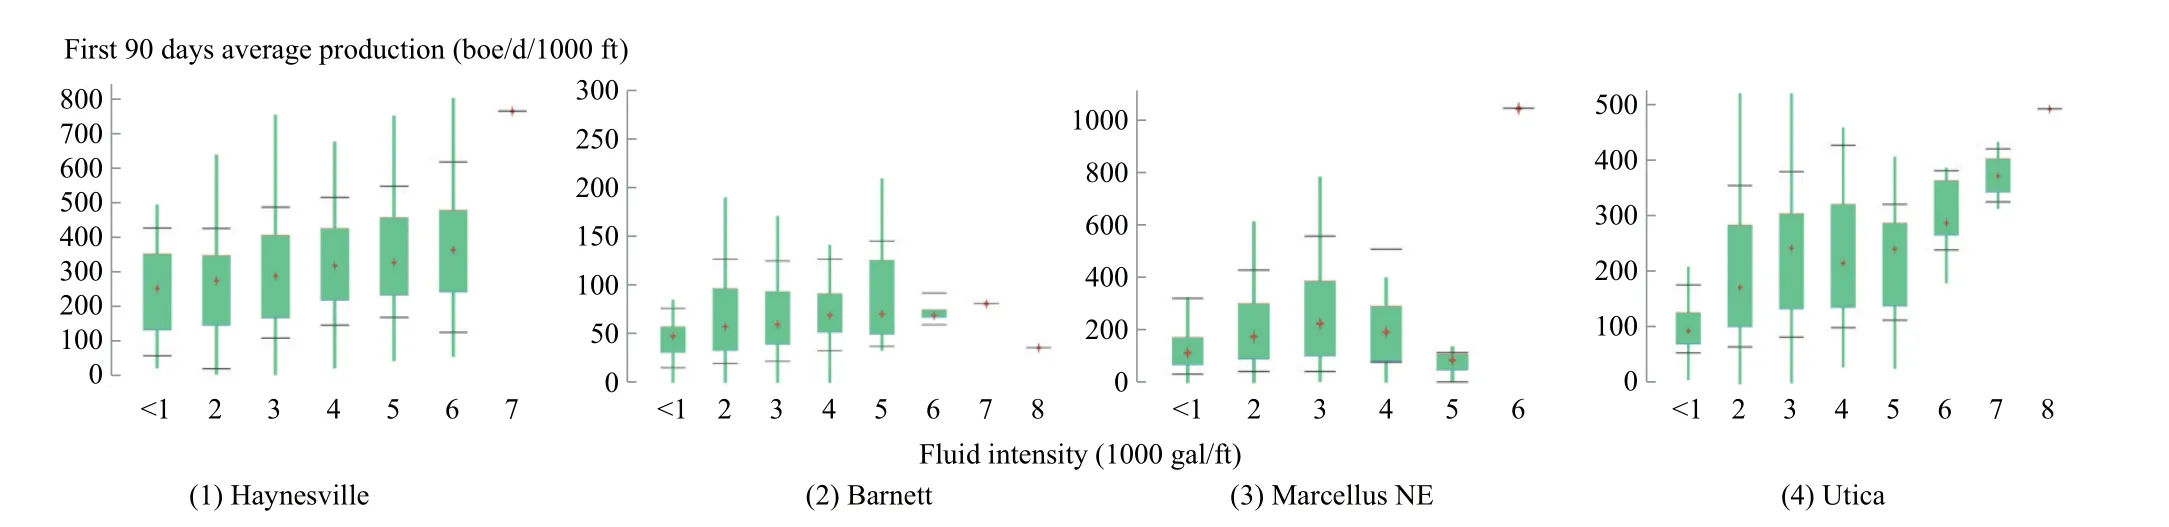
Fig.13 Well performance vs fluid intensity—Gas plays
3.5 Stage spacing
Overall,the shorter stage spacing of less than 200 ft results in best well productivity across all plays(see Fig.14).In Wolfcamp,the efficiency of stage spacing above 400 ft cannot be confirmed due to the limited data availability(only 7 wells with stage spacing above 400 ft).
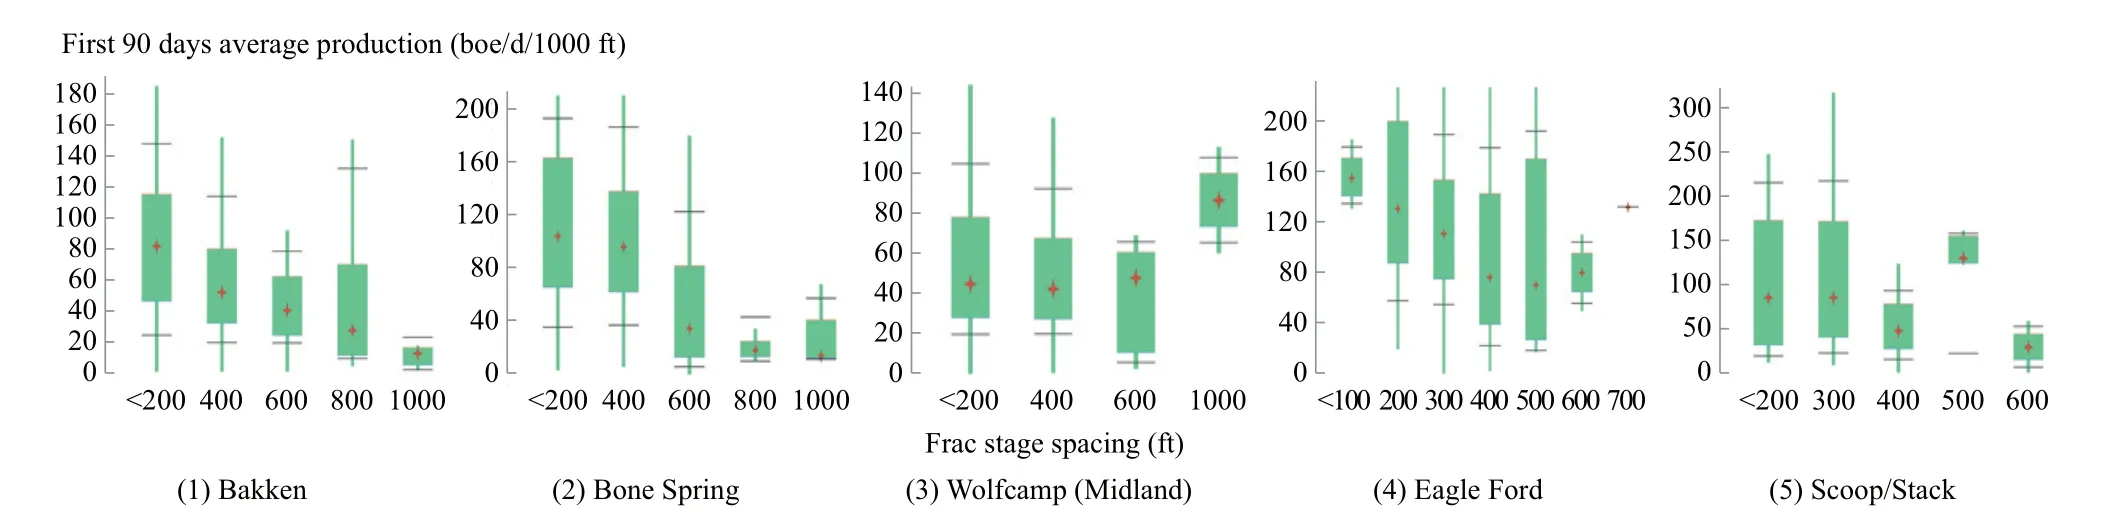
Fig.14 Well performance vs stage spacing—Oil plays
In general,for gas plays the optimum frac stage spacing appears to be between 100-250 ft except Barnett(see Fig.15).For Barnett the stage spacing of 300-500 ft appears to provide the best normalized productivity return.In Haynesville Shale the 100-200 ft is the best stage spacing range with highest productivity and was still the most popular in 2020.
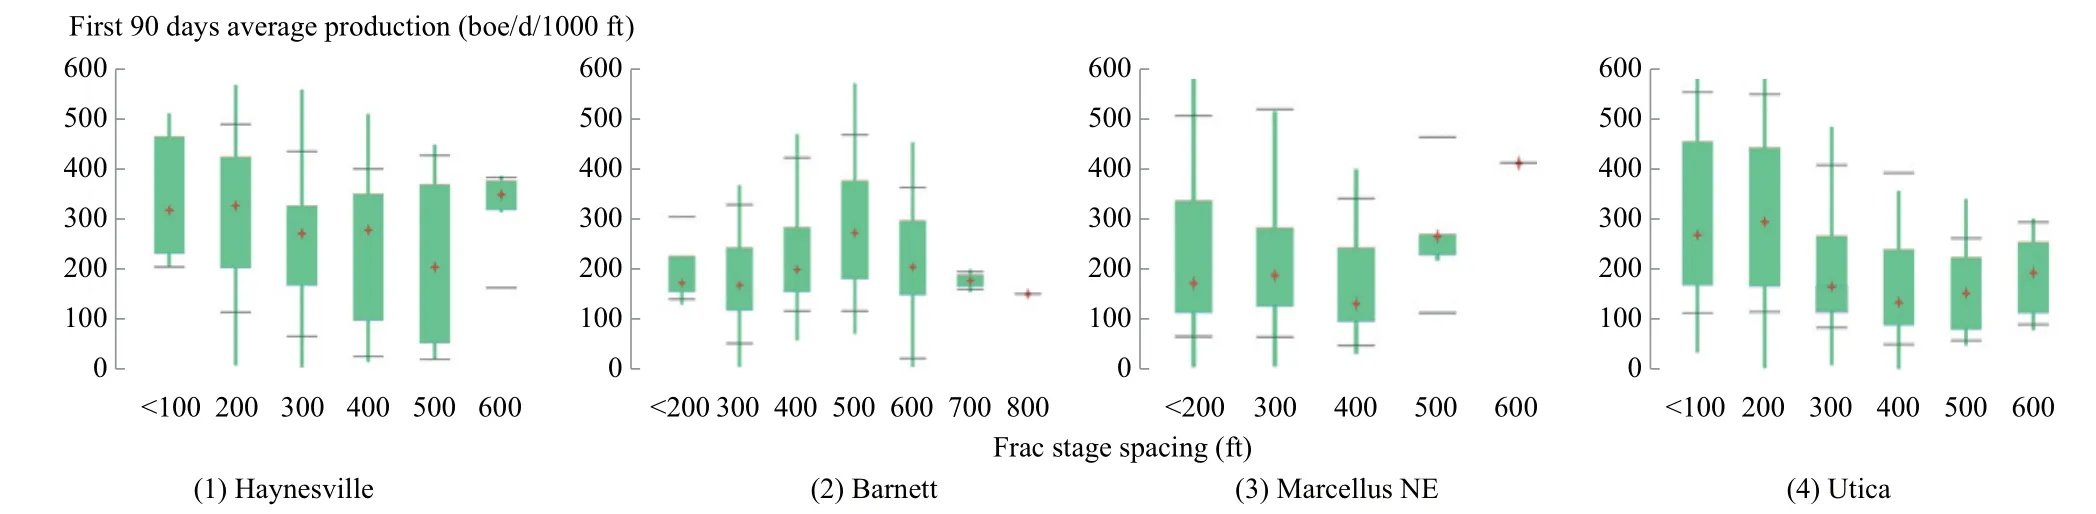
Fig.15 Well performance vs stage spacing—Gas plays
3.6 Well spacing
In Bakken,Eagle Ford,and Scoop Stack it appears that better results are obtained by closer well spacing which is counter⁃intuitive(see Fig.16).This relationship may be a function of more recent wells drilled in sweet spots.Overall,we see that tighter spacing does not hinder performance.
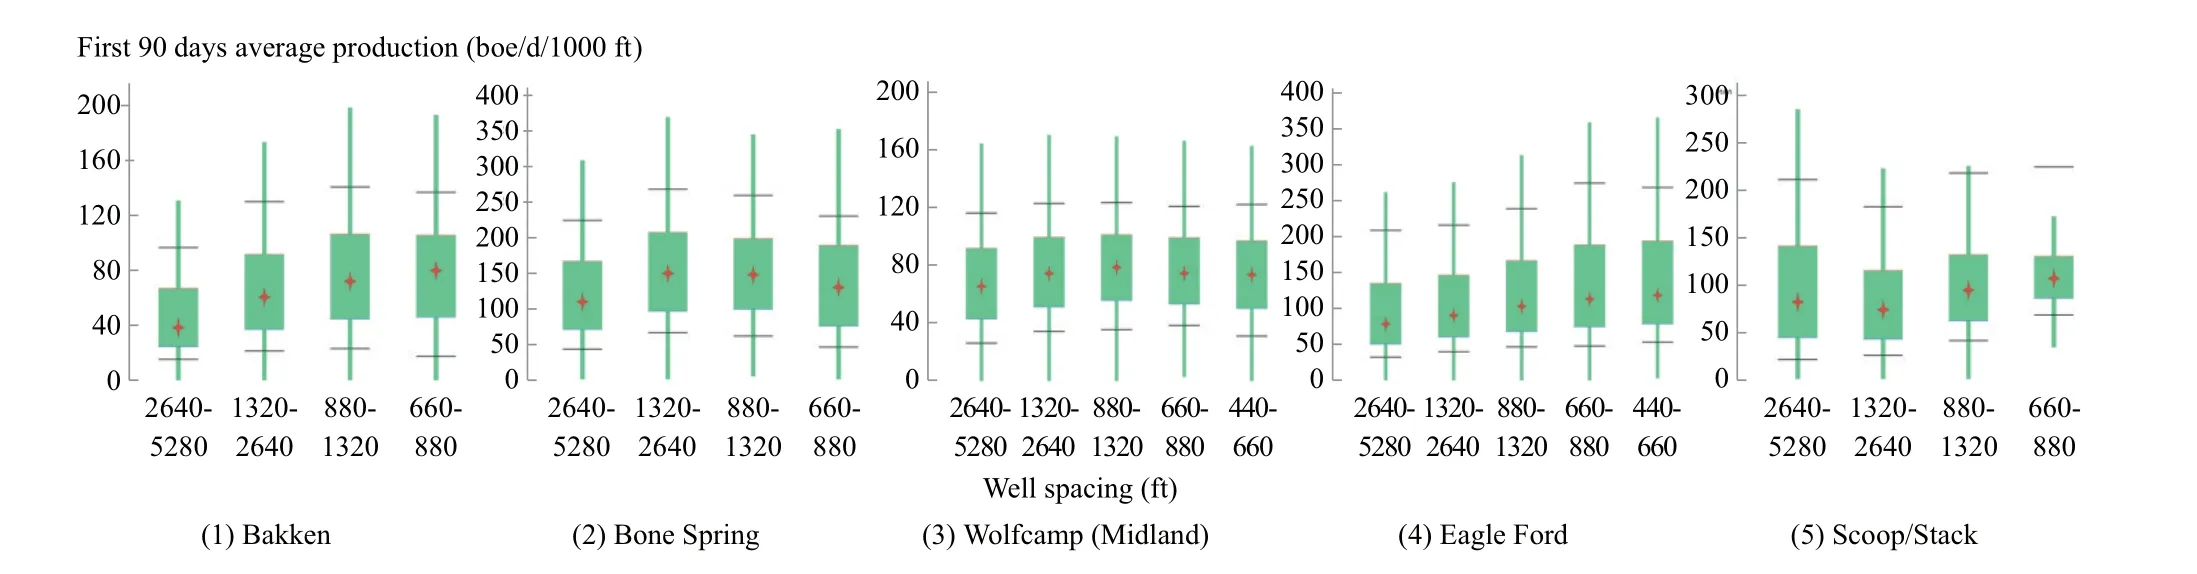
Fig.16 Well performance vs well spacing—Oil plays
In Haynesville,Marcellus and Utica it appears that performance decreases with tighter well spacing,with a noticeable deterioration below 660 ft spacing.In Barnett we see that tight spacing below 440 ft does not hinder performance,probably due to recent wells drilled in sweet spots(see Fig.17).

Fig.17 Well perfor mance vs well spacing—Gas plays
4 Conclusion
Overall evolvement and 2014-2020 trends of several key completion and stimulation parameters such as stimulated lateral length,proppant intensity,fluid intensity,stage spacing and cluster spacing have been analyzed for a total of 9 major unconventional plays in the United States.
In addition,the initial post frac well productivity(average 90⁃day initial production rate)was analyzed to evaluate the impact of each completion parameter on well performance. Consequently,the well productivity distribution charts were utilized to identify the optimal range for any given completion parameter that results in best well performance for each selected play.
The following conclusions have been made:
(1) Normalized well productivity: The normalized well productivity per 1000 ft of lateral in all reviewed North American oil and gas plays reached its maximum in 2017-2018 except for Haynesville gas play where it peaked in 2020 and Scoop/Stack oil play where it peaked in 2016.With longer laterals being drilled more in recent years the decrease in normalized well productivity can be attributed to higher complexity and overall lower drilling and completion efficiency related to longer laterals and operators begin to see diminishing returns in terms of normalized well productivity.
(2)Lateral length:From 2014 to 2020 the average stimulated lateral length has significantly increased in all reviewed gas plays(~40%increase in Haynesville,and up to ~105% increase in Barnett)and majority oil plays except Bakken(~2%increase in Bakken and up to 85%increase in Bone Spring).In terms of impact of lateral length on well productivity—majority of reviewed oil and gas play operators have found that after+10000 ft of lateral the well productivity normalized per foot of lateral appears to plateau or drop.In Marcellus play,however,the best productivity per foot demonstrated wells with 12000-14000 ft laterals.
(3)Stage spacing:The stage spacing from 2014 to 2020 decreased 30%-50%in gas and oil plays alike,reaching around+/-200 ft between stages on average.In 2020 the shortest average stage spacing of+/-120 ft was found in Eagle Ford play and the longest in Barnett—+/-270 ft.Overall,the shorter stage spacing of less than 200 ft results in best well productivity equally in gas and oil plays,except for Barnett gas play where 300-500 ft stage spacing appears to provide the best normalized productivity return.
(4)Proppant intensity:The proppant intensity is one of the most critical completion and stimulation parameter with the highest impact on well productivity which experienced the large increase in volumes from 2014 to 2020.The proppant identity per foot of lateral increased up to 120%in oil plays(Bakken)and 100%(Haynesville)gas plays.The highest proppant intensity among reviewed gas plays was in Haynesville(+/-3500 lbs/ft)and among oil plays in Eagle Ford(+/-2400 lbs/ft).Absolutely all reviewed oil and gas plays demonstrated improved well productivity at higher proppant concentrations per foot of lateral from 2500 to 4000 lbs/ft.In general,the liner dependency of well productivity vs.proppant pumped was observed.
The learnings and findings of this research can help identify the optimal reservoir specific range for varies completion and stimulation parameters and provide technical guidance for other domestic and international unconventional oil and gas developments towards further completion optimization, cost reduction and increase of efficiency.
Acknowledgment:
This study was performed under a contract by CNPC USA.Authors would like to express their gratitude to CNPC USA management for its support and permission to publish the data as well as to IHS Markit for providing data for the research.
