Preparation and Performance of Fluorescein Isothiocyanate-Labeled Fluorescent Starch and Polyvinyl Alcohol for Warp Sizing
2021-11-02LIManli李曼丽JIZhihao季志浩ZOUZhuanyong邹专勇HUQiaoling胡巧玲JINEnqi金恩琪
LI Manli(李曼丽), JI Zhihao(季志浩), ZOU Zhuanyong(邹专勇), HU Qiaoling(胡巧玲), JIN Enqi(金恩琪), *
1 Key Laboratory of Clean Dyeing and Finishing Technology of Zhejiang Province, Shaoxing University, Shaoxing 312000, China
2 Department of Polymer Science and Engineering, Zhejiang University, Hangzhou 310027, China
Abstract: In order to solve the problems of low accuracy and poor variety adaptability of the current measurement method of the permeability and coating property of sizing paste in textile industry, taking starch and polyvinyl alcohol(PVA) as the representatives of the most commonly used textile sizes, various concentrations of fluorescent molecules fluorescein isothiocyanate(FITC) were used to label starch and PVA to prepare fluorescein(F)-starch and F-PVA fluorescent sizes with different degrees of labeling(DLs) for the first time, respectively. Then the starch and PVA derivatives were employed to size pure cotton warp yarns. After preparing the sections of the sized yarns, the permeability and coating percentage of starch and PVA paste to the yarns were calculated by using a fluorescence microscope and the Photoshop software, respectively. The results demonstrate that F-starch and F-PVA with appropriate DL of 0.791% and 0.161%, respectively, exhibit good fluorescence property and similar sizing performance to the sizing performance of unlabeled starch and PVA. It is considered that fluorescence labeling of sizing agents with fluorescein units can provide an innovative way for the accurate determination of the permeability and coating property of sizing paste to warp yarns.
Key words: fluorescence labeling; fluorescein isothiocyanate(FITC); permeability; coating property; textile size
Introduction
Sizing has always been regarded as the most important weaving preparation process by textile professionals. The quality of sized yarns is directly related to the smooth progress of weaving production[1-3]. After warp sizing, the paste adsorbed on the yarn is generally divided into two parts. One part is coated on the surface of the yarn body and dried to form sizing film. The hairiness is made to adhere to the yarn body and the smoothness and wear-resistance of the yarn are both improved. The other part is soaked into the yarn to make the fibers adhere to each other. The increase in their cohesion solidifies the existence foundation of the sizing film. The sizing paste is required by weaving production to have the functions of both permeation and coating to maintain high sizing quality and weaving efficiency. Therefore, the permeation and coating of the sizing paste to the yarn are the focuses of sizing engineers’ attention.
The permeability and coating property of sizing paste are currently determined according to an industry standard(FZ/T 94041—2007). The sized yarns are initially cut into cross sections and then dyed by corresponding color-developer. The surface morphology of the dyed yarn section is observed and photos are taken by an ordinary optical microscope. Based on the photos, the permeability and coating property are estimated using three indexes,i.e., permeation percentage, coating percentage and integrity percentage of sizing film. As shown in Fig. 1(a),Arefers to the cross section boundary of raw yarn,A1refers to the cross section boundary of sized yarn, andA2refers to the cross section boundary of the yarn not permeated by sizing paste. The cross section of sized yarns consists of three parts from the outside to the inside, namely, sizing film, the parts permeated and the parts not permeated by sizing agents.
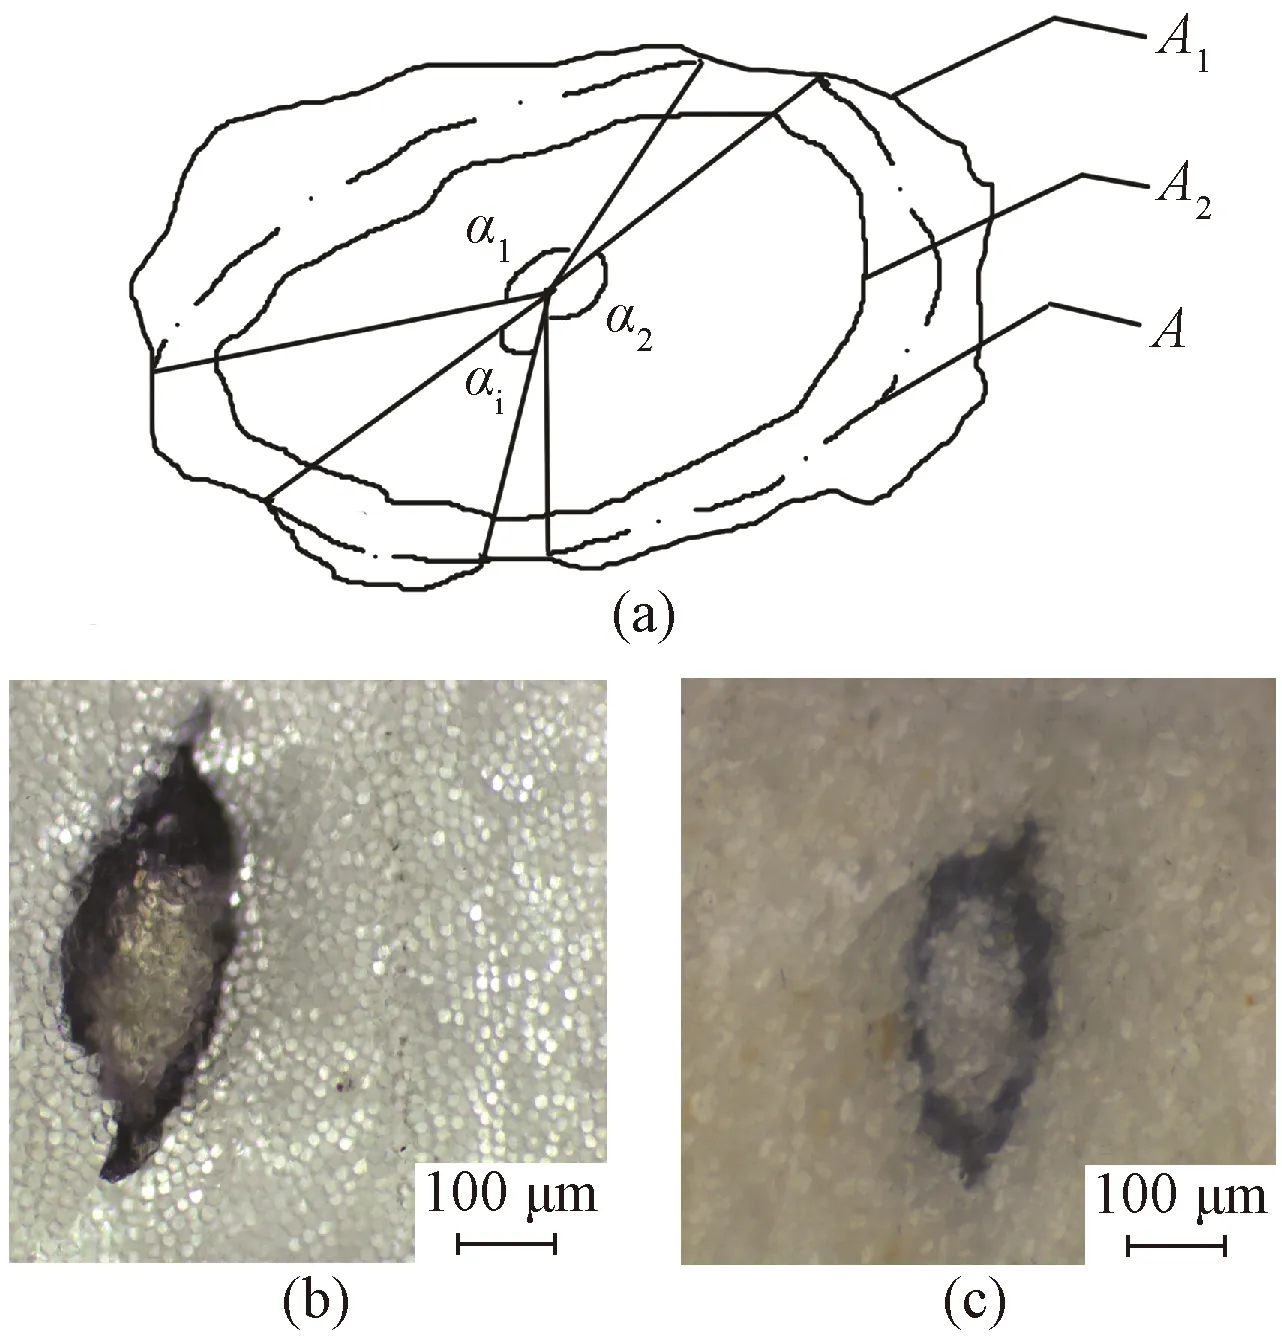
Fig. 1 Schematic diagram of dyed sized yarns:(a) cross section; (b) and (c) section photos
In textile industry, the sizing agent is the raw material whose consumption is second only to fibers. Nowadays, China annually consumes 300 000 t of textile sizes. Starch and PVA occupy the first and the second places of all the sizes, accounting for about 70% and 20%[4-6], respectively. However, in textile testing field, there is only one color-developer for both starch and PVA sizes,i.e., I2-KI for starch and I2-H3BO3for PVA. The color-developers for many other common sizes, such as carboxymethyl cellulose, sesbania gum and gelatin, have not been developed until now. In addition, the resolution of the ordinary optical microscope used in the method described in FZ/T 94041—2007 is limited. Thus, the photos of cross section of the yarns sized by starch and PVA dyed with I2-KI and I2-H3BO3color developers are very blurred as depicted in Figs. 1(b) and 1(c), respectively. In particular, sizing film and the permeated part by the sizing agent of the cross section of the sized yarns both turn blue or purple when they meet with I2-KI or I2-H3BO3. It is difficult to distinguish the junction of the two parts and leads to large errors in calculating the permeation and coating percentage. It should be noted that three parts of the cross section of sized yarns are distinguished in the color development method depending on color completely. The dependence on color forces the inspectors to use the ordinary optical microscope instead of an electronic microscope. Moreover, for the colored spun yarn(e.g., the blue, purple or black types), it is not feasible to employ the color development method due to the interference of original color of the yarn. The current method of using color-developer to evaluate the permeability and coating property of sizing paste has exposed great limitations and poor practicability.
Fluorescein isothiocyanate(FITC) can emit bright yellowish green fluorescence. The fluorescence can be recognized easily by naked eyes and possess long-term storability in dark and dry place[7-8]. At present, FITC is the most widely used fluorescent tracer in medicine[9-10]and agriculture areas[11-12]. Starch has high adhesion to natural fiber and good film-forming property, which can basically meet the sizing requirements of natural fiber yarns. Starch is rich in resources and low in price. Moreover, its application in warp sizing is the most mature. PVA has been widely used in textile industry since it was first used in warp sizing in 1940[13]. Due to its good adhesion to synthetic fibers, satisfactory film-forming property and high compatibility with other common sizes, PVA is suitable for sizing nearly all kinds of natural and synthetic fiber yarns. The comprehensive performance of PVA is considered to be the best among various textile sizes. Thus, starch and PVA are the most important sizes in textile industry. In this study, starch and PVA were used as representatives of bio-based and synthetic sizing agents, respectively. Different concentrations of fluorescent monomer FITC were grafted onto their molecular chains. The fluorescein(F)-starch and F-PVA fluorescent sizes with various degrees of labeling(DL) were prepared for the first time. The study aims to develop starch and PVA derivatives labeled by FITC with good fluorescence characteristics for textile detection. The synthesis of the fluorescent starch and PVA will solve the problem of difficult determination of the permeability and coating property of sizing paste and provide a valuable reference for preparing other common fluorescent sizes.
1 Experiments
1.1 Materials
Commercial corn starch was provided by Yixing Starch Factory(Yixing, China). PVA1799 was purchased from Shanghai Petrochemical Industry Co., Ltd., Shanghai, China. FITC, dibutyltin dilaurate(DBTDL), dimethyl sulfoxide(DMSO), ethanol, and collodion were purchased from Sigma-Aldrich and Alfa Aesar(USA). FITC, DBTDL, DMSO, ethanol, and collodion were of analytical grade and used as received without further purification. Cotton warp yarns(19.1 tex) were kindly supplied by Qingfeng Textile Co., Ltd.(Wuxi, China).
1.2 Preparation of F-starch and F-PVA
Native starch was dissolved in DMSO to form starch solution(100 mg/mL). DBTDL(1.5 mL), DMSO(2.0 mL) and FITC with different weight feed ratios(WFITC/Wstarch) in the range from 0.625% to 2.500% were added into the starch solution(10 mL). The resultant mixture was stirred vigorously in dark at 95 ℃ for 5 h. The F-starch product was precipitated with ethanol, centrifuged, filtered, and washed with ethanol thoroughly. Then, the product was dissolved in distilled water and dialysed in distilled water in dark for 24 h. Finally, the F-starch product was dried in a vacuum freeze drier, pulverized, and sieved for passing through a 100-mesh sieve.
PVA was dissolved in DMSO to form 100 mg/mL of PVA solution. One point five mL of DBTDL, 2.0 mL of DMSO and FITC with different weight feed ratios(WFITC/WPVA) in the range from 0.625% to 3.750% were added into 10 mL PVA solution. The following steps for preparing F-PVA were the same as those for preparing F-starch. The synthetic routes of F-starch and F-PVA are shown in Fig. 2. In this study, F-starch and F-PVA derivatives with four different DLs were prepared, respectively. The FITC labeled products were referred according to the weight feed ratio of starch/PVA to FITC. For instance, F-starch and F-PVA were referred as F-starch 160# and F-PVA 160#, respectively, when the weight feed ratio of starch/PVA substrate to FITC was 160∶1. The DL in this study denoted the weight ratio of FITC to the substrate(i.e., starch/PVA) and was determined using a UV-2450 UV-Vis spectrophotometer(Shimadzu Co., Ltd., Japan). The above F-starch and F-PVA samples with different DLs were dissolved in distilled water to prepare 1 000 mg/L aqueous solution. The maximum absorption wavelength of F-starch and F-PVA solutions was 438 nm[14].
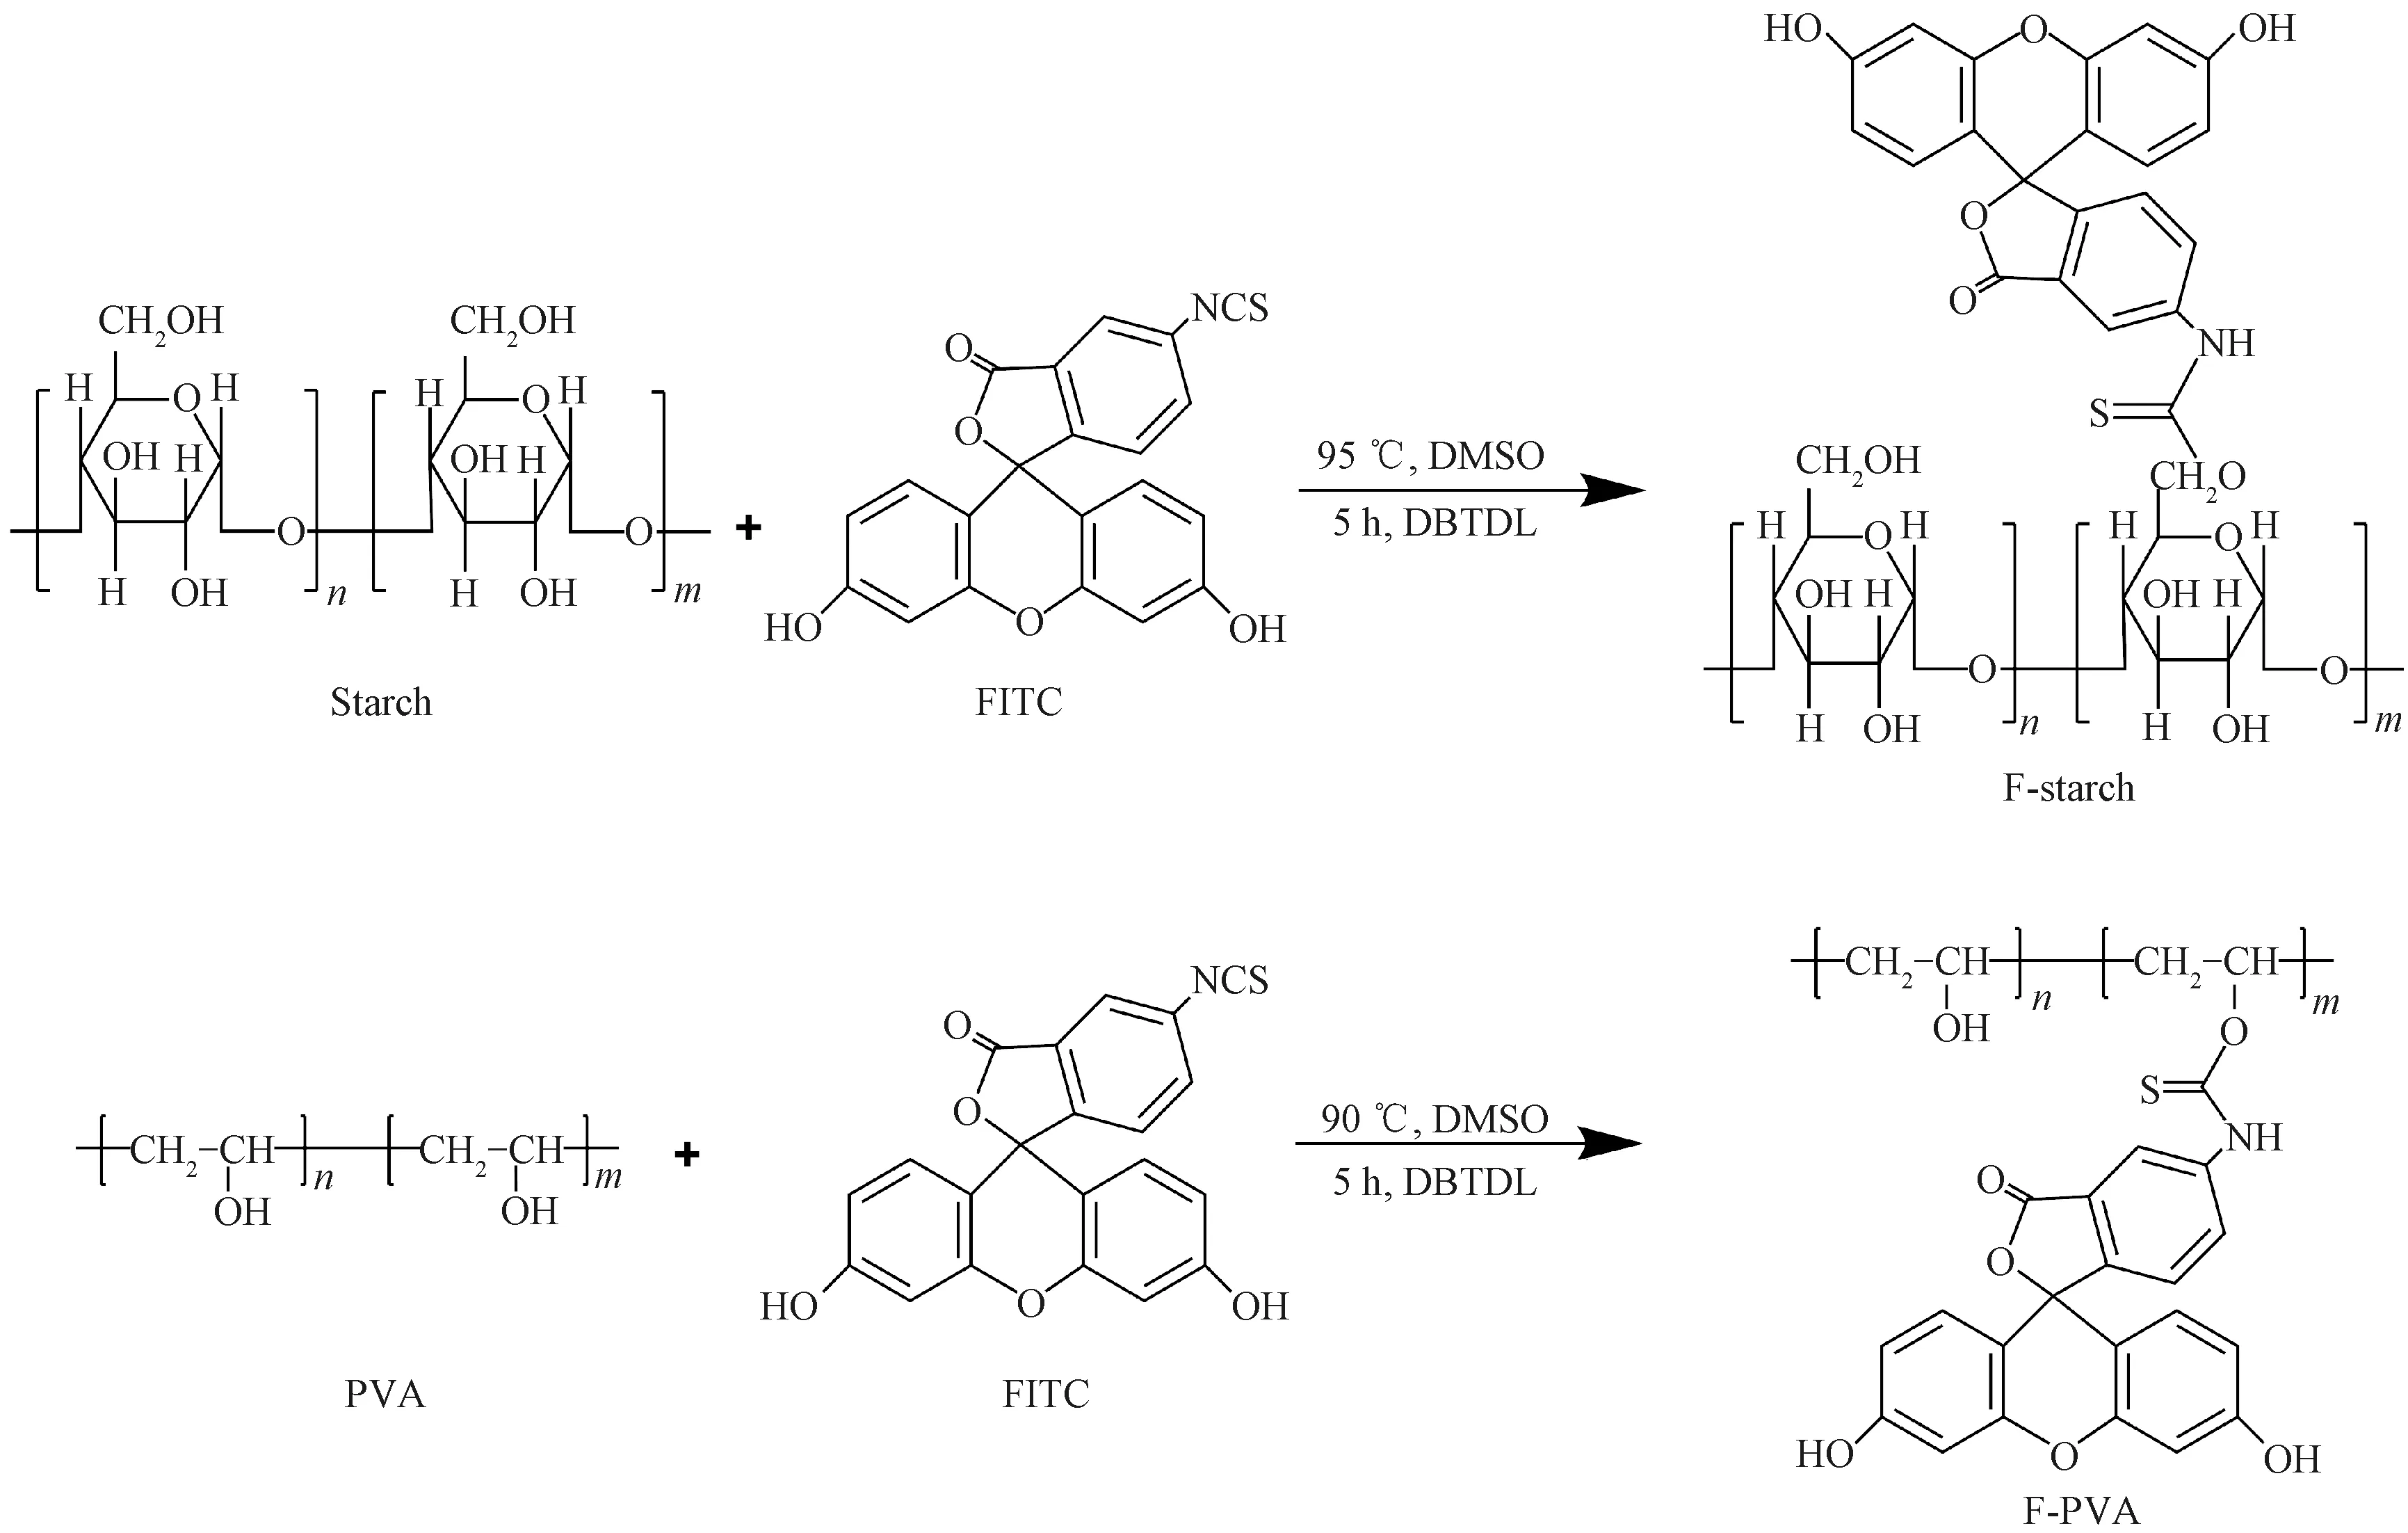
Fig. 2 Synthetic routes of F-starch and F-PVA derivatives
1.3 Fourier transform infrared(FTIR) spectrometer and fluorescence characterization
Before the instrument characterization, the F-starch and F-PVA derivatives were washed with ethanol thoroughly in order to remove all the fluorescent small molecules,i.e., the unreacted FITC adhering to the derivatives. FTIR was used to verify the labeling of fluorescein on the starch and PVA. Measurements were taken on the Thermo Nicolet(Avatar 380) FTIR spectrophotometer(Thermo Fisher Scientific Co., Ltd., USA) through the diffuse reflectance technique with a spectral resolution of 2 cm-1for 64 scans[15]. Fluorescence intensity of F-starch and F-PVA solutions was measured with the Hitachi F-7000 fluorescence spectrophotometer(Hitachi High-Tech Global Co., Ltd., Japan). F-starch and F-PVA derivatives were dissolved in distilled water to form solutions(1 000 mg/L). A fixed excitation wavelength(λex= 438 nm) was set to measure the fluorescence emission spectrum of F-starch and F-PVA solutions.
1.4 Sizing experiment
The unlabeled and FITC-labeled starch and PVA were dissolved into distilled water to form a 12% paste, respectively. The sizing paste was heated and maintained at 95 ℃ under vigorous stirring for 1 h. The sizing experiment for pure cotton warp yarns was carried out using a GA392 laboratory single-yarn sizing machine purchased from Tongyuan Textile Machinery Co., Ltd.(Jiangyin, China). Sizing style of the machine was single-dip-single-nip. The warp yarns were wound in the machine and the cooked sizing paste was poured into size box to be maintained at 95 ℃. Sizing tension was 1.0 N and the running speed of sizing machine was 30 m/min. Hot air and cylinder allied drying style was employed in the drying chamber. The sized yarns were dried at 110 ℃ in the chamber for 3 min and conditioned at 65% relative humidity(RH) and 20 ℃ for at least 48 h before sizing performance tests[16].
1.5 Evaluation of permeability and coating property of fluorescent sizing paste
The sized yarns were sliced into thin cross sections(thickness ≤ 20 μm) by a Hardy fiber microtome. At first, the sized cotton yarns were wrapped one by one by wool rovings and then tightly clamped into the clamping gap of the Hardy fiber microtome. The yarns exposed outside the clamping gap were cut with a sharp blade. Then, the microtome screw was rotated 1-2 grids so that the sized yarns were pushed out of the gap by 15-20 μm. A drop of collodion solution was dropped onto the sized yarns. After the collodion solution was dried, the sized yarns were cut neatly to sections with the blade, placed onto a glass slide, and covered with a coverslip.
Photos of the yarn sections prepared above were taken under bright field and blue light by a positive fluorescent microscope(Leica DM3000) respectively and magnified 200 times. Then, the areas ofS,S1andS2were delimited under bright field and blue light respectively and were measured through histogram function of the Photoshop software. The permeability and coating property are evaluated using three basic indexes,i.e., permeation percentage, coating percentage and integrity percentage of sizing film. The indexes are calculated in accordance with Fig. 1(a) and Eqs.(1)-(3). For every sample, twenty replications were taken and their mean values were obtained.
P=Sp/S=(S-S2)/S×100%,
(1)
whereP,S,SpandS2denote permeation percentage, and cross sectional areas of raw yarn, permeated part and non-permeated part of sized yarns, respectively.
C=Sf/S=(S1-S)/S×100%,
(2)
whereC,SfandS1denote coating percentage, and cross sectional areas of sizing film on the surface of the yarns and the whole sized yarns, respectively.
I= Σαi/360×100%,
(3)
whereIandαidenote integrity percentage of sizing film and the angle formed by each part of sizing film surrounding the yarn, respectively.
1.6 Evaluation of permeability and coating proper-ties through the method of current industry standard
The sized yarns were cut into thin cross sections(thickness ≤ 20 μm) by the Hardy fiber microtome at first. The yarn section was saturated into color-developer to get color. The color-developers for the yarns sized by starch and PVA were I2-KI and I2-H3BO3, respectively. Then, the surface morphology of the color-developed yarn section was observed and photos were taken by an ordinary optical microscope.
1.7 Measurement of size add-on and application performance of sized yarns
Dilute acid and distilled water desizing methods were employed to estimate size add-on of the yarns sized by starch and PVA, respectively. Ten grams of the sized yarns were taken and dried at 105 ℃ for 4 h. The exact weight was recorded. The yarns sized by starch and PVA were boiled in 714 mL of 5 g/L H2SO4and 700 mL of distilled water, respectively, for 1 h and then taken out to be washed by fresh distilled water thoroughly. The color-developing methods of I2-KI and I2-H3BO3reagents were used to ensure that the starch and PVA were completely desized from the yarns, respectively[17]. Finally, the yarns were dried again at 105 ℃ for 4 h and exactly weighed. The size add-on was calculated according to Eq.(4). For every sample, three replications were taken and their mean values were obtained.
(4)
whereSais size add-on;sis the damage ratio of fibers of raw yarns and is measured through blank test;x1andx2are dry weight of sized and desized yarns, respectively.
1.8 Measurement of mechanical properties and hairiness amount of sized yarns
Tensile strength and elongation of the yarns were determined on a model YG023A electric strength tester purchased from Laizhou Electronic Instrument Factory(Laizhou, China). The initial chuck-distance and drawing speed were 500 mm and 500 mm/min respectively. For every sample, 20 replications were taken and their mean values were obtained.
The yarns were abrased reciprocatively on an LFY109B electric yarn abrader purchased from Textile Science Research Institute of Shandong(Qingdao, China). The resistance to reciprocating friction of the sized yarns was evaluated in the reciprocal motion times of the yarns until breaking. The tension exerted on the yarns was 9.8 cN. The values reported were mean value of 20 tests for each case. The abrasive material used was W5(06) abrasive paper manufactured by Shanghai Emery Wheel Company(Shanghai, China).
Warp hairiness(≥ 3 mm) has adverse impact on weaving and is regarded generally as harmful hairiness. The amount of yarn hairiness, of which length was in range of 3-9 mm, was evaluated by YG171B-2 hairiness tester purchased from Nantong Sansi Electronic Instrument Factory(Nantong, China). The values reported were mean value of 10 tests for each case. Each test requires a 10-meter-long yarn with a drawing speed of 30 m/min.
2 Results and Discussion
2.1 FTIR analysis

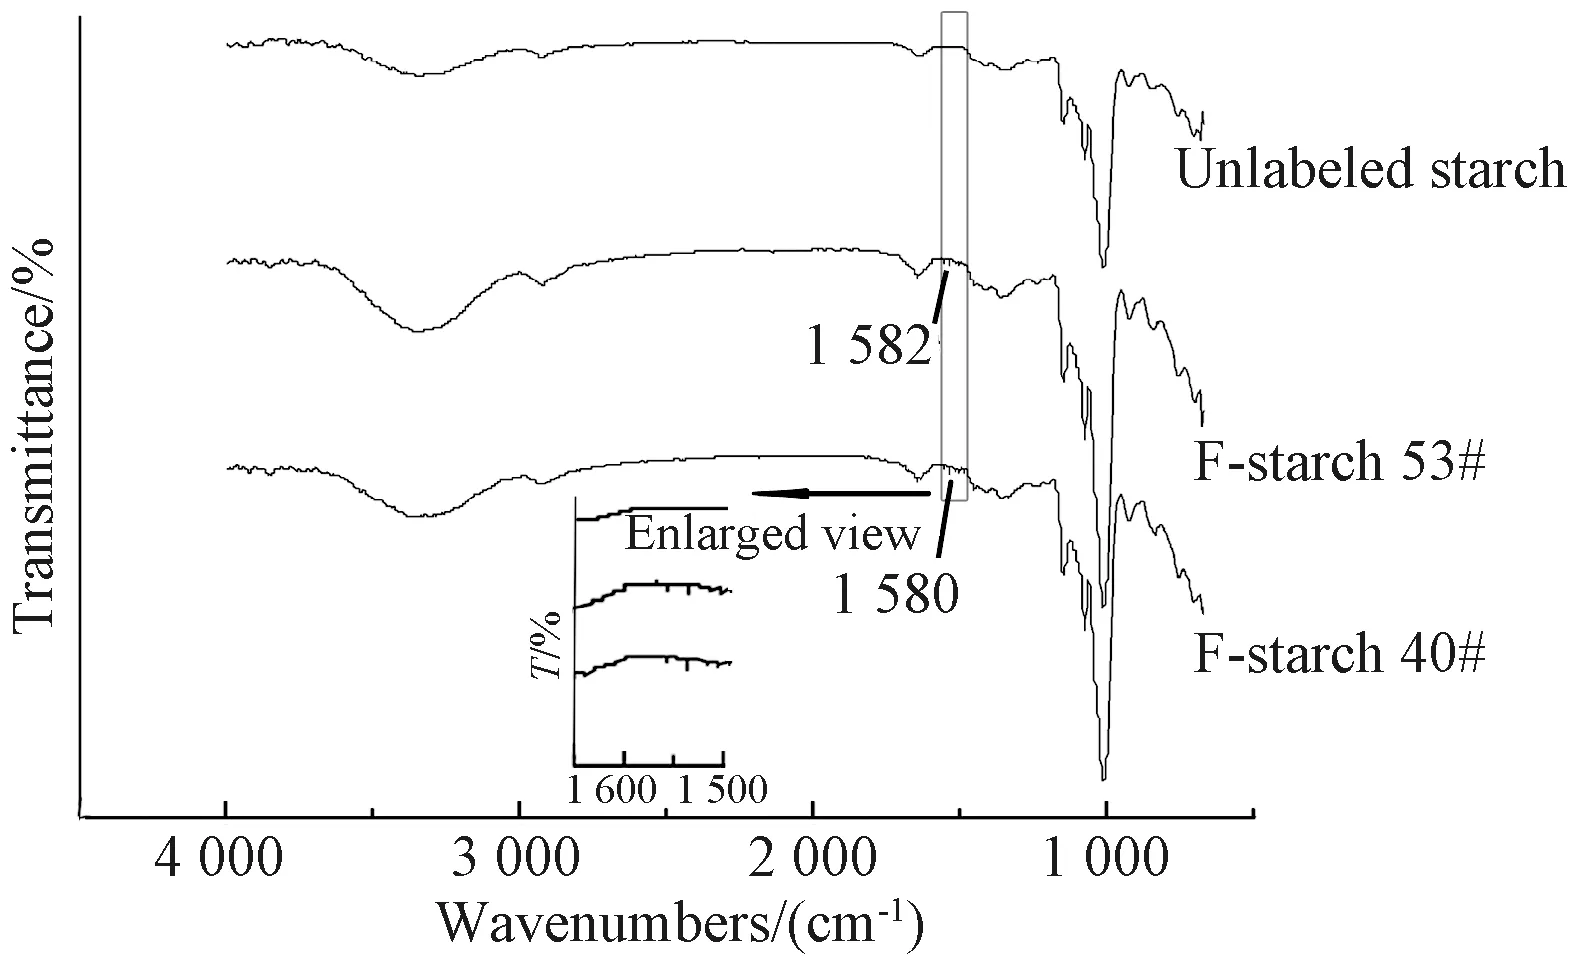
Fig. 3 FTIR spectra of unlabeled and FITC-labeled starch
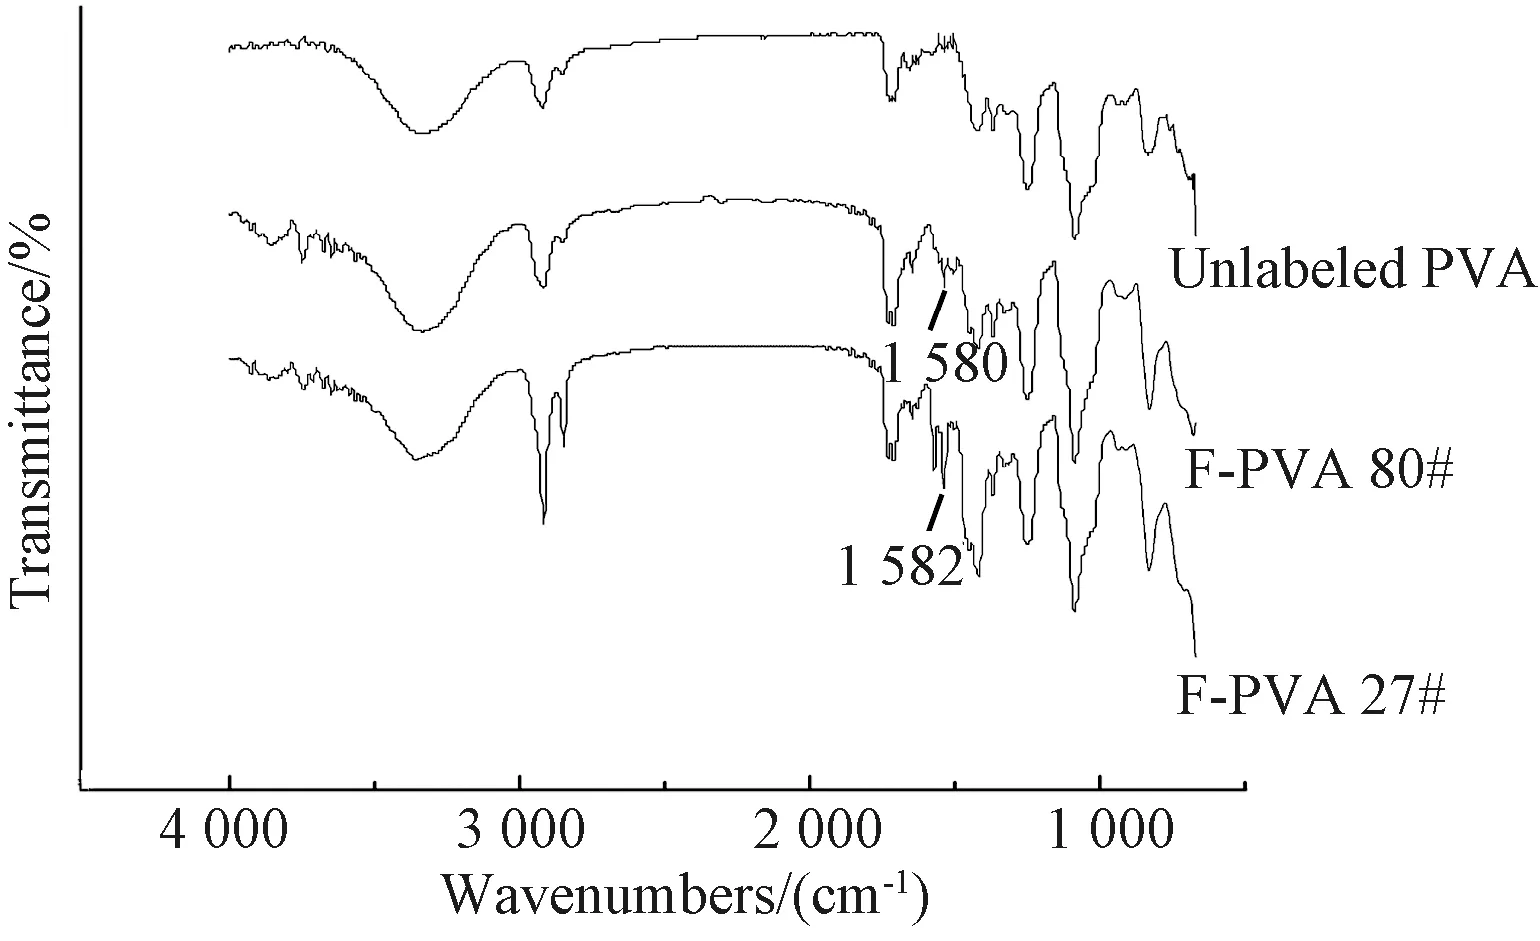
Fig. 4 FTIR spectra of unlabeled and FITC-labeled PVA
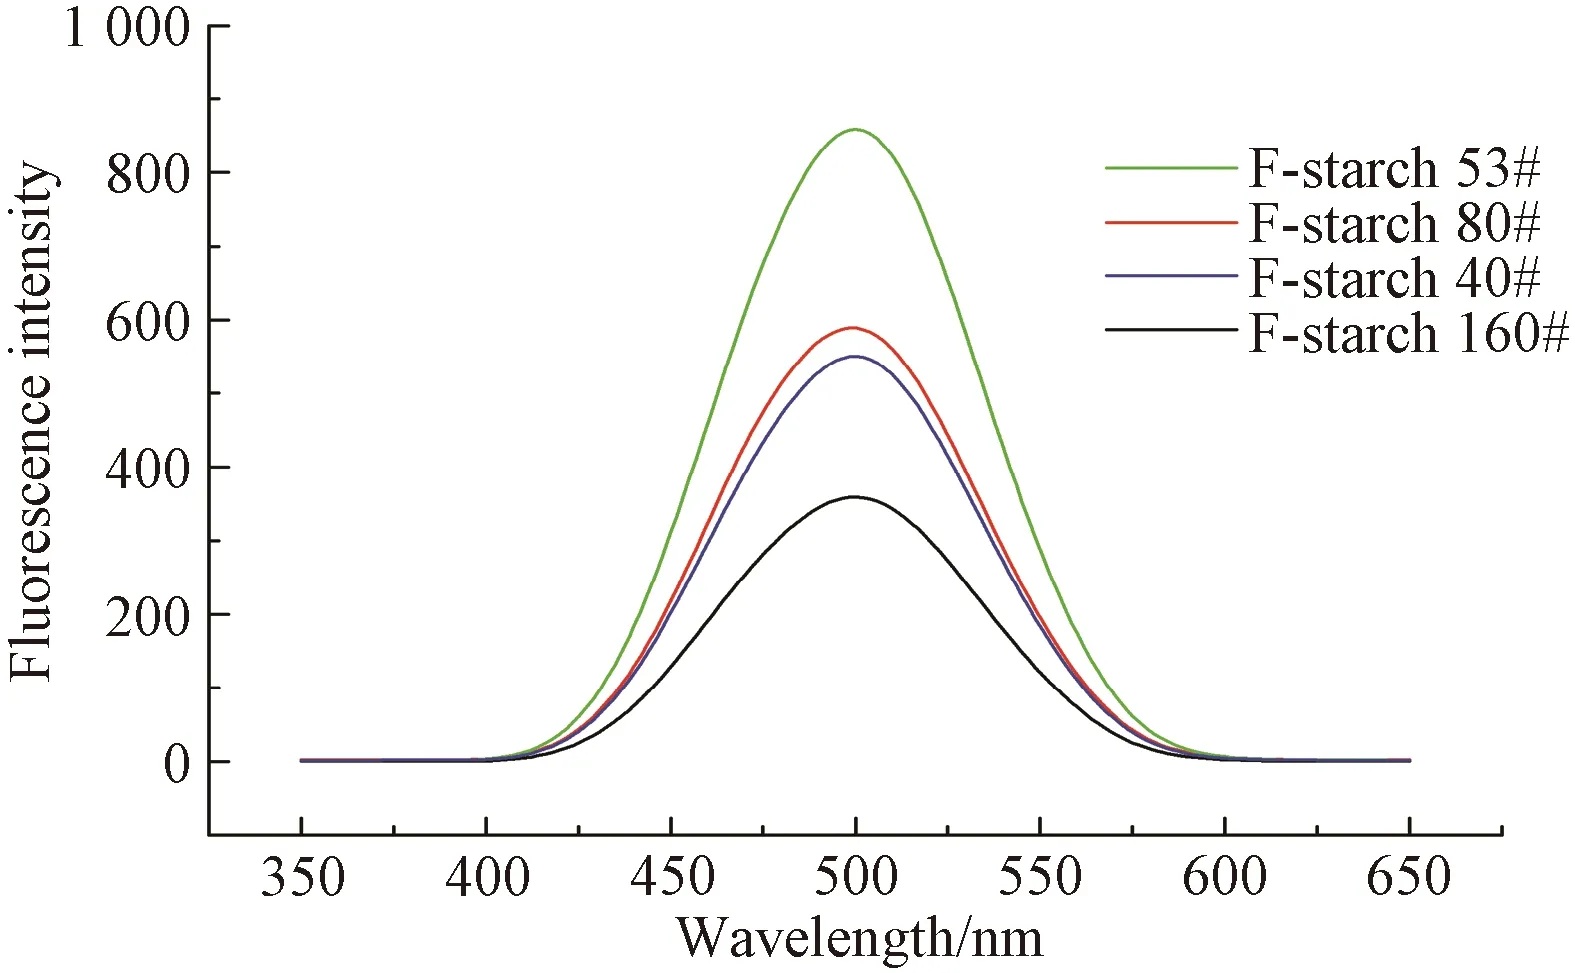
Fig. 5 Fluorescence spectrum of F-starch solution
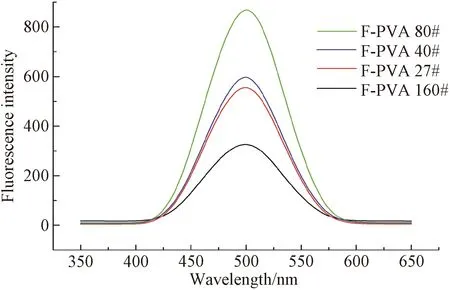
Fig. 6 Fluorescence spectrum of F-PVA solution
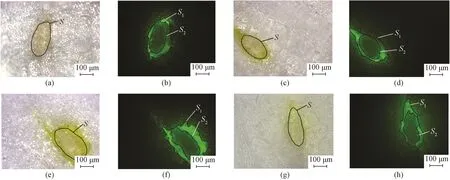
Fig. 7 Photos of cross sections of sized yarns under bright and blue excitation light field by the fluorescent microscope: (a) and (b) F-starch 160#; (c) and (d) F-starch 80#; (e) and (f) F-starch 53#; (g) and (h) F-starch 40#
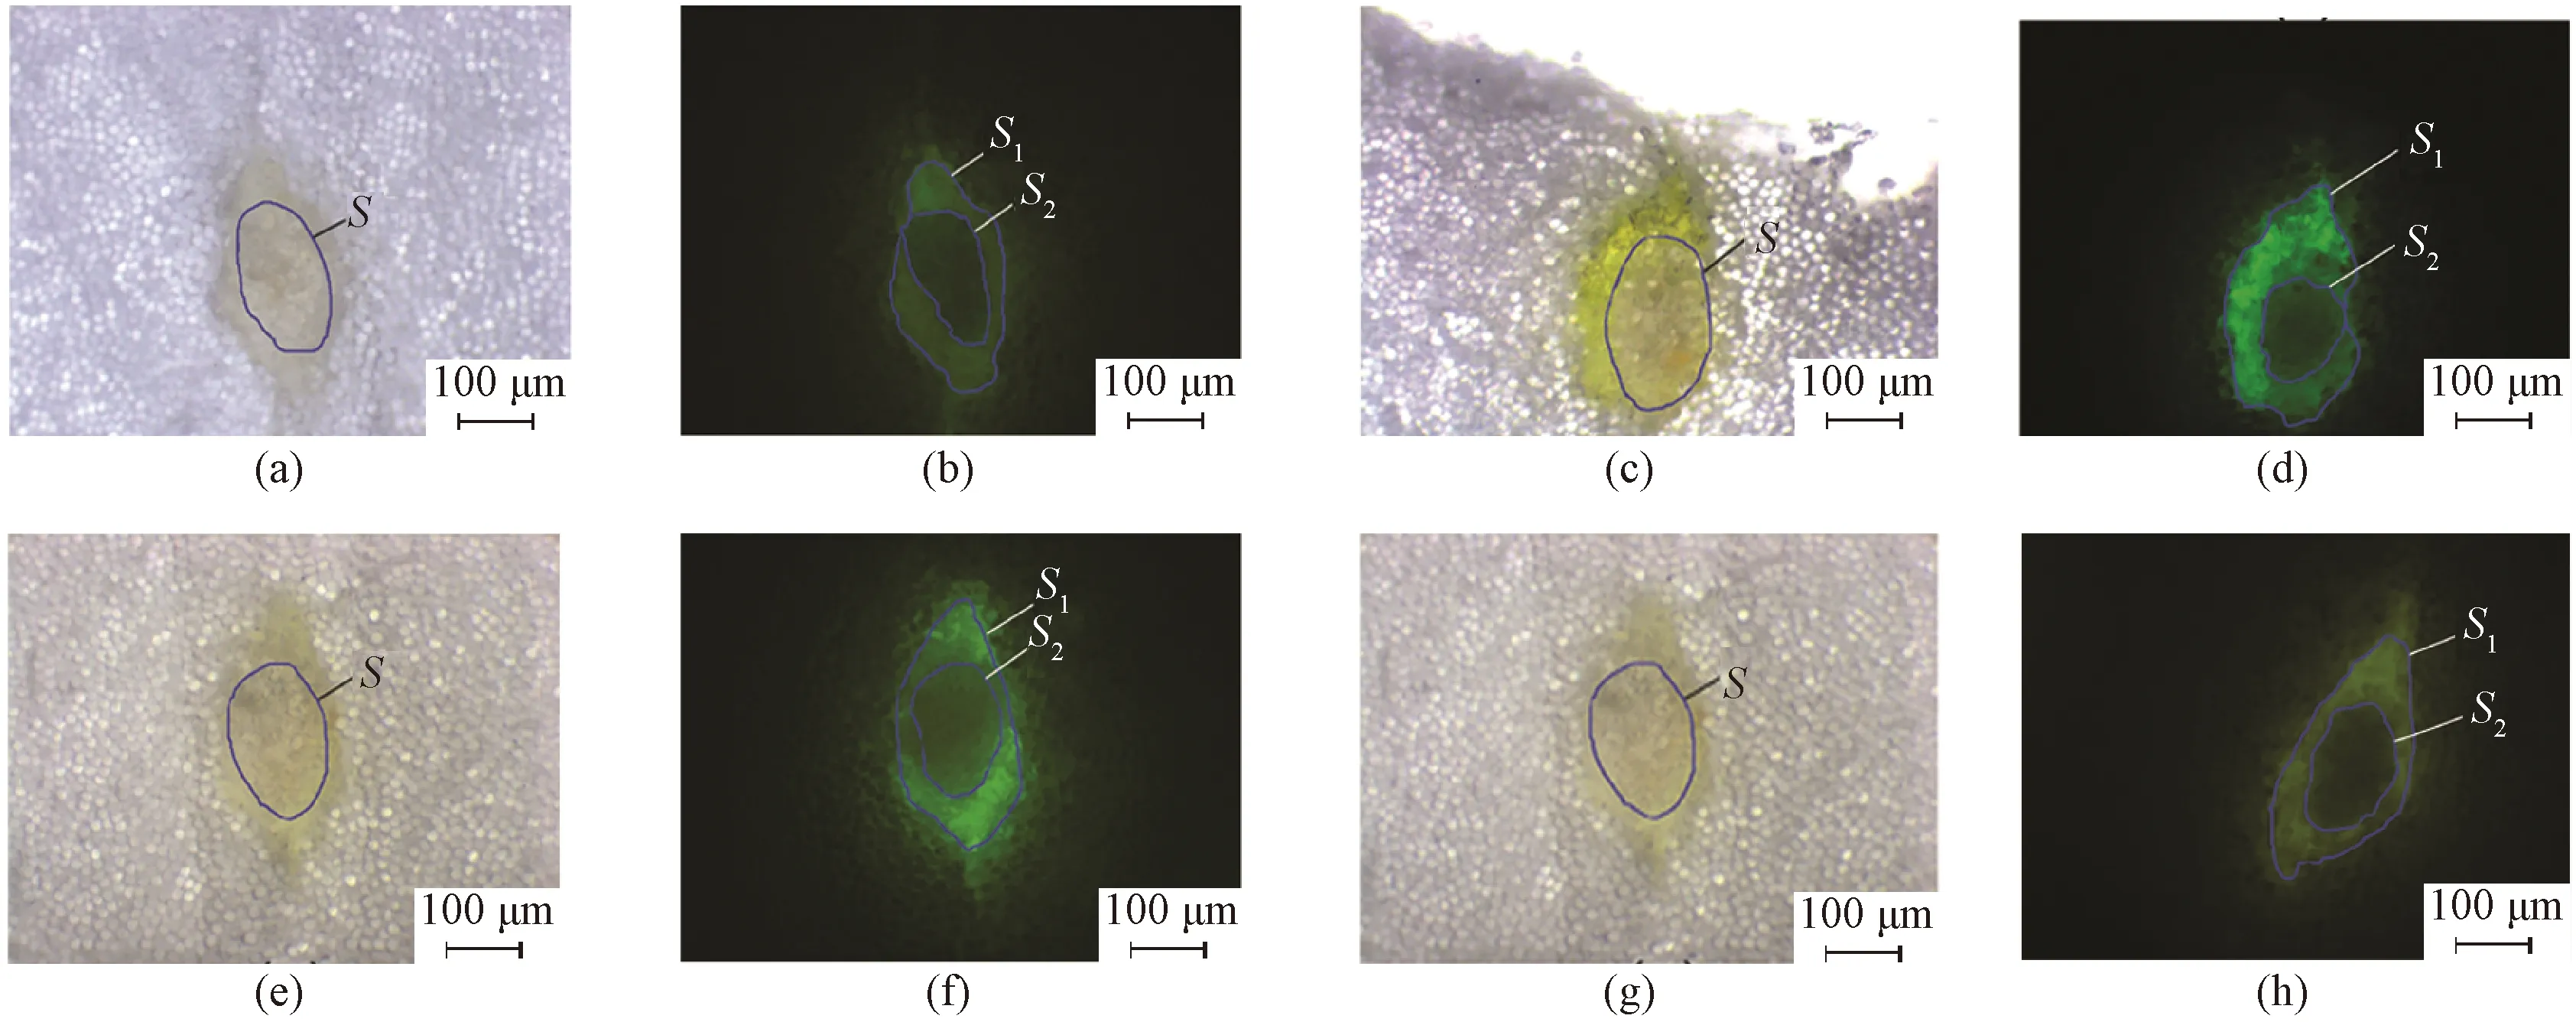
Fig. 8 Photos of cross sections of sized yarns under bright and blue excitation light field by the fluorescent microscope: (a) and (b) F-PVA 160#; (c) and (d) F-PVA 80#; (e) and (f) F-PVA 40#; (g) and (h) F-PVA 27#
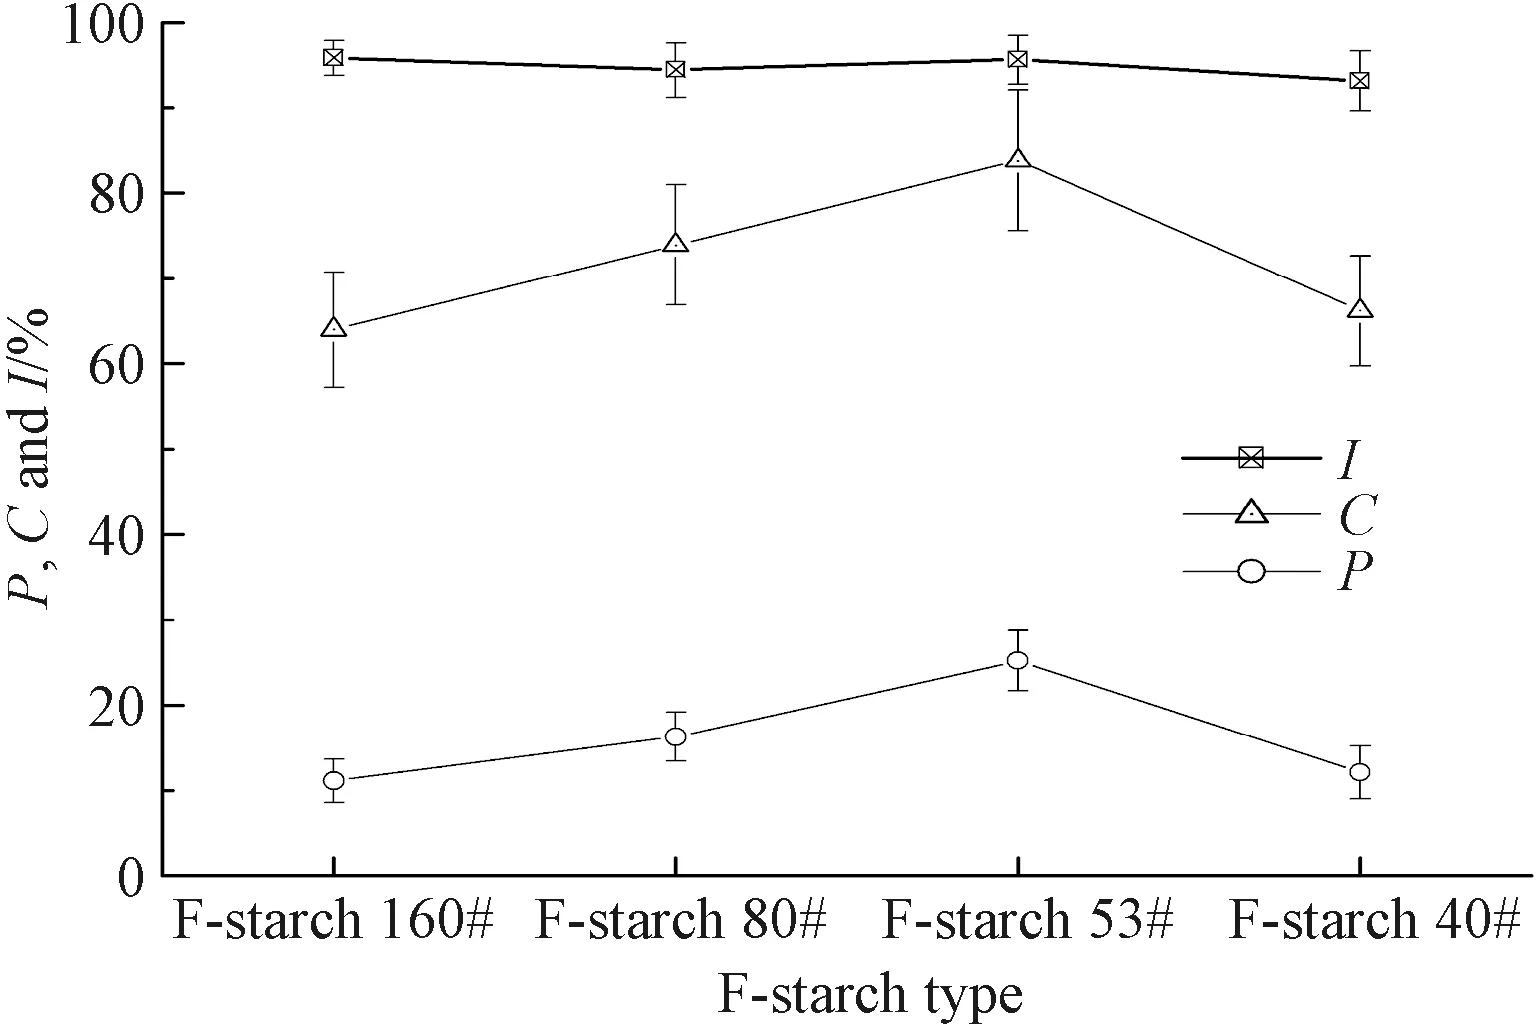
Fig. 9 P, C and I of F-starch sizing paste(the number of repeat experiments is 20)

Fig. 10 P, C and I of F-PVA sizing paste(the number of repeat experiments is 20)
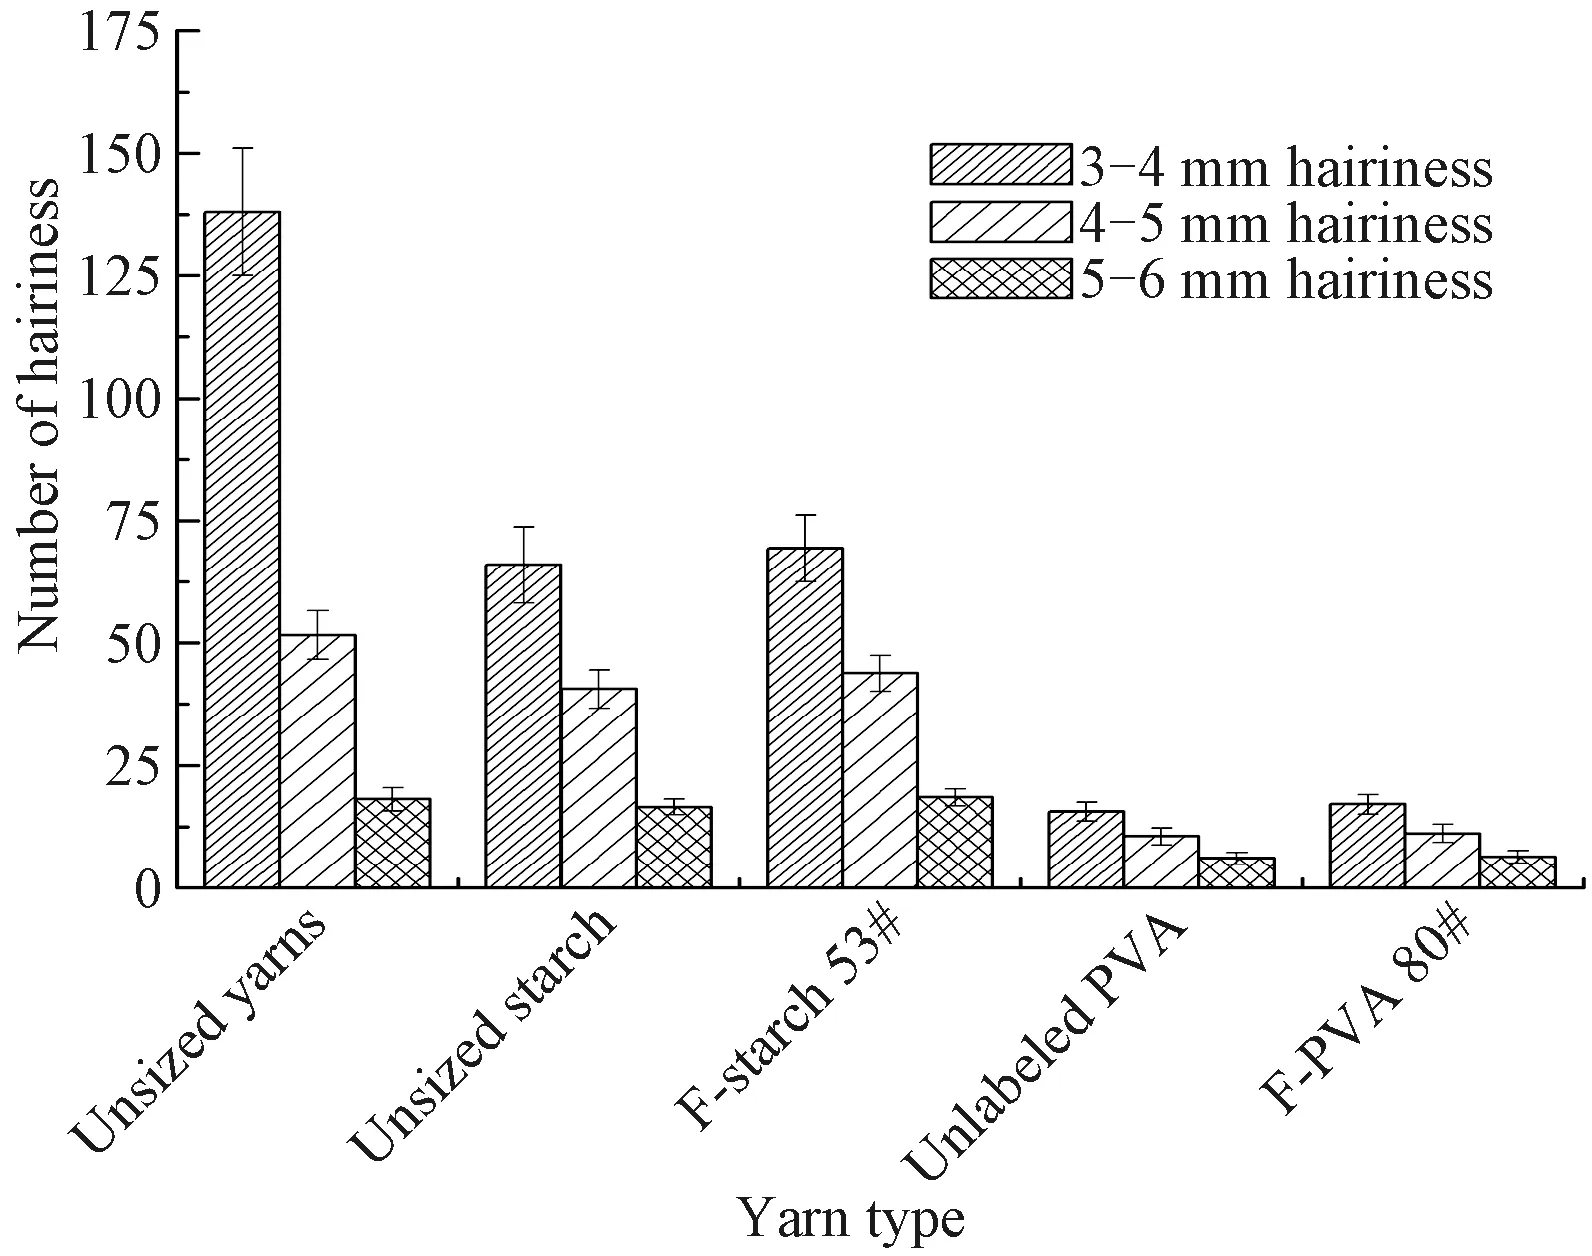
Fig. 11 Number of the short hairiness(3 - 6 mm) of unsized yarns and the yarns sized by unlabeled starch, unlabeled PVA, F-starch and F-PVA with suitable DL(the number of repeat experiments is 10)

Fig. 12 Number of the long hairiness(6 - 9 mm) of unsized yarns and the yarns sized by unlabeled starch, unlabeled PVA, F-starch and F-PVA with suitable DL(the number of repeat experiments is 10)
2.2 Effect of fluorescent monomer concentration on DL
The DLs of F-starch and F-PVA derivatives prepared under different concentrations of FITC monomer during the synthesis are shown in Table 1. The higher the monomer concentration, the larger was the amount of the monomers able to react with starch/PVA. In other words, the more the fluorescein groups labeled onto the molecular chains of starch/PVA, the higher was the DL. Therefore, the absorbance of the FITC-labeled starch/PVA solution kept to increase with the increase of the DL.

Table 1 Effects of fluorescent monomer concentration on DL of F-starch and F-PVA
2.3 Effect of DL on fluorescence intensity
Fluorescence intensities of the solutions of F-starch and F-PVA with various DL are depicted in Figs. 5 and 6, respectively. The fluorescence intensity of the F-starch initially increased with the increase of the DL, reached the maximum when the DL was 0.791%, and then started to decline. As for the F-PVA, its fluorescence intensity exhibited similar variation tendency to that of the F-starch but reached the maximum when the DL was 0.161%.
FITC is a kind of aggregation caused quenching(ACQ) luminogen and usually possesses strong luminous efficiency in solution state. However, its fluorescence will weaken or even disappear in aggregation or solid state[22]. Therefore, only when appropriate amount of fluorescein is labeled onto the molecular chain of a macromolecule, can the macromolecule be endowed with good fluorescence property. In this case, the fluorescence intensity of the FITC-labeled macromolecule(e.g., starch and PVA) directly relates to its DL. Consequently, the initial increase in the amount of the FITC labeled onto starch/PVA contributed to the enhancement in the fluorescence intensity. However, the fluorescence quantum yield decreased instead when the DL of F-starch and F-PVA exceeded 0.791% and 0.161%, respectively, due to the occurrence of the ACQ phenomenon.
Taking F-starch as an example, 0.791% could be considered as a critical DL from which the fluorescein began to aggregate. The concentration of the F-starch solution for the fluorescence intensity test was 1 000 mg/L. In the case of uniform dispersion of F-starch macromolecules in water and the arrival of the F-starch in critical DL(0.791%), a fluorescein unit took up about a cubic space 8.23×10⁴nm3(edge length: 43.50 nm). The major reason for the aggregation of the conjugated ACQ luminogens is the π-π stacking interaction between fluorescein. In general, the distance of π-π stacking interaction is in the range of 0.34-0.40 nm[23-24]. Obviously, the average distance between the fluorescein units at the critical DL of F-starch is far longer than 0.40 nm. As a result, it could be speculated that ACQ had occurred in the F-starch solution before the fluorescein units fell in the range of π-π stacking interaction. The cause for the occurrence of the ACQ phenomenon was the intense thermal motion the fluorescein experienced owing to the lack of spatial constraint.
As to F-PVA, the glass transition temperature(about 67 ℃) of PVA1799[25-26]is lower than that(about 96 ℃) of corn starch[27-28]. Consequently, the thermal mobility of F-PVA molecular chain is higher than that of F-starch molecular chain at high temperature. The dissolving temperature of the starch sizes in water is 95 ℃. In other words, the fluorescein groups of the former have higher probability to aggregate than those of the latter. Therefore, F-PVA has a lower critical DL(0.161%) than F-starch. A fluorescein unit on the molecular chain of F-PVA takes up 2.179×10⁵nm3of cubic space, of which edge length is 60.18 nm. Consequently, the cubic space of a fluorescein unit of F-PVA is larger than that (8.23×10⁴nm3) of F-starch in theory when the ACQ phenomenon occurs.
2.4 Effects of DL on permeability and coating property of the sizing paste
The photos of the cross sections of the cotton warp yarns sized by F-starch and F-PVA under fluorescent microscope are shown in Figs. 7 and 8, respectively. The three major indexes(i.e.,P,CandI) used to indicate permeability and coating property of the sizing paste were calculated in accordance with Figs. 7 and 8 and Eqs.(1) -(3). The three indexes of F-starch and F-PVA with various DLs are displayed in Figs. 9 and 10, respectively.PandCboth initially increased with the increase in the DL, reached the maximum when the DL was 0.791%(F-starch 53#) and 0.161%(F-PVA 80#), and then started to decrease. As forI, the DL exhibited no significant influences and all the values of F-starch and F-PVA were around 94%. Compared with Figs. 1(b) and 1(c), the photos of cross section of the yarns sized by F-starch and F-PVA with appropriate DL are quite clear due to the adequate fluorescence emitted by the fluorescein units. It is more accurate for the researchers to make use of the fluorescence emitted by the FITC-labeled sizes to calculate the three indexes than using I2-KI or I2-H3BO3color-developer to dye the sized yarns.
In this study, the same cotton warp yarns were sized by the FITC-labeled starch/PVA with the same sizing machine and processing parameters. Therefore, as for the same size variety, the three indexes of the sizing paste to warp yarns should be similar in theory. However,PandCof both F-starch and F-PVA sizing paste changed in a parabolic shape. On one hand, when the DL was lower than the critical value(0.791% for F-starch and 0.161% for F-PVA), there were not enough fluorescein units in the molecular chains of the fluorescent sizes and the fluorescence was not intensive adequately. Consequently, the areas of the sizing film and the permeated part observed under excitation light by the fluorescent microscope were both smaller than their actual areas.PandCare calculated according to Eqs.(1) and (2). It can be deduced from the two equations that, the smaller the areas of the permeated part and the sizing film, the lower the two indexes are. On the other hand, when the DL was higher than the critical value, the two indexes decreased instead due to the occurrence of the ACQ phenomenon of fluorescein groups. As a result, the calculatedPandCwere also lower than their actual values. Obviously, only the FITC-labeled sizes with appropriate DL(0.791% for F-starch and 0.161% for F-PVA) are suitable to serve as a functional sizing agent to evaluate the permeability and coating property. As toI, it did not have a close relationship to the area of the sizing film or the permeated part observed under excitation light. Thus, the calculated values of the FITC-labeled sizes with various DLs were nearly the same for the same size variety.
2.5 Comparison of application properties of warp yarns sized by unlabeled and FITC-labeled starch/PVA
Comparison tests on major application properties of the yarns sized by unlabeled starch/PVA and their corresponding FITC-labeled derivatives with appropriate DL were carried out to verify whether the labeling of fluorescein had marked effects on the properties. If the labeling changes the application properties markedly, it will be meaningless to evaluate the permeability and coating property of a sizing agent using its fluorescence-modified product.
The mechanical properties of unsized yarns and the yarns sized by the unlabeled and FITC-labeled starch and PVA are shown in Table 2. Number of the hairiness with different lengths of unsized yarns and the yarns sized by the unlabeled and FITC-labeled starch and PVA is shown in Figs. 11 and 12. The yarns sized by the F-starch and F-PVA had similar application properties to those sized by unlabeled starch and unlabeled PVA respectively due to the low DL(only 0.791% for F-starch and 0.161% for F-PVA). Nearly all the major application properties of sized yarns greatly depend on permeability and coating property of the sizing paste. Thus, similar application properties indicated that the unlabeled and labeled sizing paste possessed similar permeability and coating property to the cotton yarns. In this case, the permeability and coating property of F-starch or F-PVA size with a suitable DL can be regarded as true reflections of the properties of the corresponding unlabeled size.

Table 2 Mechanical properties of unsized yarns and the yarns sized by unlabeled starch, unlabeled PVA, F-starch and F-PVA with suitable DL
3 Conclusions
Starch and PVA were taken as examples of the most commonly used sizing agents in this study. Their FITC-labeled fluorescent products were utilized to evaluate the permeability and coating property successfully. After the evaluation of fluorescence and sizing application properties of the FITC-labeled starch and PVA with various DLs, the F-starch and F-PVA with DL of 0.791% and 0.161% exhibited adequately intensive fluorescence, which could be observed easily. They both possessed similar application properties to unlabeled starch and PVA. Three important evaluation indexes(i.e.,P,CandI) of F-starch and F-PVA paste can be regarded as the true reflections of the unlabeled ones. Therefore, the permeability and coating property of the FITC-labeled fluorescent starch and PVA sizing paste can be evaluated accurately and conveniently.
Grafting appropriate amount of fluorescent monomer FITC onto the molecular chains of starch and PVA is an innovative and efficient way to prepare functional textile sizes with intensive fluorescence. The obtained fluorescent sizes can get rid of the limitation of the color-developer(e.g., I2-KI or I2-H3BO3) used in the current method of textile industry and possess wider adaptability to yarn variety. Their good fluorescence performance makes it possible to use a fluorescent microscope with higher resolution than an ordinary optical microscope and obtain much clearer photos of the cross section of the sized yarns. Moreover, the fluorescence of the sizes will avoid the interference of the original color of raw yarns on the observation of cross section composition. Therefore, it has great potential to replace the current color-developing method to determine the permeability and coating property of sizing paste to warp yarns.
It is expected that the fluorescein can be also grafted onto other common sizing agents to prepare corresponding fluorescent derivatives with appropriate DL for evaluating the permeability and coating property of their paste. In addition, efficient and mild desizing methods will be developed in our future study to recycle fluorescent sizes for environment protection and cost reduction.
杂志排行
Journal of Donghua University(English Edition)的其它文章
- Ecological Dyeing of Polyamide 6, 6(PA66) Fabrics with Monascus Pigments in Decamethylcyclopentasiloxane(D5) Solvent
- Effects of Microstructure on Quasi-Static Transverse Loading Behavior of 3D Circular Braided Composite Tubes
- Electrical-Mechanical Coupling Behaviors and Thermal-Resistance Effects of 3D Braided Composites
- Efficient Probabilistic Load Flow Calculation Considering Vine Copula-Based Dependence Structure of Renewable Energy Generation
- Turing Instability of Diffusive Predator-Prey System with Gompertz Growth
- Blockchain-Based Log Verification System for Cloud Forensics
