Construction of multi-factor identification model for real-time monitoring and early warning of mine water inrush
2021-10-26XinWngZhiminXuYjunSunJiemingZhengChenghngZhngZhongwenDun
Xin Wng,Zhimin Xu,*,Yjun Sun,Jieming Zheng,Chenghng Zhng,Zhongwen Dun
a School of Resources and Geosciences,China University of Mining and Technology,Xuzhou 221116,China
b General Prospecting Institute China National Administration of Coal Geology,Beijing 100039,China
c Wanbei Coal Electricity Group,Suzhou 234000,China
Keywords:Mine water inrush Automatic monitoring Real-time warning Recognition model
ABSTRACT As a new technical means that can detect abnormal signs of water inrush in advance and give an early warning,the automatic monitoring and early warning of water inrush in mines has been widely valued in recent years.Due to the many factors affecting water inrush and the complicated water inrush mechanism,many factors close to water inrush may have precursory abnormal changes.At present,the existing monitoring and early warning system mainly uses a few monitoring indicators such as groundwater level,water influx,and temperature,and performs water inrush early warning through the abnormal change of a single factor.However,there are relatively few multi-factor comprehensive early warning identification models.Based on the analysis of the abnormal changes of precursor factors in multiple water inrush cases,11 measurable and effective indicators including groundwater flow field,hydrochemical field and temperature field are proposed.Finally,taking Hengyuan coal mine as an example,6 indicators with long-term monitoring data sequences were selected to establish a single-index hierarchical early-warning recognition model,a multi-factor linear recognition model,and a comprehensive intelligent early-warning recognition model.The results show that the correct rate of early warning can reach 95.2%.
1.Introduction
Mine water inrush is one of the main disasters that can occur in the process of mine construction and production,and its prevention is an important scientific research topic [1–3].Mine water inrush accidents not only cause the death of mine personnel but also cause serious damage to various machinery and electromechanical equipment and result in huge economic losses [4,5].To further explore the prevention and control methods of coal mine water inrush,with the help of geology,mechanics,mining and other interdisciplinary fields,many experts have studied the monitoring,forecasting,and control of coal mine water inrush,the corresponding seepage mode and mutation mechanism of mining coal and rock,the crack propagation in and the evolution law of dynamic coal rock,the formation mechanism of water inrush channels,and the hydrological and geological structural characteristics in water inrush coal mines [6–9].With an increasing understanding of the inrush mechanism of coal mine floor water,some new theoretical methods,such as the fuzzy comprehensive evaluation method [10] and cusp catastrophe theory [11],have been used to predict and forecast floor water inrush and accurately evaluate the risk of floor water inrush.Furthermore,the multi-index vulnerability index method[12–14]has been used to evaluate floor water inrush and has matured the development of long-term prediction and evaluation of coal mine water inrush.However,real-time monitoring and early warning systems have gradually begun to be developed.With the advancement of monitoring technology,the monitoring indicators of an early warning system not only include water pressure,water temperature,stress and strain in the traditional sense but also hydrochemical indicators and microseismic indicators to assist in the judgment of water inrush early warning.The application of microseismic monitoring technology has successfully been used to study the inoculation mechanism and early warning of coal mine rock bursts[15,16]and successfully monitors the abnormal response of a number of microseismic events during the formation,development,incubation and evolution of the water channel[17].There are almost no direct warnings using water chemical indicators and most are used to identify water inrush sources for auxiliary warnings [18,19].
At present,most mine water inrush early warning systems monitor the water level or water pressure to provide early warnings,but with deep coal mining,single-factor early warning systems have difficulty dealing with complex coal mine water inrushes.In contrast,there are relatively few comprehensive real-time monitoring and early warning systems that use multiple indicators for monitoring,and there is no unified standard of early warning quantification criteria for various early warning indicators.Therefore,it is particularly important to determine the indicators for real-time monitoring and early warning,as well as their early warning criteria,to establish a comprehensive early warning model.
2.Methodology
2.1.Water inrush mechanism from the coal seam floor
The causes of water inrush from the coal mine floor involve many factors and a complicated mechanism.In short,the main cause of water inrush from the coal seam floor is that the water pressure of the aquifer under the coal seam is too high,and the thickness and strength of the water barrier between the coal seam and the aquifer are low.The cyclical pressure caused by coal mining causes fractured zones in the strata below the working face.The confined water is affected by the pressure and stress distribution of the mine,and the confined aquifer will form a conduction zone.In the process of repeated mining in coal mines,the joint action of tensile and compressive stresses in the aquifuge continues to form cracks,and the aquifuge’s strength gradually decreases.When the conduction zone and the failure zone are close to each other,they cannot withstand the water pressure,resulting in water inrush from the coal floor.
2.2.BP neural network theory
Due to its powerful self-learning and predictive abilities,machine learning has been tried and applied in various fields of coal mining [20–23].Because of its three-layer structure,including the input layer,the hidden layer and the output layer,and the built-in sigmoid transfer function,the BP neural network realizes nonlinear mapping of the input and output,which is advantageous in the field of risk assessment and early warning.The input data are passed to the output layer via the hidden layer according to the given threshold and weight.When the error of the output value in the output layer is greater than the set value,the error passed back along the neural network adjusts the threshold and weight of each layer.When the output data and the expected data are within the error range,the data are output (Fig.1).
The main steps of BP neural network establishment are to determine the basic information of the input and output data sets and the number of input,hidden,and output layer nodes.In a general BP neural network,the hidden layer output(Hj)is determined by the following formula (Eq.(1)):

wherexirepresents the input data;wijis the weight;ajrepresents the hidden layer threshold;lis the number of hidden layer nodes;andfjis the hidden layer transfer function,which is generally a sigmoid-type function.
The output result of the output layer is calculated by the hidden layer output resultH,the connection weightwjkand the thresholdb.Then,the prediction erroreis calculated based on the predicted outputOand the expected outputY(Eqs.(2) and (3)).

Fig.1.Schematic diagram of the BP neural network structure.

whereOkis the output value of the output layer;bkthe neural network change threshold;andekthe error.
The errors are used to update network connection weights and thresholds and this process is continuously repeated(Eqs.(4)–(7)).When the error drops below a given error and the weight and threshold no longer change,the input data can be predicted based on the existing data.
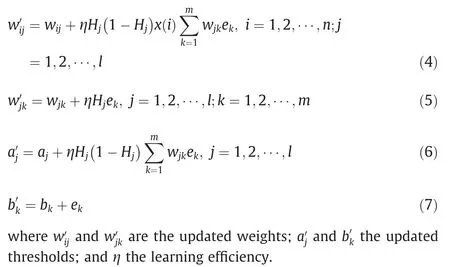
Based on the BP neural network with a small amount of data established by MATLAB,the weights and thresholds in the middle can be adjusted autonomously by the system according to the error,avoiding excessive human intervention.
3.Study area
Located in Liuqiao Town,Suixi County,Huaibei City,Anhui Province,Hengyuan coal mine is adjacent to Yongcheng City,Henan Province to the west of the provincial boundary and is approximately 13 km southwest of Huaibei City.Because it is in the central part of the Huaibei Plain,the terrain of the mining area is flat,sloping from northwest to southeast,and the bedrock is not exposed and is entirely covered by a huge loose Cenozoic layer.The climate in this area is mild,belonging to the oceanic to continental climate in the monsoon region of the northern temperate zone.The precipitation has changed significantly.The annual average temperature is 14.3°C,the annual average rainfall is 785 mm,and the rainfall is mostly concentrated in July and August.In the wet season,climate has almost no effect on the water level and water quality of the main research horizon.Since it is separated by the Tulou Fault,Guxiaoqiao Fault,Mengkou Fault and Lvlou Fault,greater than 40 various faults with a drop of greater than 10 m have been revealed in the mining area,showing the characteristics of high density and different development directions (Fig.2).
The bedrock in the Hengyuan coal mine is completely covered by Cenozoic alluvial strata,with very few strata exposed,mostly covered by Quaternary alluvial plains.The exposed strata from old to new are Ordovician (O1+2),Carboniferous (C2+3),Permian(P),Neogene(N)and Quaternary(Q)(Fig.3).The mine is 2–4.2 km wide from east to the west and 6.2 km long from north to south,with an area of 19.1 km2.The aquifuge of the limestone aquifer from the lower part of the Shanxi Formation in the lower Permian to the upper part of the Taiyuan Formation is mainly 52.05 m thick argillaceous sandstone and was destroyed after mining,forming many fractures and water channels,accompanied by recharge.The limestone aquifer of the Taiyuan Formation (hereinafter,the Taihui aquifer),i.e.,the main water-filled aquifer under coal 6,has an average thickness of 60.76 m and is widely distributed and stable.The water pressure of the Taihui aquifer in the mining area ranges from 4.27 to 5.25 MPa,with an average value of 4.73 MPa,and its average water inrush coefficient is 0.09 MPa/m,far exceeding the critical water inrush coefficient.Coupled with the wide-scale distribution of folds and faults,the mining area is extremely prone to water inrush accidents from the coal floor.Therefore,it is important for the safety of miners,the economic safety of mines and orderly and reasonable mining to establish a real-time monitoring and early warning system for mine water inrush.
4.Results
The first step in establishing an early warning indicator system suitable for mining areas is to establish a real-time monitoring and early warning model for mine water inrush.From the analysis of the coal mine water inrush mechanism and real-time monitoring,in theory,11 indicators,including the water level,water inflow,water temperature,hardness,Ca2+,Na+,stress,displacement,number of microseismic events,pH and TDS,can be used as early warning indicators.However,in practice,due to different coal mine monitoring indicators,all 11 indicators do not need to be used.Considering the abundant water level,water inflow,water temperature,and water quality monitoring values of Hengyuan coalmine and directly affected by water inrush,the threshold determined by the above indicators is more scientific and reasonable,and the results of the early warning system are more accurate.Among them,the aquifer water level,mine water inflow and water temperature are traditionally used monitoring indicators,and Ca2+,Na+and TDS are water chemical indicators.In this research,the water level and mine water inflow can best reflect that the water inrush from the coal floor belongs to the level Ⅰindex.Water temperature and Ca2+and Na+concentrations are relatively poor,belonging to the level Ⅱindex,and finally,the TDS is the level III index.For the early warning mode of each indicator,all adopt the early warning of indicator abnormality and the hierarchical early warning mode after abnormality.
4.1.Quantitative criteria for real-time monitoring and warning of mine water inrush
4.1.1.Quantitative guidelines for early warning of abnormalmonitoring indicators
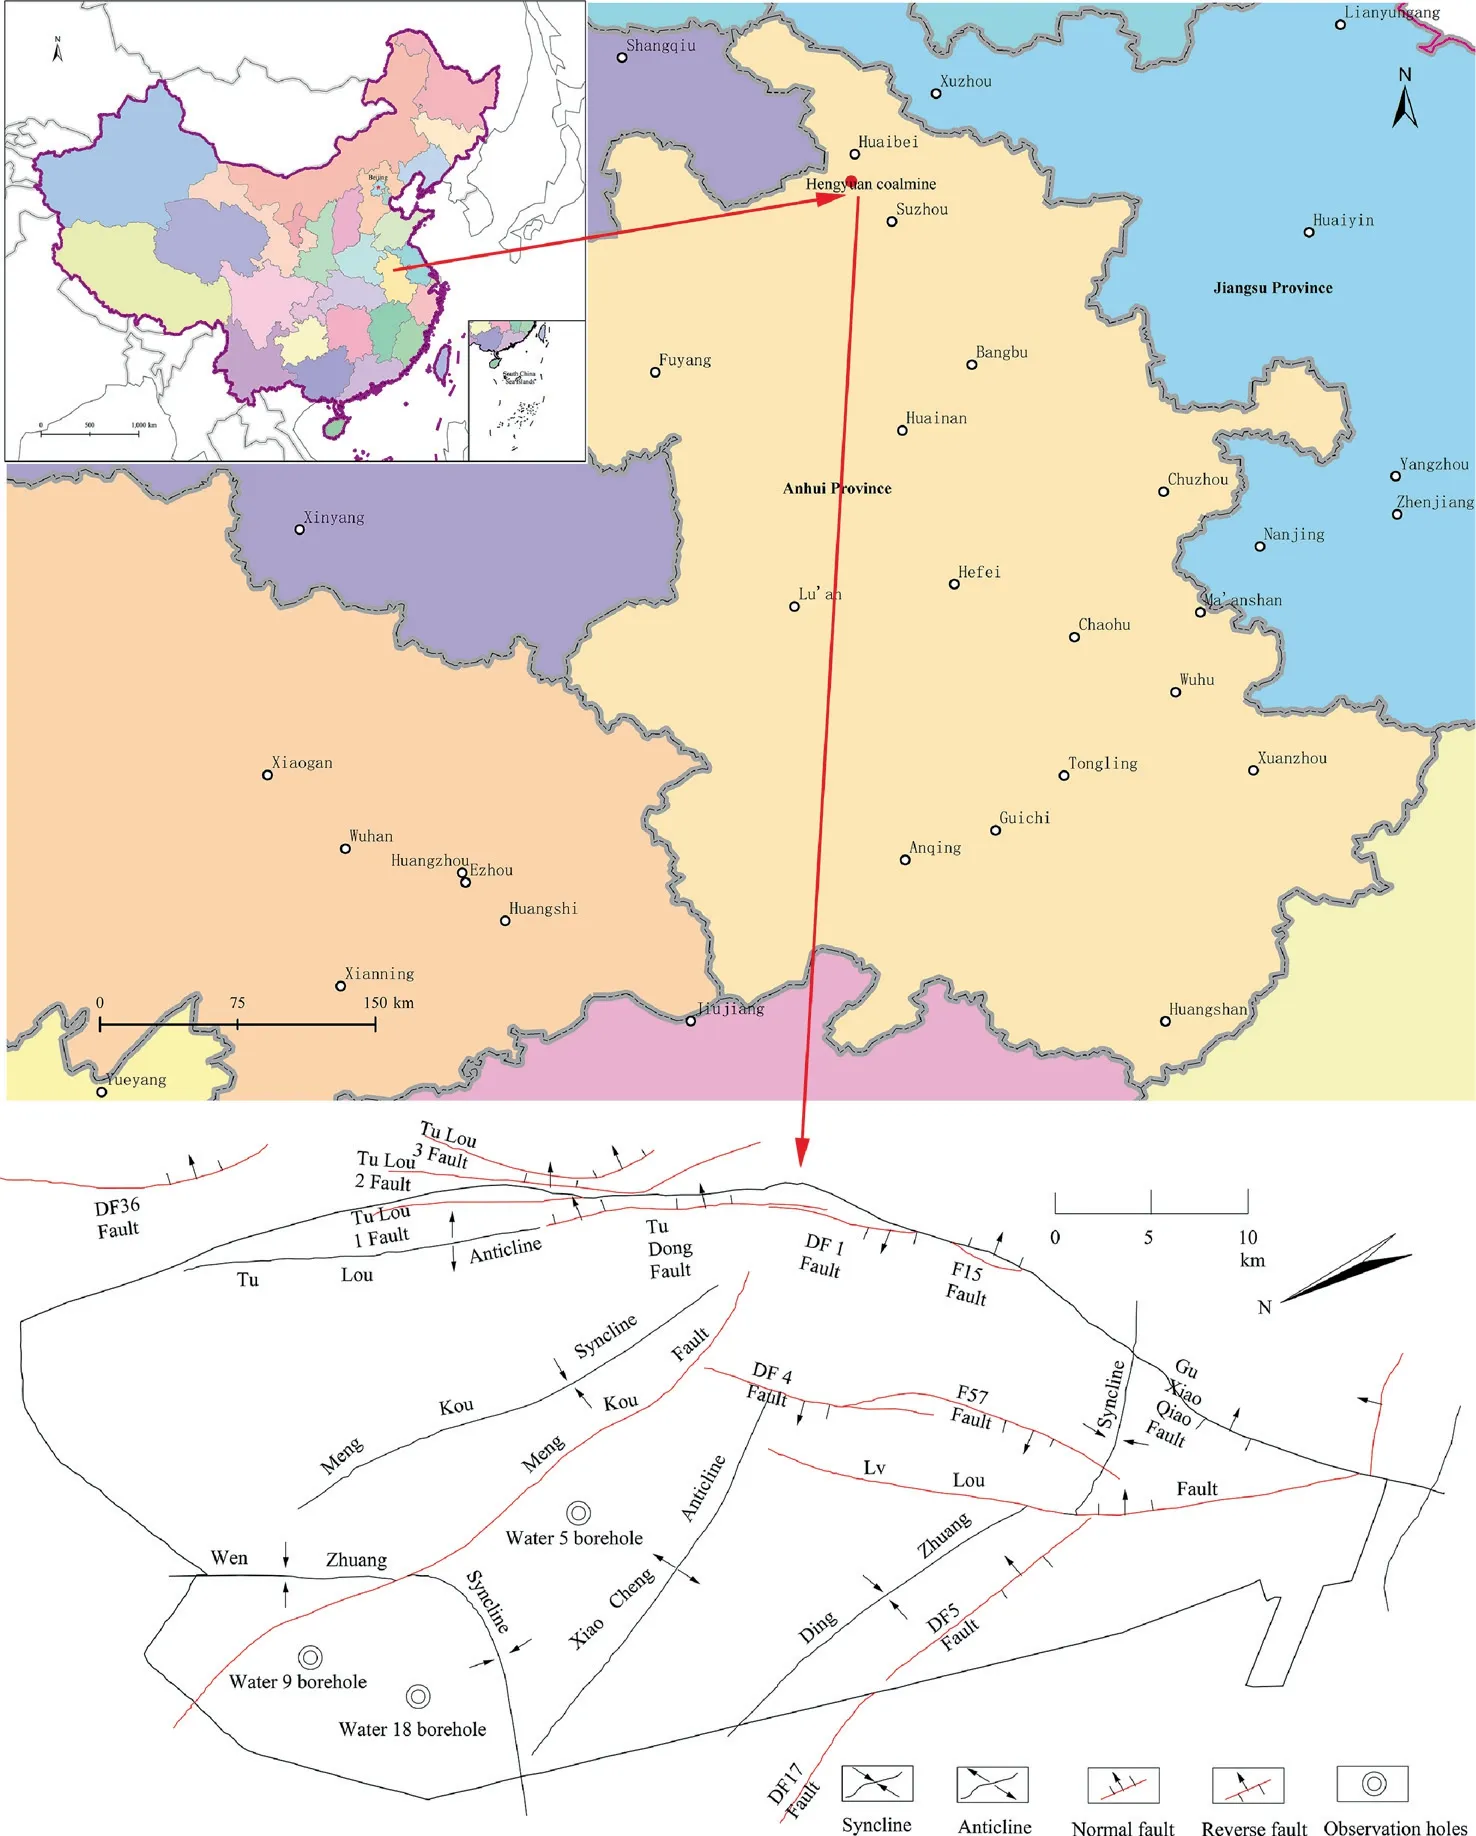
Fig.2.Hengyuan coal mine location and structure distribution map.
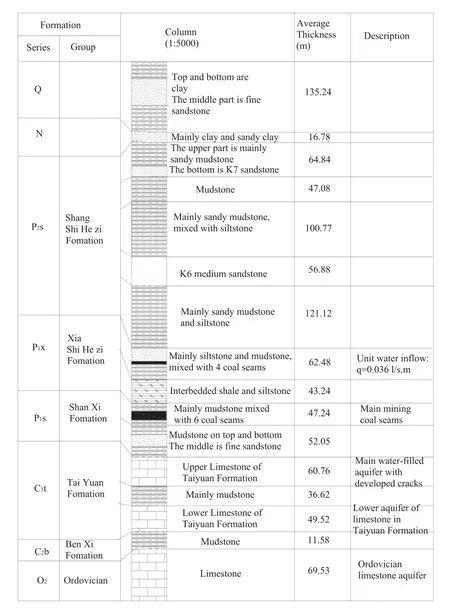
Fig.3.Comprehensive stratum histogram of the Hengyuan coal mine.
In the current long-term evaluation of mine water inrush,multi-index predictions are often made on the quantification of aquifer thickness,water richness,faults,etc.[24–28].Based on previous research and hydrogeochemical indicators of water source identification methods,the quantitative method of real-time warning indicators is set with the help of monitoring data [29–32].4.1.1.1.Quantitative criteria for early warning of traditional indicators.Since the water level of the aquifer drops significantly when water inrush occurs in coal mines and is the easiest to monitor,it is already a routine monitoring item for coal mines.To determine the quantitative criteria for anomalous early warning,the water level change data (Fig.4) of long-term observation holes (water hole 4,water hole 5,water hole 18 and water hole 20)of the Taihui aquifer in the mining area from 2010 to 2011 were used as the background values.Combined with the water levels in the hydrological observation holes (water hole 5 and water hole 18) in 2013(Fig.5)and the water levels from water hole 5 and water hole 18 (Fig.6) in 2016,the abnormal warning threshold of the water level is determined,and its determination method is proposed.
In the entire mining area,there are certain differences in the water level values of each long-term observation hole,and setting the threshold should also consider the situation of the observation hole.From 2010 to 2011,the variation in the water level showed that the largest standard deviation of the water level was 15.77 m for water hole 20,and the smallest was only 2.62 m for water hole 18.These data and the phenomenon reflect the characteristics that the water level can change slightly over a short period of time.Comparing the degree of the decrease in the water level in water hole 5 and water hole 18 from 2011 to 2013,the average water level in water hole 5 dropped by 41 m,and the average water level in water hole 18 dropped by 30 m,which reflects the overall downward trend of the aquifer water level.According to the data in 2016,in the stable section,the standard deviation of the water level in water hole 5 was 3.05 m,and the standard deviation of the water level in water hole 18 was 2.54 m.To examine the early warning effect,the threshold of the water level is the stable average water level (H) minus the standard deviation of the water level (σh),that is,Hthreshold=H-σh.Taking water hole 18 of as an example,the average water level in 2016 was-294.4 m,and the initial abnormal thresholdHthresholdof the early warning system in 2017 was-296.9 m.An abnormality was issued when the abnormal threshold was exceeded.
With the specific cases in many coal mines,mine water inflow occupies an important position in the monitoring index system,mainly because the formation of water channels causes groundwater to enter the mine,inevitably resulting in an increase in water inflow.According to the statistics of mine water inflow data from 2014 to 2015 in mining areas,such as roadways II6111,II617 and II628 (Figs.7 and 8),the mine water inflow of each working face is relatively stable under normal conditions.Therefore,historical data are used to determine the early warning threshold of mine water inflow abnormalities.

Fig.4.Water level of the Taihui observation boreholes in 2011.
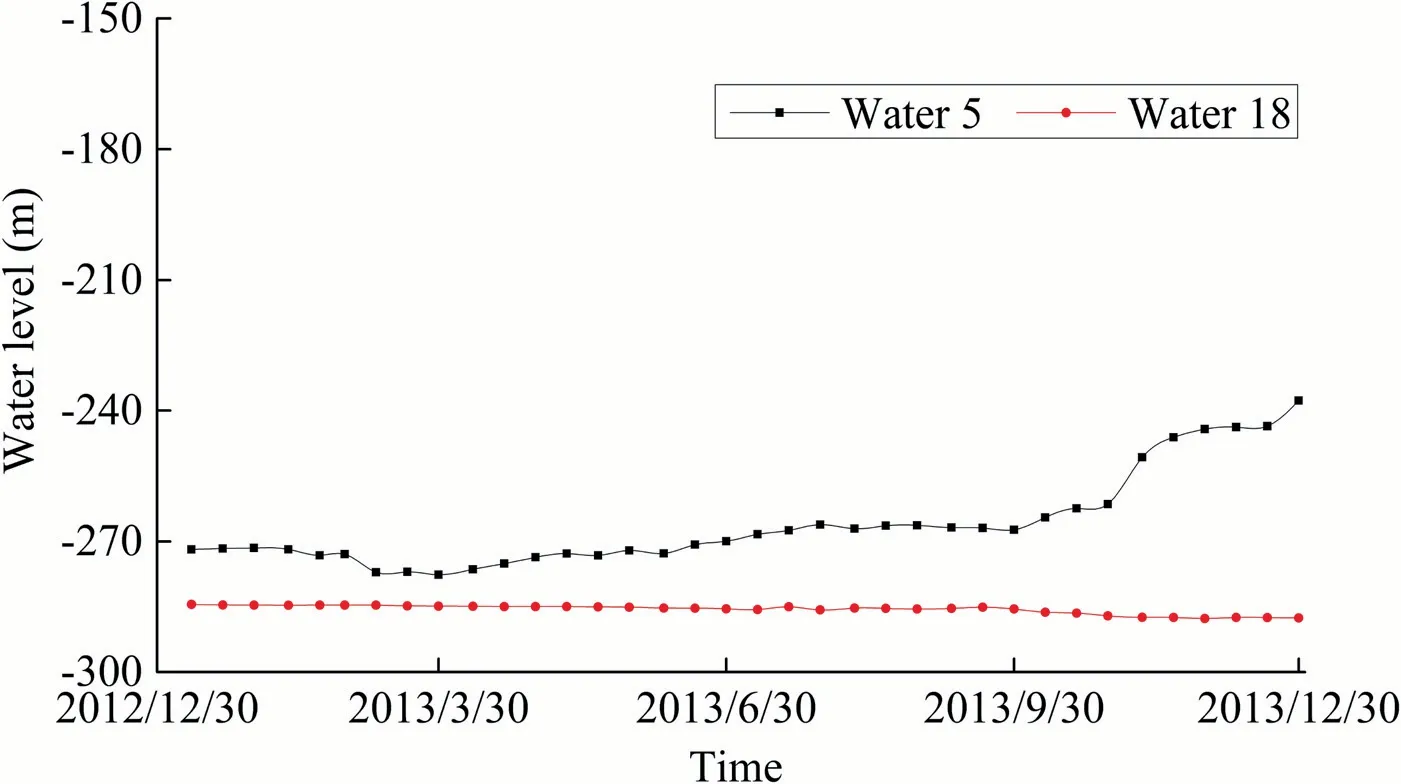
Fig.5.Water level of the Taihui observation boreholes in 2013.
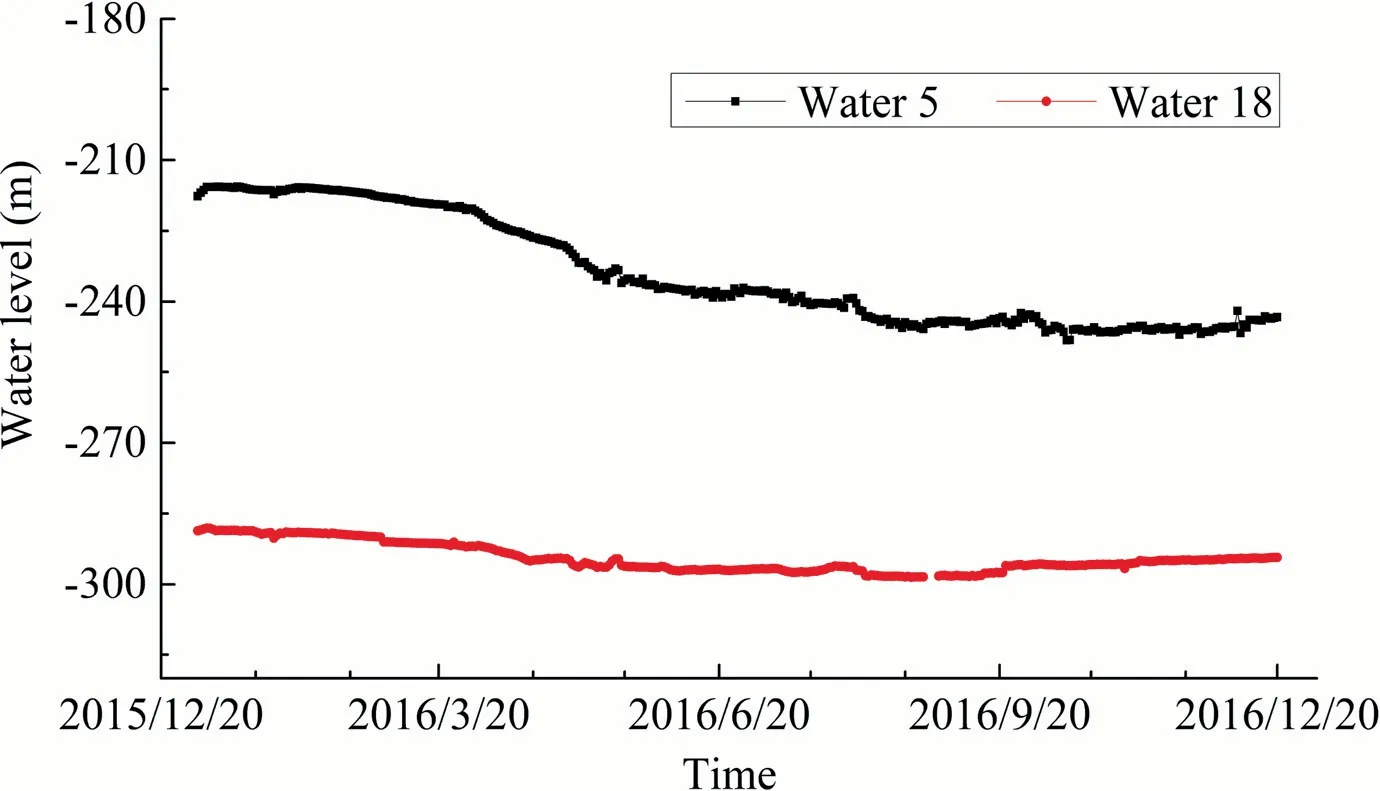
Fig.6.Water level of the Taihui observation boreholes in 2016.
The historical data analysis of mine water inflow from 2014 to 2015 shows that for roadway II6111,the standard deviations were 3.55 and 3.26 m3/d,respectively.For roadway II617,the annual fluctuation was relatively large,and the standard deviations during its relatively stable period were 1.52 and 1.91 m3/d,respectively.For roadway II628,the standard deviations were 2.57 and 2.24 m3/d,respectively.Under normal circumstances,these all reflect that the annual water inflow of each roadway is relatively stable.Suppose σQis the standard deviation of the normal and stable water inflows andQ’is the average water inflow under stable conditions.The upper limit of the inflow threshold isQthresh-old=Q’+σQ.When the monitored water inflow is greater than this value,an abnormal warning is issued for the inflow.Taking the II6111 roadway in 2015 as an example,the stable average water inflowQ’was 11.1 m3/d,and the initial threshold was set to 14.4 m3/d.
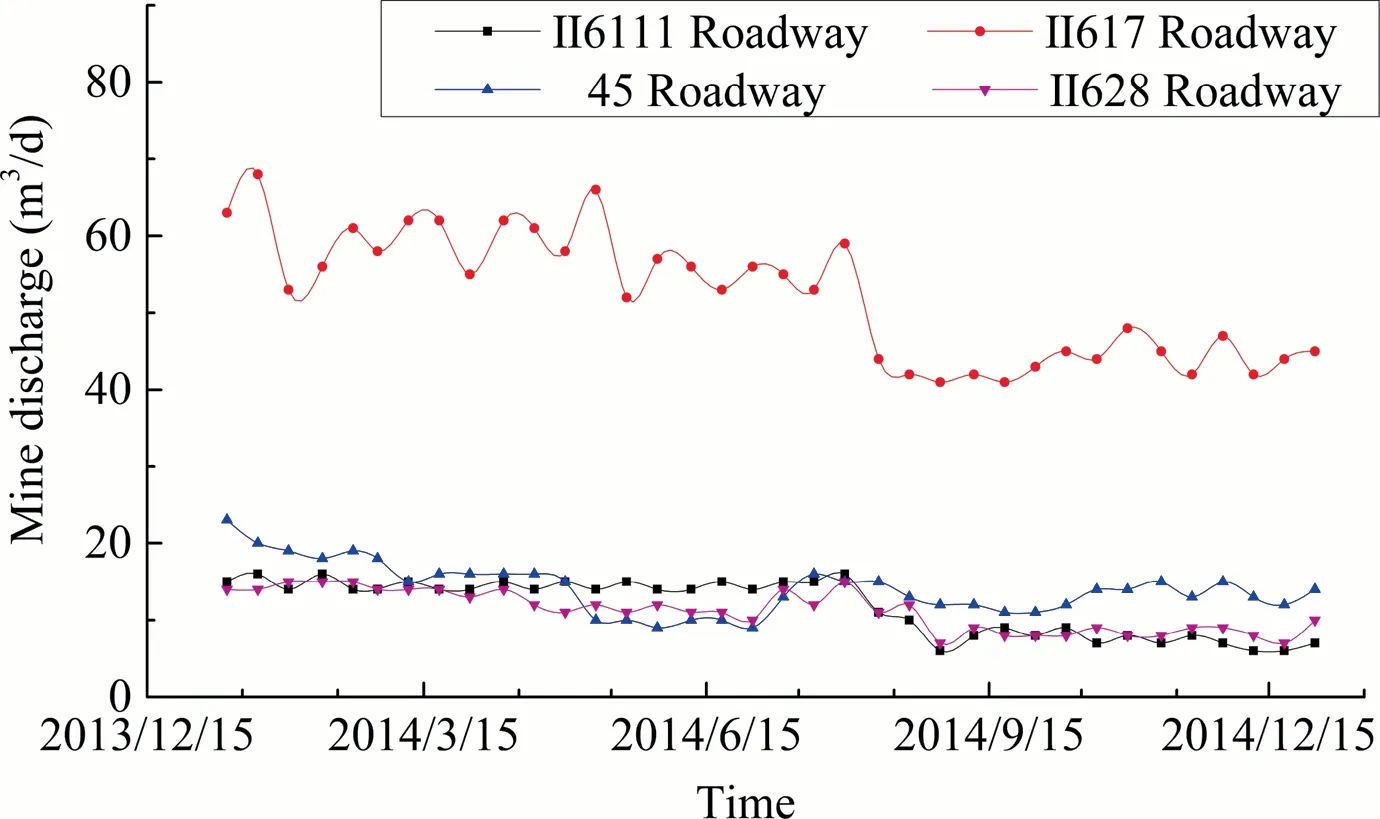
Fig.7.Changes in mine water inflow in 2014.
Water temperature is one of the earliest indicators used in coal mine early warning because different aquifers may have different temperatures.Changes in the water temperature during water inrush indicate that mining has formed a water channel.Thus,the water temperature can assist in determining the water inrush.In view of the water inrush from the coal seam floor,due to the high water temperature in the underlying aquifer,there is a water inrush risk when the monitoring water temperature is close to the observation well’s water temperature.Therefore,the historical data of the Taihui aquifer in 2017 are used to summarize the general characteristics of the water temperature in the aquifer and then to determine the water temperature threshold (Fig.9).
The water temperatures of the two hydrological observation holes are close(stabilized between 32.5 and 33.5°C),and the standard deviations of the water temperatures for water hole 5 and water hole 18 are 0.01 and 0.08 °C,respectively,and reflect the characteristics of very small water temperature changes.Therefore,under normal circumstances,the water temperature is relatively stable and has difficulty increasing or decreasing.To ensure the early warning effect,the water temperature abnormal warning thresholdTthresholdof each hole should be the lowest value of the limestone water temperature of the Taiyuan Formation,that is,Tthreshold=minTTaihui.4.1.1.2.Quantitative criteria for early warning of abnormal hydrochemical indicators.In previous early warning systems,water chemistry indicators were almost never included because of the difficulty of quantification and threshold determination.Therefore,it is of great significance to propose early warning quantitative criteria for water chemistry indicators.The relatively independent water chemistry characteristics between different types of aquifers lead to certain differences in the water chemistry indicators.Therefore,the TDS,Na+,and Ca2+data in the 2018 hydrochemical data of this mining area are selected to detail the quantitative results.The thresholds of TDS,Na+and Ca2+in the study area were determined by statistically analyzing the hydrochemical characteristics of the eighth aquifer under the coal floor,the hydrochemical characteristics of the Taihui aquifer and the hydrochemical characteristics of the mine mixed water in 2018 (Tables 1,2 and 3).
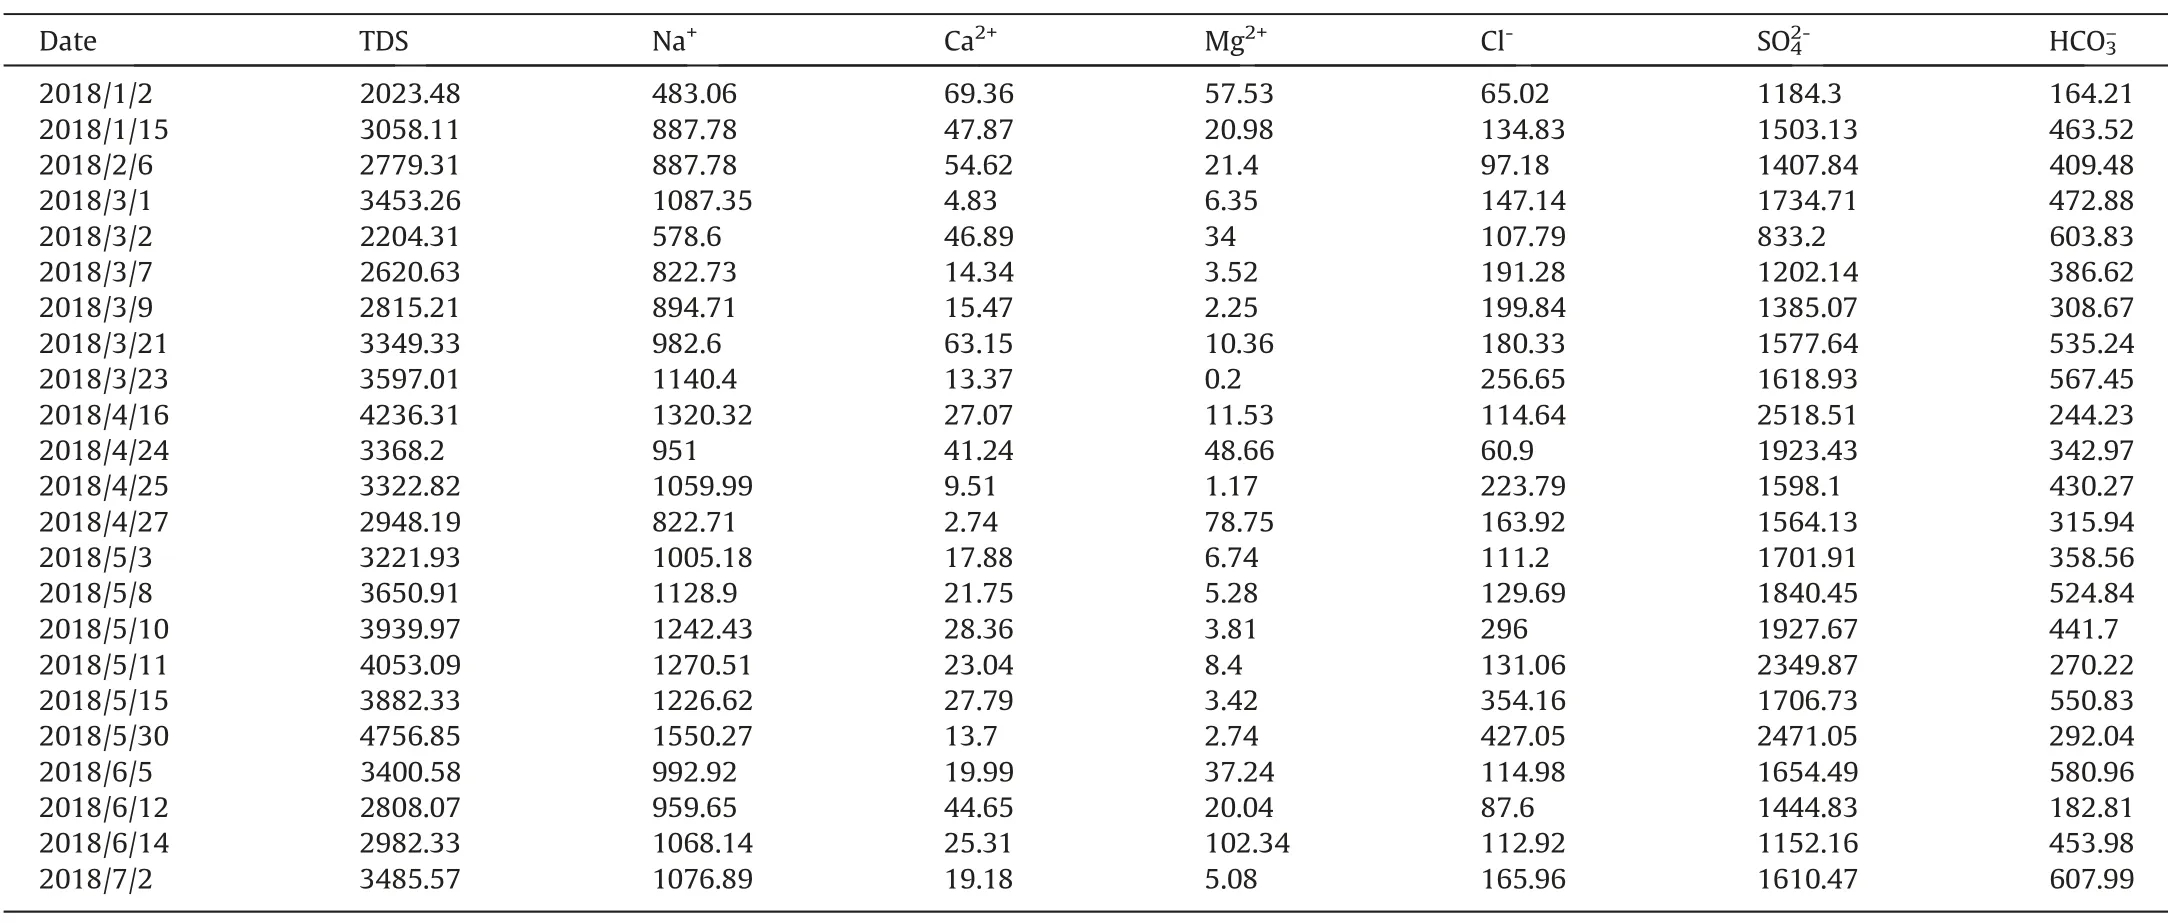
Table 1Statistical hydrochemical data from the eighth aquifer in 2018 (mg/l).

Table 2Statistical hydrochemical data from the Taihui aquifer in 2018 (mg/l).
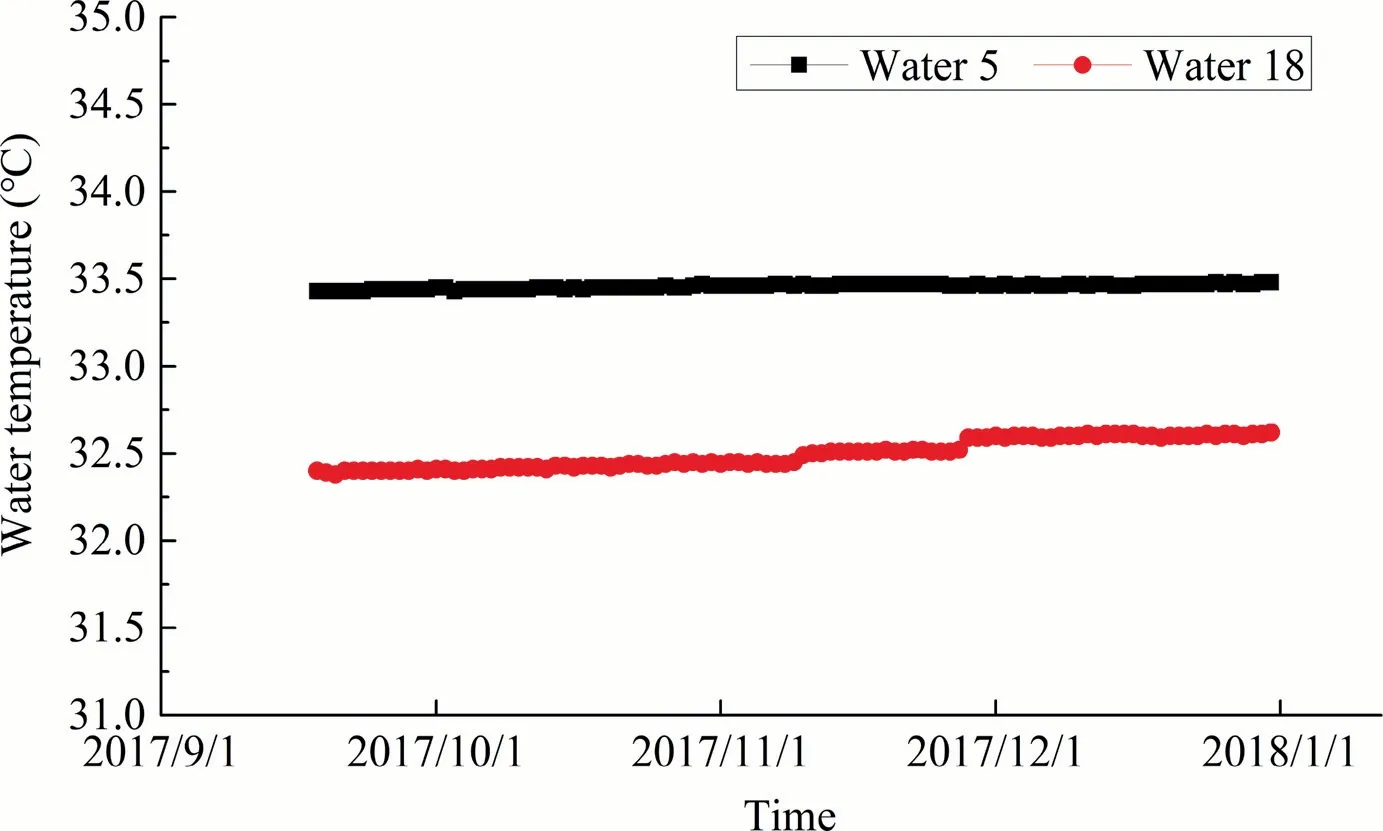
Fig.9.Long-term observation hole water temperature curve of the Taihui aquifer in 2017.
The hydrochemical characteristics of the eighth aquifer and the Taihui aquifer have different cationic characteristics,while the degree of discrimination in anionic characteristics is relatively small.The eighth aquifer showed the characteristics of generally high TDS and Na+and low Ca2+concentrations.The average TDS was 3302.51 mg/l,and most were greater than 3000 mg/l.The average concentration of Na+was 1019.15 mg/l,and greater than 95% were greater than 500 mg/l.The maximum concentration of Ca2+was only 69.36 mg/l,and the average concentration was approximately 28.48 mg/l.In contrast,the Taihui aquifer presents the characteristics of generally low TDS and Na+and high Ca2+concentrations.The average TDS of the Taihui aquifer was 2644.3 mg/l,and almost all TDS measurements were less than 3000 mg/l.The average concentration of Na+was 434.25 mg/l,and most were less than 500 mg/l.The maximum concentration of Ca2+reached 213.49 mg/l,and the average concentration was approximately 96.13 mg/l.Synthesizing the differences in water quality,the abnormal warning threshold of water chemistry indicators is determined by constructing a membership function.The method for determining the abnormal warning threshold is explained in detail with the TDS indicator as an example,and the method for determining the rest of the indicators is the same.
An important step is to determine the threshold using statistical data to construct membership functions of the above three indicators in the two aquifers.Taking the TDS index of the eighth sandstone aquifer as an example,the function construction process is elaborated using the trapezoidal membership function.From the above table,from the smallest value of 2023.48 mg/l to the largest value of 4756.85 mg/l,the membership degree of the TDS range less than its minimum and greater than its maximum is 0.Since the proportion of TDS greater than 2948.19 mg/l and less than 3939.97 mg/l is approximately 70%,the range of membership is 1.Therefore,the membership functionr1(x) can be obtained as Eq.(8):

wherer1(x) is the TDS membership function of the eighth aquifer,andxthe measured ion concentration in mg/l.
Therefore,the TDS membership function (Eq.(9)) in the Taihui aquifer is:

wherer2(x) is the TDS membership function of the Taihui aquifer,andxthe measured ion concentration in mg/l.
Similarly,the membership functions of Na+and Ca2+in the two aquifers are as Eqs.(10)–(13).
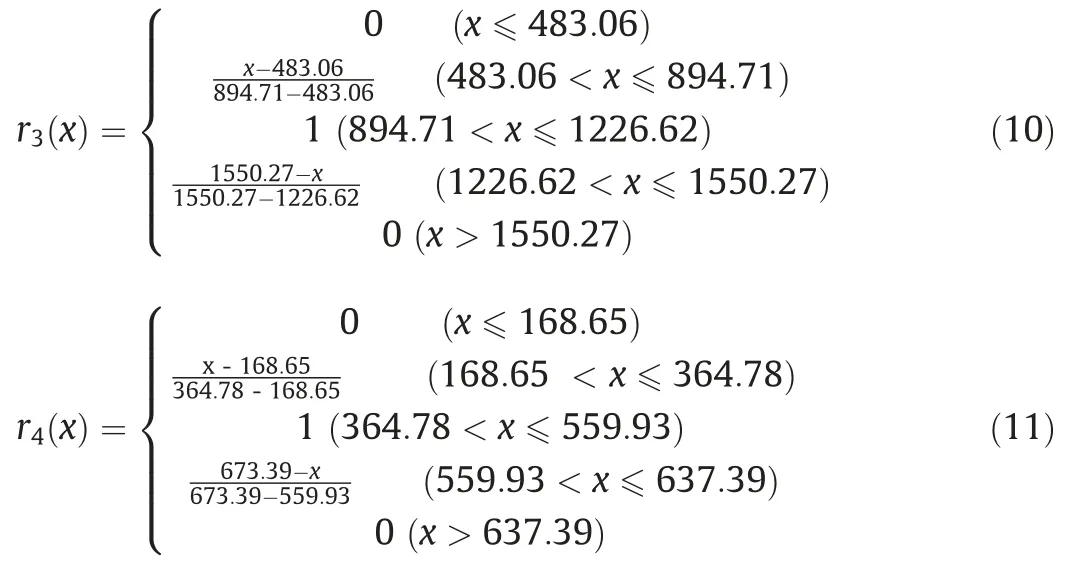

wherer3(x) andr4(x) are the Na+membership functions of the eighth aquifer and the Taihui aquifer;r5(x)andr6(x)the Ca2+membership functions of the eighth aquifer and the Taihui aquifer;andxthe measured concentration of the ion in mg/l.
When the water inrush risk comes from the Taihui aquifer,it is likely to be accompanied by a decrease in the TDS and Na+concentration and an increase in the Ca2+concentration.In the Taihui aquifer,due to the poor effectiveness of TDS and Na+,the threshold is the concentration when the membership degree is 1.Ca2+is more effective,and the threshold is the concentration at which the membership degree is 0.5.For the TDS with a membership of 1,the maximum TDS value is 2908.64 mg/l,which is the threshold for abnormalities,and an abnormal warning should be issued below this value.When the membership degree of Ca2+is 0.5,the minimum value is 54.38 mg/l,which is used as the abnormal threshold.The abnormal thresholds are summarized as follows(Table 4).

Table 3Statistical hydrochemical data from the mine mixed water in 2018 (mg/l).
4.1.2.Quantitative guidelines for early warning of hierarchical warning indicators
The sudden and instantaneous characteristics of coal mine water inrush lead to rapid changes in the indicator values withina short period of time after the monitoring index breaks through the abnormal threshold.However,no unified regulations have been proposed for coal mine water inrush warnings.Therefore,it is extremely important to set the hierarchical early warning mode and quantification method of each index according to the different index characteristics.In this early warning system,the hierarchical forecast mode after the abnormal phase is divided into 4 levels:low risk,medium risk,high risk and extremely high risk.The hierarchical early warning mode is a gradient early warning model,that is,the gradient changes after the indicator exceeds the abnormal threshold for early warning.According to the nature of the indicator,the indicator is divided into a variable amplitude early warning mode (Eq.(14)) and a variable value early warning mode(Eq.(15)).

whereXnis the real-time monitoring value of the index;Xsthe threshold value when the index is abnormal;XI(n) the range of the index variation grading warning;andXIthe absolute value of the index change.
4.1.2.1.Quantitative criteria for hierarchical warning of traditional indicators.In the hierarchical early warning mode,there are different modes for the aquifer water level,mine water inflow and water temperature due to the index characteristics.The commonality is that the spatial distribution and time scale of monitoring indicators need to be considered,and early warning quantitative criteria must be proposed based on certain time and space constraints.
In mine water inrush,a water level closer to the water inrush point results in a greater drop in the water level over a short time.To achieve an early warning,grading early warning criteria are proposed based on the water level change within 12 h and within a 1-km radius of the water inrush point.In the early warning mode,the background value of the normal water level of each aquifer is quite different,so the variable value early warning mode has a better effect.As an absolute value of the water level change,ZIis the quantitative indicator of the water level.Therefore,the water level gradient early warning formula (Eq.(16)) is

whereZnis the real-time monitoring value of the water level;Zsthe abnormal threshold value;andZIthe water level change value.
In the typical case of an extremely large water inrush in the Taoyuan coal mine adjacent to the study area,according to the 17-hour monitoring of the water inrush point within 1 km,the water level dropped by nearly 10 m in the first 2 h,and the drop exceeded 20 m in 6 h (Fig.10).Based on the type of water inrush and expert opinions,it was finally determined that within 6 h of abnormal water level data,1

Table 4Threshold summary table of water chemical indicators (mg/l).
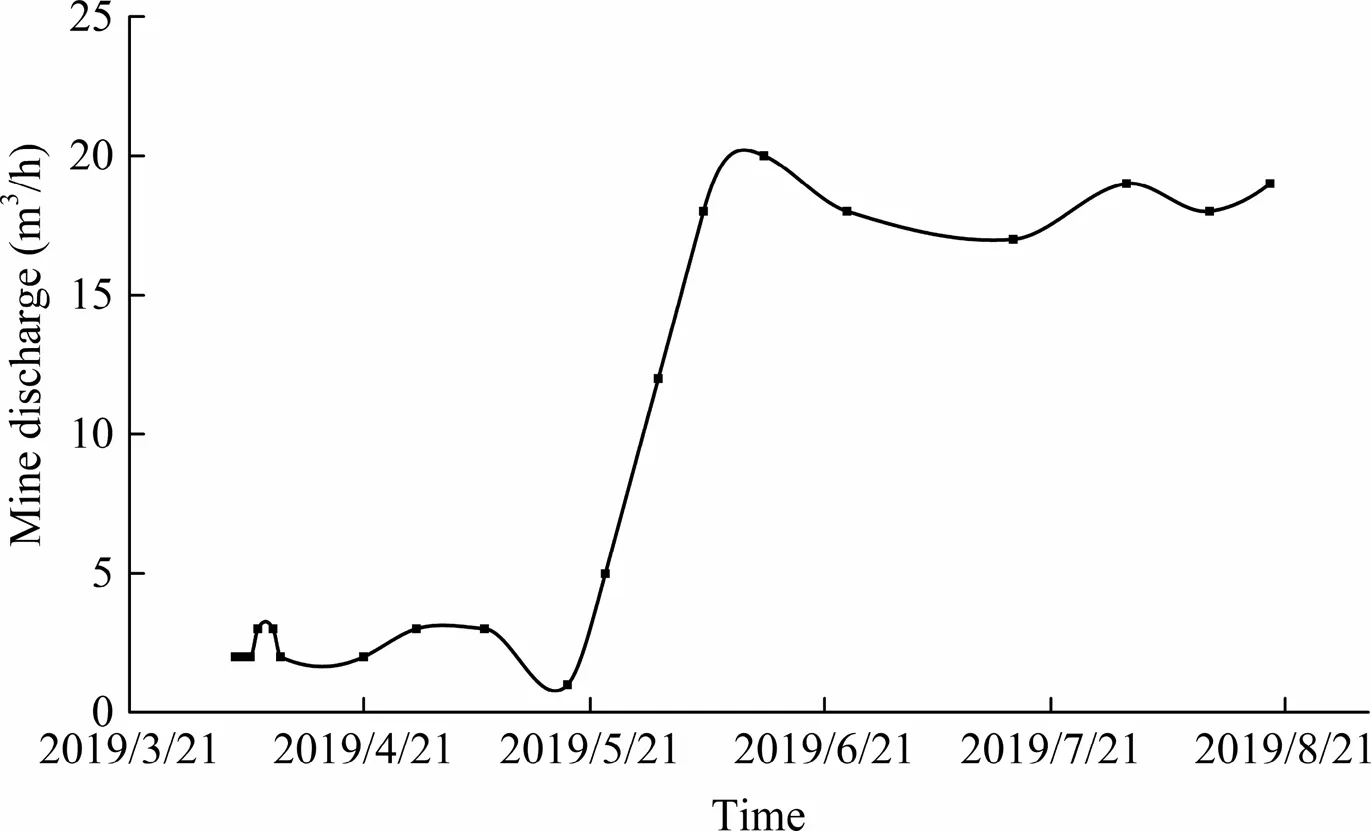
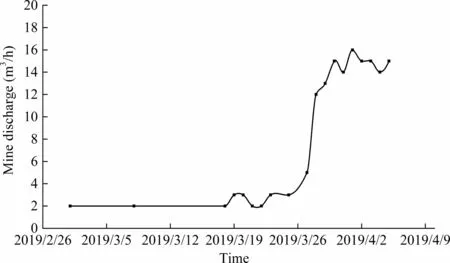
After water inrush,mine water inflow often shows the characteristics of a“sudden jump”,and the increase rate is similar regardless of whether it is a small water inrush or a large water inrush,so the variable amplitude early warning mode is adopted.The quantitative criteria are determined by the three representative small-scale water inrush incidents in this mine and one extralarge water inrush incident in neighboring mines.In the II6112 working face,water seepage occurred in the working face floor,and then the water inrush suddenly increased from 2–3 m3/h to 15 m3/h(Figs.11 and 12).The water inrush event of the II627 working face is similar to that of the II6112 working face,except that the amount of water inrush was different (Fig.13).The extralarge water inrush near the mine was increasingly large:after only half an hour,the water inrush stabilized at approximately 30 m3/h,and after 1 h,the water inrush rapidly increased to 150–200 m3/h(Fig.14).
The mine water inrush inflow often increased by 2–3 times,and a smaller increase in the short period of time resulted in a lower risk.The gradient warning mode of water inflow (Eq.(17)) is

whereQnis the real-time monitoring value of mine water inflow;Qsthe abnormal threshold of mine water inflow;andQI(n)the variation range of water inflow.
According to the data and expert opinions,within 6 h after abnormal mine water inflow,the threshold is as follows:1
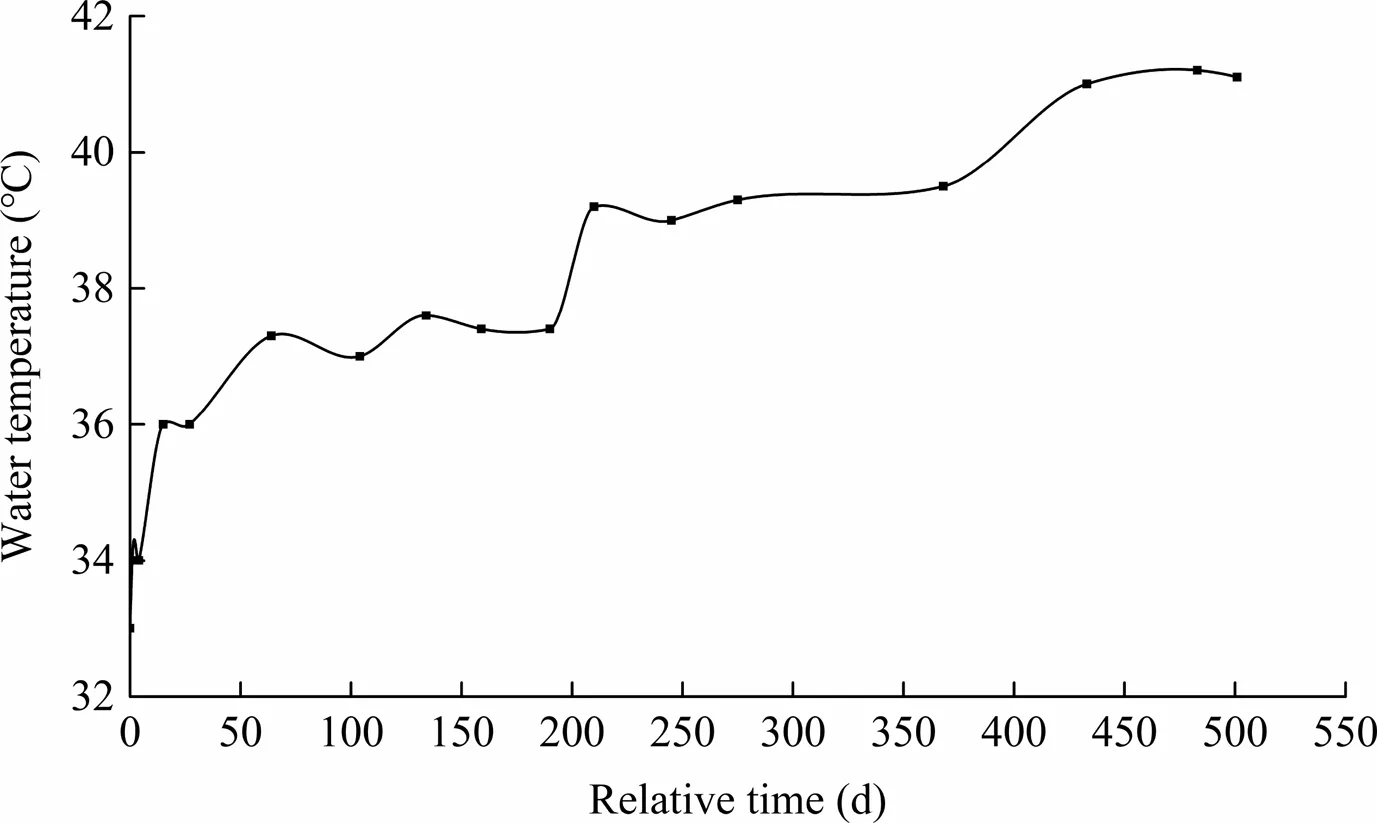
The main feature of the water temperature is slow growth and a very small increment.According to the floor water inrush in the neighboring Renlou coal mine,the water temperature near the water inrush point increased by 1 °C 1 day after the water inrush and 2 °C after 15 days (Fig.15).Since the accuracy of the current water temperature sensor is 0.1°C and with a very small increase,the variable value early warning mode is adopted.Therefore,according to the characteristics of the water temperature indicators,the hierarchical early warning mode (Eq.(18)) is

whereTnis the real-time monitoring value of the water temperature;Tsthe abnormal threshold of the water temperature;andTIthe value of the water temperature change.
Combining the mining area data and expert opinions,the grading early warning threshold within 24 h is 0.1
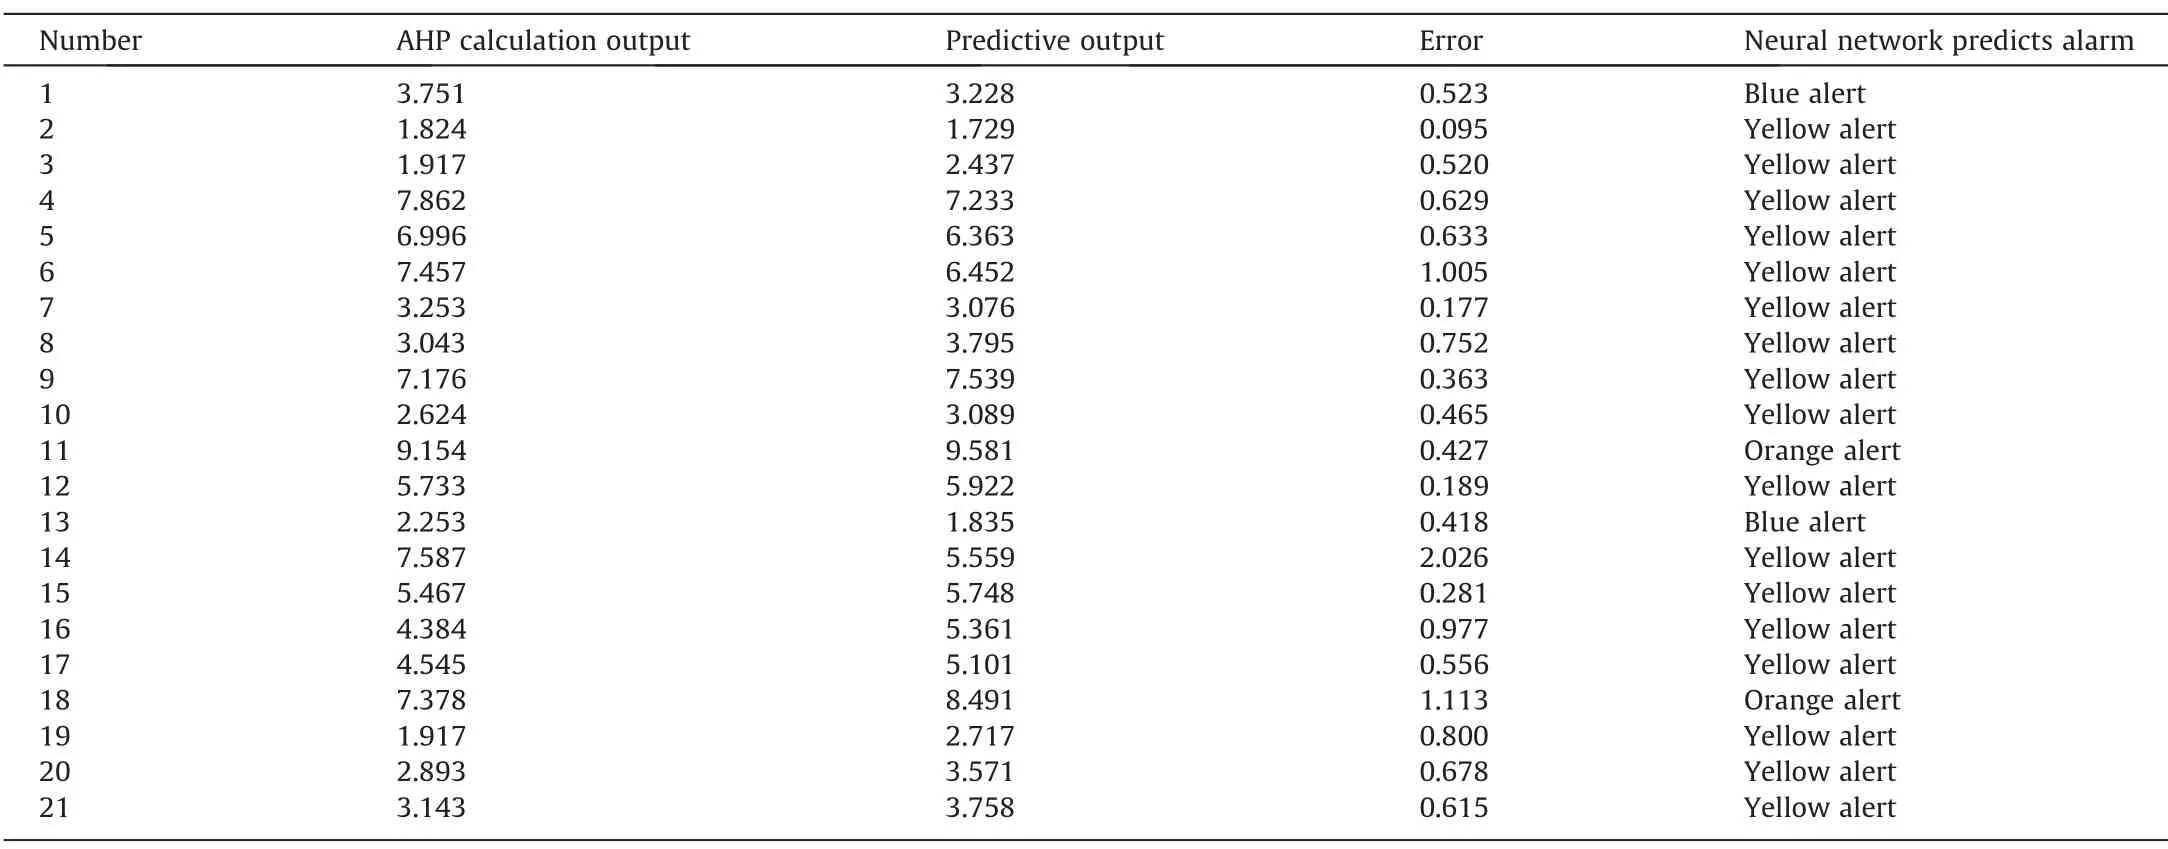
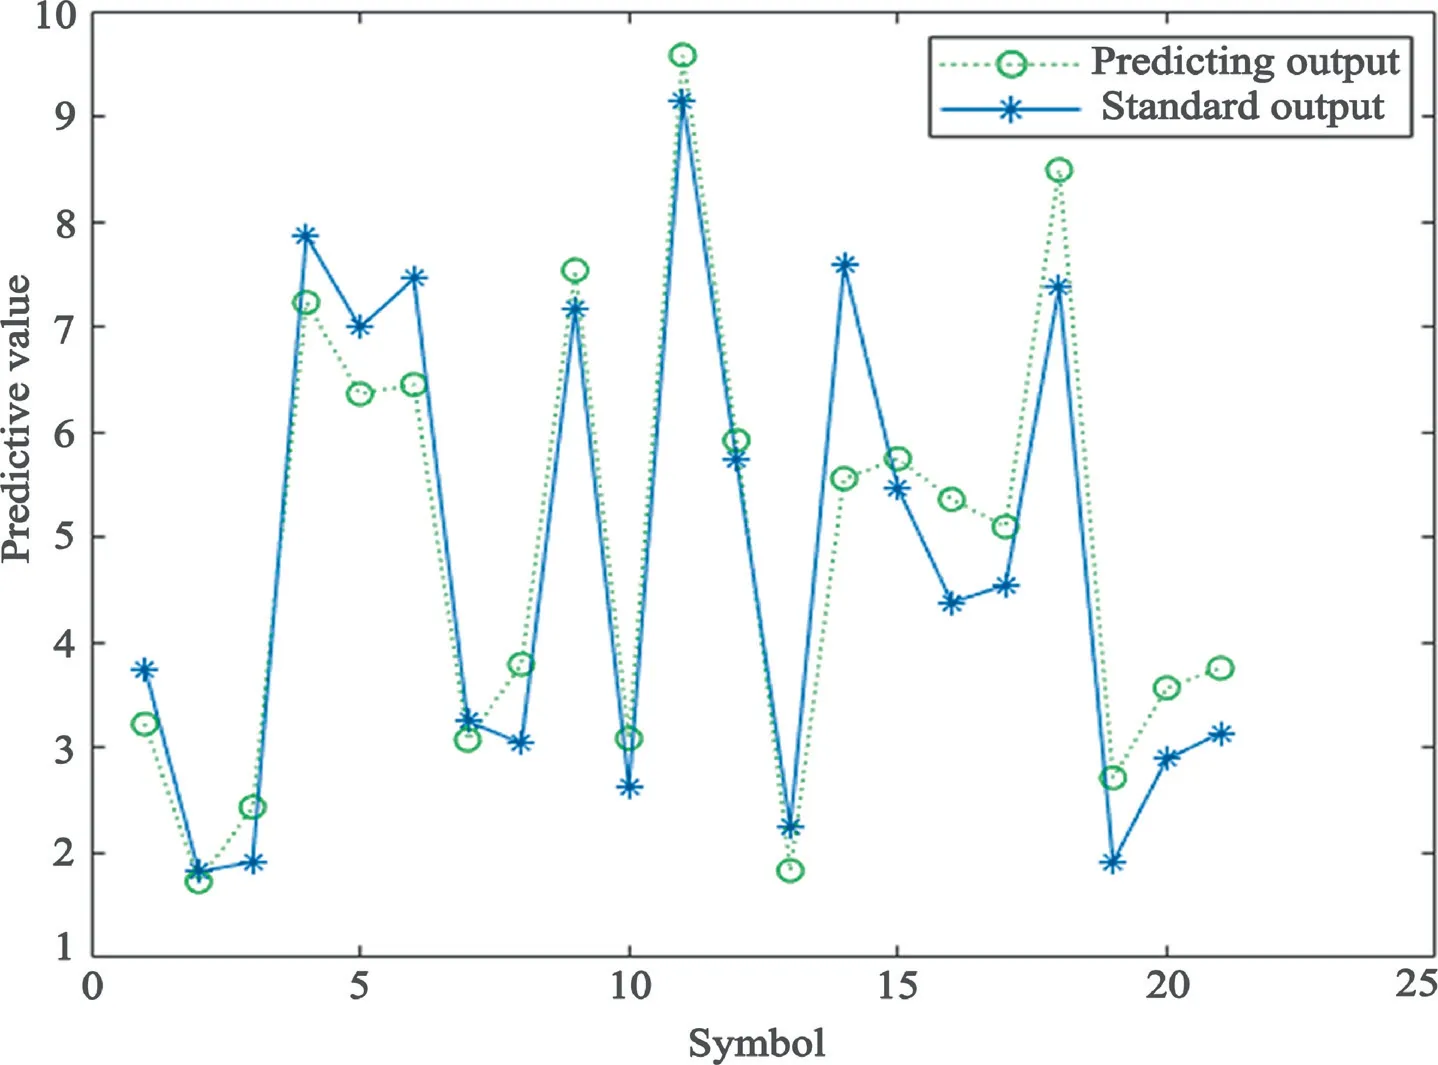
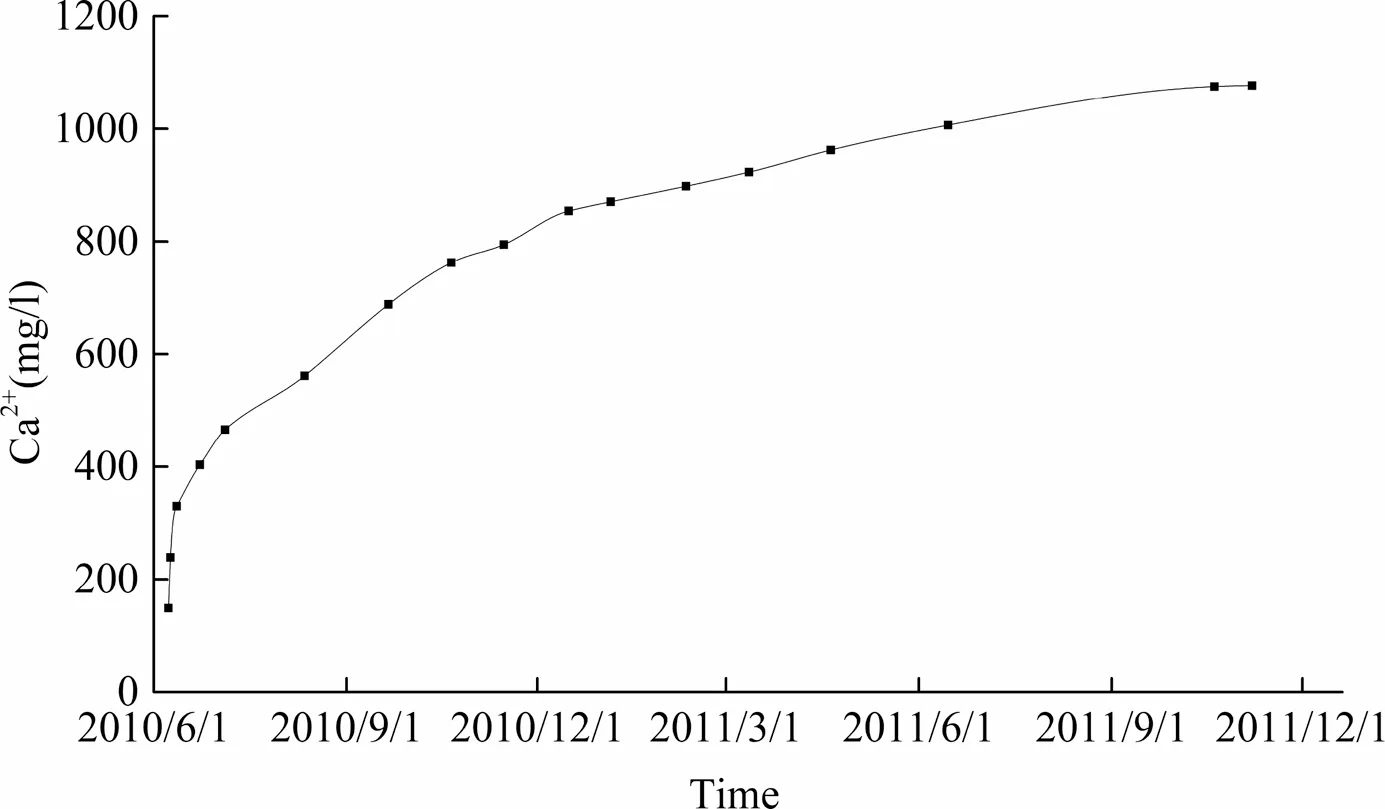
4.1.2.2.Quantitative criteria for early warning of hierarchical hydrochemical indicators.The characteristic of TDS and Na+is that a lower monitoring value results in a higher risk.Since the abnormal thresholds of TDS and Na+are 2908.64 and 559.93 mg/l,when the monitored TDS and Na+values are lower than the two values above,the model starts to enter the hierarchical early warning mode.The tiered early warning evaluation indicators of TDS and Na+are specified asQI(TDS) andQI(Na+).According to Eq.(9),the TDS hierarchical warning mode is as follows:2644.3 Fig.10.Water level change curve after water inrush in the Taoyuan coal mine. Table 5Graded early warning table for the water level. Fig.11.Curve of water inrush from the wind tunnel in the II6112 working face. Fig.12.Curve of water inrush in the II6112 working surface. Fig.13.Water inrush map of the II627 working face. Fig.14.Major water inrush curve. Table 6Graded early warning table for water inflow. Fig.15.Water inrush temperature curve. In contrast,a higher Ca2+monitoring value means a higher risk of water inrush.According to the abnormal threshold for Ca2+and Eq.(13),the grading early warning evaluation index for Ca2+is specified asQI(Ca2+),and the grading early warning mode of Ca2+is as follows:54.38 Table 7Graded early warning table for the water temperature. Table 8Graded early warning table for TDS. Table 9Graded early warning table for Na+. 4.2.1.Construction of the risk evaluation matrix for mine water inrush Because the construction of a multifactor comprehensive early warning model for mine water inrush is relatively weak,it is imperative to build a risk evaluation matrix that conforms to the characteristics of coal mine water inrush with the help of the risk evaluation matrix.Although the International Organization for Standardization (ISO) recommends a 5× 5 matrix,in practice,areasonable risk matrix must be constructed based on the evaluation criteria of various fields [33,34].In coal mine water inrush,according to the changes in various indicators in the study area and the “Detailed Rules for Coal Mine Water Prevention and Control”,the degree of danger and the probability of occurrence are divided into 4 levels,so the risk matrix adopts a 4× 4 matrix.The consequence (c) of each indicator event is assigned a value of 1 to 4 from low risk to super high risk,and the probability of occurrence of a water inrush event (p) is also assigned a value of 1 to 4 from “almost impossible” to “extremely likely”. Risk classification is an important step in risk assessment.Because the coal mine water inrush warning risk evaluation matrix is too different from the original risk matrix,the 5-level evaluation using the original risk matrix is not appropriate.Therefore,based on the original standards and standards in other fields,the final risk value is summarized as follows:low is 1–2;medium is 3–7;high is 8–11;and extremely high is 12–16 (Table 11). Table 10Graded early warning table for Ca2+. 4.2.2.Weight calculation of the multifactor index for mine water inrush The analytic hierarchy process (AHP),originally proposed by operations researcher Saaty T.L.and Saaty R.W.[35,36],is a method of joint decision making through qualitative analysis and quantitative calculation.When analyzing the importance of each factor,each factor is mainly compared at the same level to determine the relative importance and is then passed up level by level to determine the relative importance of each factor to the overallgoal.The analytic hierarchy process mainly includes hierarchical model construction,expert surveys and scoring to determine the importance of the comparison of pairwise indicators,the establishment of a discriminant matrix,consistency testing and determination of the final weight.With the help of the vulnerability index method [37,38],the construction of a real-time monitoring and early warning system has also gained a certain reference. When AHP is used to calculate the weight,the analytic hierarchy model is first constructed.The target level(levelA)is the monitoring and early warning evaluation of water inrush in the mining face.The criterion level (levelB) is the level I index,level II index and level III index divided according to the validity of the index.The decision-making level (levelC) is divided into the water level and water inflow under the first level indicators;the water temperature,Ca2+and Na+concentrations are set under the second level indicators;and the TDS is under the third level (Fig.16). Based on the analytic hierarchy model,theBi-Alevel evaluation matrix is taken as an example to describe the process of constructing each low-level to high-level evaluation matrix. TheBi-Alevel evaluation matrix (Eq.(19)) is According to the AHP calculation method,the weights of each index of theBlevel arewB1=0.64,wB2=0.26 andwB3=0.1.Therefore,the feature vector (Eq.(20))Awis The characteristic value (Eq.(21)) is as follows: Finally,a consistency check(Eqs.(22)and(23))is performed as follows: The hierarchical judgment matrix satisfies the consistency test,and the weight is reasonable.The discriminant matrix and consistency check ofC-B1andC-B2levels are the same as in the above steps.The calculated value of the final level total ranking consistency test is 0.016<0.1,which meets the requirements of the total ranking consistency test,and the construction of the matrix and the determined weight are reasonable.Finally,the statistical weights are summarized (Table 12). Fig.16.AHP model of the early warning system. 4.2.3.Construction of the early warning model for mine water inrush The most important thing in the construction of an early warning model is the construction of an early warning mechanism.The general steps of the operation process of the early warning system are as follows:determine the early warning target;screen and determine the early warning indicators and their thresholds;analyze and obtain the single-factor and multifactor early warning modes;determine the single-factor evaluation value and calculate the multifactor comprehensive early warning value;and divide the risk level and warning (Fig.17). The final quantitative output of the early warning model is the risk value.According to the index weight and the risk value in various situations given by the risk matrix,the final alarm value is calculated (Eq.(24)). whereRKis the risk warning value;fZ(x) the value of the risk function of the water level in the aquifer;fQ(x)the value of the risk function of mine water inflow;fT(x) the value of the water temperature risk function;fNa(x)the value of the Na+concentration risk function;fCa(x) the value of the Ca2+concentration risk function;fTDS(x) the value of the TDS risk function. The multi-index comprehensive risk warning level is also divided into four levels:blue,yellow,orange and red warnings,corresponding to low risk,medium risk,high risk and extremely high risk.When 1 ≤RK<3,a blue warning will be issued;when 3 ≤RK<7,a yellow warning will be issued;when 8 ≤RK<12,an orange warning will be issued;when 12 ≤RK≤16 or there is a certain indicator of abnormality and the danger level will be reached within 3 h,a red warning will be issued (Table 13). 4.3.1.BP neural network design The water inrush intelligent early warning system based on machine learning can provide further help in the coal mine water inrush early warning and is an important part of intelligent mines.From 2014 to 2017,91 sets of data can be found for 6 indicators where any indicator is abnormal,and these data sets are used to learn and train the BP neural network and predict. The indicators of the BP neural network are the input layer,hidden layer and output layer.Input layer:There are 6 main influencing factors of the early warning system,and the number of input layer nodes is set to 6.Hidden layer:After calculation and error analysis,the hidden layer of the early warning system is a double-layer hidden layer with 5 nodes.The transfer function of the hidden layer uses the default sigmoid type function.Output layer:The output value is the coal seam water inrush risk value,so the number of nodes in the output layer is 1.The value of the output layer is any real number,so the transfer function is selected as the default purelin type function. The learning and training functions are the learngdm and trainlm functions in MATLAB to ensure their accuracy.The number of training process iterations is set to 1000,the learning rate is set to 0.1,and the error target is 0.04.In summary,MATLAB is used to build a 6–5-5–1 four-layer BP neural network early warning system (Table 14). Table 12Weights table of the risk warning indicator system. In the detailed settings of the neural network,when the monitoring values of the borehole water level,face water inflow,water temperature and water chemistry indicators are within the abnormal threshold range,all data will not enter the early warning system of the neural network.When the above indicators are abnormal and a hierarchical early warning stage is indicated,the values ofZI,QI(n),TI,QI(TDS),QI(Na+) andQI(Ca2+) are used as the input layer values,and the output layer values of the training data are all the risk values given by the coal mine water prevention expert based on the evaluation matrix. 4.3.2.BP neural network training and prediction A total of 91 data sets were used to create the BP neural network model.Seventy data sets—nearly 80% of the total data sets—were used to train and fit the model,while the remaining 20% (21 data sets) served as the unseen data to test the validity of the trained and fitted model.The data were divided based on the hold-out cross-validation technique with percentage divisions[39,40].The training ended when the number of training iterations reaches 1000 or the network error performance was less than 0.04.Finally,the neural network reached the requirements when the training reached step 6 (Fig.18). Fig.17.Flow chart of the early warning model. To determine the reliability of the training results,by analyzing the consistency of the neural network simulation risk value(Y)and the actual risk value(T),the linear regression equation of the training phase isY=0.96T+0.013 withR=0.98703,and the network training is reliable (Fig.19).The early warning results of the remaining 21 sets of data(Table 15)are basically the same as those of the linear early warning system (Fig.20),but the alarm judgments of the 3rd,13th,18th and 19th groups are quite different.Although the results of the 3rd,18th and 19th intelligent early warning groups were high,they also played an early warning role.The test value of the neural network has a relatively small error,and the correct rate of early warnings is as high as 95.2%. In the previous sections,the quantitative method for the realtime monitoring and early warning indicators for mine waterinrush were explained in detail,and a water inrush early warning model was established.However,in the water inrush early warning model,hydrogeochemical indicators are selected according to the difficulty of real-time monitoring and the effective reflection of water inrush,which is of great significance to the construction of the model.In terms of effectiveness,according to Tables 1–3,it is obvious that cations are highly distinguishable among thethree types of water.In terms of real-time monitoring,Na+,TDS and Ca2+have more reliable sensors,while other ions (such as Mg2+) need to be sampled and tested.Therefore,the hydrogeochemical indicators are Na+,TDS and Ca2+. Table 13Early warning classification of comprehensive early warning models. Table 14Parameter summary table of the BP neural network. Table 15BP neural network test results table. Fig.18.Neural network training results. Fig.19.Consistency diagram of the simulation training and actual results. Fig.20.BP neural network test results. In fact,in the monitoring of the Renlou coal mine adjacent to this study area,Ca2+had a significant increase after large-scale Taihui water inrush (Fig.21).Therefore,the hydrogeochemical characteristics after water inrush in the study area also tend to be similar to the source of the water inrush.When Taihui water inrush occurs,because Taihui water has lower TDS and Na+but higher Ca2+,it is very likely that TDS and Na+will decrease and Ca2+will increase.In addition,compared with TDS and Na+,Ca2+has a more obvious change trend after water inrush,and there are actual monitoring cases for the change in Ca2+.Therefore,in this water inrush warning model,the effectiveness of Ca2+is higher than that of Na+and TDS. The establishment of a real-time monitoring and early warning system for coal mine water inrush is a complicated process.Although the indicators and quantitative methods have been determined on the basis of considering the real-time monitoringand effectiveness of the indicators,there are still many areas for further improvement in the future. Fig.21.Ca2+ curve after a water burst in the Renlou coal mine. First,the indicators and specific quantitative values selected at this time are mainly for the early warning of water inrush from the Hengyuan coal mine.However,after combining the actual conditions of other coal mines,indicator selection and quantitative methods can be used to establish an early warning system.Therefore,future work will analyze the quantitative standards of early warning indicators for multiple mines to summarize the universal applicability of indicator quantification.Second,the small BP neural network early warning system data set is the biggest limitation.Although water inrush cases in the study area had been collected for more than ten years,the improvement in the early warning system is far from sufficient.In the future,to improve the early warning system,it is important to use monitoring data to discuss the neural network learning rate and the number of training sessions. In summary,the universality of index quantification and the optimization of intelligent systems are not extensively considered in the current research.Therefore,future research should urgently address these two aspects to ensure the safe coal mining. (1) A single indicator hierarchical early warning identification model for each indicator is established.Hierarchical early warning is mainly divided into 4 levels,and specific quantitative methods for each level are proposed for the first time. (2) A multifactor linear warning model for water inrush from the mine floor is constructed.Using AHP,the weights of the aquifer water level,mine water inflow,water temperature,Na+,Ca2+and TDS are calculated to be 0.429,0.211,0.036,0.063,0.161 and 0.1.The warning model is finally obtained asRK=0.429fZ(x)+0.211fQ(x)+0.036fT(x)+0.063fNa(x)+0.161fCa(x)+0.1fTDS(x). (3) An intelligent learning and early warning model of multifactor mine floor water inrush is constructed.The training results and the actual calculation results have a high degree of fit and low error,and the correct rate of early warnings is as high as 95.2%.This early warning model realizes the intelligent development of coal mine water inrush and provides a reference for future deep learning of water inrush early warning systems. Acknowledgement This research was financially supported by the National Key Research and Development Program of China (No.2019YFC1805400).





4.2.Multifactor linear warning model for real-time monitoring of mine water inrush


4.3.Multifactor intelligent warning model for real-time monitoring of mine water inrush


5.Discussion
5.1.Discussion of the validity of the hydrochemical index




5.2.Limitations
6.Conclusions
杂志排行
矿业科学技术学报的其它文章
- Super-absorbent swellable polymer as grouting material for treatment of karst water inrush
- Spatio-temporal variation and propagation direction of coal fire in Jharia Coalfield,India by satellite-based multi-temporal night-time land surface temperature imaging
- Location estimation of autonomous driving robot and 3D tunnel mapping in underground mines using pattern matched LiDAR sequential images
- Implications for rock instability precursors and principal stress direction from rock acoustic experiments
- Proposing a novel comprehensive evaluation model for the coal burst liability in underground coal mines considering uncertainty factors
- Machine learning-based constitutive models for cement-grouted coal specimens under shearing
