Optimization of rhizosphere cooling airflow for microclimate regulation and its effects on lettuce growth in plant factory
2021-10-22LIKunFANGHuiZOUZhirongCHENGRuifeng
LI Kun,FANG Hui,ZOU Zhi-rongCHENG Rui-feng
1 College of Horticulture,Northwest A&F University/Key Laboratory of Protected Horticultural Engineering in Northwest,Ministry of Agriculture and Rural Affairs of China,Yangling 712100,P.R.China
2 Institute of Environment and Sustainable Development in Agriculture,Chinese Academy of Agricultural Science/Key Laboratory of Energy Conservation and Waste Management of Agricultural Structures,Ministry of Agriculture and Rural Affairs of China,Beijing 100081,P.R.China
Abstract In plant factories,the plant microclimate is affected by the control system,plant physiological activities and aerodynamic characteristics of leaves,which often leads to poor ventilation uniformity,suboptimal environmental conditions and inefficient air conditioning. In this study,interlayer cool airflow (ILCA) was used to introduce room air into plants’ internal canopy through vent holes in cultivation boards and air layer between cultivation boards and nutrient solution surface (interlayer). By using optimal operating parameters at a room temperature of 28°C,the ILCA system achieved similar cooling effects in the absence of a conventional air conditioning system and achieved an energy saving of 50.8% while bringing about positive microclimate change in the interlayer and nutrient solution. This resulted in significantly reduced root growth by 41.7% without a negative influence on lettuce crop yield. Future development in this precise microclimate control method is predicted to replace the conventional cooling (air conditioning) systems for crop production in plant factories.
Keywords:air movement,environmental control,microclimate,water cooling,root and shoot growth
1.Introduction
Plant factories with artificial light (PFAL) are known for their controllable and stable environmental conditions (Kozai 2013a;Okamuraet al.2014;Miyagiet al.2017). Their success depends on the proper supply of airflow to the plant canopy.
However,because of boundary layer resistance (Kimet al.1996;Langre 2008) and plant interference (Nishikawaet al.2013),it is difficult to achieve uniform airflow around plants,leading to nonuniform air temperature,relative humidity and CO2concentrations (Runkle 2016). In a PFAL measuring 3.47 m×4.35 m×2.97 m,the differences in temperature and velocity could be as high as 2.7°C and 1.4 m s-1,respectively (Moonet al.2014). With increasing demand for high-quality products and the increasing size of PFAL,nonuniformity resulting from conventional environmental control systems is becoming more problematic.
To solve this challenge,solutions have been proposed to enhance the airflow around and through the plant canopy. Goto (2012) enhanced the air speed at the canopy level by placing additional fans on each shelf. Yoonet al.(2015) suggested that a 1.6 m s-1air velocity was needed in cultivation shelves to ensure a uniform distribution of temperature. Goto and Takakura (1992) and Shibataet al.(1995) applied downward airflow onto the plant canopy from air tubes deployed above the plants. Airflow characteristics for such air distribution systems were studied by using computational fluid dynamics (CFD) simulations (Zhanget al.2016). An optimal design with 8 m s-1air velocity inside the tubes could provide an average air velocity of 0.42 m s-1at the crop canopy surface. These methods were recognized to be more effective in providing the plant with uniform airflow than the conventional environmental control that provides horizontal air movement while preventing tipburn (a physiological disorder characterized by browning of lettuce leaf tips,generally recognized as a symptom of calcium deficiency caused by insufficient plant transpiration).Frantzet al.(2004) eliminated tipburn by blowing air directly onto the meristem. This method increased the photosynthetic photon flux (PPF) to 1 000 μmol m-2s-1,increased the temperature optimum from 25 to 30°C and elevated the CO2concentration to 1 200 μL L-1,resulting in a 4-fold increase in growth rateversusthat achieved in a conventional environment. Air tubes were placed below the leaves as well. Shibuyaet al.(2006) achieved an upward airflow of 0.03-0.07 m s-1around tomato seedlings by blowing and drawing air from 6 mm diameter holes made in plastic pipes positioned on the surface of the growing medium. This technique significantly promoted plant gas exchange and growth and was considered better than the higher-velocity downward airflow described above that seedlings were exposed to. Nishikawaet al.(2013) designed a new plant rotation mechanism by using an electric turntable device to rotate the lettuce at 2 rotations per minute to alleviate nonuniform airflow,resulting in approximately 20% higher dry weight of lettuce plants than under fixed conditions.
Nevertheless,these methods neither eliminate canopy boundary layer resistances nor require more investments in air distribution systems such as customized air pipes,high-pressure air pumps and extra energy input. In addition,root zone improvements were not considered even though the root zone environment is more critical than the canopy environment for plant growth (Xu and Huang 2000;Fukuoka and Enomoto 2001;Korner and Paulsen 2004). In this study,a ventilation and temperature regulation system was designed to introduce room air into the internal canopy (the space between cultivation boards and the leaves) using the interlayer between the cultivation boards and the nutrient solution surface. The objectives of this study were to 1) examine the effects of the system on the microclimate and the growth of butterhead lettuce,2) optimize the system,and 3) evaluate the system performance in terms of energy savings compared with a conventional environmental control system.
2.Materials and methods
2.1.Plant materials and growing conditions
Butterhead lettuce (Lactuca sativavar.Capitata) seeds (Flandria RZ,Rijk Zwaan,De Lier,the Netherlands) were sown in a plastic seedling tray (32 cm×23 cm×4 cm) and germinated in a growth chamber (GLED-250PY,LuXi Technology Co.,Ltd.,Beijing,China) equipped with 16 white LED lights,which provided 120 μmol m-2s-1light intensity at full spectrum wavelength. The temperature was maintained at (20±0.5)°C and (18±0.5)°C during the 16/8 h light/dark cycle,respectively. The relative humidity (RH) was maintained at 80-85%. Half-strength Hoagland’s (Yorioet al.2001) nutrient solution (pH (6.3±0.1);EC (0.8±0.2) mS cm-1) was used during the seedling stage. Fifteen days after sowing,uniform seedlings had two true leaves and one bud were transplanted onto cultivation boards (polyethylene,72 cm ×130 cm×1.4 cm,37 plants m-2) in a fully closed plant factory located at the Chinese Academy of Agricultural Science (CAAS),Beijing,China (lat.39°57´40.2´´N,long.116°19´34.6´´E). The plants were cultivated using the deep flow technique (Huet al.2008) for 29 days using Hoagland’s nutrient solution (pH (6.3±0.1),EC (1.6±0.2) mS cm-1). The carbon dioxide (CO2) concentration was maintained at (900±50) μL L-1. The temperature and RH varied among different treatments,and the values are given in the Experimental design section (Experiment 3).
LED fixtures (Bio-lighting Sciences and Technology Co.,Ltd.,Dongguan,China) with red (peak at 660 nm,full width at half maximum (FWHM) at 70 nm) and blue (peak at 460 nm,FWHM at 40 nm) LEDs were hung 30 cm above the cultivation boards to illuminate the plants. The red/blue ratio (R/B) during the experiments was maintained at 8:1 (Wenet al.2011). Photosynthetic photon flux density (PPFD) at 15 cm above the cultivation boards was maintained at 200 μmol m-2s-1by adjusting the luminosity at each wavelength. A 16-h photoperiod was maintained followed by an 8-h dark period. A spectrometer (LI-1500 with LI-190R quantum sensor;LI-COR,Nebraska,USA) was used to test the photosynthetically active radiation (PAR) by placing the sensor horizontally on the centre of the cultivation board,and the light distribution was highly consistent on the cultivation boards.
2.2.Microclimate control system and operational principles
An interlayer cool airflow (ILCA) system was designed to introduce controlled room air into the interlayer between the cultivation boards and the nutrient solution surface and then direct the air upward into the plant canopy (the top of the plants) through vent holes in the cultivation boards (Fig.1). The ILCA system consisted of cooling and airflow components. The cooling system included three water chillers (Fig.2-A;ALS28G-100,AoLingHengYe Technology Co.,Ltd.,Shenzhen,China),a heat-insulated water tank (volume:60 L),a water-cooled heat sink (104 mm× 80 mm×24 mm),and a 6-way high-precision flow distributor (Fig.2-B;SuYiTong mechanical and Electrical Co.,Ltd.,Dongguan,China). The airflow component consisted of a direct current (DC) brushless fan (BFB1212HH,Delta Electronics,Inc.,China) and a customized timing-rotation rate control system,which included 12 automatic cycle time controllers (ZYS48-S,Toone,ZhuoYi Electronic Co.,Ltd.,Shanghai,China) and 12 pulse width modulation DC motor speed controllers (CCM96SK,Meimotor,MeiMoTong Electronic Co.,Ltd.,Shanghai,China). The controllers were used to control the runtime and air velocity of 6 fans during the light and dark periods by adjusting the on/off positions of the circuits and the fan (Fig.2-C) rotation speed (revolutions per minute,r min-1),respectively. A timing switch (QDT11;QunDa Technology Co.,Ltd.,Jiangsu,China) was used to regulate the water-cooled heat sink cooling pump. In the ILCA system,a closed water cycle was established between tank and the water-cooled heat sink through pipelines. The water-cooled heat sink was attached to a fan (Fig.2-C). While the system was running,room air was forced into the interlayer after cooling to a certain temperature by the water-cooled heat sink. Then,the air flowed up through vent holes (Fig.2-D;diameter 5 mm,16 holes per plant) drilled through the cultivation boards to regulate the microclimate of the plants. The cooling water returned to the water tank and was cooled to the target temperature by the water chillers before the next cycle. Possible air leakage in the cultivation system was eliminated by sealing any holes or gaps. All cold-water circulation pipelines were covered with foam rubber insulation material (Fig.2-A and B).
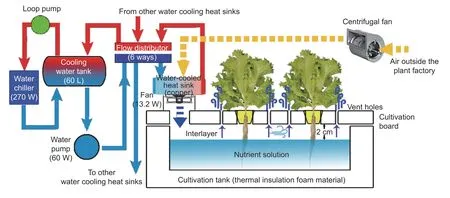
Fig.1 Schematic diagram of the interlayer cool airflow (ILCA) system. Conditioned (using a water-cooling system) air was introduced into the interlayer between the cultivation board and the nutrient solution surface in a deep flow hydroponic system before it flowed upward into the internal canopy through vent holes in the cultivation board. The airflow rate could be adjusted by setting different fan rotation rates. Each of the cultivation areas received an equal flow of water by manually adjusting the valves of flow distributor.
2.3.Measurements
Air and water flow rateFor measuring the air velocity (m s-1) through the vent holes (Fig.2-D) around each plant (vent hole unit) for the ILCA treatments,a thin plastic plate was rolled to form a duct,which was 28 cm long and 6.6 cm in diameter (Fig.2-E). A 9-mm-diameter hole was drilled 5 cm from the end of the duct (23 cm away from the cultivation board during measurements),where a hot-wire anemometry probe (Climomaster 6501-BG,Kanomax Japan,Inc.,Japan) could be inserted. During measurements,the duct was placed vertically over each vent hole unit (Fig.2-F) under a specified fan rotation speed,and all planting holes in the cultivation boards were sealed with tape in order to simulate the condition that all planting holes were occupied and sealed by plants. A laser tachometer (Testo 460,Testo SE and Co.,KGaA,West Chester,PA,USA) was used to detect the fan rotation rate. Based on the measured air velocity values,the flow rate (cm3s-1) of each vent hole unit (Q0(cm3s-1)) could be determined:Q0=Velocity (cm s-1)×Tunnel sectional area (cm2).
The cooling-water flow rate (L min-1) was determined as QW=Water flow (L)×60/Time elapsed (s). In practice,a constant water flow of 2 L was used.
Working conditions of the lLCA systemTemperatures of the water inside the tank and the outlet air of the vent holes were recorded by a 4-channel thermocouple logger (HOBO UX120-014M,Onset Computer Corporation,Bourne,MA,USA) with K-type thermocouples (TT-K-30,Omega Engineering Inc.,Norwalk,USA). These data were recorded at 5-s intervals (snap-shot measurements).
Microclimate changes and plant growthThe microclimates of the canopy,internal canopy and root zone were monitored comprehensively. Temperatures and relative humidity (RH) of the canopy were recorded using a data logger (HOBO U14-001,Onset Computer Corporation,Bourne,MA,USA) hanging in the middle of the cultivation area,15 cm above the cultivation boards. A CO2logger (HOBO MX 1102,Onset Computer Corporation,Bourne,MA,USA) was used to measure the temperature,RH,and CO2concentration in the internal canopy by placing it in a rectangular area consisting of four planting holes in the centre of a cultivation board (Fig.2-D). The same type of CO2logger was used to measure the interlayer CO2concentration as well. A planting hole diameter was enlarged to 4 cm to insert the CO2sensor tightly. Temperatures and RH of interlayer air were recorded using a data logger with a cable sensor (HOBO UX100-023,Onset Computer Corporation,Bourne,MA,USA). A 1-cm-diameter hole was made in a cultivation board to insert the sensor into the interlayer. All these data were recorded at 2-min intervals (snap-shot measurements).The temperature and dissolved oxygen (DO) concentration of the nutrient solution were recorded by Teflon-coated Pt100 thermocouples and DO sensors (DOS-600,BoHaiZhiYuan Technology Co.,Ltd.,Beijing,China),respectively. The thermocouple and DO sensors were immersed in the nutrient solution,and data were recorded by a logger (MIK-R4000D,MEACON Automation Technology Co.,Ltd.,Zhejiang,China) at 1-min intervals (snap-shot measurements).
All sensors were calibrated. For the thermocouple logger,this study used thermostatic bath (DC-3005A,Tianheng Instruments Factory,Ningbo,China) to calibrate them at 0 and 25°C. The CO2sensors were calibrated in the atmosphere by pressing the calibration button following the instructions in the operation manual for the device. This study calibrated the DO sensors by using a zero-oxygen standard solution and air-saturated water.
Growth parameters such as fresh weight (FW),dry weight (DW),plant height,number of leaves,leaf length,and leaf area were measured after harvest to analyse the physiological characteristics of shoots and roots. Weights were measured by an analytical balance (GL6202-1SCN,Sartorius Lab Instruments GmbH Co.,KG,Goettingen,Germany). Leaf areas were measured using a leaf area meter (LI-3100C;LI-COR,Nebraska,USA). Plant height,leaf length and leaf width were measured using a Vernier calliper. Root characteristics including length,diameter,area,volume and number of tips were obtained using a root image analysis system (WinRHIZO,Regent Instruments Inc.,Canada) after harvesting when the roots were removed from the shoots.
Energy consumptionAn electricity meter (UT230A-II;UNI-T Science and Technology Co.,Guangdong,China) was employed to measure the electricity consumption of the water chillers (the only cold source for the ILCA system) and cooling pump. Digital ammeters and voltmeters were used to calculate the electricity usage of the fans. For the control treatment,energy consumption for ventilation and air conditioning was acquired from electricity meter data recorded at the beginning and end of the experiment. Energy consumption of the electrical equipment such as water chillers,cooling pump,fans and centrifugal fan of each treatment was determined by the formula:Energy consumption (kWh)=Average operating power of each electrical equipment (W)×Number of equipment×Daily running time (h)×29 days/1 000. Energy-biomass conversion efficiency (EBCE (g kWh-1)) for air conditioning of each treatment was determined by the formula:EBCE=Shoot FW (g/plant)×37 plants m-2/Electric energy consumption of air conditioning per area (kWh-1m-2). This technique has no effect on energy savings of artificial lights,which were identical in terms of the devices used and energy consumed between the treatments.
2.4.Experimental design
Experimental statistical analysis was performed using Design-Expert Software (ver.8.0.6;Stat-Ease,Inc.,Minneapolis,MN,USA). Variance analyses within treatments were used,and different letters between columns indicate significant differences atP≤0.05 according to the least significant difference test.
Experiment 1:Performance and airflow uniformity of the lLCA systemThe flow rate uniformity of each vent hole unit and the homogeneity of fan performance were crucial for the evaluation and application of the approach. Following the methodology described above,the air velocity for the minimum and maximum fan rotation speed from each vent hole unit was measured six times by using different fans of the same model. Based on observations and measurements,the minimum stable fan rotation speed was approximately 1 300 r min-1,while the maximum speed was 2 700 r min-1. In addition,1 650,2 000 and 2 350 r min-1were selected for the test. For each flow rate,rows with even numbers on two cultivation boards (one cultivation area) were selected to form 16 measuring points (4 vent hole units by 4 rows) in one cultivation unit (Fig.2-D). The total airflow rate (Q=Q0×28 plants per cultivation unit) could also be determined because 4 out of 32 holes at the end of the cultivation unit (4 vent hole units in 1 row) were sealed to accommodate the installation of the fan,and no lettuce was planted in these holes (Fig.2-C).
Experiment 2:Optimization of lLCA operational parametersOperational parameters of the ILCA system were crucial for plant growth and energy consumption. A quadric universal rotational combination design was used to investigate the effects of operating parameters on the microclimate and to obtain the optimal combination. Room temperature (X1),cooling-water temperature (X2),coolingwater flow rate (X3) and airflow rate (X4) were determined to be the most influential parameters and were chosen as variables because these factors directly influence the system and adjustable. The response values included the lowest outlet air temperature of the vent hole (lowest air temperature,YA,°C),time required to reach a constant water temperature in tank (balance time,YB,min) and time duration to cool the water to a set point temperature (cool down time,YC,min). Coded values of treatment variables,and design combinations and results are shown in Tables 1 and 2,respectively. In order to simulate a standard working condition for the ILCA system while providing reasonable heat load during Experiment 3,six cultivation areas and all six channels of the flow distributor were used. The operational diagram of the water chiller and cooling pump for this experiment is shown in Fig.3. At the end of each experiment,water temperature in the water tank was at a steady state. Then,the cooling pump was shut off and the water chillers were kept on to cool the water to a specific temperature. When the target temperature was reached,the chillers stopped automatically. The running time of the water chillers was recorded as the cool-down time (YC). When the chillers stopped,all six water-cooledheat sinks were provided with cold water by turning on the cooling pump. As the water heated up,the water chillers restarted automatically when the water was 1°C above the target temperature. When water temperature stabilized again,the cooling pump was turned off,and the running time of the cooling pump was defined as the balance time (YB). During this process,the lowest outlet air temperature of the vent hole,as described in working conditions of the ILCA system in Section 2.3,was recorded as the lowest air temperature (YA).
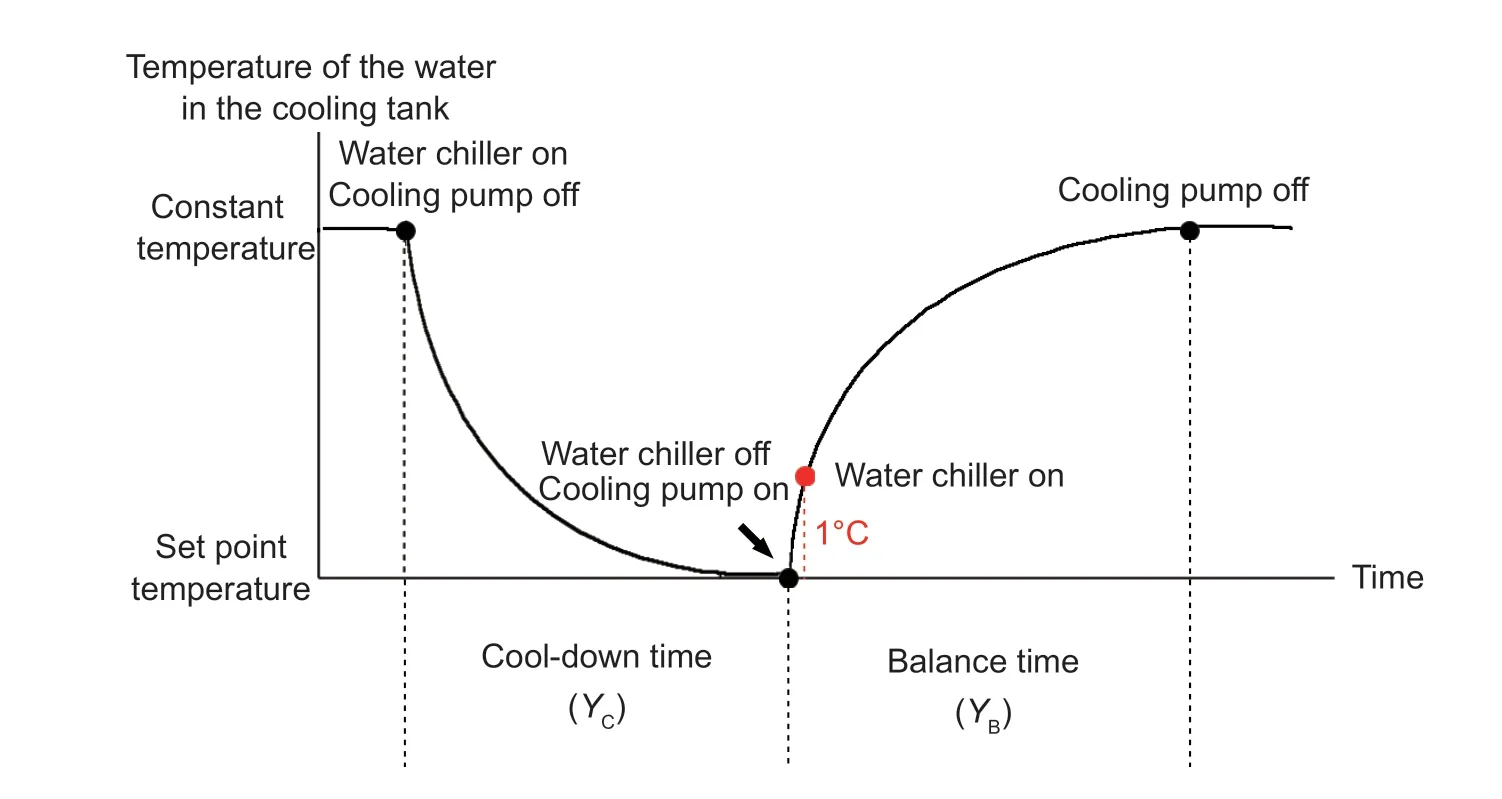
Fig.3 Operational diagram of the water chiller and cooling pump during the optimization experiments. The time required to reach a constant water temperature in the water tank (balance time,YB,min) and the time required to cool the water down to the target temperature (cool-down time, YC,min) were recorded as system response values.

Table 1 Factors for environmental parameters and their coded values used for the quadric universal rotational combination design1)
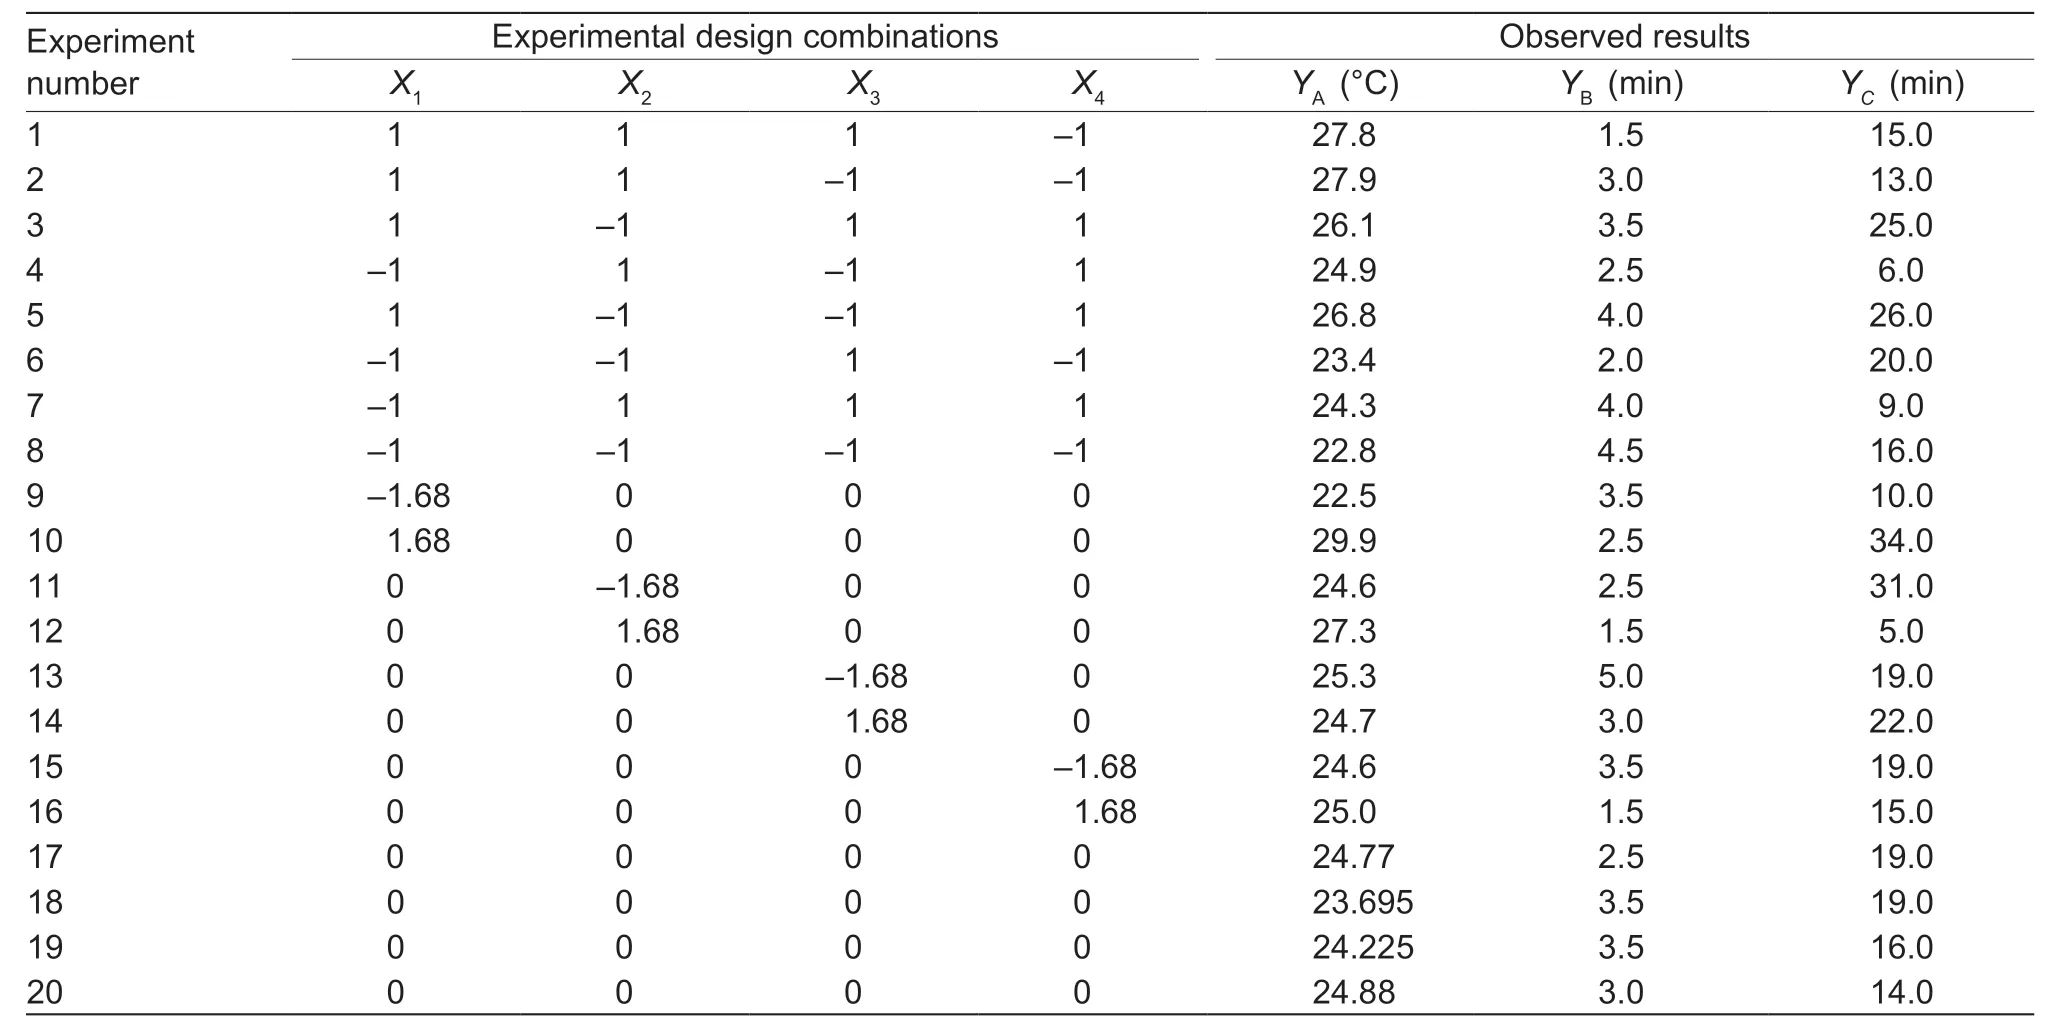
Table 2 Experimental design combinations and observed results1)
Various levels of room temperature and cooling-water temperature were obtained by setting the PFAL air conditioning system and water chillers to their respective target values. The airflow rate could be adjusted by applying different fan rotation rates. Six cultivation areas equipped with a water-cooled heat sink and fan were used during the experiments. Each of the cultivation areas received an equal flow of water by manually adjusting the valves of flow distributor (Fig.2-B). Each cultivation area was shielded from room airflow by plastic black film mounted vertically around the treatments in order to prevent the plants from the influence of air circulation in the plant factory.
Experiment 3:Effects of interlayer airflow on microclimate changes and plant growthThe ILCA system was employed to cultivate lettuce by using the optimal operational parameters obtained during Experiment 2. The water chillers in the ILCA system operated only during the photoperiod. The fans and centrifugal fan operated continuously to deliver airflow to the interlayer and for room temperature control,respectively. Based on the optimal operational parameters obtained from Experiment 2,the cooling pump ran 8 h d-1(half of the 16 h photoperiod).
A conventional environmental control (CEC) system with a traditional top inlet and side outlet air distribution mode served as the control (Fig.4),following the general practice in this field,providing each cultivation area with a horizontal air speed of 0.36-0.42 m s-120 cm above the cultivation boards. Its room air temperature was maintained at (24±0.5)°C during the light period and (22±0.5)°C during the dark period;RH was maintained at (60±10)% by using the humidification function of the air conditioner. The light environment and carbon dioxide concentration were identical to those used in the ILCA system,as described in Section 2.1. The air conditioner and centrifugal fan in the CEC system ran continuously.
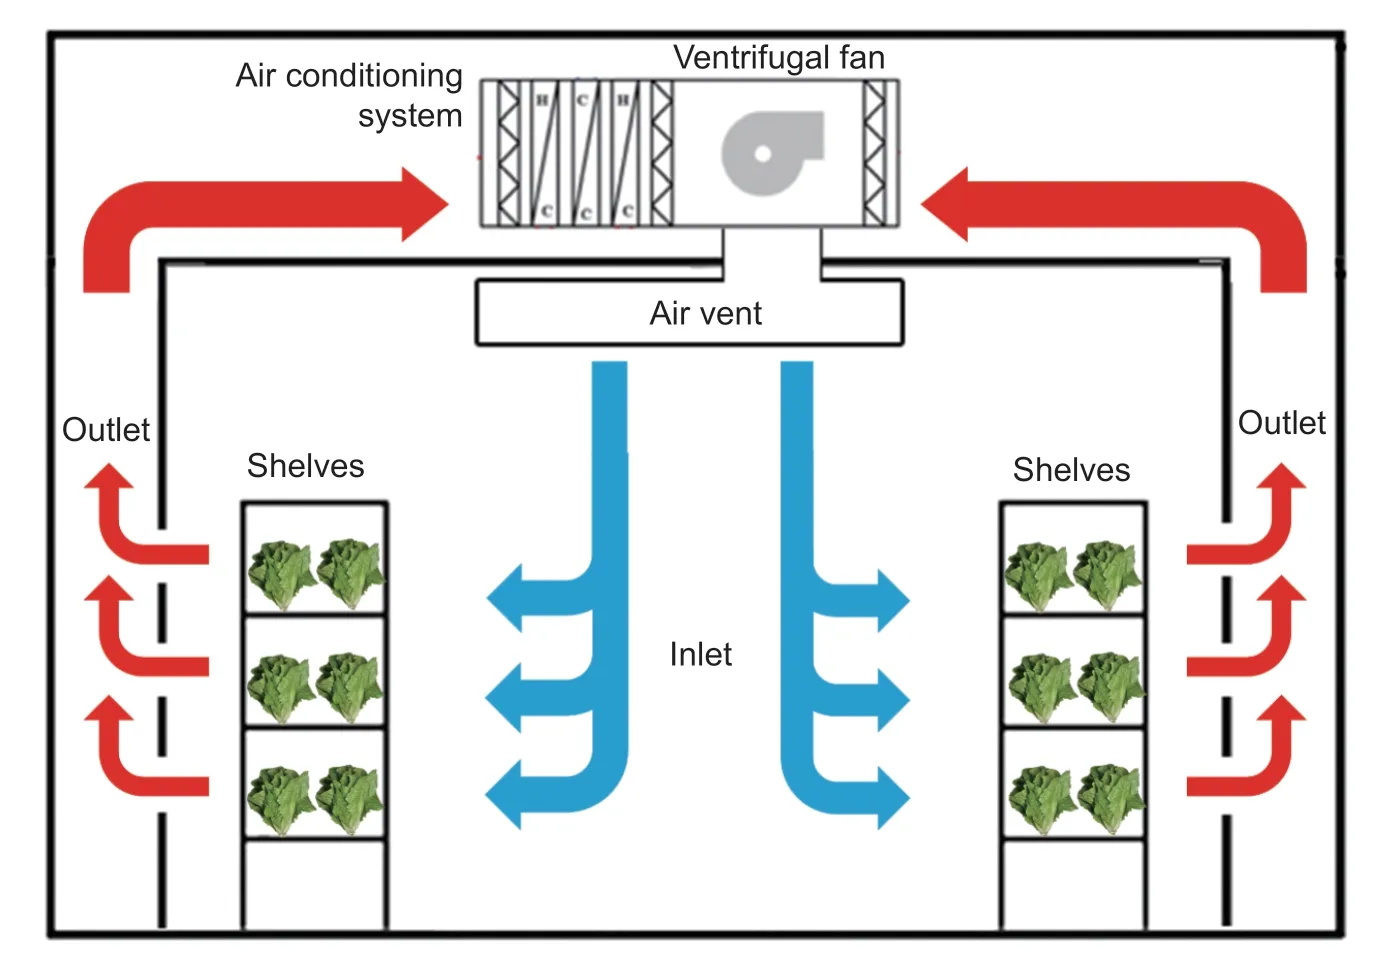
Fig.4 Schematic diagram of the conventional environment control (CEC) system. After passing through the air conditioning system,cooled inlet air was introduced into the plant factory through an air vent. After the air passed horizontally through each cultivation area,the air was returned to the air conditioning system.
Both systems were evaluated in the same plant factory during different periods:the CEC system from May 17,2018,to June 14,2018,and the ILCA system from Nov.1,2018,to Nov.29,2018. The performance of these two systems was not affected by seasons because the main cooling mechanism in CEC and ILCA (A/C system and water chillers,respectively) were in the open air and in the plant factory,respectively. The systems were working at similar temperatures.
Six cultivation areas were used to grow plants. Plant measurements represented the means of five plants from one area while avoiding plants at the edges of the cultivation areas. During the ILCA trial,each cultivation area was sheltered from room airflow by black plastic mounted vertically between growing areas.
After 29 days of growth,the experimental data and values predicted by the models were compared to determine the validity of the regression models. Plant microclimate and physiological characteristics of the shoots and roots were examined by following the methods described in the Section 2.3.and were compared with the results for plants from the CEC control system.
3.Results and discussion
3.1.Performance characteristics of the lLCA system
As shown in Table 3,the air velocity of 16 measurement points showed a high degree of uniformity at the same fan rotation speed. The average air velocity out of each vent hole unit across the various fan rotation speeds was 0.027-0.062 m s-1,showing significant differences. Therefore,the air distribution for plants located in different positions of the cultivation board was uniform and could be adjusted by changing the fan rotation speed.
In a previous study (Zhanget al.2016),air velocity was recommended to be controlled at 0.3-1.0 m s-1. This value refers to the air speed above the plant canopy unaffected by the boundary layer resistance,which is different from this study.
In comparison to the downward airflow technique (Goto and Takakura 1992;Shibataet al.1995;Frantzet al.2004),the airflow characteristic in this study was more complicated. The airflow pattern after flowing out of the vent holes requires further simulation and research.
The test was repeated six times by switching different fans of the same model,and the results showed all the fans used performed similarly at each rotation speed,which indicated that these experiments were not affected by individual differences among fans.
3.2.Optimum ILCA operational parameters
Analysis of variance in the quadratic regression modelTable 2 shows that 20 experiments were conducted. The zero point (experiments numbered 17 to 20) was repeated four times to estimate the error. The analysis of variance (ANOVA) for quadratic regression models (Table 4) indicated thatF-values were greater thanF0.05(14,5)=4.64 andP-values were less than 0.05,indicating that the models were significant. The lack of fitF-values was smaller thanF0.05(2,3)=9.55,andP-values were larger than 0.05,implying that the lack of fit was not significant relative to the error. Therefore,the models fit well with the experimental data. According to the ANOVA results presented in Table 5,the adequate precision (A.P.) amounts for all responses were higher than 4,which indicated an adequate signal and showed that the models could be used to navigate the design space. Coefficient of variance (C.V.) values less than 30 are indicative of reproducible models (Pryseleyet al.2010).
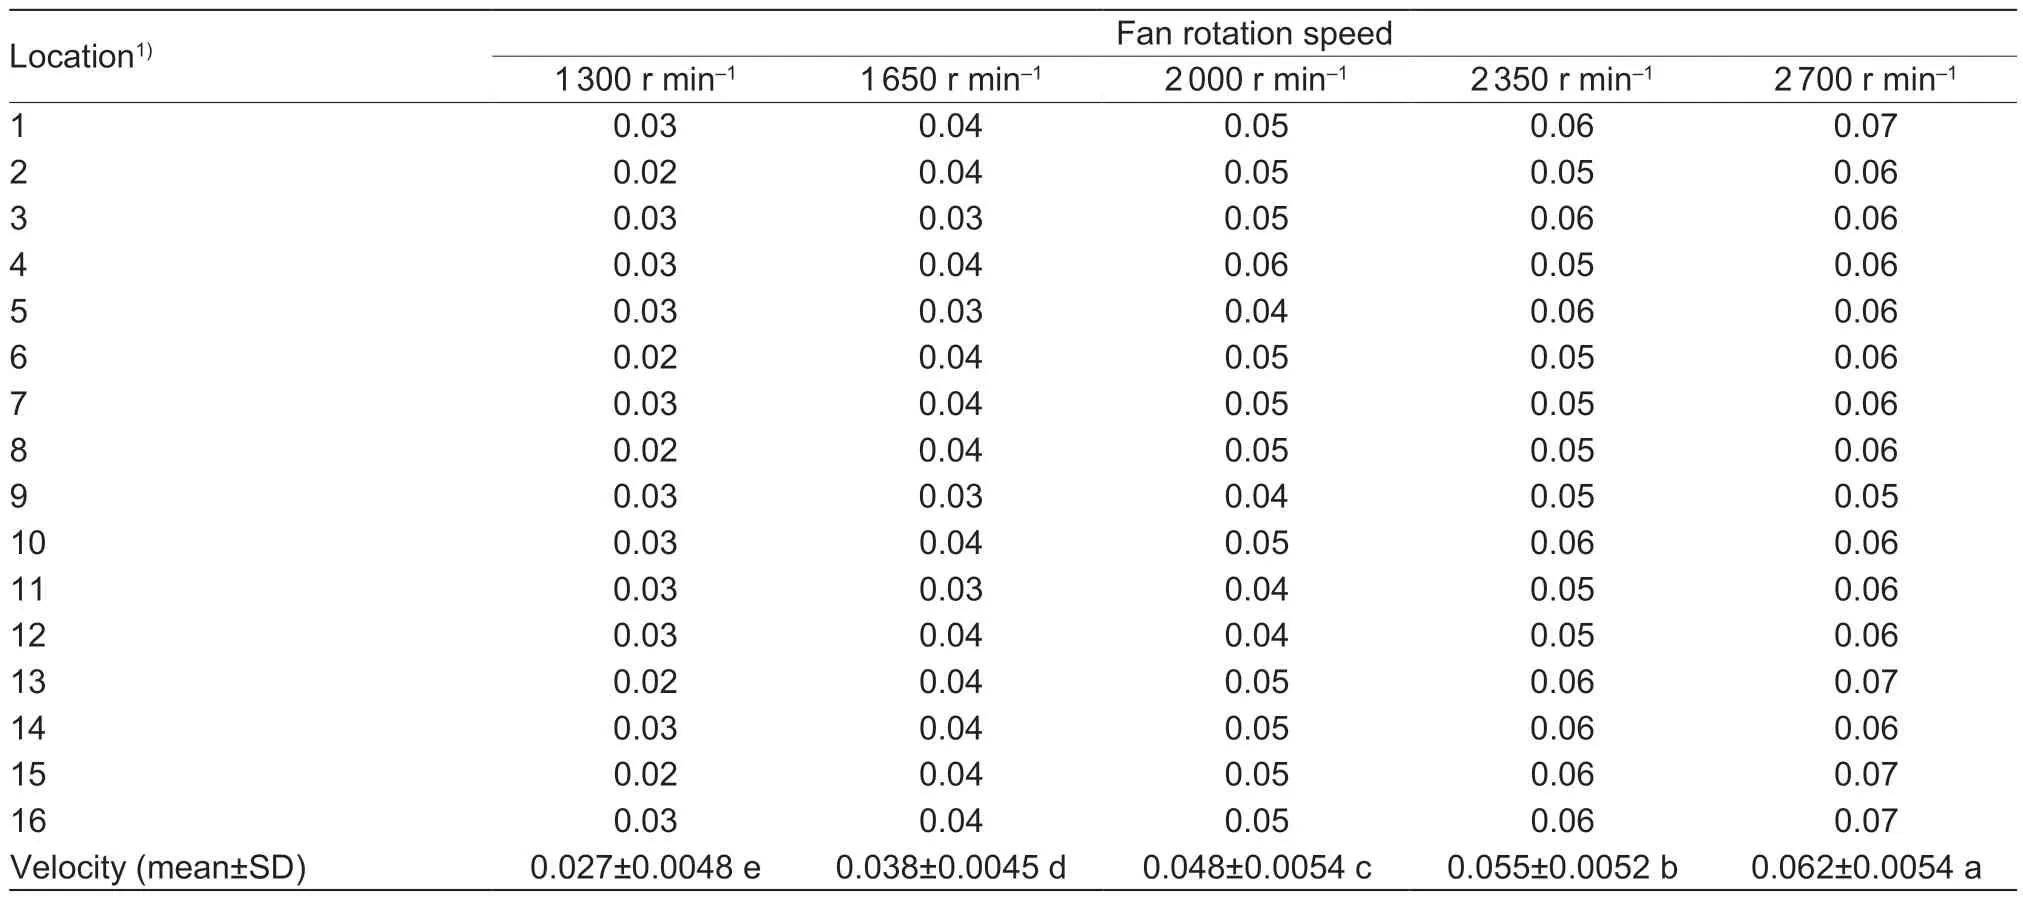
Table 3 Results of one of six air velocity (m s-1) measurement tests using five different fan rotation speed
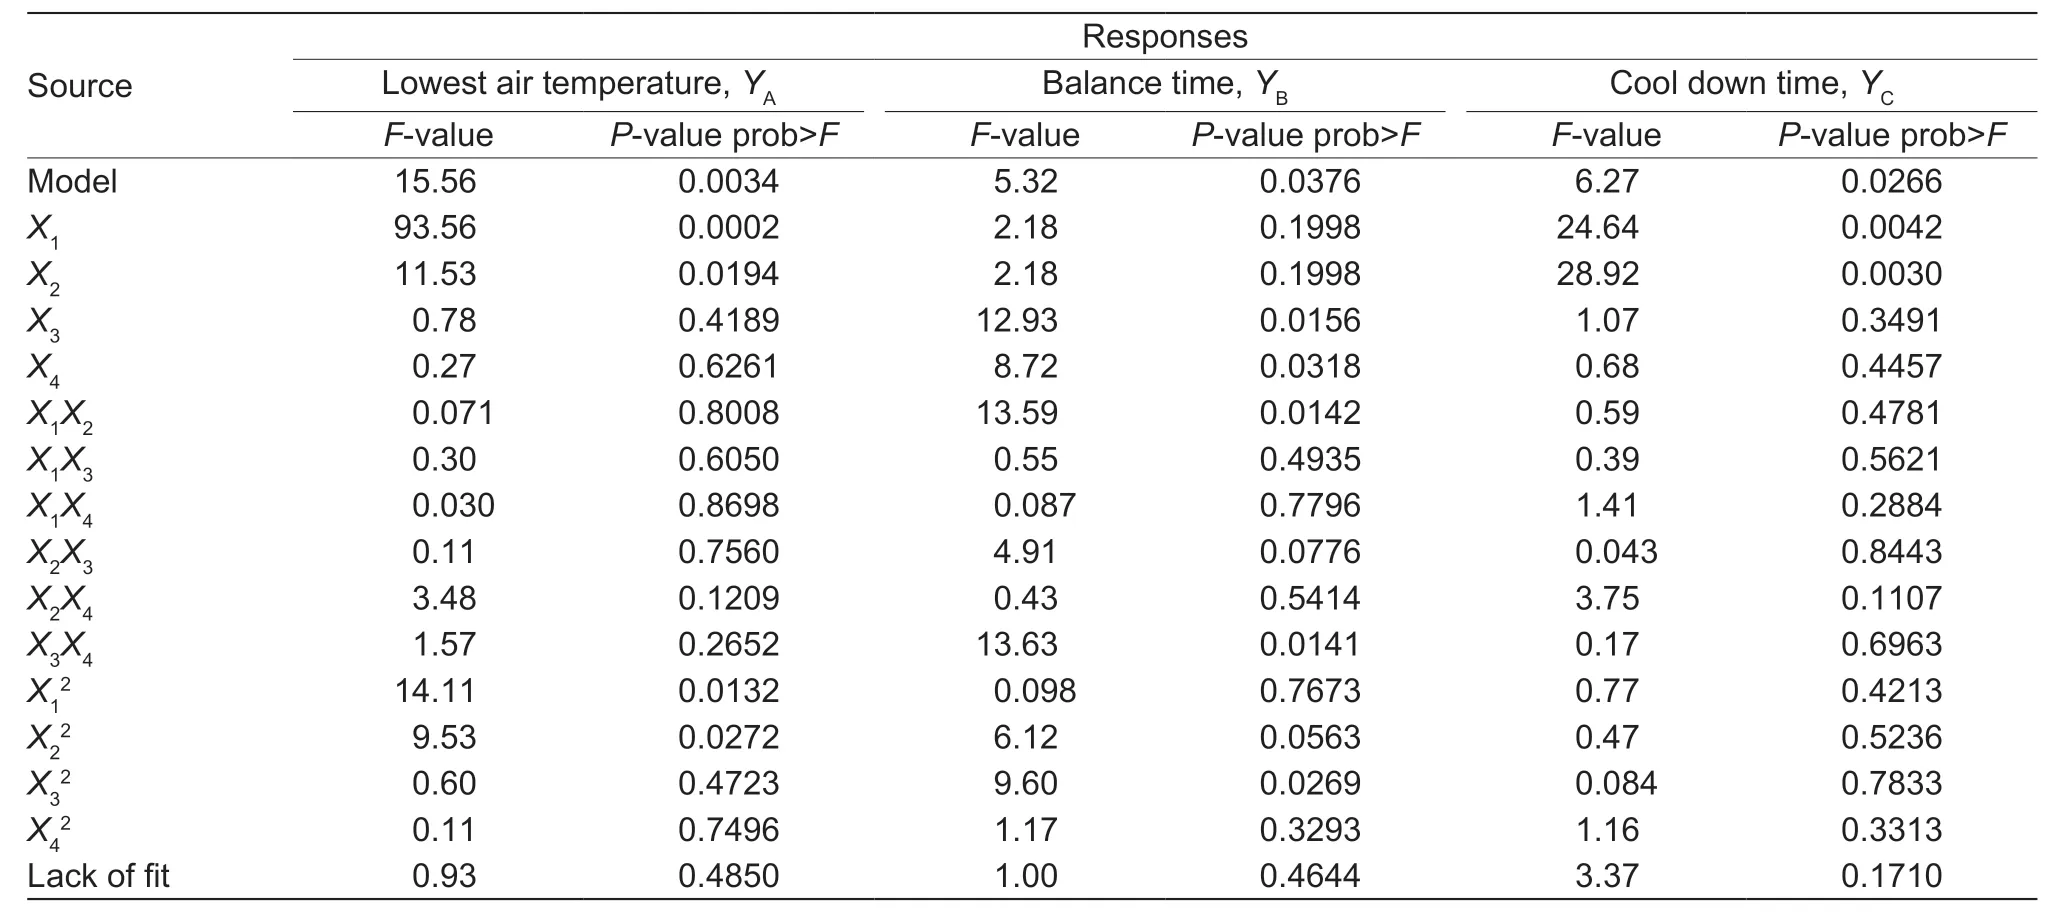
Table 4 F-values and P-values of model terms for the responses

Table 5 Analysis of variance of the responses1)
The regression equations for the lowest air temperature (YA),balance time (YB) and cool-down time (YC) at the 0.05 significance level are listed below (eqs.(1)-(3)):
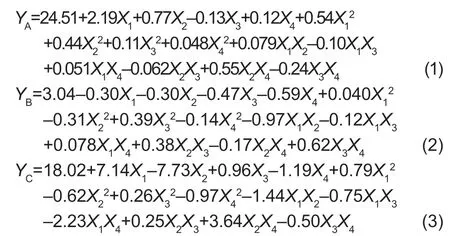
Analysis of key factorsTheP-values were used to check the significance of each factor. In Table 4,P<0.01 andP<0.05 indicate highly significant and significant differences,respectively. Factors withP>0.1 had little effect on response values and can be neglected. Therefore,regression eqs.(1)-(3) can be simplified as follows (eqs.(4)-(6)):

The coefficient of each equation showed that the effect order of the factors wasX1>X2,X4>X3>X2andX2>X1,respectively. In other words,room temperature had the greatest effect on the lowest air temperature,followed by cooling-water temperature. For balance time,the most important factor was the airflow rate,followed by the coolingwater flow rate and then the cooling-water temperature. The cooling-water temperature had a maximal influence on the cool-down time,followed by the room temperature.
8. Alone in the wood: Julius Heusher states that the woods represent the loss of security and previous values (Heuscher 1974).Return to place in story.
To analyze the separate impact of each individual factor on response values,all factors in regression eqs.(4)-(6) were fixed at a zero level successively,and single-factor effect equations were obtained (eqs.(7)-(13)):
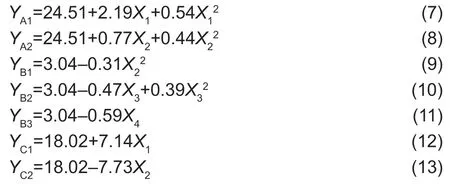
According to these equations,the curves of the response values to each key factor were obtained and are shown in Fig.5. From Fig.5-A,it can be seen that room temperature was the most important factor. As the room temperature changed,the lowest air temperature changed significantly. The effect of cooling-water temperature was not obvious,especially at the -1.68-0 level,and air temperature exhibited a relatively stable state and increased rapidly above level 0. As shown in Fig.5-B,with increasing cooling-water temperature,the balance time decreased rapidly after a gentle upward trend. In contrast,the balance time decreased first and then rose with an increasing coolingwater flow rate. The duration decreased linearly with increasing airflow rate. As shown in Fig.5-C,cool-down times were linear with respect to room temperature,and the cooling-water temperature increased and then decreased.
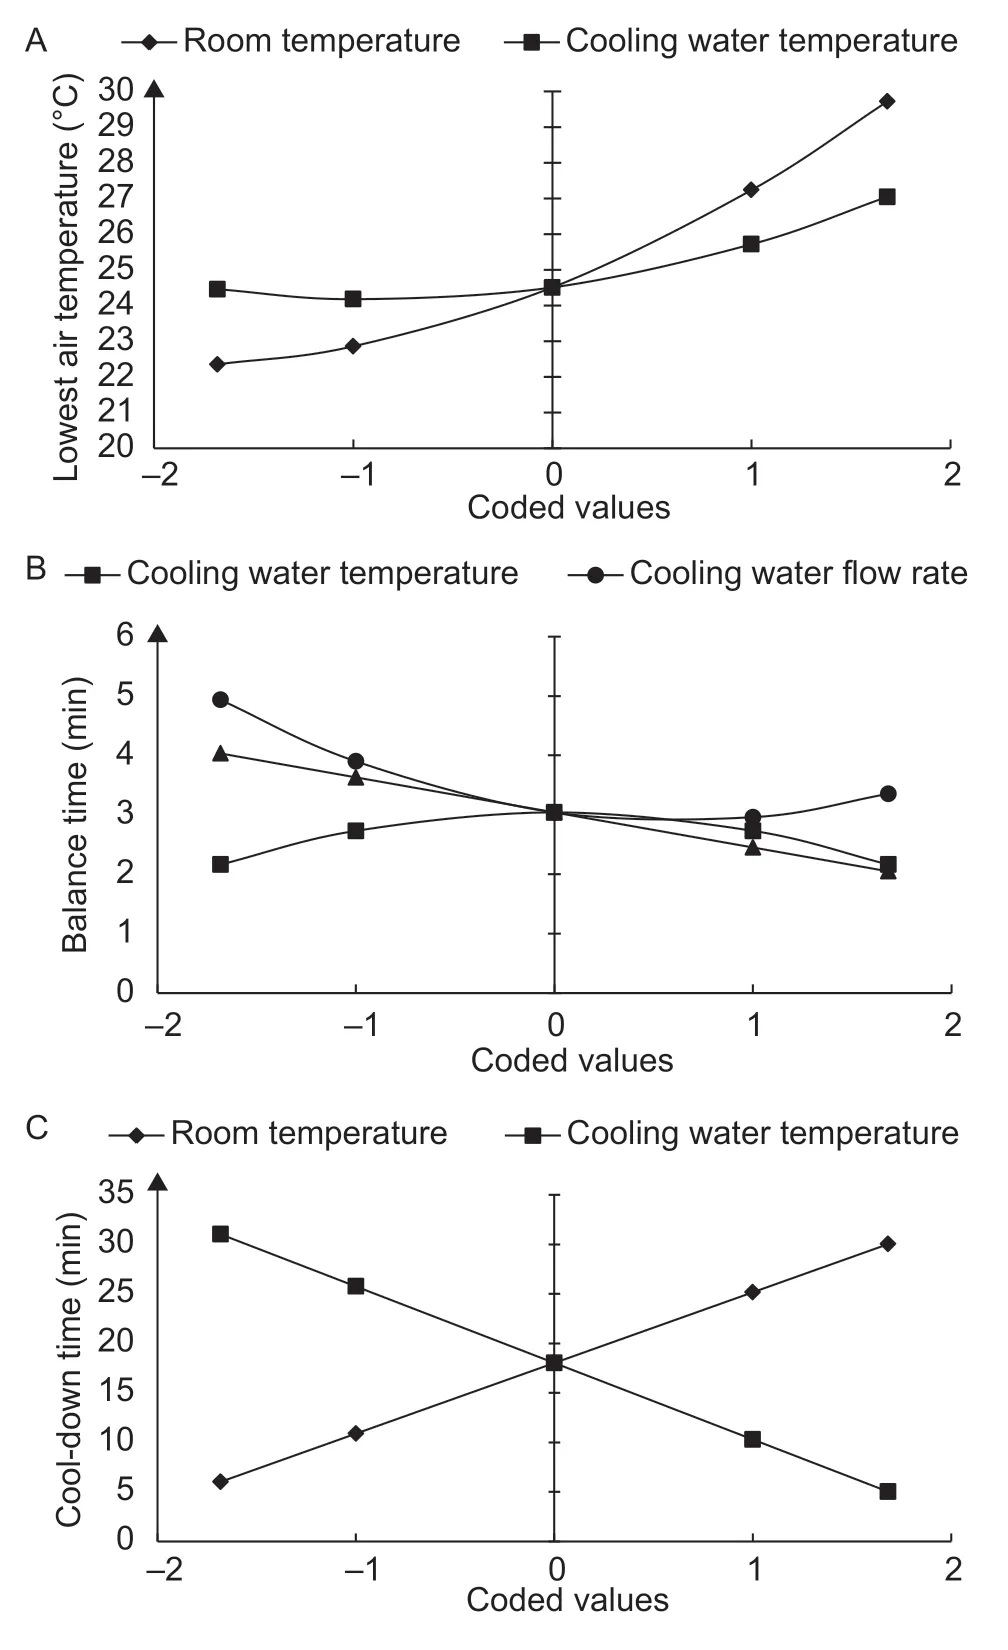
Fig.5 Effect of single key factors on the lowest air temperature (A),balance time (B) and cool-down time (C).
Optimization of ILCA operational parameterTo determine the optimum levels of these parameters,numerical optimization procedures were used. The scale of the desirability function ranged between 0 for a completely undesirable response and 1 for a fully desired response (Bezerraet al.2008). To obtain the optimized operational parameter,the desired goal for the cooling-water temperature was set to a maximum in the Design-Expert software,while the cooling-water flow rate and airflow rate were set to a minimum for energy conservation. The room temperature,balance time and cool-down time were set within the range of treatment variable levels. The lowest air temperature was targeted at 24°C to create a similar growth environment as in the control. The most important value was chosen for the cooling-water temperature and lowest air temperature. The second most important value was chosen for the cooling-water flow rate and airflow rate. In total,31 solutions were suggested by the software. As a result,the optimized operational parameters were found to be 28.2°C for air temperature,18.7°C for cooling-water temperature,0.63 L min-1for the cooling-water flow rate and 1.2 cm3s-1for the airflow rate. In this case,the lowest air temperature was 24.1°C,and the balance time and cool-down time were 4.8 and 5.0 min,respectively. The maximum desirability was 0.95,indicating that this design was suitable for use.
3.3.Effects of interlayer airflow on microclimate changes and plant growth
For model validation and performance comparison with CEC,the ILCA treatment was performed by following the optimum operational parameters with room air temperature of (28±0.5)°C during the light period,(26±0.5)°C during the dark period,and RH of (60±10)% by using the identical air conditioning system in the CEC. The cooling-water chillers operated only during the 16-h light period,and the target value was set at 18.5°C. The flow rate of each pathway of water was adjusted to 0.6 L min-1. Fans operated continuously at a rotation speed of 1 500 r min-1. Both the run time and off time of the cooling pump were 5 min throughout the growing period. As a result,the experimental response values were reasonably close to the predicted values. The lowest outlet air temperature at the vent hole during the light period was 24.6°C,and the percentage error from the predicted optimized lowest air temperature (24.1°C) was only 2.1%. The validity of the regression models was confirmed. These data suggested that the ILCA system could provide the lettuce with an appropriate temperature of 24°C,as set for the CEC system,as long as the room temperature in the plant factory was lower than 28.2°C.
Microclimate changes in the canopy and root zoneThe ILCA system had a measurable impact on the interlayer between the cultivation boards and nutrient solution surface. Its temperature during the light and dark periods dropped to 25.4 and 23.7°C,respectively,both of which were 2.5°C lower than room temperature (27.9 and 26.2°C,respectively). In contrast,the interlayer air temperature in the CEC system increased by 1.0 and 0.4°C to 24.4 and 22.2°C in the light and dark periods,respectively (Fig.6-A).The temperature decline in the ILCA system mainly resulted from the cooling capacity of the water chillers,supplemented by the evaporative cooling effect caused by airflow. The increasing temperature in the CEC system was due to the heat transfer from the light sources as well as the heat produced during root respiration. These conditions may have adverse effects on plant growth,root growth and proliferation (Benlloch-Gonzalezet al.2014) as well as disease resistance (Fukuoka and Enomoto 2001). The RH in both treatments increased dramatically compared with room values (Fig.6-C),and the RH in the ILCA system reached 87.5%,far above the set point value ((60±10)%). In the CEC system,RH was 100% during some periods. Although the airflow in the ILCA system accelerated the evaporation rate,it introduced dry room air,resulting in a relatively lower RH. Nevertheless,the small interlayer spaces in the CEC system were filled with water vapour in a short amount of time. Different from the 100% interlayer RH in the CEC,which was recognized as a preferred value for high growth rate (Kratky 2005),the RH reduction in the ILCA system might lead to an inhibition of new root growth because the RH value was below the threshold for crop plant growth (Taizet al.2014).This might have a negative influence on shoot growth. Supplementary humidification might be required to maintain a proper RH while adding water to nutrient solution to keep the availability. The variation in the interlayer CO2concentrations is presented in Fig.6-E. For the CEC system,the interlayer CO2concentrations were 2 498 and 1 465 μL L-1during the light and dark periods,respectively. For the ILCA system,the interlayer CO2concentration was stabilized at approximately 1 000 μL L-1,much lower than that in the CEC system. The high CO2concentration in the CEC system might be attributed to leaf and root dark respiration. In the ILCA system,nearly all released CO2was transferred upward into the canopy,resulting in a similar concentration as that in the air surrounding the plant shoots.
Inside the canopy,as shown in Fig.6-B,the air temperature of the ILCA system during the light and dark periods sharply decreased to 26.8 and 24.1°C,respectively,which were 1.1 and 2.1°C lower than the surrounding air temperature during the respective light and dark periods (27.9 and 26.2°C,respectively). In contrast,obvious increases occurred in the CEC system. The temperatures inside the canopy were 27.1 and 22.5°C during the light and dark periods,respectively,which were increased by 3.5 and 0.8°C compared with the surrounding air temperature (23.6 and 21.7°C,respectively). The temperature of the ILCA system during the light period was almost the same as that of the CEC system,while it was 1.6°C higher than that of the CEC system during the dark period. These results showed that the ILCA system could achieve similar refrigeration effects in the absence of a conventional air conditioning system under higher room temperature. In addition,there were significant differences between the canopy temperature and surrounding air temperature in the CEC system,illustrating the relatively lower accuracy and efficiency of taking room air parameters as the reference for plant microclimate regulation. This inaccuracy was due to the heat generated by artificial lighting (Kozai 2013b;Yoonet al.2015) and plant metabolism,which emits 20 mW g-1dry weight energy to the surroundings at 22°C (Hansenet al.1998),as well as by boundary layer resistance (Kimet al.1996;Langre 2008) and plant interference with horizontal airflow (Nishikawaet al.2013). The ILCA system internal canopy dark period temperature showed an obvious increase. This effect was due to the water chillers being shut off during the dark period,resulting in a 4.5°C increase in room temperature,which could lead to negative effects on plant growth. Due to the effect of evaporative cooling promoted by the fan,the temperature rise was effectively controlled. With a target room RH of (60±10)%,the ILCA system RH increased to 83.9 and 76.6% during the light and dark periods (Fig.6-D),respectively,which were 23.3 and 18.7% higher than the RH of the surrounding air during the light and dark periods,respectively. No obvious RH changes were observed in the CEC system. The increased water evaporation promoted by the higher airflow rate in the ILCA system resulted in a higher RH in the internal canopy due to the air movement. This might have negative effects on plant growth and disease prevention. Fortunately,the plants did not show disease symptoms in this study. This may be because the enhanced airflow provided more oxygen to the internal canopy. Thus,increasing the airflow rate around the canopy and ventilation rate of the environment may decrease the RH.
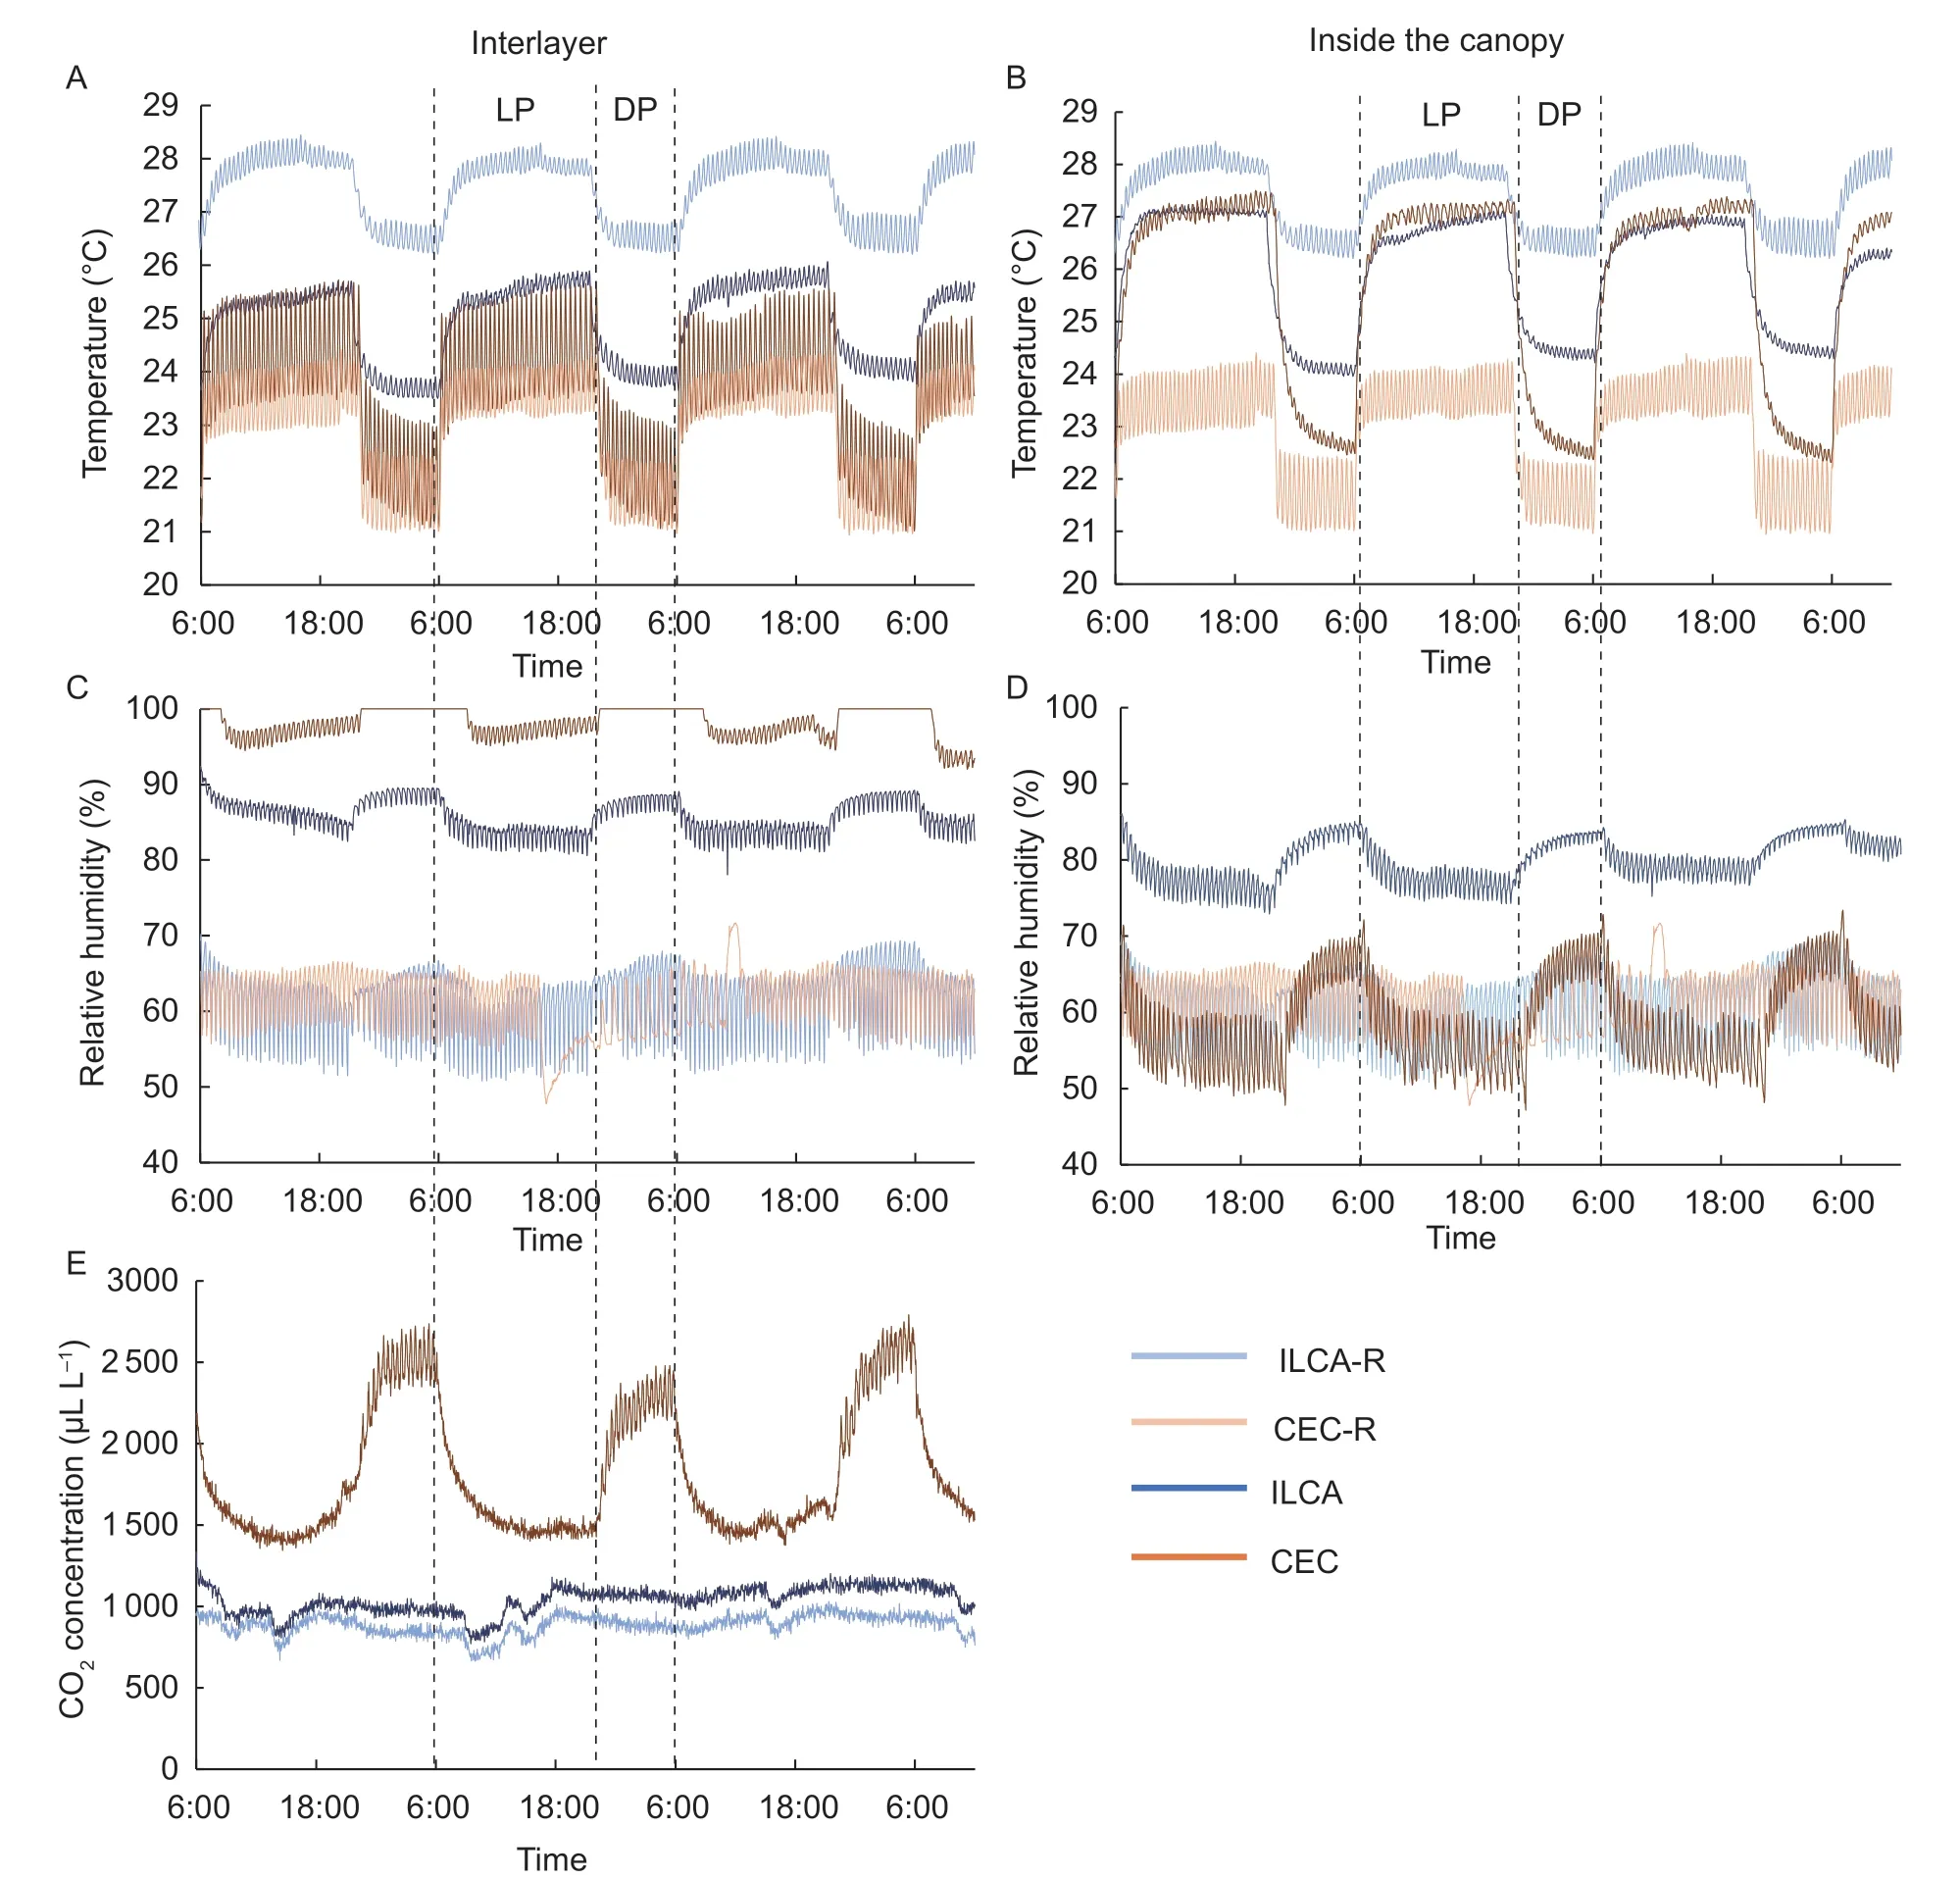
Fig.6 Temperature,relative humidity in the interlayer (A and C) and inside the canopy (B and D),and CO2 concentration in the interlayer (E). The interlayer cool airflow (ILCA) and the room air data of interlayer cool airflow (ILCA-R) we used were from Nov.15,2018,to Nov.18,2018. The conventional environment control (CEC) and room air data of conventional environment control (CEC-R) we used were from May 31,2018,to June 3,2018. LP and DP represent light period and dark period,respectively.
The ILCA system had a strong impact on the nutrient solution. As shown in Fig.7-A,its temperature could be kept at approximately 21.6°C. In comparison,the nutrient solution temperature in the CEC system was 23.8 and 22°C during the light and dark periods,respectively. This difference might be related to the reported CO2accumulation in the CEC system (Gent and Enoch 1983). At the same time,there were fluctuations associated with light-dark cycling,indicating that heat transfer from the light sources and room conditions played a major role in changes in nutrient solution temperature. Despite the absorption of heat from light sources and room conditions,the ILCA system maintained a low nutrient solution temperature.This difference could be due to the increased evaporative cooling effect induced by an increased airflow rate,which removed more heat than what it absorbed. It is noteworthy that in order to have a complete control of nutrient solution temperature,a dedicated solution cooling approach or system was required.
As shown in Fig.7-B,both treatments showed a downward trend in the dissolved oxygen (DO) value. In the ILCA system,the number declined steadily from 5.8 to 5.4 mg L-1in 3 d. In contrast,the DO concentration in the CEC system dropped more rapidly from 5.4 to 4.8 mg L-1in 3 d and was consistently lower than that in the ILCA system. Other researchers reported a 20-30% decrease in water uptake with decreasing DO concentration in tomato (Morardet al.2000). Fluctuations in the DO concentration could also be observed in the CEC system;the differences in values varied from 2.1 to 1.3 mg L-1with the switch from light to dark periods.
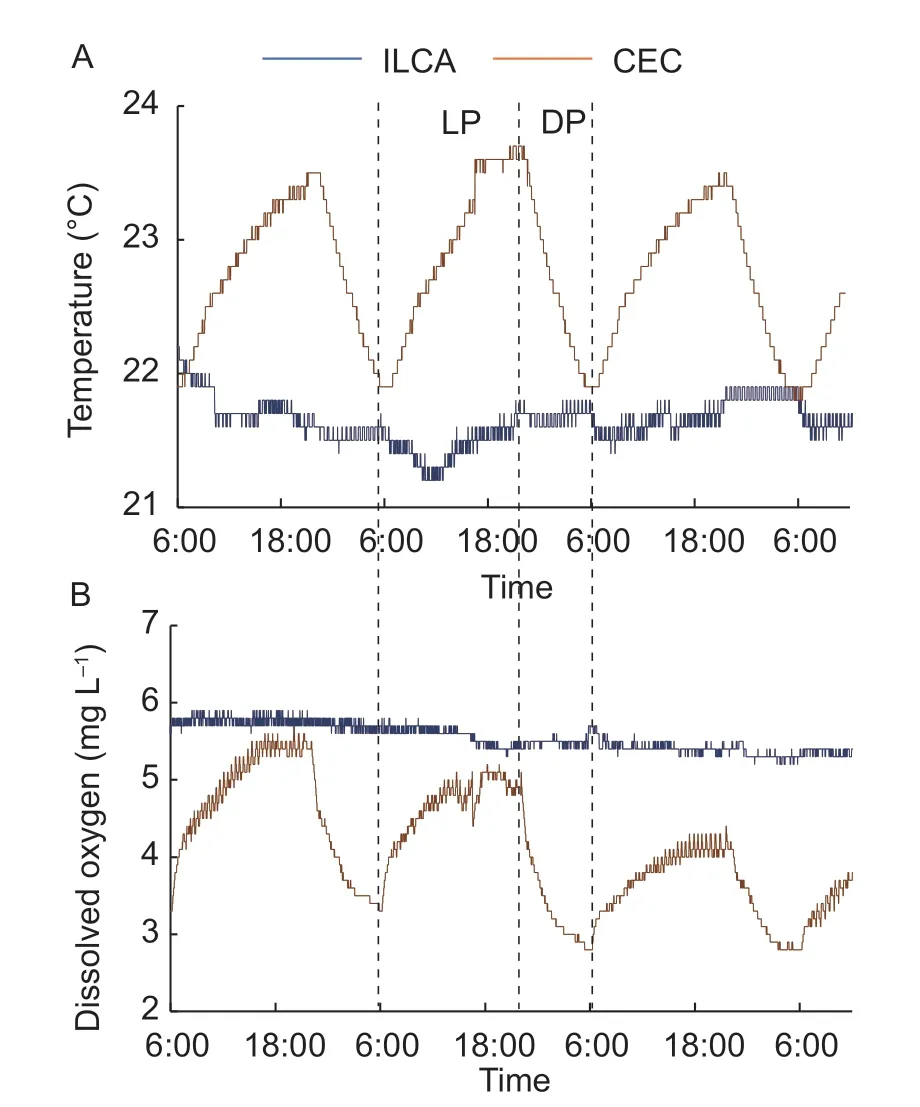
Fig.7 Nutrient solution temperature (A) and dissolved oxygen concentration (B) of the interlayer cool airflow (ILCA) system and conventional environment control (CEC) system. The ILCA data we used were from Nov.15,2018,to Nov.18,2018. CEC data were from May 31,2018,to June 3,2018. LP and DP represent light period and dark period,respectively.
The lower decline rate for the DO concentration in the ILCA system may be due to an increased oxygen solubility (0.028 mL g-1in CEC and 0.030 mL g-1in ILCA) associated with a lower nutrient solution temperature (Dean 1998). In addition,there was a positive pressure of 2 mm H2O in the interlayer,which increased the dissolution of oxygen into the nutrient solution based on Henry’s law,which states that at a constant temperature,the amount of a given gas that dissolves in a given type and volume of liquid is directly proportional to the partial pressure of that gas in equilibrium with the liquid. Ehretet al.(2010) reported that DO values sharply decreased by (20-67)% when a nutrient solution was transported from a storage tank to a cultivation area through pipes. The ILCA system greatly improved the effectiveness of oxygen enrichment by creating an environment suitable for oxygen dissolution into the nutrient solution. Nevertheless,the ILCA system could not achieve similar DO enrichment effects as conventional oxygenation technology and could only alleviate its downward trend. Continuous air bubbling or other aeration methods were still needed to ensure proper DO concentrations. The reason for the DO concentration fluctuations in the CEC system needs further study.
With respect to the root morphological parameters (Table 7),the root length,root surface area,root projected area,root volume and root average diameter in the ILCA system were 39.1,38.2,37.9,48.1 and 12.1% lower,respectively,than in the CEC system (Fig.8). However,there was no difference in the number of root tips and root forks. These results demonstrated root activity enhancement by introducing airflow into the root zone by the ILCA system. More specifically,the lower nutrient solution temperature and the 2-mm H2O positive pressure in the interlayer resulted in a higher dissolved oxygen concentration in the nutrient solution,which could have positive effects on root development. This condition might be more favourable for the roots because the plants did not need to invest more energy in root production,improving growers’ nutrient solution use efficiency.
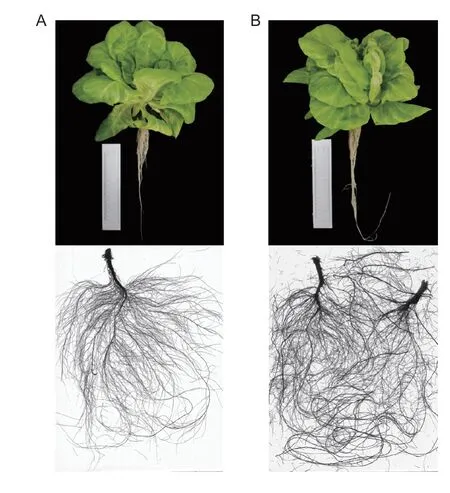
Fig.8 Shoot and root growth of lettuce in interlayer cool airflow (ILCA) system (A) and conventional environment control (CEC) system (B). For better scan accuracy,the single root in CEC was cutting along the longitudinal direction to spread the roots evenly.

Table 6 Physiological parameters of lettuce grown with the interlayer cool airflow (ILCA) system and the conventional environment control (CEC) system
The air flow parameters of the interlayer and ventilation holes outlet were unlikely to be affected by plant sizes,however,the airflow after blowing out from the ventilation holes would be affected by plant canopy structure and physiological activity. The interaction between airflow pattern and the canopy characteristics is extremely complicated.Some researchers have conducted experiments (Zhanget al.2019),but much more studies are needed.
3.4.Energy consumption analysis
For the experiments in this study,the conventional air conditioning in the ILCA system could be replaced by introducing outside air into the plant factory because the average air temperature in most areas of the world reported by climate forecast system reanalysis (CFSR) is lower than the room temperature used in the experiments (28.2°C). Therefore,the energy consumption for air conditioning in the ILCA system was not counted.
The energy consumption for the electrical equipment including water chillers,cooling pump,fans and centrifugal fans used for each treatment is shown in Table 8.
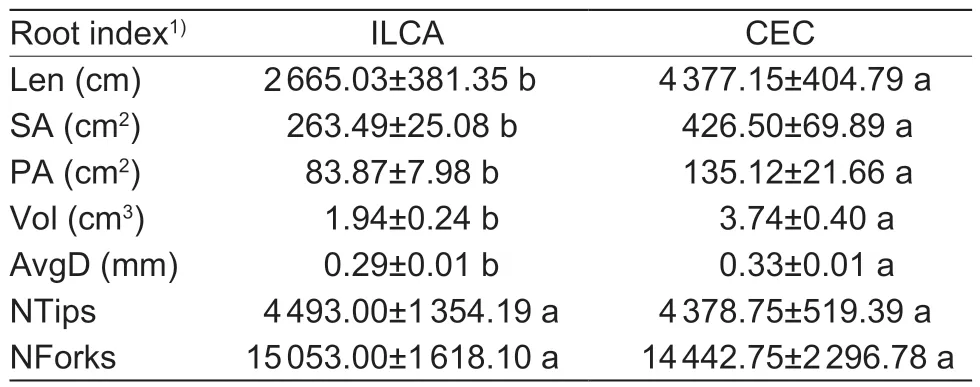
Table 7 Root index for lettuce growing in the interlayer cool airflow (ILCA) system and the conventional environment control (CEC) system

Table 8 Composition and comparation of energy consumption for interlayer cool airflow (ILCA) system and conventional environment control (CEC) system
For the CEC system,a high amount of electricity was consumed by cooling and venting to maintain the desired environmental conditions as described in the Materials and Methods section. The electricity consumption was metered at the beginning and end of the experiment. The results showed that 533.6 and 94 kWh of electricity were consumed over the 29-d growth period by the air conditioner and centrifugal fan,respectively. The total energy consumption was 627.6 kWh.
For the ILCA system,the water chillers consumed the most electricity,followed by the centrifugal fan. Since the optimized airflow rate was not high,each fan used to provide the airflow to the interlayer consumed only 0.67 W. The cooling pump ran for only half of the photoperiod. Under such circumstances,all equipment consumed 294.4 kWh over the 29-d growth period,achieving 50.8% electricity savings compared with the CEC system.
The EBCE values for the ILCA and CEC systems were 70.36 and 36.45 g kWh-1,respectively. The advantages of the ILCA system in energy savings came from the more accurate distribution of cooling air and more efficient electricity consumption. In contrast to the CEC system,cooling air in the ILCA system was delivered only to the plant growing area. In addition,the evaporative cooling effect of the nutrient solution was fully utilized in the ILCA system.
For areas with high air temperatures,water temperature in tank should be lowered to maintain a proper plant growth temperature;as a result,energy usage of the water chiller will rise. A drawback for the ILCA system is the CO2leakage along with the outside air introduction. This issue might be solved by using a heat exchanger to induce cold energy without air circulation. Besides,a proper ventilation-water cooling pattern is needed to balance the CO2supplemental and ventilation accurately. Moreover,economic efficiency between lower energy consumption and higher yields needs to be evaluated.
4.Conclusion
Using a conventional air conditioning system,the canopy temperature was 3.5 and 0.8°C higher than the surroundingair temperature during the light and dark periods,respectively. Therefore,the room conditions cannot be accurately or efficiently used as a reference for regulating the plant microenvironment. An optimized ILCA system can achieve similar cooling effects as a conventional air conditioning system under a room temperature as high as 28.2°C. Combined with external circulation from outdoor air and light/dark period adjustment,the ILCA system could replace traditional ventilation modes and achieve electricity savings of 50.8%. With respect to plant growth,the ILCA system significantly decreased root growth by 41.7% without a significant negative influence on shoot fresh weight.
There were limitations of the ILCA system. It resulted in a lower RH at the shoot-root interface and may lead to a 5.1% decrease in yield,which must be considered by growers. The improvement in the DO concentration in the nutrient solution with the ILCA system was also limited,and conventional aeration methods were required.
Acknowledgements
We thank Associate Prof.Wu Guodong and Wei Qiang for providing assistance with developing the system. This work was supported by the National Natural Science Foundation of China (31701969);the Key Projects of Ningxia Key R&D Program Fund,China (2018BBF02012) and the Science and Technology Program of Shaanxi Province,China (2017ZDXM-NY-057).
杂志排行
Journal of Integrative Agriculture的其它文章
- lmpacts of climate change on drought risk of winter wheat in the North China Plain
- Triple bottom-line consideration of sustainable plant disease management:From economic,sociological and ecological perspectives
- A rice geranylgeranyl reductase is essential for chloroplast development
- Rapid determination of leaf water content for monitoring waterlogging in winter wheat based on hyperspectral parameters
- Does nitrogen application rate affect the moisture content of corn grains?
- Effects of drought stress on root morphology and spatial distribution of soybean and adzuki bean
