Simulation Study on the New Average Heat Flux Method to Determine U-Value of a Wall
2021-10-20CAOJieling曹洁玲YANGJiankun杨建坤YUHaigang于海钢LIUYunZOUYue
CAO Jieling(曹洁玲), YANG Jiankun(杨建坤), YU Haigang(于海钢), LIU Yun(刘 赟), ZOU Yue(邹 钺)*
1 College of Environmental Science and Engineering, Donghua University, Shanghai 201620, China 2 Guangzhou Institute of Building Science Co., Ltd., Guangzhou 510440, China 3 Dianwei Science Co., Ltd., Shanghai 201620, China
Abstract: The U-value is a very important parameter for evaluating the energy efficiency when refurbishing the existing buildings. Traditional in-situ test methods to determine the U-value usually require a very long time to filter weather fluctuations and other boundary condition influences. In this paper, the possibility of a new method to reduce the time necessitated for measuring the accurate U-value of a wall is tested. The proposed method recommends measuring the temperatures and heat flux on both sides of the wall and thereby utilising the average values of the internal and external heat flux to calculate the U-value. Under the idealised sinusoidal internal and external air temperature boundary conditions, four walls with different U-values were simulated according to the admittance procedure (AP). Results show that the proposed method could improve the maximum error level for most of the walls in consideration. It was not sensitive to the measurement start time and it was more stable even in less controlled boundary conditions involving large inner temperature variations or out of phase temperature waves. Besides, the error of the average heat flux method (within 10%) could be estimated earlier than that of traditional method.
Key words: building envelope; U-value; in-situ; admittance procedure (AP); heat flux
Introduction
The values of the thermal transmittance of building envelope elements are important to the owner or designer of a building, to evaluate the building’s energy efficiency[1-2]. These building material properties can be determined accurately under laboratory conditions such as steady-state and one-dimensional heat transfer, without considering convection and radiation. However, inequalities in material quality or workmanship may cause actual building components to not attain the required design performance[3]. Asdrubalietal.[3]investigated six bio-architecture buildings in central Italy and found that the difference between thein-situthermal transmittance measurements and the theoretically calculatedU-values was approximately -15% to +43%. Lu[4]conducted measurements on a typical Swedish wooden house and the measuredU-values for all the four walls were 20% lower than the theoretically calculated ones. It follows that if the thermal performance of a building needs to be precisely defined, field measurements must be carried out.
Such field measurements are usually carried out using one heat flow meter measuring the perpendicular heat flux through the internal wall and two thermocouples measuring the internal and external wall surface temperatures respectively, which is the heat flow meter method[5]. On-siteU-values are then calculated by the Average Method[5], using the ratio of the mean heat flux through the internal side of the wall to the mean temperature difference over a long period. The accuracy of this calculation is strongly dependent on the history of the measurement data across the wall elements. To obtain reliable results, ISO 9869[5]and other national standards[6-7]recommend that the test should be carried out in accordance with the following conditions.
(1)The temperature difference between the two sides of the wall should always be over 10 K, and a relatively stable temperature is required on one side for rapid convergence. Therefore, measurements are always implemented during heating season. However, these requirements could be difficult to satisfy for tests conducted in subtropical regions such as Miami or Bangkok.
(2)The measurement period must be long enough for thermal mass storage effects to have negligible influence on the results. Therefore, ideally, the test period should not be less than 4 d. During test period, the weather conditions should be such that there is no rain, no direct sun radiation on the test location, and no wind gusts, to avoid any unexpected fluctuations in measurement data.
In-situU-value measurement using the heat flow meter method depends on very long test duration (more than one month)[8-9]. Gasparetal.[10]evaluated the minimum test duration with heat flow meter method. Their findings indicate that the test duration could be reduced by applying the criteria of data quality and variability of results. Moreover, as described in ISO 9869[5], the test duration could be greatly reduced if temperature on both sides of wall is stable. Low temperature differences between two sides of wall significantly prolong the measurement duration and decrease the accuracy of the measurement. Desogusetal.[11-12]concluded that when the temperature difference is large enough, the measured wall thermal resistance could converge faster, leading to short test duration. Tejedoretal.[13]assessed how test conditions and thermophysical properties influence the accuracy ofin-situmeasurements using the internal infrared thermography. Their results reveal that the recommended temperature difference between indoor and outdoor is 7-16 ℃ and the deviations could be controlled within 0.2%. Mengetal.[14]proposed a simple hot box-heat flow meter method, creating a local heating area in order to maintain stable and large enough temperature difference. However, there have been few studies to shorten test duration from the perspective of data processing methods.
According to ISO 9869[5], theU-value is usually calculated by the average method. Compared with the heat flux through the external side of the wall, the heat flux through the internal side of the wall should be much more stable for rapid convergence. Therefore, only the heat flux though the internal side of the wall is considered inU-value calculations. However, a study based on field measurement data made by Yu[15], suggested that using the average values of the internal and external side heat flux might decrease the necessary measurement time and significantly improve the accuracy of wallU-value estimation.
The purpose of this paper was to attempt the evaluation of this hypothesis by simulating several representative test walls under idealized environmental conditions. The focus was on the errors associated with the interaction of the thermal mass in the walls and the fluctuating heat flux through both sides of the wall.
1 Theory
Long-period measurements are required in field tests to filter the transient effects caused by the wall thermal masses, fluctuating surface temperatures and heat fluxes in real conditions. Unfortunately, it is not possible to find a general expression for widely varied weather conditions. However, a general trend by simplified weather condition in the form of period function such as pure sinusoids can be demonstrated. To simulate the thermal response of the building opaque elements under sinusoidal temperature conditions, the admittance procedure (AP) is a suitable tool, suggested by EN ISO 13786:2017[16]. This methodology was developed by Refs. [17-19] more details can also be found in CIBSE[20].
For a homogeneous isotropic opaque wall with thicknessdand thermal conductivity independent of temperature, the one-dimensional heat transfer can be simplified as
(1)
wherecis specific heat (J/(kg·K));ρis mass density (kg/m3);λis thermal conductivity (W/(m·K ));Tis temperature (K);tis time (s).
The temperature at distancexwithin the slab measured from the surface, and the temperature at timetwill be noted asT(x,t). The temperature within the slab is given by
(2)
wherePis periodic time;Tsis the amplitude variations. The quantity exp(ju) denotes a vector of unit length making an angle ofuradians with the horizontal. When it is included in expressing a physically significant quantity, by convention it is the projection of the vector on the horizontal cos(u) that is the observable quantity. exp(ju) is the periodic inu:exp(j(u+π))=-exp(ju) and exp(j(u+2π))=exp(ju). In the present case, the variation of surface temperature can be written asTsexp(j2πt/P). The surface temperature has the valueTs, 0 and -Ts, whentis 0,P/4,P/2, 3P/4 andP,etc.
Under sinusoidal temperature variations, the temperature and energy solution can be written in the form of the following complex number matrix[20]:
(3)
where
M1=cosh(p+jp),
(4)
(5)
M3=sinh(p+jp)·a,
(6)

Under a steady periodic condition with angular frequencyω,pcan be written as
(7)
whereωis angular frequency (rad/s).
For a multi-layer wall, this solution can be extended by multiplying the matrices of all corresponding layers, beginning from the innermost layer to the outermost layer, shown as
(8)
For a defined surface resistance between the wall and atmospheric air, or an air gap inside the wall, a purely resistive layer can be added whose matrix coefficients are independent of frequency:
M1=1,
(9)
M2=-Rsor-Ra,
(10)
M3=0,
(11)
whereRsis surface thermal resistance (m2·K/W);Rais thermal resistance of air space (m2·K/W).
Equation (3) can be rewritten to define the heat flux through both sides of the wall as a function of the indoor and outdoor temperature fluctuations:

(12)
Yw(ω)Tin-Yout(ω)Tout,
(13)
whereYin(ω) is inside thermal admittance (W/ m2·K);Yout(ω) is outside thermal admittance (W/ m2·K);Yw(ω) is periodic thermal admittance (W/ m2·K).
The study defined in this paper was focused on the possible advantages of using the average values of the indoor and outdoor heat flux to estimate theU-value:
(14)
whereQinis indoor surface heat flux (W/m2);Qoutis outdoor surface heat flux (W/m2);Qavgis average value of the indoor and outdoor surface heat flux (W/m2);ΔTis indoor and outdoor temperature difference (K).
Thermal admittance,Yin/Youtand periodic thermal transmittance,Ywin Eq. (12)- (14) are parameters dependent only on the thermal properties of the wall elements and the periodic boundary condition frequency. Details of the calculation method are presented in ISO 13786[16]. Based on the ISO 13786 methodology, the Concrete Centre (TCC) in the UK developed a free spreadsheet calculator. All the relevant dynamic thermal properties of the simulation wall specified in this paper were determined by this TCC tool.
According to ISO 9869[5], the average method can be used to calculate theU-value of the wall being simulated by integrating sufficient history of the temperature differences:
(15)
whereU*is the estimated thermal transmittance (W/m2·K).
In Eq. (15),Q(t) could beQin,Qout, orQavg;ΔT(t) could be the temperature difference between indoor and outdoor air or internal and external wall surfaces. Although the process of integral path could be different for these five variations, under periodic boundary conditions, the integral over one integral, or an infinite number of cycles should eliminate all the effects of fluctuations and provide the sameU-value estimation.
The AP is based on the assumption of stable sinusoidal boundary temperatures being true. The temperature settings for our simulations were as follows.
(1)The 24-h circle was chosen as the outdoor dry-bulb temperature sine-wave circle, and the default amplitude,ΔToutwas set at 5.56 ℃. CIBSE[20]also recommends the use of a 24-h circle as the diurnal temperature circle.
(2)The 24-h circle was also chosen as the indoor dry-bulb temperature sine-wave circle and the default amplitude,ΔTinwas set at 1.11 ℃. Moderaetal.[21]applied a one-hour circle as the indoor temperature circle to simulate furnace cycling. Beccalietal.[22]investigated the single thermal zone with balance method and proposed a 24-h circle as the indoor circle. However, ISO 13786[16]only provides the direct calculation methods with the same period for the outdoor and indoor temperature variations.
(3)A phase difference could exist between the indoor and outdoor temperature sine waves. The statistical data in CIBSE[20]showed that the highest value of the outdoor dry-bulb air temperature occurred around 2 p.m., and the calculation data in Beccalietal.[22]demonstrated that the highest value of the inner air temperature took place around 7 p.m.
(4)The default value of the average indoor-outdoor air temperature difference,ΔTwas 22.2 ℃, and the indoor air temperatures were always higher than the outdoor ones.
Under these assumptions, the temperatures can be described as
Tin(t)=Tin*+ΔTinsin(ωt),
(16)
Tout(t)=Tout*+ΔToutsin(ω(t-Δt)),
(17)
whereTin*is average of inside temperature during one period (K);Tout*is average of outside temperature during one period (K);ΔTinis amplitude of periodic fluctuation of indoor temperature (K);ΔToutis amplitude of periodic fluctuation of outdoor temperature (K);Δtis time lag corresponding to the phase difference between the outdoor and indoor air (s).
Upon substituting Eqs. (16)- (17) into Eqs. (12)- (14), the three heat flux can be expressed as
Qin(t)=U0ΔT+|Yin(ω)|ΔTinsin(ωt+γin)-
|Yw(ω)|ΔToutsin(ω(t-Δt)+γw),
(18)
Qout(t)=U0ΔT+|Yw(ω)|ΔTinsin(ωt+γw)-
|Yout(ω)|ΔToutsin(ω(t-Δt)+γout),
(19)
(20)
whereU0is theoretical thermal transmittance (W/m2·K);γinis the phase angle ofYin;γoutis the phase angle ofYout;γwis phase angle ofYw.
Considering that the temperature differences in Eq. (15) were always measured at the surface of the wall in the field tests, it can be said that all theU-values in this paper were also evaluated based on the temperature difference between the inner and outer wall surfaces:
Twin(t)=Tin(t)-Qin(t)Rin,
(21)
Twout(t)=Tout(t)+Qout(t)Rout,
(22)
ΔT(t)=Twin(t)-Twout(t),
(23)
whereRinis internal wall surface thermal resistance (m2·K/W);Routis external wall surface thermal resistance (m2·K/W).
2 Simulation Results Obtained in Test
Walls
2.1 Four test walls
Four residential walls were simulated and theirU-values and dynamic thermal properties are presented in Table 1. TheU-values of walls from 1 to 4 are arranged in order from the least to the greatest. To ensure that these data were reliable, properties of walls 1 and 4 were obtained from the ISO 13786[16]calculation examples, and those of walls 2 and 3 were obtained from the CIBSE[20]database.
The simulation tool is called dynamic thermal properties calculator which is not CFD. It is a free tool for calculating the thermal properties of construction elements, which has been launched by The Concrete Centre following development by Arup. The methodology is based on ISO 13786[16], and is fully aligned with SAP (Standard Assessment Procedure). The motivation for producing this tool is a growing need among architects and engineers for more information about the thermal properties of construction elements other than just theirU-value. This is needed to help optimise the passive performance of buildings and ensure a high level of inherent energy efficiency.

Table 1 Dynamic thermal characteristics of simulated walls
2.2 Simulation results
All figures in this section contain plots of the fractional errors in theU-values calculated by Eq. (15) under different test conditions. The fractional errors can be calculated as (U*-U0)/U0.
Figures 1-3 are error plots under so called “standard” test conditions (the outdoor and indoor temperature sine-waves are phase coincident,Δt=0 ℃,ΔTin=1.11 ℃,ΔTout=5.56 ℃,ΔT=22.2 ℃) but with different measurement start times. Figure 4 presents the errors in the case of a larger indoor air temperature fluctuation,ΔTin=3.33 ℃. Figure 5 explores the response under different temperature phases. Since all the error cycles repeated themselves every 24 h, the simulation time span for all the plots was 24 h. Tables 2-6 list the time when the estimation error starts to be less than 10% with three methods.
In the experiment conditions for Fig.1, the measurements were recorded starting from the time when both the outdoor and indoor air temperatures were at their respective coldest states, such as mid-night. For walls 1 and 4, the average heat flux method provided better results than the traditional internal wall surface method. For wall 3, the error peaks for both the methods were similar, but the error of the average heat flux method (within 10%) could be estimated six hours earlier than that of the traditional. Wall 2 had the same construction as wall 3, albeit with an insulated cavity. This insulated cavity had a significant effect on the outdoor wall surface heat flux and rendered the average heat flux method a failure. Moderaetal.[21]also found that the presence of an insulated cavity madeU-value prediction more difficult. The fact that the estimation error based on the outer wall surface was better than the one based on the inside surface for wall 1 could be another possible evidence that the traditionalU-value measurement methods need to be re-evaluated.
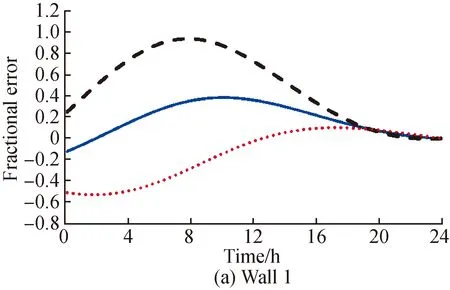
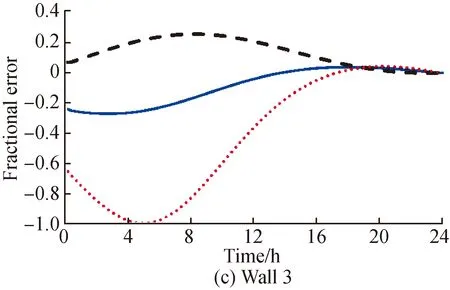
Fig. 1 Fractional error in U* for 4 walls with the same sine-wave phase(ΔTin =1.11 ℃, ΔTout =5.56 ℃, ΔT=22.2 ℃, Δt=0 s)

Table 2 Time with the estimation error starting to be less than 10%
The measurements for Fig. 2 and Fig.3 were recorded 8 h and 16 h later compared to the start time for measurements in Fig.1, or 8:00 a.m. and 4:00 p.m., respectively, which could be considered more realistic situations for field tests. Despite all the positive errors in the indoor data evaluation in Fig.1, the error signs were not generalizable to all walls. The error started off as positive and later became negative, which meant that theU-values calculated using the traditional method based on only the indoor side may be biased. As can be seen in Table 3 and Table 4, the necessary measurement time forU*(within 10%) was strongly dependent on the start time. However, the error estimation based on the average heat flux method exhibited a similar range as shown in Fig.1. Specifically, the average heat flux method was not extremely sensitive to the measurement start time.

Table 3 Time with the estimation error startsing to be less than 10%
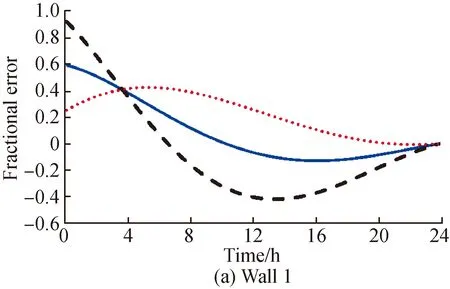
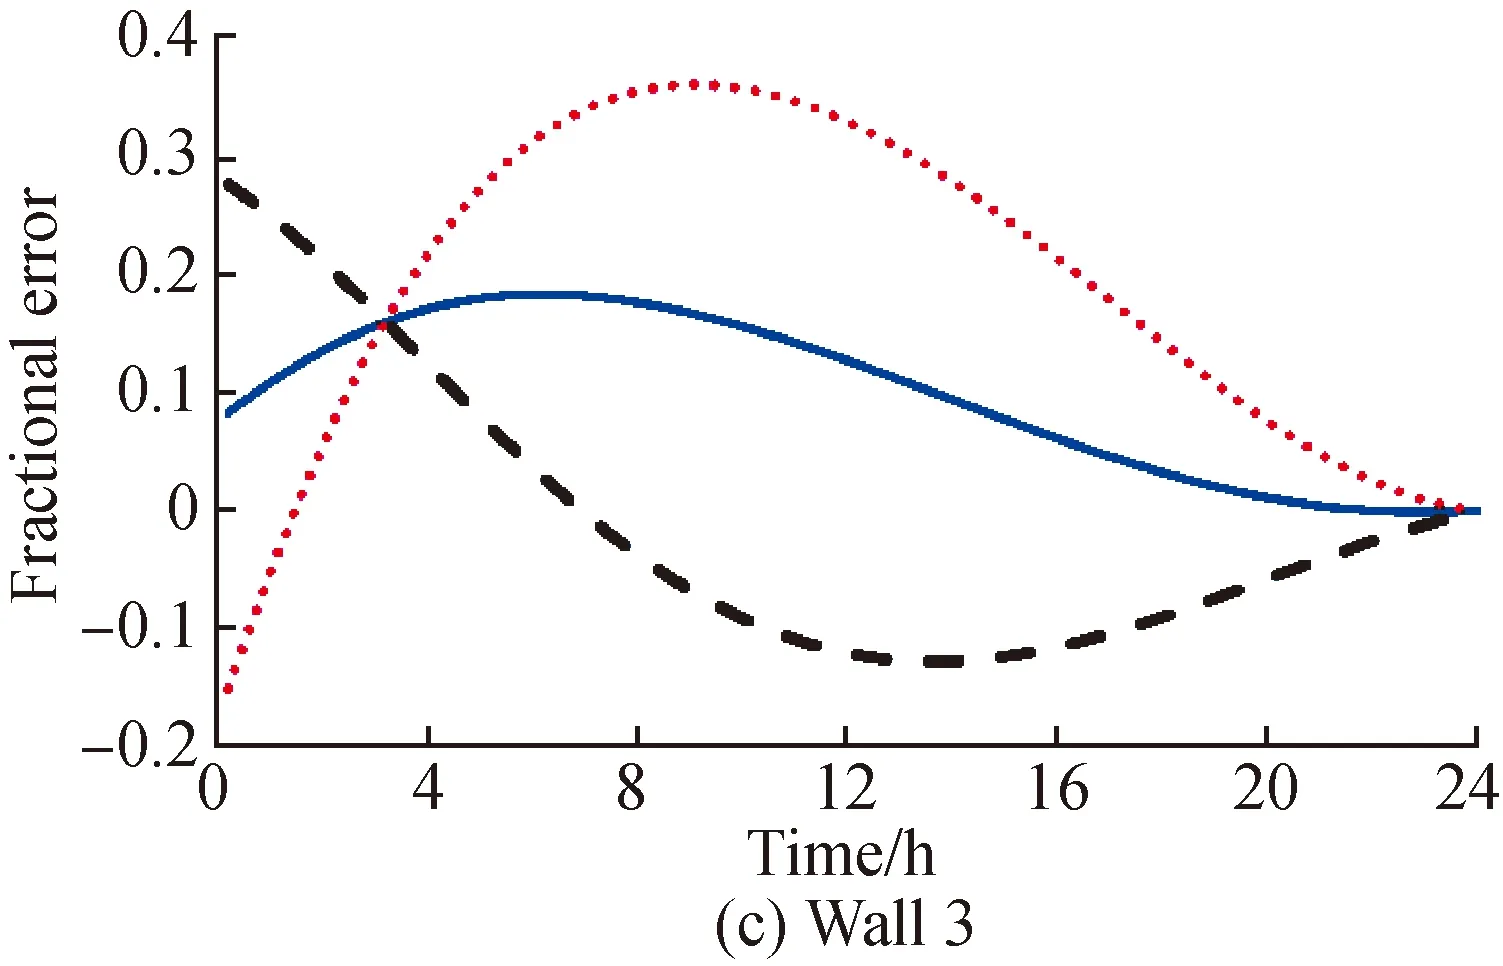
Fig. 2 Fractional error in U* for 4 walls with the same sine-wave phase when measurements commenced 8 h later(ΔTin =1.11 ℃, ΔTout =5.56 ℃, ΔT=22.2 ℃, Δt=0 s)
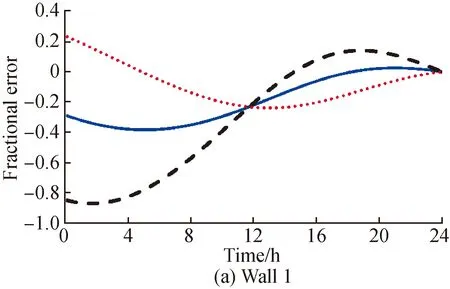
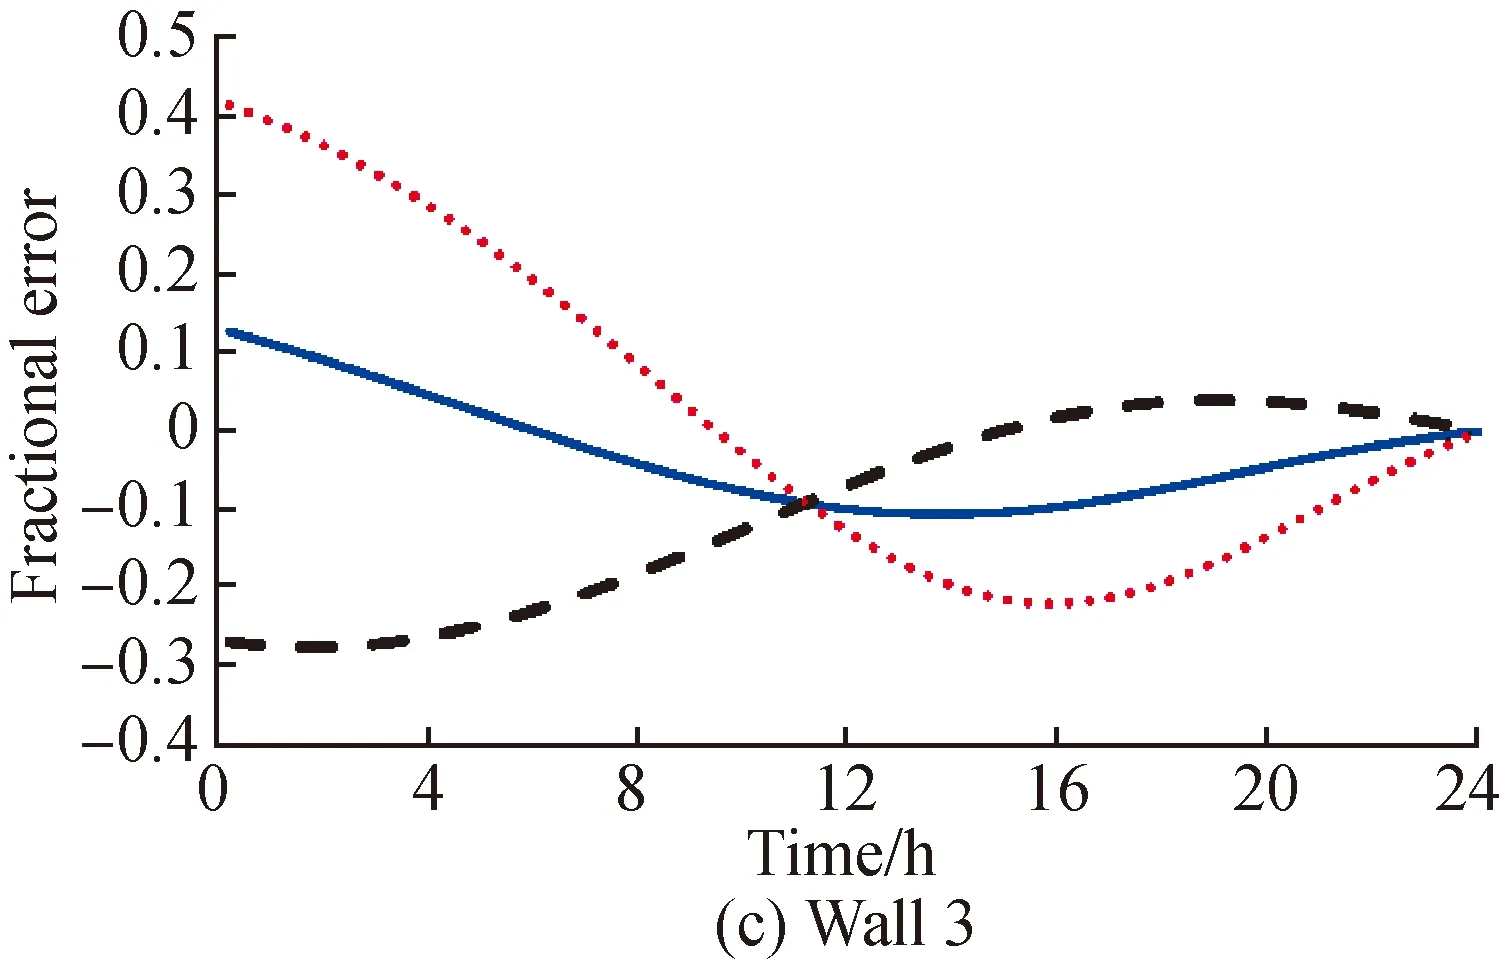
Fig. 3 Fractional error in U* for 4 walls with the same sine-wave phase when measurements commenced 16 h later(ΔTin =1.11 ℃, ΔTout =5.56 ℃, ΔT=22.2 ℃, Δt=0 s)

Table 4 Time with the estimation error starting to be less than 10%
An additional requirement forU-value measurements is to try and maintain the inner surface temperature as constant as possible, see ASTM C1046[7]and Moderaetal.[21]This prerequisite could be difficult to satisfy for some cases such as an old building with a limited capacity heating system. Figure 4 simulates this situation by increasing the indoor air temperature amplitude from 1.11 ℃ to 3.33 ℃—about 60% of the outdoor air temperature amplitude. Figure 4 displays a trend similar to the one shown in Fig.1, and all error peaks based on the inner surface data became larger, as indicated by ASTM C1046[7]: for walls 1 and 2, the maximum errors were approximately twice as large compared to the ones in Fig.1; for walls 3 and 4, the maximum errors were 20%-30% higher than the data in Fig.1. However, if evaluated using the average heat flux method, error peaks for walls 2, 3, and 4 were improved approximately 25%-50% compared with the data in Fig. 1; error peaks for wall 1 worsened but still much better than the one based on inner surface data. Table 5 also shows that the average heat flux method can reduce the error to 10% faster.
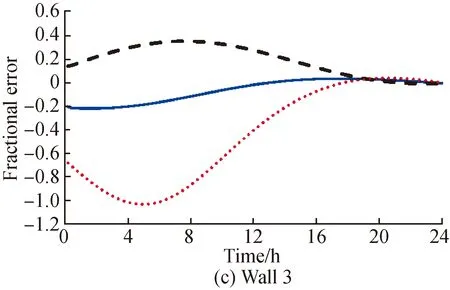
Fig. 4 Fractional error in U* for 4 walls with the same sine-wave phase and with different indoor temperature variations(ΔTin =3.33 ℃, ΔTout =5.56 ℃, ΔT=22.2 ℃, Δt=0 s)

Table 5 Time with the estimation error starting to be less than 10%
So far, all the simulations were based on the same phase condition. This assumption could be very difficult to replicate in actual tests. The internal wall surface temperature is determined by many factors such as the external wall surface temperature, thermal mass of the wall, and indoor air temperature. There is always a time lag between the indoor and outdoor temperature phases. Figure 5 presents the results of a 6 h time lag between the external and internal air temperature sine waves. Compared with Fig.1, for walls 2, 3, and 4, the maximum errors inU*based on the internal air temperature worsened, but the ones based on the average heat flux method improved. In addition, for wall 1, the calculation values based on the internal air temperature improved by 10%, but the data based on the average heat flux method still had a much smaller maximum error. Even though the average heat flux method does not significantly shorten the time when the estimation error is less than 10%, but this method still greatly reduces the maximum error.
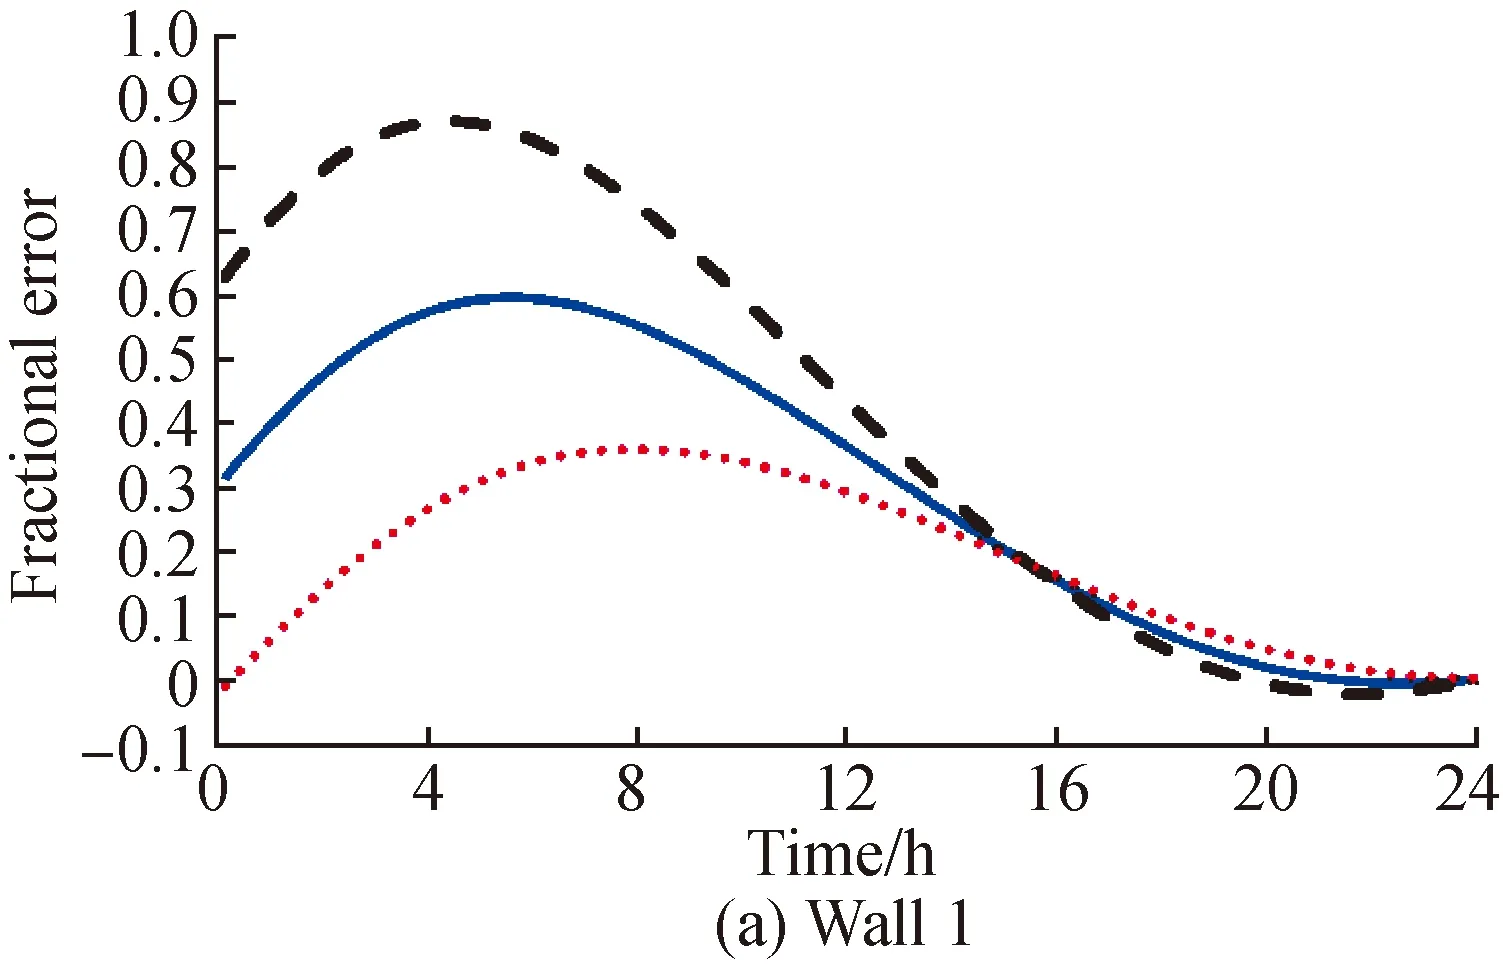
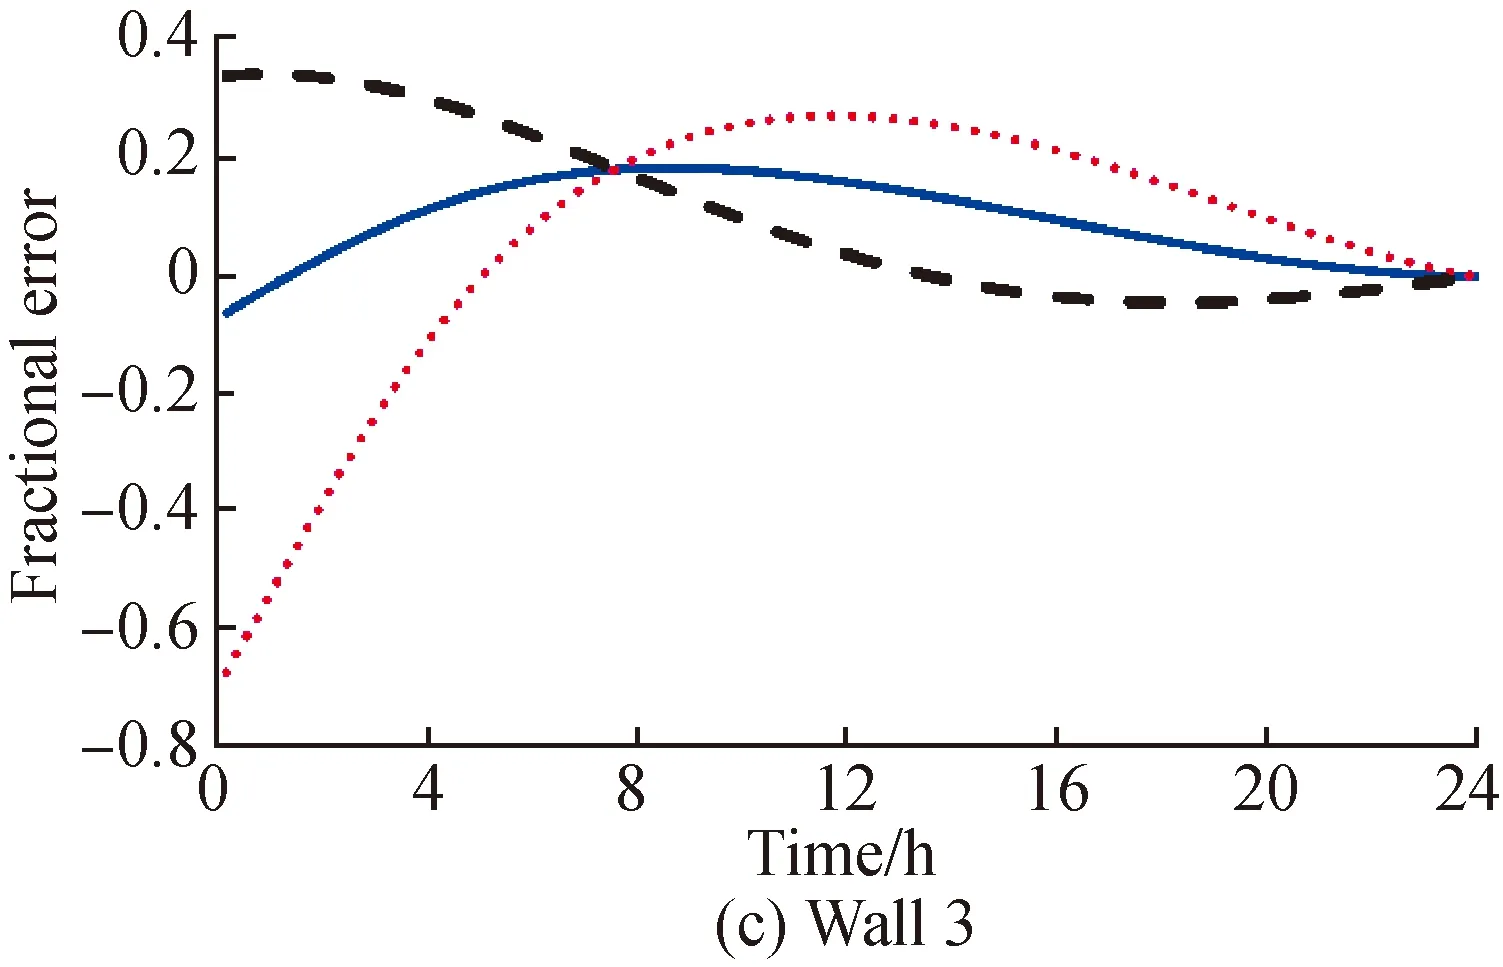
Fig. 5 Fractional error in U* for 4 walls with different sine-wave phase(ΔTin =1.11 ℃, ΔTout =5.56 ℃, ΔT=22.2 ℃, Δt=-6 h=-21 600 s)

Table 6 Time with the estimation error starting to be less than 10%
3 Conclusions
Thein-situU-value is a very important parameter for owners or engineers to evaluate the true thermal performance of an existing building. However, this parameter is often not measured. Since the test tends to be very time consuming, it is not very convenient for an operational building. The goal of this paper was to present a new method which could decrease the time required to measure theU-value of a wallin-situ.This new method recommended measuring the temperatures and heat flux on both sides of the wall and thereby utilising the average values of the internal and external heat flux to estimate theU-value. Measurements of the heat flux at the outer wall surface are avoided because of the undesired rapid fluctuationsdue to the wind and radiation of the sun. However, this problem could be solved by placing heat flux transmitters under a rectangular cover made of gypsum plywood, or a proper protective screen. Under idealized internal and external air temperature boundary conditions, four walls with differentU-values were simulated.
(1) The proposed method could improve the maximum error level for most test walls.
(2) The proposed method was not sensitive to the measurement start time.
(3) The proposed method was more stable even in less controlled boundary conditions involving large inner temperature variations or out of phase temperature waves.
Both the indoor and outdoor temperature profiles could be quite chaotic during an actual test. Therefore, the traditional method based only on the internal heat flux needs a much longer time period to filter out these irregular fluctuations. The average values of the internal and external heat flux could be measured as the heat flux at a location inside the test wall, which is relatively stable compared to the boundary profiles. This method could decrease the necessary measurement time to a reasonable period. In unfavourable cases, such as wall 2, the values of the external heat flux can be ignored and only the internal heat flux data can be used to calculate theU-values.
杂志排行
Journal of Donghua University(English Edition)的其它文章
- Influence Mechanism of Clothing Anchor Features on Consumers’ Purchase Intention
- Performance Evaluation of a Molten Carbonate Fuel Cell-Graphene Thermionic Converter-Thermally Regenerative Electrochemical Cycles Hybrid System
- Long Text Classification Algorithm Using a Hybrid Model of Bidirectional Encoder Representation from Transformers-Hierarchical Attention Networks-Dilated Convolutions Network
- Estimating Mechanical Vibration Period Using Smartphones
- Meta-Path-Based Deep Representation Learning for Personalized Point of Interest Recommendation
- Design and Characterization of Electrical Connections for Conductive Yarns
