Adsorption and Regeneration of Volatile Organic Compounds (VOCs) on Coal-Based Activated Carbon by Ferric Nitrate Modification
2021-10-09JinChunjiangChenHuiminWangLuyuanChengXingxingSunRongfeng
Jin Chunjiang; Chen Huimin; Wang Luyuan; Cheng Xingxing; Sun Rongfeng
(1.Energy Research Institute of Shandong Academy of Sciences, Qilu University of Technology (Shandong Academy of Sciences), Jinan 250014;2.School of Energy and Power Engineering, Qilu University of Technology(Shandong Academy of Sciences), Jinan 250014;3.Changji University, Changji 831100;4.School of Energy and Power Engineering, Shandong University, Jinan 250061)
Abstract: In this study, the Heishan coal was used to prepare a series of activated carbon (AC) samples via a vapor deposition method.The effects of the Fe(NO3)3/coal weight ratio on the physicochemical properties of the activated carbon were systematically investigated, and the AC samples were analyzed by the N2 adsorption‒desorption technique,the scanning electron microscopy, the X‐ray diffraction, the Raman spectroscopy, and the Fourier transform infrared spectroscopy.Furthermore, the adsorption properties of ethyl acetate were investigated.The results indicated that as the Fe(NO3)3/coal mass ratio increased from 1:8 to 1:2, the specific surface area, the total pore volume and the micropore volume initially increased and then decreased.The specific surface area increased from 560.86 m2/g to 685.90 m2/g, and then decreased to 299.56 m2/g.The total pore volume and micropore volume increased from 0.29 cm3/g and 0.17 cm3/g to 0.30 cm3/g and 0.22 cm3/g, and then decreased to 0.16 cm3/g and 0.10 cm3/g, respectively.The optimized ratio was 1:8.During the activation process, iron ions infiltrated the activated carbon to promote the development of the pore structure, the pore size of which was between 2.5 nm and 3 nm in daimeter.This approach could enhance the capacity for adsorption of ethyl acetate.It is worth noting that the ACs displaying the largest specific surface area and total pore volume (685.90 m2/g and 0.30 cm3/g) were formed under the optimized activation conditions (950 °C, 20%(volume) of CO2, ratio 1:5), and the maximum AC capacity for adsorption of ethyl acetate was 962.62 mg/g.After seven repeated thermal regeneration experiments, the saturated AC adsorption capacity was still above 90%.
Key words: coal‐based activated carbon; VOCs removal; adsorption; regeneration
1 Introduction
Volatile organic compounds (VOCs) can be highly toxic and dangerous to human health[1].Ethyl acetate is a typical volatile organic compound, which is mainly used in coatings, artificial leather, colorants, printing, and other industries.These emissions are both a source of air pollution and, particularly in enclosed spaces, can result in high concentrations of the VOC leading to serious inhalation poisoning or long‐term health issues[2].
Activated carbon adsorption is considered to be one of the most effective technologies for VOC removal because of its large Brunauer‐Emmett‐Teller (BET)surface area, good adsorption performance for a variety of pollutants, developed pore structure, easy regeneration,and utilization of adsorbate and adsorbents[3‐4].Activated carbon with a heterogeneous porous structure is usually obtained from peat, coal, nut shells, lignite, sawdust,and synthetic polymers[5‐8].At present, the preparation of activated carbon from coal has the advantage of being cost‐efficient and easy production.It is a material that has been widely studied[9].In general, the high adsorption capacity of activated carbon is related to its physicochemical properties[10‐12].Therefore, the modification of activated carbon to adjust its pore structure and chemical properties is an effective way to improve the efficiency for removal of various pollutants[13‐14].In previous studies, Wang, et al.[15]found that preparing coal‐based activated carbon doped with trace FeCl3followed by CO2‐assisted physical activation produced activated carbon with a good pore structure.Hsisheng Teng, et al.[16]used phosphoric acid impregnation and different temperatures to carbonize activated carbon from bituminous coal.With an increase in the chemical ratio of H3PO4/coal, the BET area and pore size of the carbon also increased.Ge, et al.[17]studied the effects of ferric nitrate concentration, microwave power,and microwave radiation time on activated carbon.It was found that as the pore structure of the modified activated carbon developed, the specific surface area greatly increased, while the oxygen‐containing groups were reduced, and the alkalinity increased.Li, et al.[18]prepared activated carbon using a simple ZnCl2mineral-assisted chemical and physical activation method.The prepared ACs exhibited good physical and chemical properties.The preparation of ACs by mineral‐assisted physical activation shows a promising prospect, and many studies have shown that the effects of metal element doping and the CO2activation process on the pore development of ACs are very important[19‐22].The advantages of preparing activated carbon using these methods include simpler processing and lower costs, as well as the formation of a good microporous structure in the powder[23].However,these methods also have notable shortcomings, as they are time‐consuming and can generate pollution.To overcome these limitations, this study demonstrates a new type of the Heishan coal‐derived AC with a broadened pore size distribution for VOC adsorption.The preparation method is based on a simple one‐step chemically induced physical activation strategy, through simple heat treatment of the activator Fe(NO3)3and the pulverized coal, followed by high‐temperature carbonization activation in a CO2atmosphere.Through this process, Fe(NO3)3promotes the formation of a highly microporous structure in the AC during the low‐temperature chemical activation stage(600 ℃).The subsequent temperature rise can promote the physical activation of CO2(950 ℃).During this period,the elemental iron doped in Heishan coal plays a key catalytic role in the formation of mesoporous material.The high temperature (950 ℃) used can transform iron species into elemental iron vapor, which is released from the generated activated carbon.It not only can dredge the clogged pores of activated carbon, but also can avoid the formation of a large number of chemical residues during traditional chemical activation, which are complicated and harmful to the environment.The obtained activated carbon has a high specific surface area, particularly the hierarchical pore structure that contains micropores and mesopores, which is conducive to the realization of high‐capacity VOC adsorption.The ACs prepared by this method have the characteristics of a well-developed pore structure and large BET surface area, which can provide a simple, rapid, and green scheme for the preparation of coal‐based activated carbon.
In this study, the Heishan coal (obtained from the Heishan coal mine area, Tuokesun County, Xinjiang, China) was selected as the raw material in the preparation of ACs through modification with Fe(NO3)3and CO2-assisted activation to mitigate the emissions of VOCs.A series of ACs with high BET surface areas were prepared using a vapor deposition method.The physicochemical properties were characterized in detail.Ethyl acetate was used to simulate a kind of VOCs, and the performance of ACs for adsorption of ethyl acetate was investigated.
2 Experimental
2.1 Preparation of activated carbon
The Heishan coal was used as the raw material; the proximate and ultimate analysis results for raw Heishan coal are given in Table 1.It can be seen that it has a high volatile component content and a low ash content.The Heishan coal sample was ground and sieved to obtain particles with a size range of 0.2 ‒ 0.3 mm.To remove the impurities contained in the raw coal, 100 g of the dried starting material were added to 100 mL of a mixture composed of 25% HNO3and 100 mL of 15% HCl.The mixture was heated under stirring in a 60 °C water bath for 24 h, and then the pickled coal particles were filtered,placed in a vacuum drying oven, and dried for 18 h.

Table 1 Proximate and ultimate analysis of Heishan coal
In this experiment, 20 g of Heishan raw coal were pickled and desalted, and were then mixed with trace Fe(NO3)3(purchased from Aladdin) to obtain an Fe(NO3)3-coal mixture.The Fe(NO3)3‐coal mixture was then transferred into a quartz tube, evacuated, and heat‐treated at 130 °C for 2 h.After being cooled down to room temperature, the treated iron carbon mixture in the tube was placed in a vacuum tube furnace and then was heated to 950 °C in an atmosphere consisting of CO2and N2.The heat treatment process was divided into two stages: holding for 2 h at 600 °C and 950 °C, respectively.In the process of CO2-assisted activation, the iron species embedded in the coal matrix can catalyze the reaction between the coal skeleton and CO2and promote coal pore formation.The mass ratios of the prepared Fe(NO3)3/coal were: 1:2 (HSC‐2),1:5 (HSC‐3), and 1:8 (HSC‐4).
To verify the effect of iron ions dissolved in the activated carbon on the pore development, an AC sample (HSC)was prepared by a separate CO2-activation process carried out at the same preparation temperature.A further AC sample was prepared, HSC‐1, by pickling the Heishan coal with a HCl‐HNO3mixed solution, without doping with Fe(NO3)3.
2.2 Adsorption of ethyl acetate
The capacity of the ACs for adsorption of ethyl acetate was tested using a fixed‐bed experimental system.In the process of adsorption, ethyl acetate was selected as the typical VOC having the characteristics of high concentration, pungent odor, volatility, and low concentration of ethyl acetate that can cause serious toxic reactions.Ethyl acetate is a widely used fine chemical,making it a potential source of air pollution[24].
2.3 Characterization
The nitrogen‐adsorption properties of the prepared activated carbon were measured using a BET analyzer(Autosorb IQ), and the pore structure characteristics were obtained.The activated carbon was analyzed using a Hitachi scanning electron microscope (SEM) type SU3500.Proximate analysis of activated carbon was carried out according to ASTM D3174‐04 and ASTM D3175‐89A methods.The surface chemical characteristics of ACs were studied using a Shimadzu FTIR‐8040 spectrophotometer and a Renishawin micro-Raman spectrometer[25].
3 Results and Discussion
3.1 Pore structure
Figure 1 shows the nitrogen adsorption‐desorption isotherms and QSDFT pore size distributions of ACs prepared under different conditions.According to the International Union of Pure and Applied Chemistry classification (IUPAC, 2015), the adsorption isotherms of HSC‐2, HSC‐3, and HSC‐4 in Figure 1 (a) are typically type IV, indicating that their pore structures are composed of both micropores and mesopores[24,26].HSC‐1 and HSC‐2 showed typical adsorption isotherms of type I, and their adsorption capacities were belowp/p0= 0.1, which confirmed the main microporous structure[15,27].When the relative pressure was lower than 0.2, the adsorption isotherms began to increase steadily, which confirmed the main structure of micropores, corresponding to the adsorption behaviors of micropores (0.5‒2.0 nm) and ultramicropores (<1.5 nm)[28].As shown in Figure 1(a), all treated AC samples show higher N2-adsorption capacity than the physically activated AC alone, which indicates that acid pickling and Fe(NO3)3-assisted treatment promote the pore development of activated carbon generated during activation[29].
As shown in Figure 1 (b), the pore size of the prepared ACs was mainly in the range of 0‒5 nm, and there was no significant difference in the peak distribution of the five groups of ACs.The samples of HSC and HSC‐1 exhibit two pore size distributions with peak values identified at 2.7 nm and 3.2 nm.The pore structure of HSC‐2, HSC‐3,and HSC‐4 showed three peaks, with the highest peaks recognized at 2.6 nm and 3.4 nm, and a lower peak at 8.5 nm.In addition, the pore structure of HSC‐1 obtainedby a simple chemical activation method is compared in Figure 1.Compared with the other four AC samples,the pore structure distribution of HSC‐1 was more concentrated, and it was mainly distributed in the range of 0‒3 nm.to 502.4 m2/g.Excessive Fe(NO3)3loading may lead to superfluous carbon consumption, which may lead to pore collapse during activation.When the Fe(NO3)3:coal ratio increases to 1:2, the specific surface area of the AC decreases from 502.4 m2/g to 255.8 m2/g.The results show that the appropriate Fe(NO3)3: coal ratio can significantly promote the pore structure development of ACs.Increasing the Fe(NO3)3doping concentration results in the average pore size first increasing and then decreasing, from 2.14 nm to 2.59 nm and then to 2.49 nm.
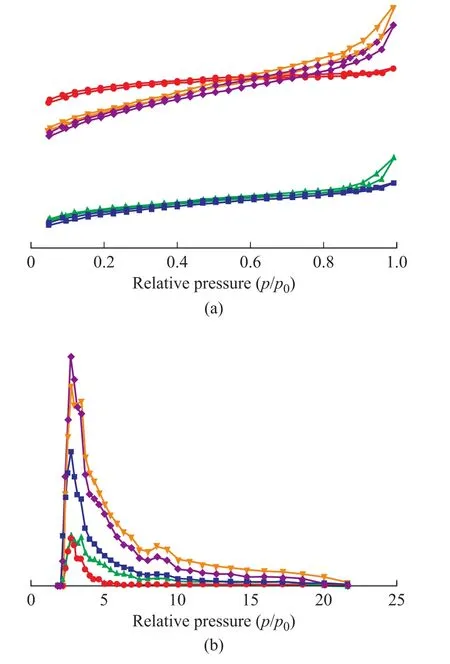
Figure 1 Pore structure characteristic of the ACs (a)Nitrogen adsorption-desorption isotherms, (b) QSDFT pore size distributions
Figure 2 shows the specific surface area and pore structure of ACs prepared under different treatment conditions.The results show that the specific surface area and pore volume of HSC prepared by simple CO2-assisted activation are 251.16 m2/g and 0.15 cm3/g, respectively.In contrast, the specific surface area and pore volume of HSC‐1, HSC‐2, HSC‐3, and HSC‐4 were larger than those of HSC.The concentration of Fe(NO3)3in the coal /Fe(NO3)3mixture plays an important role in the formation of the AC pore structure.As shown in Figure 2, the pore structure of HSC‐3 (with a Fe(NO3)3/coal mass ratio of 1:5) is the most desirable.Compared with HSC‐4, the specific surface area of HSC‐3 increased from 468.37 m2/g
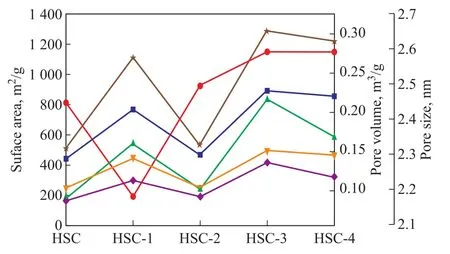
Figure 2 Specific surface area and pore volume/pore size of ACs prepared under different conditions
3.2 Morphology analysis
Figures 3 (a)‒(j) show the SEM images of activated carbon samples at a magnification ranging from 5000 to 15000.It can be seen clearly that the five AC samples have a rich pore structure.However, due to acid washing and Fe(NO3)3doping, the surface morphologies of the five activated carbon samples were also significantly different.Figure 3 (a) and (b) show the surface images of the HSC samples.Figure 3 (a) shows the microstructure of HSC.The surface of the HSC is uneven and honeycombed(composed of many compact small structures) which is mainly attributed to the structure of Heishan coal itself[30].Figure 3 (b) further shows the SEM image of HSC,which displays an amorphous carbon skeleton with small pores.The surface shows little pore structure, part of which is covered.A layer of different‐sized solid particles is attached to the surface and inner walls of the pores.Figures 3 (c)‒(d) present the microstructure information of typical HSC‐1 samples during the pickling processand show significant differences from HSC.Figure 3 (c)shows that the surface of HSC‐1 is relatively flat, the luster is relatively consistent, and some notable pore size widening appears.This may be due to the small crystal structure of activated carbon particles on the surface that are easily oxidized by acid, which causes some blocked pores to reopen.Under the action of CO2, the pore size of activated carbon is further expanded[31].As shown in Figure 3 (d), the surface of sample HSC‐1 is very smooth and almost devoid of sediment, and there are abundant pore structures, including pores with different pore sizes,along with a small amount of a gray white impurity,which is distributed around the pores.
Figures 3 (e)‒(j) show the SEM images of Fe(NO3)3modified activated carbon.Through the comparison of pictures, it was found that the pore structure of ACs modified by ferric nitrate was increasingly abundant.When the ratio of iron to carbon was 1:8, macropores occupied the entire surface of the sample and only a small number of micropores were found.When the iron to carbon ratio was 1:2, the pore structure of the activated carbon was much more complicated and there were more pores in the macroporous framework.It can be seen that the amount of iron ion doping has a significant influence on the formation of micropores[32].As shown in Figure 3(e), when the iron to carbon ratio was 1:2, cracks on the surface of the activated carbon HSC‐2 were reduced, and some micropores expanded to form a larger mesoporous structure.As shown in Figure 3 (f), the surface of HSC‐2 was relatively rough, and there were many micropores around some large pores.This may occur because the excess activator Fe(NO3)3in the activation reaction first reacts with the surface of the raw material particles and then expands from the outside to the inside, leaving many rough pore walls on the surface of the ACs[33].Compared with the electron microscope photos of HSC‐3 [Figures 3 (g)‒(h)], it can be seen that some uniform microporous structures can be observed on the surface of the coal‐based carbon.Figure 3 (h) shows that there are some faults on the surface of HSC‐3, and the pores formed in the activation process can be seen in all directions of the cross‐section.More pores with defects can be found on the surface, with even more abundant pore structures at the junction of the defects and the surface.This is because impurities on the surface as well as some of the pores of the activated carbon can decompose after loading with ferric nitrate and being calcined at high temperatures:some of the pores are blocked or opened.In addition,when being calcined at a high temperature, the carbon skeleton shrinks, resulting in a reduction of the original micropore size.The modified activated carbon forms new micropores, enriching the pore structure, as the ferric ions loaded on the activated carbon can etch, expand, and perforate the surrounding carbon structure after being heated at high temperatures, and the final number of pores and different grades of activated carbon would increase,thus increasing the total pore volume of the activated carbon product and specific surface area[34].When the ratio of iron to carbon is 1:8 [activated carbon HSC‐4, Figures 3 (i)‒(j)], pores with different pore sizes are distributed evenly and have smooth surfaces.However, the pore structure per unit area was much lower than that of HSC‐2 and HSC‐3.The SEM results show that the amount of activator plays an important role in the formation of pores, which promotes the formation and development of the pore structure of the activated carbon samples[35].At 950 °C with feeding 20% of CO2, the addition of iron ions promoted the diversity and complexity of the pore structure, especially the micropore structure.
3.3 Surface characterizations of ACs
The XRD patterns of the samples (Figure 4) show that the modified ACs exhibit a significant change compared to the unmodified activated carbon.The characteristic diffraction peaks of graphite‐like microcrystals appear near 2θ=25.5° and 2θ=43°, which represent the (002)and (100) planes of disordered graphite[36].Compared with HSC, in the XRD pattern of HSC‐1 these two peaks become less distinct, which are ascribed to the existence of a large number of pores in HSC‐1 that can weaken the (002) and (100) peaks[37].After Fe(NO3)3modification, the diffraction peak of the ACs is slightly enhanced and the peak width is narrowed, which indicates that under the given modification conditions,the activated carbon reacts with the modifier resulting in the loss of the microcrystalline layer.Thus, the size of the microcrystalline layer decreases and an amorphous structure is formed[38].This improves the surfacereaction activity of the modified activated carbon, which is conducive to the enhancement of adsorption[39].In comparison, the peak height and peak width of HSC‐2 are smaller and narrower than those of HSC‐3 and HSC‐4, indicating that the surface reaction activity of HSC‐2 is stronger.The diffraction peak of the graphite‐likemicrocrystals of the modified activated carbon shifted to a larger angle, indicating that the carbon layer spacing decreased after modification.Figure 4 shows that HSC has a relatively sharp SiO2diffraction peak at 2θ=35°,and after acid removal by the HCl‐HNO3mixed solution,the SiO2diffraction peak of the HSC‐1 sample was significantly weakened, and an impurity peak appeared in the range of 2θ=30°‒35°.The XRD pattern of the HSC‐2 sample shows an evident iron‐containing peak, which belongs to the Fe2O3phase.These iron‐containing species are generated due to the low‐temperature conversion of the coal structure during the mixing and drying of Fe(NO3)3[15].After the carbon dioxide is introduced, the iron species carbonize at high temperatures, converting to FeO under the action of carbon and some adsorption sites appear on the surface of the activated carbon[40].The XRD patterns of the HSC‐3 and HSC‐4 samples differ greatly from those of HSC‐2, because they show a wide range of amorphous carbon characteristics with no iron‐related crystallization peaks[41].
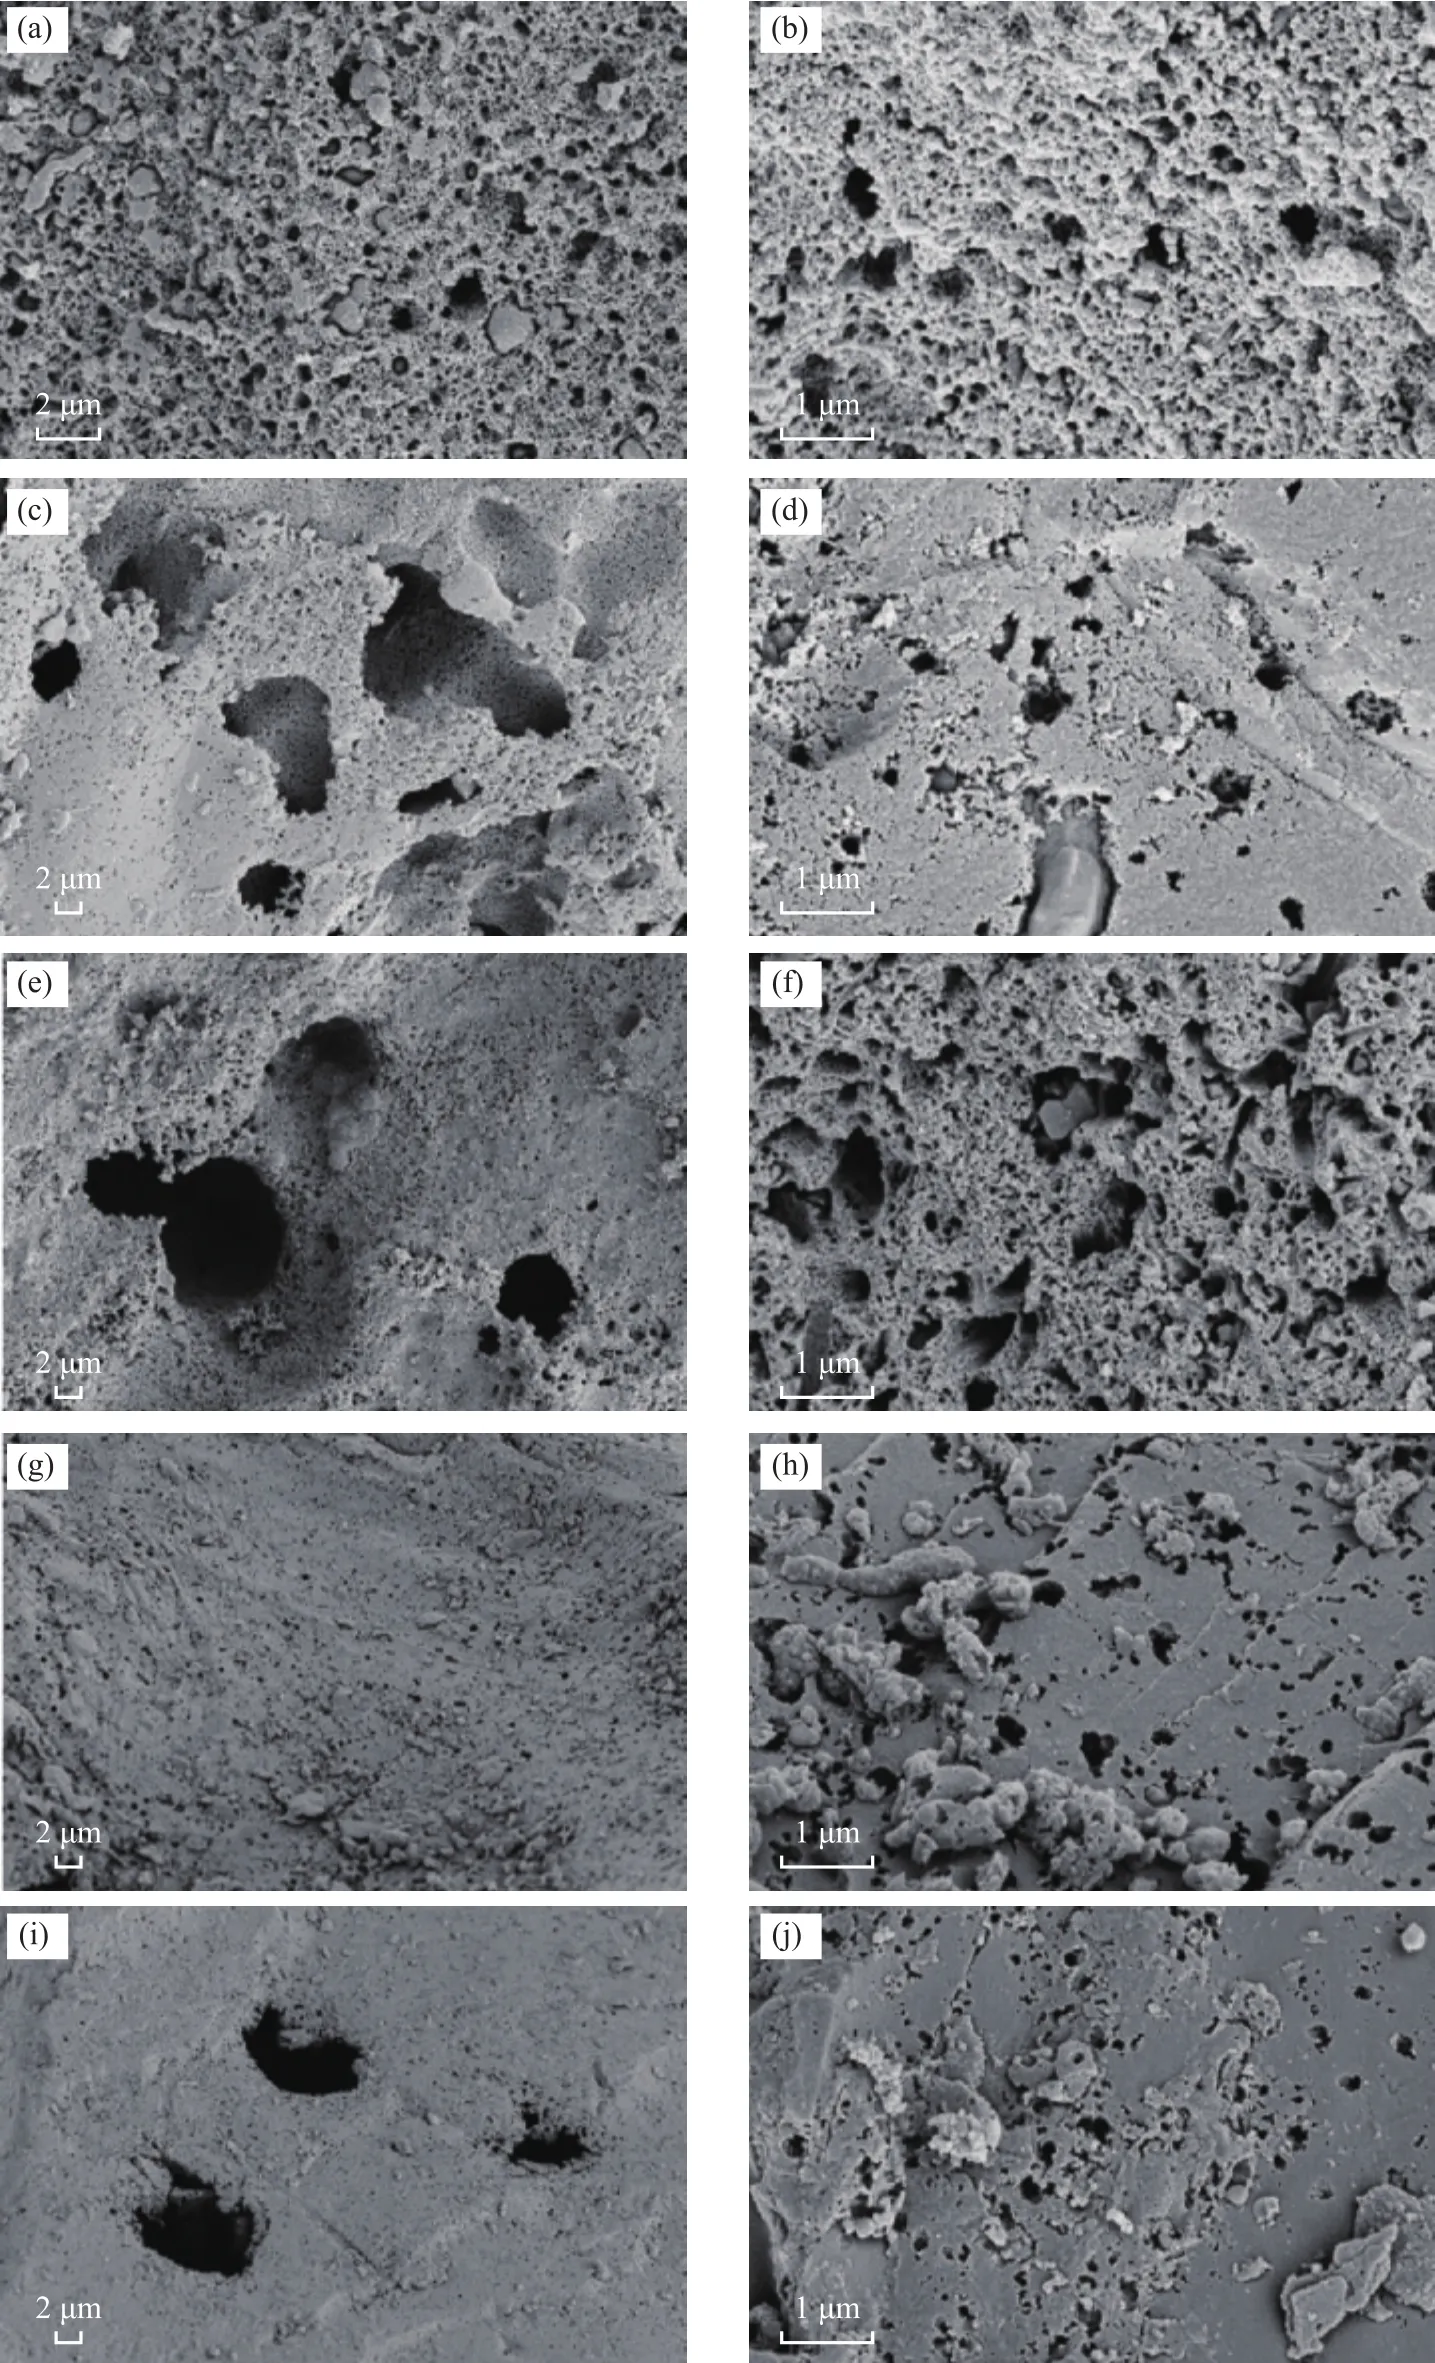
Figure 3 SEM images of various ACs
The Raman spectra of the five ACs are shown in Figure 5.Owing to the different physical and chemical properties of the ACs, their Raman spectra are also unique.After calculation, theID/ IGvalue of the five ACs samples decreased in the following order; HSC‐3 >HSC‐4 >HSC‐1> HSC‐2> HSC.TheID/ IGvalue of HSC‐3 was the highest (1.084), while theID/ IGvalue of HSC was the lowest (1.006).The results show that the structure of activated carbon obtained by a proper amount of Fe(NO3)3treatment is more disordered than that of HSC in the physical activation process, which is conducive to the formation of a corrosion-prone carbon matrix;thus, a good pore structure can be obtained during high‐temperature carbonization[42].
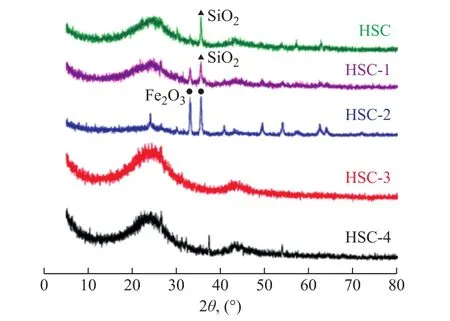
Figure 4 XRD patterns of prepared activated carbons
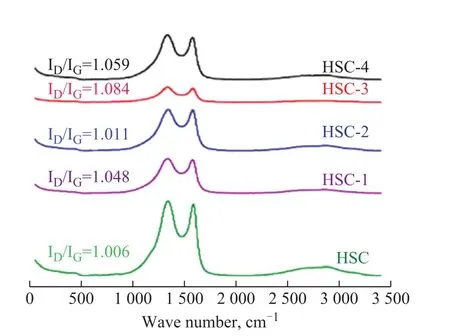
Figure 5 Raman spectra of prepared activated carbons
The infrared spectra of the prepared AC samples are shown in Figure 6 (a).The results show that the five types of activated carbon samples have similar infrared spectra.The strong absorption peaks at 3750 cm‐1and 3470 cm‐1are due to the stretching vibration peak of the hydroxyl group; the peak at 1 500 cm‐1is attributed to the carbonyl (C=O) vibrational peak, and the sharp absorption peak at approximately 1 620 cm‐1belongs to the C=C stretching vibration zone.The broad peak at 1 430 cm‐1is due to the plane bending vibration peak of the carboxyl group; the wide peak at approximately 1 100 cm‐1is mainly due to the in‐plane bending vibration of C‐O groups, and the absorption peak at 680‒620 cm‐1belongs to the σC‐H out‐of‐plane bending vibration peak.The surface of activated carbon is rich in various oxygen‐containing functional groups,which were confirmed by the Fourier transform infrared spectroscopy (FTIR).Although the pore structure and surface morphology of the AC samples are quite different, the types of oxygen‐containing functional groups are very similar[43].Generally speaking, the different preparation conditions of the activated carbon materials (having different activators and being treated at different carbonization temperatures) can affect the formation of the pore structures of the carbon materials,and ultimately would lead to different physical and chemical properties of the activated carbons[24,44].
Figure 6 (b) shows the FTIR curves of ethyl acetate adsorbed by HSC‐2, HSC‐3, and HSC‐4.The comparison of Figure 6 (b) with Figure 6 (a) showsthat the stretching peaks of HSC‐2 and HSC‐3 between 3 500 cm‐1and 3 750 cm‐1disappeared, and the stretching peak at approximately 750 cm‐1was notably weakened.This indicates that the hydroxyl group in the surface functional group of activated carbon is the main group participating in the reaction, and a part of the σC‐H groups also participates in the reaction.The peak of HSC‐4 is basically unchanged, which may be related to the iron ions content in the carbon materials.Iron ions play an important role in the reaction of surface oxygen‐containing functional groups with ethyl acetate, while the trace iron ions are exhausted during the activation process, only reaching the role of pore forming.The effects of iron ions on the adsorption process are discussed later.
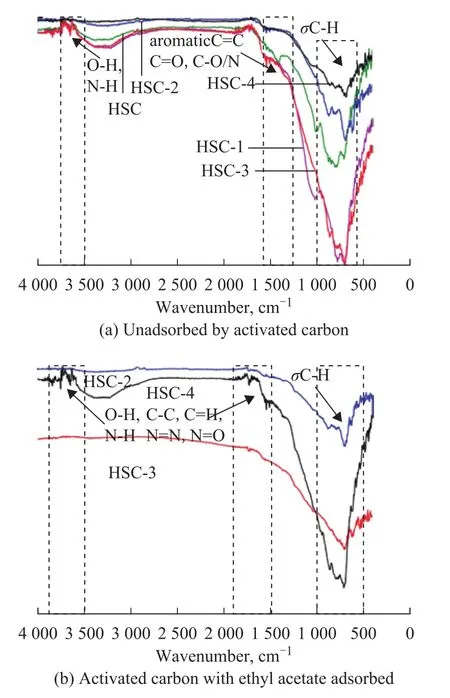
Figure 6 Fourier transform infrared spectra of activated carbon
3.4 Adsorption properties of VOCs
The adsorption capacity of ethyl acetate on the five ACs was calculated, as shown in Figures 7 (a)‒(b).The differences in the specific surface areas and pore structures of the five activated carbons could affect the adsorption of ethyl acetate.HSC‐3 displayed the largest pore volume and specific surface area and showed the greatest adsorption of ethyl acetate, while the pore structure of HSC was the poorest and attained a lowest adsorption of ethyl acetate.The maximum capacity of HSC‐3 for adsorption of ethyl acetate was 962.62 mg/g.For HSC,HSC‐1, HSC‐2, and HSC‐4, the maximum capacity for adsorption of ethyl acetate was 131.18 mg/g, 553.97 mg/g,480.00 mg/g, and 711.28 mg/g, respectively.The pore structure and surface chemical properties of the adsorbent can play important roles in the adsorption capacity of activated carbon.For example, the dispersion force in the surface van der Waals force and the change in the basic microcrystalline structure can affect adsorption[24,45].The appearance of the valence state or unpaired electrons can affect the adsorption performance of activated carbon,particularly for polar or polarized materials[46].The difference in adsorption performance between HSC‐3 and the remaining four types of AC samples is mainly due to its exceptional pore structure.The larger the specific surface area and pore volume of the AC, the greater the adsorption capacity.The difference in adsorption results is mainly due to the doping of ferric nitrate, resulting in an increase in the specific surface area and the total pore volume of the modified activated carbon; the increase in the specific surface area enhances the physical adsorption performance of the activated carbon.The quantity of micropores and mesopores of the activated carbon loaded with ferric nitrate increases in varying degrees during the high‐temperature activation process, which increases the total pore volume of the activated carbon and further enhances the adsorption performance.The adsorption capacity of activated carbon can be further improved by the complexation of VOCs with the reduced iron ions on the activated carbon.

Figure 7 Breakthrough curve and capacity of ACs for adsorption of ethyl acetate
3.5 Adsorption kinetics
The adsorption process of activated carbon was analyzed using the Bangham kinetic model[47].The Bangham model is described by Equations (1)‐(3).

whereqtandqe(mg/g) are the adsorption capacity and the adsorption saturation at timet, respectively, andkandnrepresent the constants of the Bangham model.Figure 8 shows that the Banham adsorption rate equation can better fit the adsorption curve, withR2> 0.98, and the difference between the predicted and the experimental maximum adsorption amount of ethyl acetate is low;thus, the Banham model is considered to be the best fitting model for the curve of ethyl acetate adsorption on activated carbon.The results are presented in Table 2.The higher theR2value, the better the simulated adsorption kinetics effect of ethyl acetate on activated carbon[47].

Table 2 Fitting parameters of Bangham model for ethyl acetate
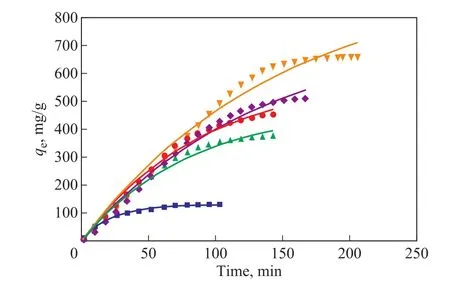
Figure 8 Bangham kinetic model
3.6 Adsorption isotherms
The adsorption isotherms are studied using the Langmuir and Freundlich isotherm models[47‐48], and the isotherm can be determined according to Equations (4) and (5)

whereqmis the maximum adsorption capacity (mg/g),Krepresents the pseudo‐first‐order kinetic constant,KFandnrepresent the pseudo‐second‐order kinetic constants,andCe(mg/L) is the concentration of ethyl acetate at equilibrium.Figures 9 (a) and (b) describe the relationship between the adsorbent and adsorbate on the fixed bed by two kinetic models, as well as the adsorption capacity‐related time for understanding the adsorption kinetics.Table 3 shows the specific fitting data.The difference between the specific experimental data and the two kinetic models was small, and the fitting correlation coefficient was high.Therefore, the adsorption penetration prediction curve was obtained using the two isotherm models.
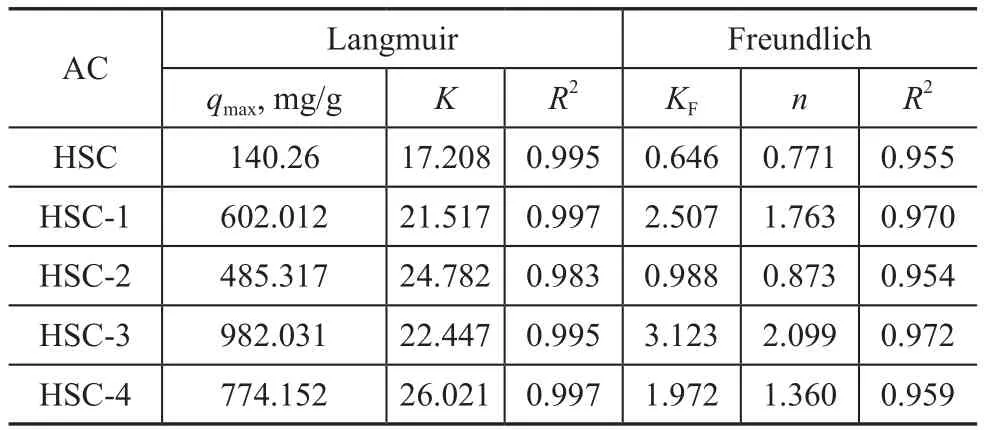
Table 3 Fitting parameters of two kinetic models
3.7 Ethyl acetate TPD curve
Figure 10 shows the ethyl acetate TPD spectra of the fiveAC samples.The results show that the desorption peak temperatures of VOCs increase in the following order:HSC (110 °C)> HSC‐1 (130 °C)> HSC‐3 (150 °C)> HSC‐4 (150 °C)> HSC‐2 (300 °C).The desorption peak intensity of the HSC‐3 sample is relatively high in comparison to the remaining four activated carbon samples.This fact indicates that the interaction between HSC‐3 and ethyl acetate is relatively strong, resulting in the improvement of the adsorption performance of ethyl acetate.The desorption peak of HSC‐2 was small, and the desorption temperature was high, which indicated that the regeneration of HSC‐2 desorption capacity was difficult.This may be related to excessive iron ions in the carbon materials.The iron ions in the pore structure of carbon materials would hinder the release of ethyl acetate and could subsequently react with it, thus blocking the pore channels[49].
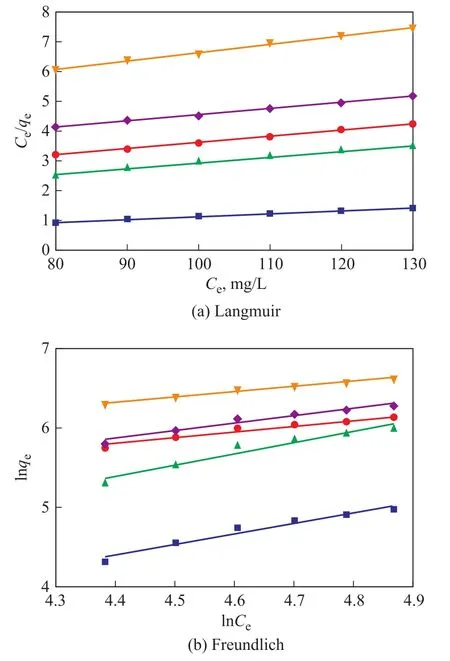
Figure 9 Adsorption isotherm of ethyl acetate by activated carbon
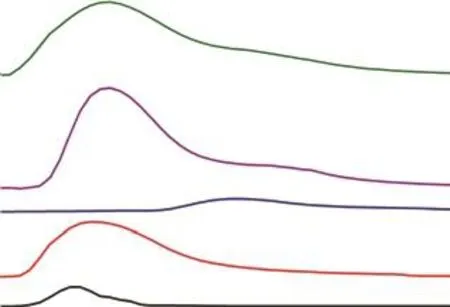
Figure 10 TPD patterns of ethyl acetate
3.8 Regeneration performance of ACs
Figure 11 shows the adsorption performance curves of ethyl acetate for the HSC‐3 samples regenerated at different temperatures.C is the concentration of ethyl acetate at the outlet after adsorption fortmin (mg/m3),and C0is the inlet concentration of ethyl acetate (mg/m3).It can be seen that when the regeneration temperature is 400 ℃, the regeneration performance of the activated carbon sample is good (the regeneration adsorption capacity is 950.59 mg/g, which is more than 98% of the initial value).However, at 100 °C, the regeneration adsorption capacity is only 305.43 mg/g, thus displaying no regeneration effect at room temperature.Combined with the TPD spectra analysis of the HSC‐3 samples, it can be seen that there is no ethyl acetate desorption peak below 80 °C.

Figure 11 Adsorption breakthrough curves of activated carbon regeneration at different temperatures
As shown in Figure 12, the influence of the regeneration time on the adsorption performance of ethyl acetate on the HSC‐3 sample was investigated at a regeneration temperature of 400 °C.After seven continuous regeneration adsorption cycles, the saturated capacity for adsorption of ethyl acetate by activated carbon was871.24 mg/g, which is greater than 90% of the initial value.It can be seen that the coal‐based activated carbon can be completely regenerated and recycled many times under the conditions of thermal regeneration at 400 ℃.
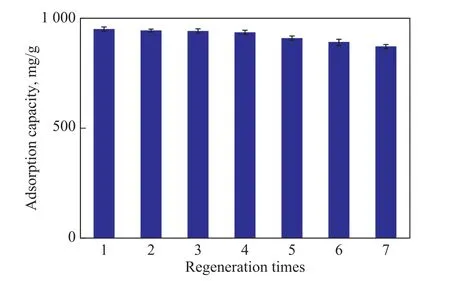
Figure 12 Adsorption capacity of activated carbon for multiple regeneration
3.9 Effect of iron ion on adsorption properties of ACs
To verify whether iron ions could influence the adsorption process of carbon materials, control experiments were performed.The AC sample with a best adsorption effect(HSC‐3) was selected and washed in concentrated HCl several times until the iron ion was removed.The sample was then dried in a vacuum drying oven to obtain HSC‐3‐HCl.For the adsorption test, 1 g of the sample was used, with the experimental results shown in Figure 13.Compared with HSC‐3, the breakthrough time of HSC‐3‐HCl and the capacity for adsorption of ethyl acetate were both greatly reduced.The breakthrough time of adsorption decreased from 206 min to 150 min, and the adsorption capacity decreased from 662.62 mg/g to 442.93 mg/g.The results show that the iron ions doped into the carbon materials not only can impact pore formation during activation, but also can play a catalytic role in the adsorption process[50].
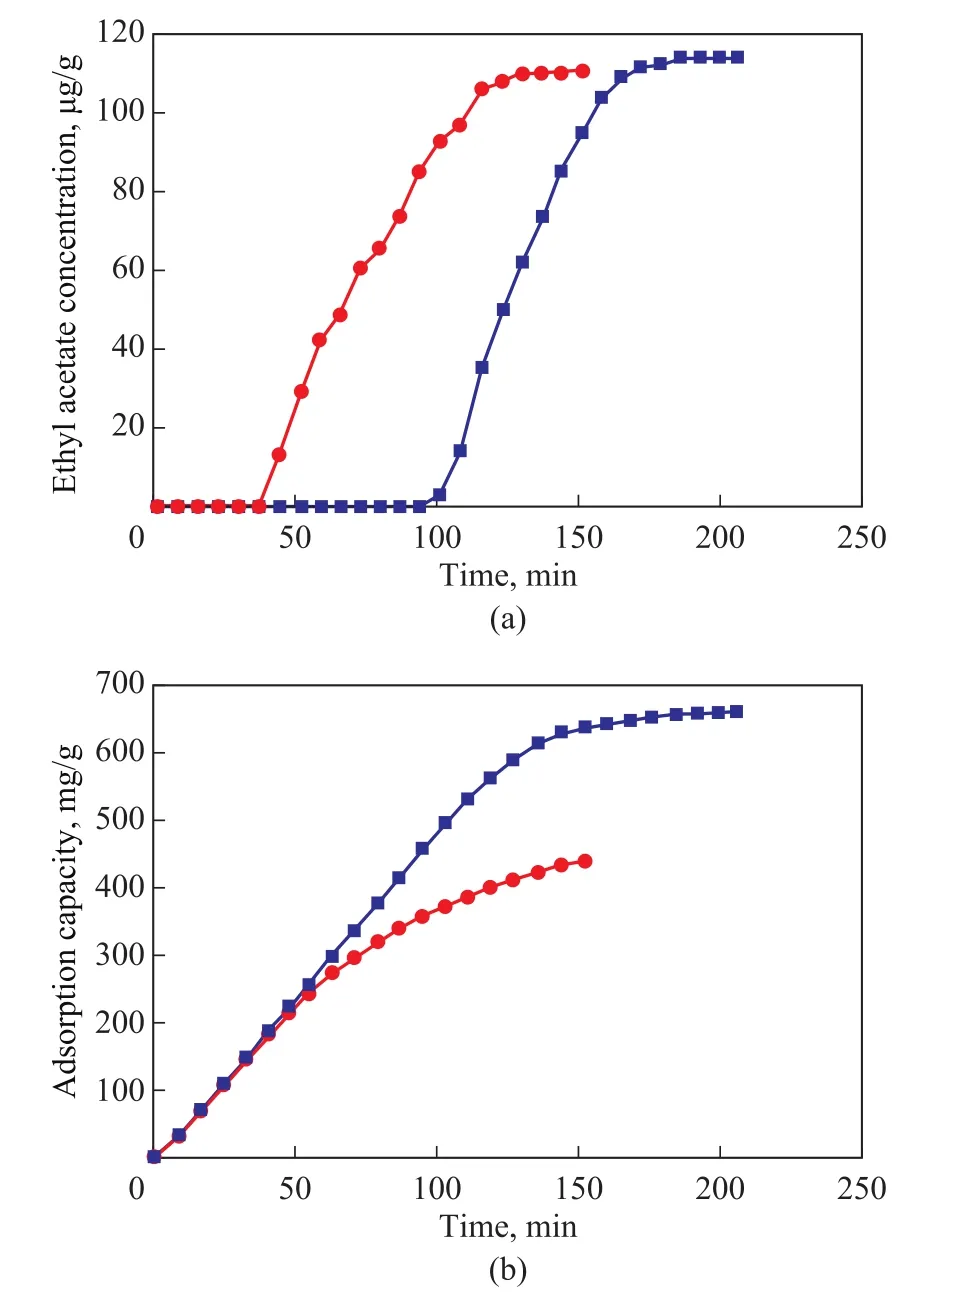
Figure 13 Breakthrough curve and adsorption capacity of ACs on ethyl acetate
3.10 Ethyl acetate adsorption mechanism
The mechanism of ethyl acetate adsorption is shown in Figure 14.Activated carbon has a large specific surface area containing smaller capillaries in the carbon particles, which have a strong adsorption capacity.VOC gas molecules combine with the active sites of activated carbon, resulting in physical adsorption.Then, under the action of the surface functional groups of the activated carbon and doped metal elements, a certain degree of chemisorption occurs.The adsorption of ethyl acetate by AC samples is primarily a physical adsorption as seen in the following formula: C4H8O2(g)+ [* ]as←→[* ‐C4H8O2].In addition, some chemisorption occurs on the surface of the activated carbon, where ethyl acetate is hydrolyzed with water vapor under the catalysis of iron nitrate.The main reaction formula is as follows:[* ‐C4H8O2]+[* ‐H2O]←→ [* ‐C2H4O2]+[* ‐C2H6O].
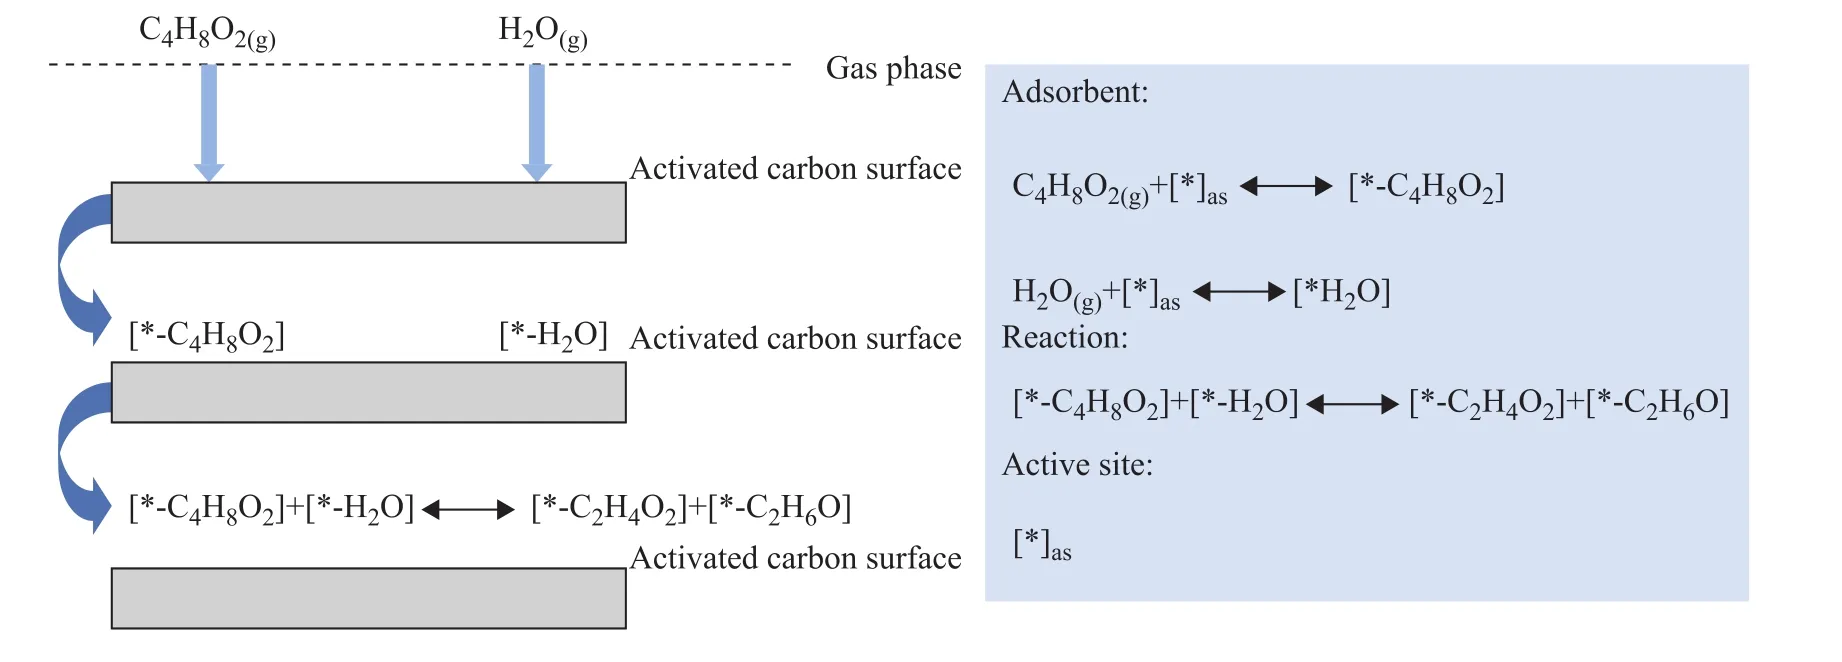
Figure 14 Schematic illustration of the adsorption mechanisms
4 Conclusions
A series of AC‐like materials were prepared from the Heishan coal powder with a mixture of Fe(NO3)3and CO2as an activator.The prepared coal‐based ACs had a microporous structure coupled with a considerable specific surface area and pore volume.
(1) The specific surface area and the total pore volume of AC prepared with an Fe(NO3)3:coal powder ratio of 1:5 are 685.90 m2/g and 0.30 cm3/g, respectively, and the maximum average pore size is 2.59 nm.
(2) The prepared AC samples exhibit good adsorption properties for VOCs.The capacity of HSC‐3 for adsorption of ethyl acetate had a highest value of 662.62 mg/g.
(3) Coal‐based activated carbon exhibited good thermal‐regeneration performance.The VOC adsorption capacity of AC can be completely regenerated at 400 °C and AC samples can be recycled many times.
Acknowledgments:The authors thank the National Natural Science Foundation of China (No.51906130), the Natural Science Foundation of Shandong Province (No.ZR2019BEE053), the Key R & D and Development Plan of Shandong Province (2020CXGC011401) and the Foundation of Shandong Key Lab of Energy Carbon Reduction and Resource Utilization, Shandong University (No.ECRRU201804) for the financial support.
杂志排行
中国炼油与石油化工的其它文章
- Controlling the Pore Structure and Photocatalytic Performance of the Flexible FeⅢ Metal-Organic Framework MIL-53(Fe) by Using Surfactants
- Acidity Evaluation of Industrially Dealuminated Y Zeolite via Methylcyclohexane Transformation
- Study on Distribution of Electrocatalytic Reaction Efficiency in a Three-Dimensional Electrocatalytic Reactor
- Preparation of Ultra-High Molecular Weight Polypropylene Using Ziegler-Natta Catalyst via Combining Internal Electron Donor and Cocatalyst Loading
- Preparation of Modified Enteromorpha-Immobilized Microbial Agent and Research on Diesel Removal Performance
- Chemoselective Catalytic Hydrogenation of Nitroarenes Using MOF-Derived Graphitic Carbon Layers Encapsulated Ni Catalysts
