Prediction of Density and Refractive Index of Lubricating Oils during Secondary Solvent Extraction Process by Furfural
2021-10-09XuXiaolingLiuYansheng
Xu Xiaoling; Liu Yansheng,2
(1.State Key Laboratory of Heavy Oil Processing, China University of Petroleum (Beijing) at Karamay, Karamay Xinjiang 834000;2.State Key Laboratory of Heavy Oil Processing, China University of Petroleum (Beijing), Beijing 102200)
Abstract: To meet the requirements for high aromatic content and low polycyclic aromatic (PCA) concentration, eco‐friendly aromatic‐rich rubber extender oils are usually produced by two‐stage solvent extraction processes with furfural.Among the different properties of rubber processing oils, density and refractive index are some of the most important properties related to their final quality.Two types of methods, including a pseudo‐component approach by using mixing rules and several correlations, were used for calculation of density and refractive index at 20 ℃ of paraffinic furfural‐extract oils and their secondary raffinates.Results indicated that similar accuracy was obtained for predicting the density and the refractive index of furfural + furfural‐extract paraffinic oil systems.However, the quadratic correlation presents its advantage over the pseudo‐component approach when the composition of oils is not available.Moreover, the quadratic correlation was also used for naphthenic lubricating oils during two‐stage solvent extraction processes.The predictions showed much larger discrepancies with respect to experimental values than those of paraffinic lubricating oils, which indicated that the quadratic correlation was more suitable for paraffinic oils with a CN value of below 37%.
Key words: density; refractive index; pseudo‐components; paraffinic furfural‐extract oils; naphthenic lubricating oils;solvent extraction
1 Introduction
Aromatic‐rich rubber processing oils are widely used in oil‐extended rubber and tire industries due to their good compatibility with rubber.In the early stage, the high content of polycyclic aromatic hydrocarbons (PCAs)in the aromatic‐rich rubber processing oils caused environmental pollution and endangered human health.Therefore, the European Parliament and the Council Members had set a limit of PCA content, which should be lower than 3% in 2005[1].Eco‐friendly aromatic‐rich rubber processing oils are usually produced by two‐stage solvent extraction processes using paraffinic or naphthenic vacuum distillates in order to retain high aromatic content while removing PCAs as much as possible.The application of aromatic extraction for both light and heavy vacuum distillates with furfural has been widely used in rubber industry, because of its good selectivity towards aromatics even at high temperature.
The two‐stage solvent refining scheme could be divided into two categories.One route was to further treat furfural‐extract oils by using secondary solvent refining with furfural, removing the toxic PCAs to produce the eco‐friendly rubber processing oils[2,3].The other was firstly to obtain furfural‐raffinate oils by primary solvent extraction, and then a secondary solvent refining of the furfural‐raffinate oils with furfural was carried out to enrich aromatics in secondary extracts[4].
Physical properties of mixtures are keys to describe the processes in which they are involved.The relevant physical properties, density, and refractive index together can be used for petroleum fluid characterization and for determination of other properties, such as aniline point[5].Density is a key parameter for almost all process calculations, and is meanwhile an input for many property correlations and simulating processes.Refractive index isalso important for the refined distillates produced during the processes, as it is related to the aromatic content of samples.
Many studies have reported a pseudo‐component approach based on the composition of samples in terms of hydrocarbon‐type (i.e.saturates (S), aromatics (A),and polars (P)) using mixing rules to determine the density and refractive index of lubricating oils during solvent extraction of vacuum distillates[6‐11].However,the method was limited to one‐stage solvent extraction.Little literature has referred to the prediction of properties for mixtures during secondary solvent refining process of primary extracts or raffinates.On the other hand, the information on composition is not always available, and it is desirable to find an accurate way to predict the density and refractive index from correlations between the two properties.Many connections have been established to relate density with refractive index at 20 °C.Some correlations can relate density linearly to only refractive index itself or a function of refractive index (FRI)[12‐14], while others can relate density to FRI in a quadratic form[15].Espada, et al.[11]have proved that predictions of density and refractive index by the pseudo‐component approach exhibited similar accuracy as the quadratic relationship for the studied lubricating oil mixtures, which was only limited to one‐stage solvent extraction with furfural.However, previous studies including work done by Espada, et al.did not illustrate the distribution of paraffins, naphthenes, and aromatics groups (i.e.carbon‐type composition) for lubricating oils[11,15], which made it difficult to confirm if correlations were suitable for both paraffinic and naphthenic lubricating oils.
In this work, the density and refractive index values of the studied paraffinic mixtures during secondary solvent extraction were determined using a pseudo‐component approach.Another objective of this work is to examine the correlations between density and refractive index (or FRI) during the processes involved, which is necessary in the absence of composition of oils.Thereafter, predictions for the studied paraffinic mixtures during secondary solvent refining obtained by the pseudo‐component approach and the best correlation method were compared in order to analyze the differences.Furthermore, the best correlation method obtained by assessing several correlations was also tested for naphthenic oils during the two‐stage solvent extraction of vacuum distillates in order to check the capability of the method.
2 Characterization and Dataset Section
2.1 Characterization section
2.1.1 Pseudo-component approach
The pseudo‐component approach considered that mixtures were formed by three groups of pseudo‐components, viz.:saturates (S), aromatics (A), and polars (P) in furfural +lubricating oil systems[6‐9].Density and refractive index of mixtures can be calculated by applying the following mixing rules:

whereXS,XAandXPare the values of composition in terms of saturates, aromatics, and polars, respectively.
Another mixing rule suggested by Espada, et al.[11]employing a function of refractive index (or FRI) is as follows:

This mixing rule, in contrast with Eq.(2), does not require the knowledge of density to calculate the refractive index value of a mixture.
In this work, the average pseudo‐components properties were correlated with the compositions for calculating density and refractive index of the studied paraffinic mixtures during secondary solvent refining process using the above‐mentioned mixing rules (Eq.(1‐3)).
2.1.2 Correlations between density and refractive index (or FRI)
A set of correlations relating density to refractive index was used in this work.Vargas and Chapman[12]confirmed that FRI/ρwas approximately equal to one‐third for hydrocarbons and crude oil systems.But it wasnot suitable for the studied systems, so no more details were described here.Angle, et al.[13]developed a linear correlation between density and refractive index (Eq.(5))or FRI (Eq.(6)).Khan correlation[14]could also linearly relate density to refractive index (Eq.(7)), whereas Yarranton, et al.[15]related density and FRI in a quadratic form (Eq.(8)).
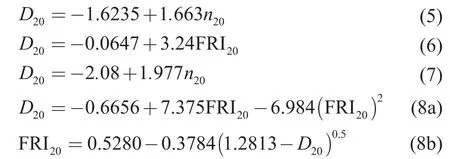
The density and refractive index of the studied paraffinic mixtures during secondary solvent refining process were also calculated by these correlations for comparison with each other.The obtained results were compared with the prediction yielded by the pseudo‐component approach.Moreover, the best relationship derived from comparison of several correlations was also tested for naphthenic oils during the two‐stage solvent extraction of vacuum distillates to check whether the method was accurate for naphthenic oils.
I made my decision there and then. I took my leave, and traveled away from the city. When I returned I had bought myself a cane and wrapped my leg tightly with bandages. I told everyone I had been in a car crash and that my leg would never completely heal again. My dancing days were over. No one suspected the story—I had learned to limp convincingly before I returned home. And I made sure the first person to hear of my accident was a reporter I knew well. Then I traveled to the hospital. They had pushed your grandfather outside in his wheelchair. There was a cane on the ground by his wheelchair. I took a deep breath, leaned on my cane and limped to him.
2.1.3 Carbon-type analysis of petroleum fractions
Riazi and Daubert[16]have proposed correlations between composition (in terms of paraffins, naphthenes,and aromatics groups) and physical properties (such as density, refractive index, and viscosity) for petroleum mixtures.Similar method is presented in ASTM D2140[17]to determine the carbon‐type composition,expressed as the percentage of aromatic carbons (CA),the percentage of naphthenic carbons (CN), and the percentage of paraffinic carbons (CP).This standard is usually applied for a variety of lubricating oils.The carbon‐type composition of the studied mixtures was determined using the standard method in this work to facilitate the quantitative classification of paraffinic and naphthenic oils.According to the standard, for oils containing a sulfur concentration of no less than 0.8%,the accuracy of the test method may be improved by applying a sulfur correction.The correction may be done by using the following equations:

2.2 Dataset section
Previously reported data[2]on solvent extraction experiments of furfural‐extract from paraffinic oils using furfural were used in this work.Table 1 summarizes the hydrocarbon composition (in terms of saturates,aromatics, and polars), the carbon‐type composition(in terms of paraffins, naphthenes, and aromatics) and the properties of each fraction, viz.: liquid density at 20 ℃ (D20) and refractive index at 20 ℃ (n20).In this work, theD20values were determined by ASTM D1298 with an accuracy of +0.0005 g/cm3, while then20values were determined by ASTM D1747 with an accuracy of+0.0005, and the viscosity at 100 ℃ was tested by ASTM D445 with a repeatability of 0.35%.
Another set of data[3]on solvent refining of furfural‐extract from paraffinic oils are listed in Table 2 in order to further examine the relationship between density and refractive index (or FRI).
For the purpose of checking whether the best correlation method is also suitable for naphthenic oils during the two‐stage solvent extraction experiments, the properties of naphthenic vacuum distillate and its primary extracts and raffinates as well as its secondary extracts and raffinates of primary furfural‐raffinate oils[4]are listed in Table 3.
3 Results and Discussion
3.1 Prediction of density and refractive index for paraffinic oils
3.1.1 Predictions by pseudo-component approach
The mixtures were comprised of three pseudo‐components (saturates (S), aromatics (A), and polars(P)) through the compositions presented in Table 1 by applying the pseudo‐component approach.According to the mixing rules of density (Eq.(1)) and refractive index(Eq.(2) and Eq.(3)), the optimum values ofD20andn20of each pseudo‐component were obtained by minimizing the objective function (OF)[10]defined as the sum of squared deviations between the experimental (Pexp) and the calculated values (Pcal) for each property of the studied mixture:
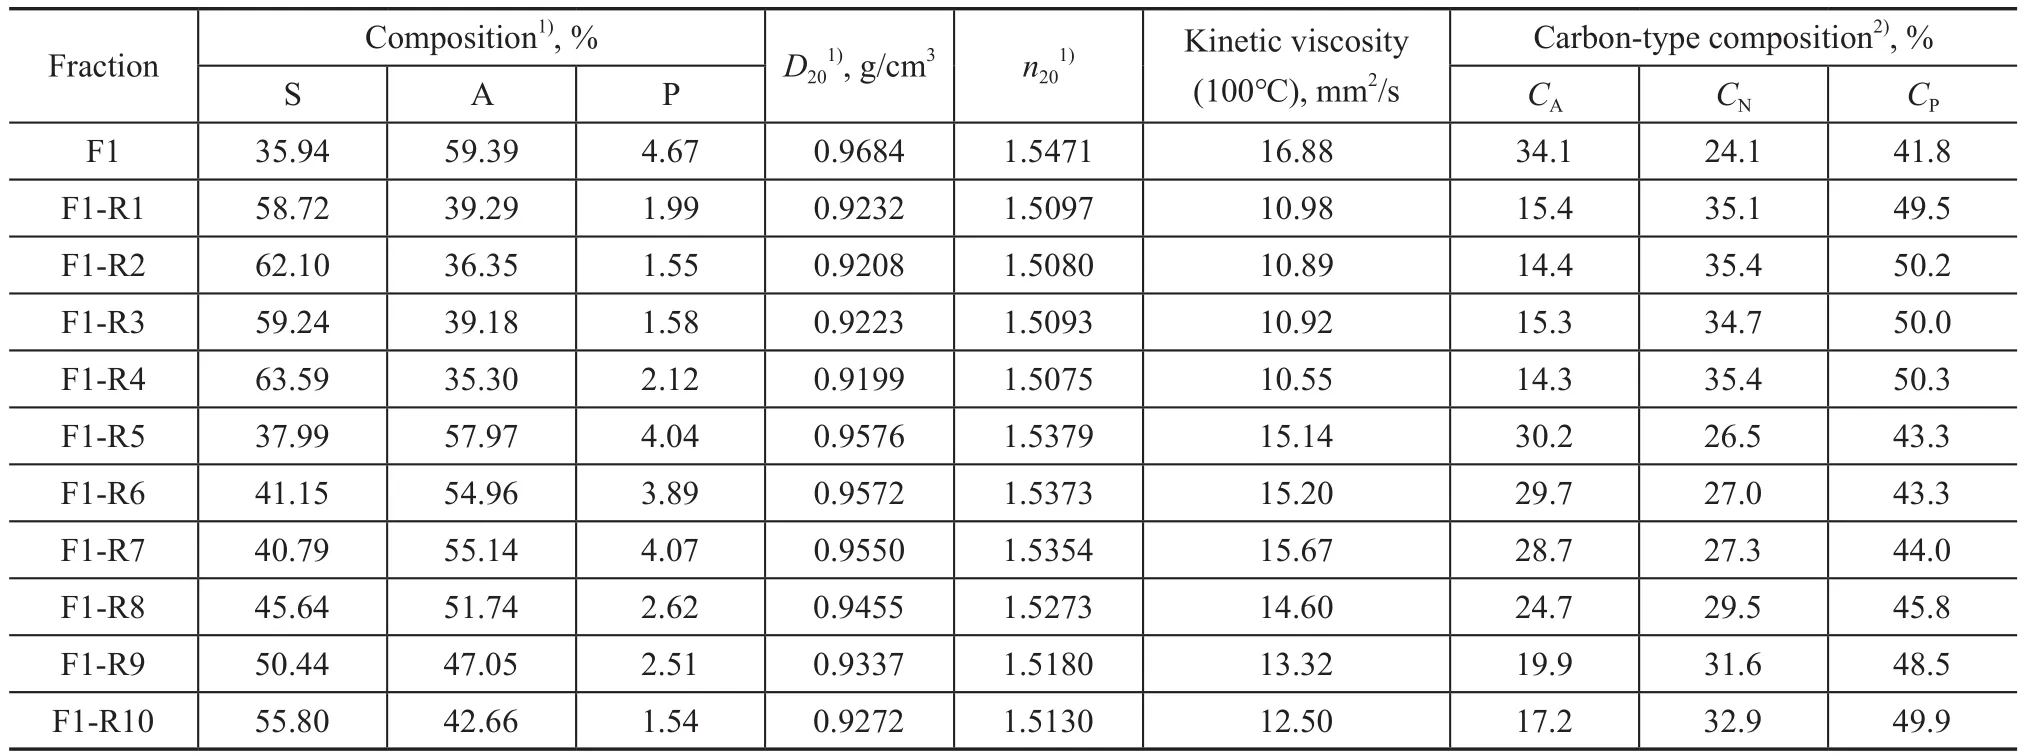
Table 1 Experimental results for the secondary solvent extraction experiments of paraffinic furfural-extract oils[2] considered in this work (F: feed, R: raffinate)
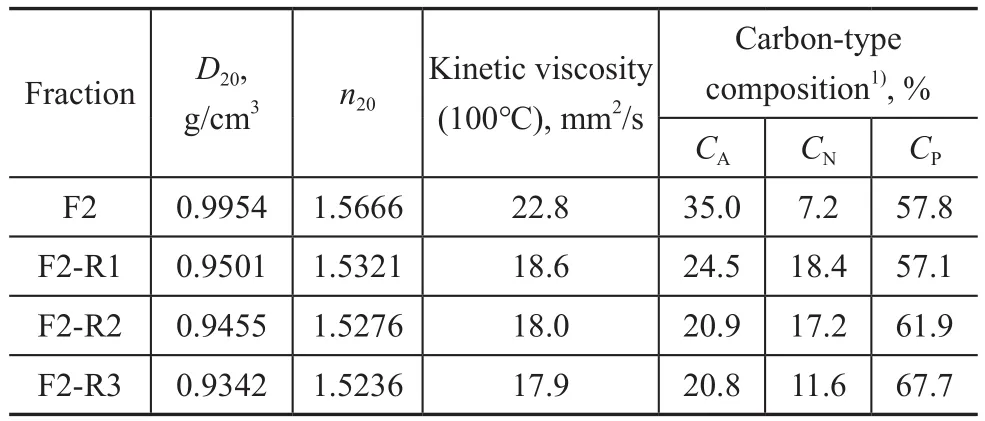
Table 2 Experimental results for the secondary solvent extraction experiments of paraffinic furfural-extract oils[3](F: feed, R: raffinate)

The pseudo‐component properties calculated from the experimental data are listed in Table 4.To check the accuracy of this method, deviations of predictions were calculated by means of the average absolute deviation(AAD) and the maximum absolute deviation (MAD).
When Eq.(3) was used for the prediction ofn20, the value of objective function could be lower if the FRI value was not limited.But the value of FRI in this case was negative, which was not reasonable, so it was not considered.Then20value of pseudo‐component obtained by using Eq.(3) and presented in Table 4 was under the limitations of 1>FRI>0 and FRIP>FRIA>FRIS(as shown in reference[11]).It was worth noting that deviations ofn20were obviously larger than those obtained by using Eq.(2),when Eq.(3) proposed by Espada, et al.[11]was employed.This was inconsistent with results obtained by Espada,et al.[11], which might be ascribed to different origins andattributes of the studied oils.The average absolute deviations ofD20andn20using mixing rules of Eq.(1) and Eq.(2) were 0.0025 g/cm3and 0.0028, respectively.It was reported that AAD deviations ofD20andn20obtained for LND (light neutral distillate) fractions (withT50%= 717 K) during the one‐stage solvent extraction with furfural by the pseudo‐component approach were 0.0038 g/cm3and 0.0026, respectively[11].While theT50%of the studied paraffinic feedstock in this work was 715 K, it can be observed that AAD deviations were very close, indicating that the pseudo‐component approach was also accurate for furfural + furfural‐extract paraffinic oil systems.

Table 3 Experimental results for the two-stage solvent extraction experiments of naphthenic lubricating oils[4]considered in this work (F: feed, R: raffinate, E: extract)

Table 4 Optimized pseudo-component properties of paraffinic oils and deviations
3.1.2 Correlations between density and refractive index (or FRI)
As the composition of mixtures is not always accessible,it is necessary to examine several correlations between density and refractive index (or FRI) and to assess the accuracy of different correlations.D20andn20values of the studied paraffinic mixtures in Table 1 and Table 2 were all calculated by several correlations.These correlations[13‐15]can directly relateD20andn20(or FRI20), which means that the data of density or refractive index are needed for their application.Results forD20andn20predictions obtained by applying these correlations were compared with the experimental values, as shown in Figure 1.As forD20predictions, the calculated values obtained by correlations of Angle, et al.[13]were apparently lower than the experimental values.And the use of a function of refractive index (FRI20) for Eq.(6) could improve the predictions as compared to those obtained by Eq.(5).Predictions obtained by Khan’s correlation[14]showed discrepancies with respect to the experimental values.Clear deviations of Khan’s correlation were observed for both low‐density and high‐density mixtures.However,the quadratic correlation developed by Yarranton, et al.[15]presented good agreement between the calculated and the experimentalD20values, although slight deviations were detected in lowD20values.The results revealed that linear correlation ofD20-n20(or FRI20) was not satisfactory and the quadratic relationship betweenD20and FRI20was suitable for the studied paraffinic mixtures during the secondary solvent extraction.
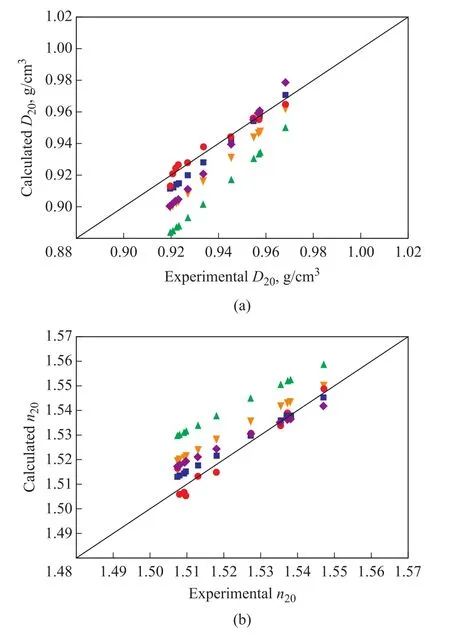
Figure 1 Comparison of experimental and calculated D20 (a)and n20 (b) values for paraffinic oils
On the other hand, predictions ofn20values were obtained by Angle, et al.The correlation results[13]were obviously higher than the experimental values.Similarly,predictions by using FRI20for Angle, et al.correlations were superior to those by usingn20.Predictions ofn20by using Khan’s correlation[14]showed clear discrepancies with respect to the experimental values.As in the case of density, deviations ofn20were the lowest for the quadratic correlation[15].Predictions ofn20values obtained by the quadratic correlation also displayed good agreement with the experimental values for the analyzed mixtures.
The quadratic correlation proposed by Yarranton, et al.was previously employed by Espada, et al.[11]for predictingD20andn20values of vacuum distillates during the one‐stage solvent extraction process in their work,revealing the suitability of the quadratic relationship betweenD20and FRI20for furfural + lubricating oil systems.This work further extended the application of the quadratic correlation, verifying the accuracy forpredictingD20andn20values in furfural + furfural‐extract paraffinic oil systems.
Deviations (AAD and MAD) ofD20andn20predictions obtained by the correlations are shown in Table 5.The highest deviations were observed for correlation proposed by Angle, et al., which could linearly relate toD20-n20.Correlation proposed by Angle, et al.[13], which could relate toD20-n20, and Khan’s correlation[14]showed similar deviations.Deviations obtained by equations of Yarranton, et al.[15]were obviously lower than those achieved by the rest of correlations.The deviations AAD obtained by equations of Yarranton, et al.for predictions ofD20andn20values were 0.0041 g/cm3and 0.0026,respectively.The results further confirmed the suitability of the quadratic relationship betweenD20and FRI20for the studied paraffinic mixtures during secondary solvent extraction with furfural.
3.1.3 Comparison of the pseudo-component approach and the quadratic correlation
It can be seen that the quadratic relationship suggested by Yarranton, et al.was also suitable for predictingD20andn20values in furfural + furfural‐extract paraffinic oil systems.Therefore, both the pseudo‐component approach and the quadratic correlation were tested on the experimental data presented in Table 1.The comparison between predictions of both methods and experimental values is shown in Figure 2.The calculatedD20andn20values obtained by both methods exhibited good agreement with the experimental values.Predictions yielded by the pseudo‐component method were slightly superior to the quadratic correlation, especially for mixtures having lower density and refractive index.
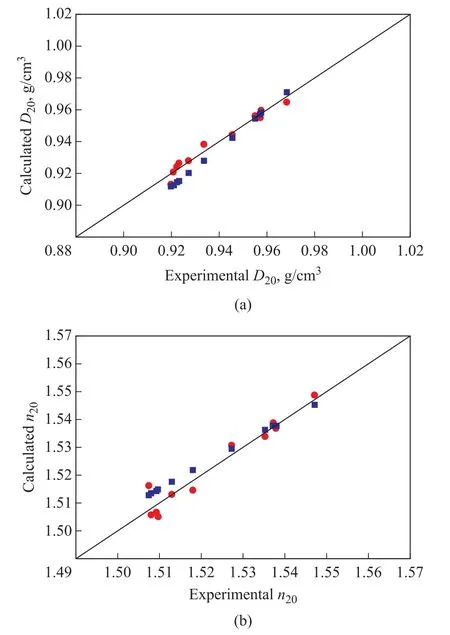
Figure 2 Comparison of experimental[2] and calculated D20(a) and n20 (b) values for paraffinic oils
Deviations (AAD and MAD) ofD20andn20predictions obtained by both methods are summarized in Table 6.The results further proved that the pseudo‐component approach predicted slightly more accurately than the quadratic correlation suggested by Yarranton, et al.However, it must be noted that deviations obtained by the pseudo‐component approach and the quadratic correlation were both acceptable for estimation of the density and refractive index in furfural + furfural‐extract paraffinic oil systems.Due to a lack of experimental data for paraffinic lubricating oils treated during secondary solvent extraction process, the comparison results of the above mentioned two methods for paraffinic distillates during the one‐stage solvent refining reported in literature[11]were used as the reference.In their work, similar accuracy for LND (light neutral distillate,T50%= 717 K) and MND(medium neutral distillate,T50%= 745 K) experiments was observed, while a slightly superior accuracy yielded by equations of Yarranton, et al.was found for SPD (spindle distillate,T50%= 651 K) fractions.Overall, the pseudo‐component method yielded predictions ofD20andn20similar to those ones obtained by equations of Yarranton,et al.during the one‐stage solvent refining of paraffinic lubricating oils, which was also validated in this work for paraffinic lubricating oils treated during the secondary solvent extraction process.

Table 5 Average absolute deviations (AAD) and maximum absolute deviations (MAD) of D20 and n20 predictions for paraffinic oils obtained by the considered correlation methods

Table 6 Average absolute deviations (AAD) and maximum absolute deviations (MAD) of D20 and n20 predictions for paraffinic oils obtained by pseudo-component method and equations of Yarranton, et al.
3.2 Prediction of density and refractive index for naphthenic oils
It can be concluded from the above‐mentioned results that the quadratic correlation proposed by Yarranton,et al.was suitable for the prediction of density and refractive index in furfural +furfural‐extract paraffinic oil systems.Yet whether the quadratic correlation is suitable for naphthenic oils during the two‐stage solvent refining processes remains unknown.Thus the validity of the quadratic correlation for predictions of density and refractive index of naphthenic oils during the two‐stage solvent extraction processes was tested on the experimental data presented in Table 3.
In order to analyze the reliability of the quadratic correlation, predictions ofD20andn20were compared to the experimental values regarding the mixture type(naphthenic oils and paraffinic oils), as depicted in Figure 3.Predictions for naphthenic oils displayed obviously larger deviations from experimental values than paraffinic oils, except for the highestD20andn20values corresponding to the primary extract of vacuum distillate.It can be seen from Table 3 that the percentage of naphthenic carbons (CN) for primary extract (F3‐E1)with a value of 22.1% was apparently lower than the rest of samples.The results indicated that the correlation was less accurate for predictingD20andn20values of the studied naphthenic oils.
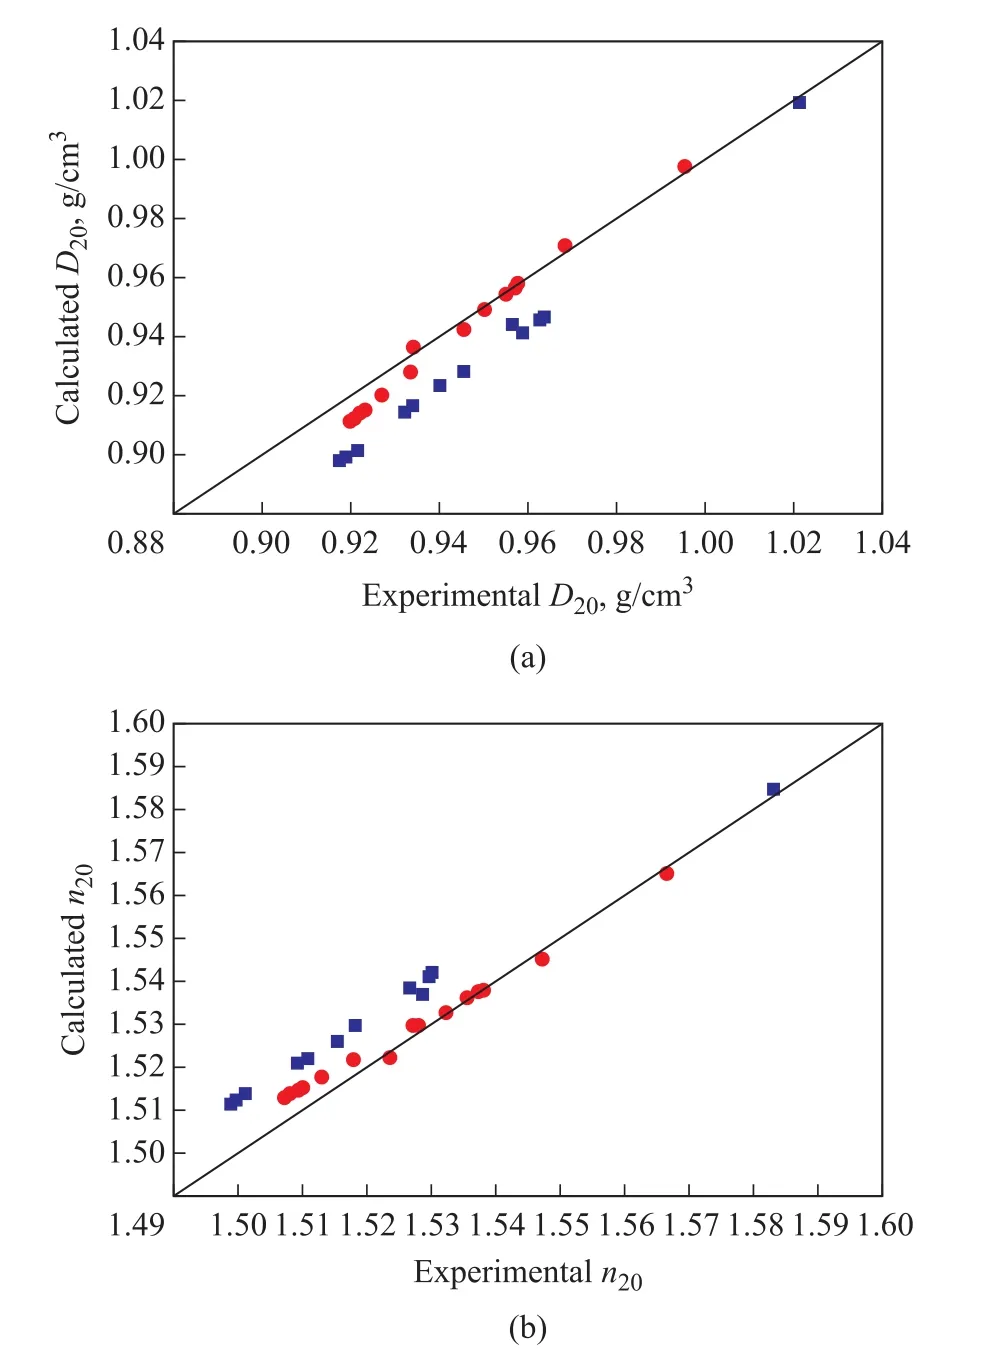
Figure 3 Comparison of experimental and calculated values of D20 (a) and n20 (b) for naphthenic oils and paraffinic oils
Deviations of predictions for naphthenic oils during the two‐stage solvent extraction experiments shown in Table 7 illustrated that AAD of the quadratic correlation for prediction ofD20andn20values was 0.0163 g/cm3and 0.0107, respectively.The obtained predictions would cause an even larger error if they were employed to determine other properties.Therefore, the quadratic correlation was not suitable for naphthenic oils during the two‐stage solvent extraction experiments.The quadratic correlation may be further modified for naphthenic oils,which needs a large amount of data.It can be seen from Table 1 and Table 2 that the highestCNvalue for the studied paraffinic oils was 35.4%.As shown in Table 3,the lowestCNvalue for the studied naphthenic oils except the primary extract (F3‐E1) was 37.2%.Therefore, it could be tentatively inferred that the quadratic correlation suggested by Yarranton, et al.was suitable for oils with aCNvalue of lower than 37%, which would more likely be suited to paraffinic oils.

Table 7 Average absolute deviations (AAD) and maximum absolute deviations (MAD) of D20 and n20 predictions for paraffinic[2-3] and naphthenic oils[4] obtained by equations of Yarranton, et al.
As the experimental data for lubricating oils treated during the secondary solvent extraction process were limited,several datasets regarding vacuum distillates treated during the one‐stage solvent extraction of naphthenic oils[18]and paraffinic oils[19]were also considered.Moreover, the experimental data including paraffinic and naphthenic lubricant base oils reported in the literature[20]were introduced for further eliminating the randomness of data.Based on the data from literature[2‐4,18‐20], the relative errors ofD20andn20derived from equations of Yarranton,et al.versusCNvalues of oils were plotted respectively, as shown in Figure 4(a) and Figure 4(b).It can be seen that the overall trend indicated that the relative errors ofD20andn20both increased with an increasingCNvalue, which further verified the statement that the quadratic correlation suggested by Yarranton, et al.was more suitable for paraffinic oils with lowerCNvalues.The relative errors forD20values ranged from 0.02% to 2.36%, whereas the relative errors ofn20values were in the range of 0.003%‒1.01%.TheCNvalue of oils was approximately 37%, when the relative errors were about half of the highest errors forD20andn20values.
For further exploring the reason why the relationship betweenD20andn20values of naphthenic oils was not in good agreement with the quadratic correlation, density and refractive index values of pure hydrocarbons reported in previous literature[15,21], the results predicted by the quadratic correlation are shown in Figure 5(a) and Figure 5(b) for paraffins, monocyclic naphthenes, monocyclic aromatics, condensed ring naphthenes, and condensed ring aromatics, respectively.
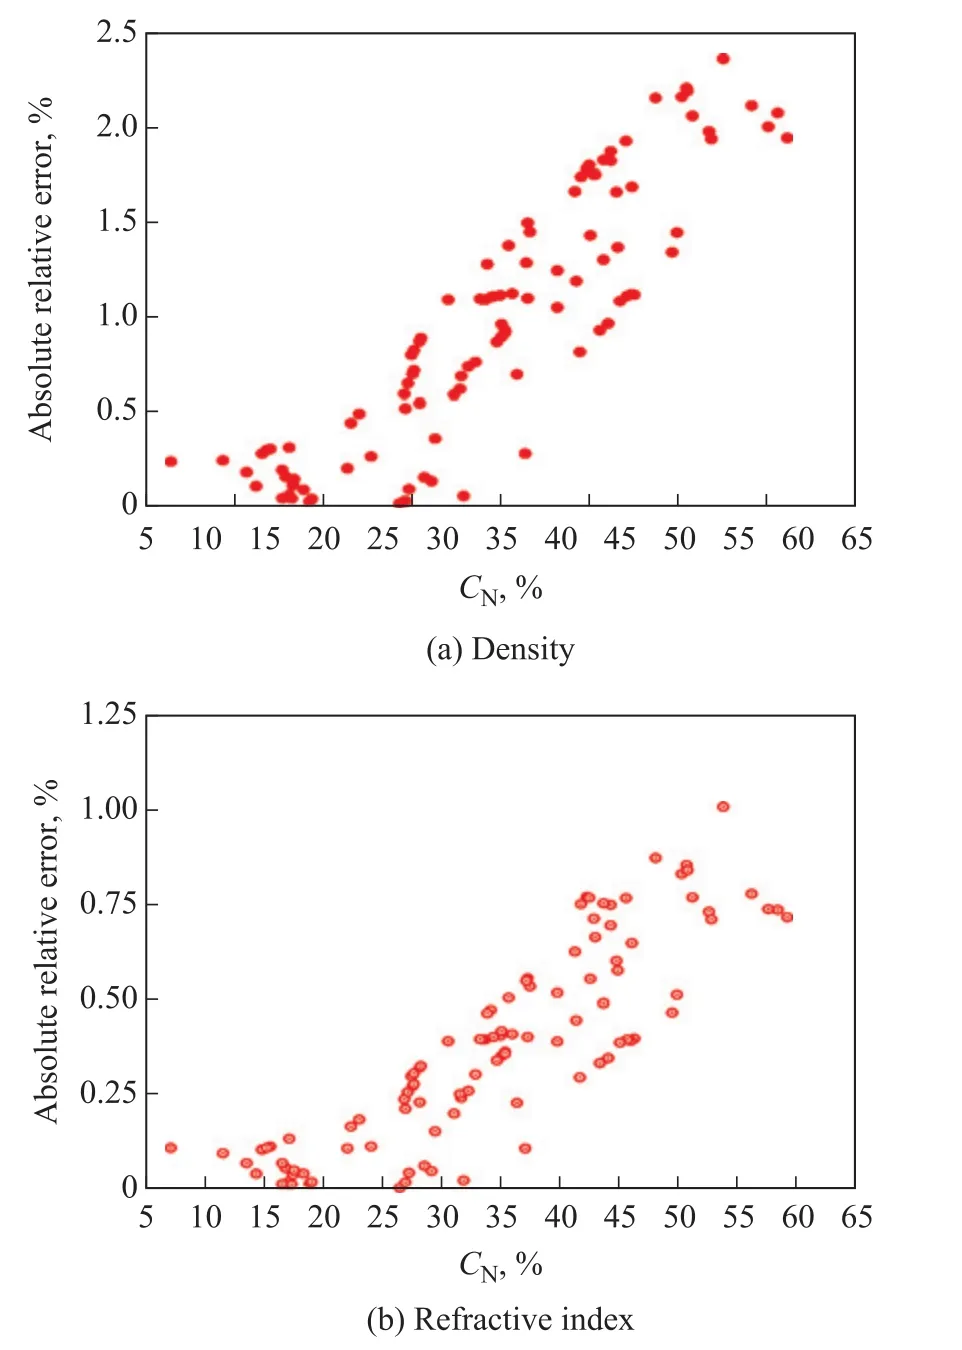
Figure 4 Absolute relative errors of D20 (a) and n20 (b) derived from equations of Yarranton et al.versus CN values of oils
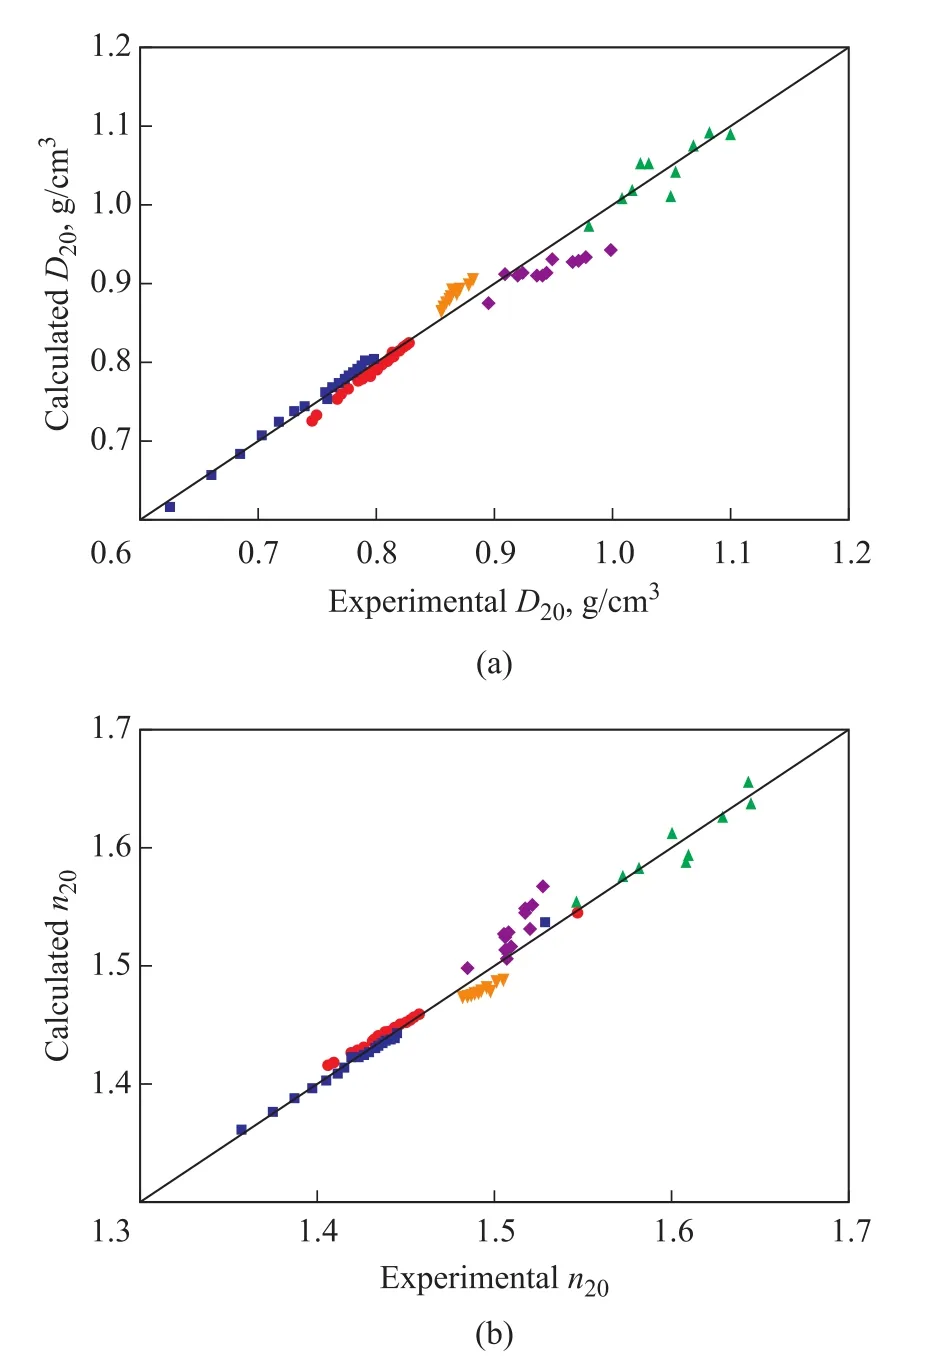
Figure 5 Comparison of experimental and calculated values of D20 (a) and n20 (b) for various pure hydrocarbons(paraffins, monocyclic naphthenes, monocyclic aromatics,condensed ring naphthenes, and condensed ring aromatics)
As regards theD20predictions, the density predictions of monocyclic and condensed ring naphthenes both underestimated the experimental values, while theD20predictions of monocyclic aromatics were higher than the experimental data.Deviations of condensed ring naphthenes were the largest followed by monocyclic aromatics, while the deviations of paraffins were the lowest.For paraffinic vacuum distillates, the deviations of naphthenes would be partially offset by aromatics(especially monocyclic aromatics), which resulted in excellent prediction results by the quadratic correlation.However, there are significant amounts of condensed ring naphthenes in naphthenic vacuum distillates.And it has been reported that the content of naphthenes with the number of rings being no less than two in naphthenic vacuum distillates were much higher than that in paraffinic vacuum distillates[22].So deviations of condensed ring naphthenes predominated for naphthenic oils.Similar analysis could be obtained forn20predictions.Therefore,the higher concentration of condensed ring naphthenes in naphthenic oils caused the larger deviations obtained by the quadratic correlation.
4 Conclusions
With regard to furfural + furfural‐extract paraffinic oilsystems, predictions of density and refractive index obtained by the pseudo‐component approach were similar to those ones yielded by the quadratic correlation, which were both in good agreement with the experimental data.Without the knowledge of composition, the quadratic correlation presents its advantage over the pseudo‐component approach, as it only needs data on one of the properties (density or refractive index).
However, predictions of density and refractive index for naphthenic oils processed during the two‐stage solvent extraction experiments obtained by the quadratic correlation presented obviously larger discrepancies as compared to the experimental values.Therefore, it was tentatively suggested that the quadratic correlation was more suitable for paraffinic oils with aCNvalue of lower than 37%.A series of data including paraffinic and naphthenic lubricant oils proved that deviations ofD20andn20values yielded by the quadratic correlation increased with the increase ofCNvalues.The larger deviations obtained by the quadratic correlation for naphthenic oils were probably attributed to the higher content of condensed ring naphthenes.
杂志排行
中国炼油与石油化工的其它文章
- Controlling the Pore Structure and Photocatalytic Performance of the Flexible FeⅢ Metal-Organic Framework MIL-53(Fe) by Using Surfactants
- Acidity Evaluation of Industrially Dealuminated Y Zeolite via Methylcyclohexane Transformation
- Study on Distribution of Electrocatalytic Reaction Efficiency in a Three-Dimensional Electrocatalytic Reactor
- Preparation of Ultra-High Molecular Weight Polypropylene Using Ziegler-Natta Catalyst via Combining Internal Electron Donor and Cocatalyst Loading
- Preparation of Modified Enteromorpha-Immobilized Microbial Agent and Research on Diesel Removal Performance
- Chemoselective Catalytic Hydrogenation of Nitroarenes Using MOF-Derived Graphitic Carbon Layers Encapsulated Ni Catalysts
