Experimental study on age and gender differences in microscopic movement characteristics of students∗
2021-09-28JiayueWang王嘉悦MaikBoltesArminSeyfriedAntoineTordeuxJunZhang张俊andWenguoWeng翁文国
Jiayue Wang(王嘉悦),Maik Boltes,Armin Seyfried,5,Antoine Tordeux,Jun Zhang(张俊),and Wenguo Weng(翁文国)
1Public Order School,People’s Public Security University of China,Beijing 100038,China
2Center for Capital Social Safety,People’s Public Security University of China,Beijing 100038,China
3Public Security Behavioral Science Laboratory,People’s Public Security University of China,Beijing 100038,China
4Institute for Advanced Simulation,Forschungszentrum J¨ulich,J¨ulich 52428,Germany
5Faculty of Architecture and Civil Engineering,University of Wuppertal,Wuppertal 42119,Germany
6School of Mechanical Engineering and Safety Engineering,University of Wuppertal,Wuppertal 42119,Germany
7State Key Laboratory of Fire Science,University of Science and Technology of China,Hefei 230026,China
8Institute of Public Safety Research,Department of Engineering Physics,Tsinghua University,Beijing 100084,China
Keywords:campus security,microscopic movement characteristics,pedestrian dynamics,single-file movement experiments
1.Introduction
Campus security has aroused many concerns from the whole society.Stampede is one of the most frequent and influential accidents in campus.The study on pedestrian dynamics is essential for the design of pedestrian infrastructure and safety evacuation,which is closely related to campus security.However,pedestrian behavior is extremely complex and is influenced by many factors,including individuals’physical features,psychological characteristics,architecture,environment,pedestrian traffic factors,social factors,and so on.Each aspect contains multiple variables.For example,individuals’physical features contain age,gender,height,body stature,health,et al.It is a sophisticated system,as shown in Fig.1.To investigate the effects of different factors on pedestrian behavior can help to understand pedestrian heterogeneity and some crowd movement phenomena.This paper will pay attention to the influence of age and gender on students’movement characteristics,aiming to contribute to campus security.
One main pedestrian movement feature is walking speed.It is reported that age and gender may affect the walking speed of pedestrians.[1–5]Results have been reported in several statistical values,such as mean speed,specific percentile values and the variation.Comparing the mean speed,adults walk faster than elderly in crosswalks[2,6–11]and sidewalks.[12,13]For safer designs,the 15th percentile walking speed is a better criterion than the mean value.The 15th percentile walking speed of older pedestrians is statistically smaller than the 15th percentile speed of younger pedestrians.[2,9–11]Willis et al.[13]found that the variation in speed is higher for children than for those older than 25 including the elderly.Himann et al.[14]found that the walking speed declines in a cubic way with age ranging from 19 to 102 based on the experiments conducted at an 80 m indoor course.In the age interval of 3 to 80,the walking speed first rises up before 20 years old and then drops down with the increasing age.[1,15]
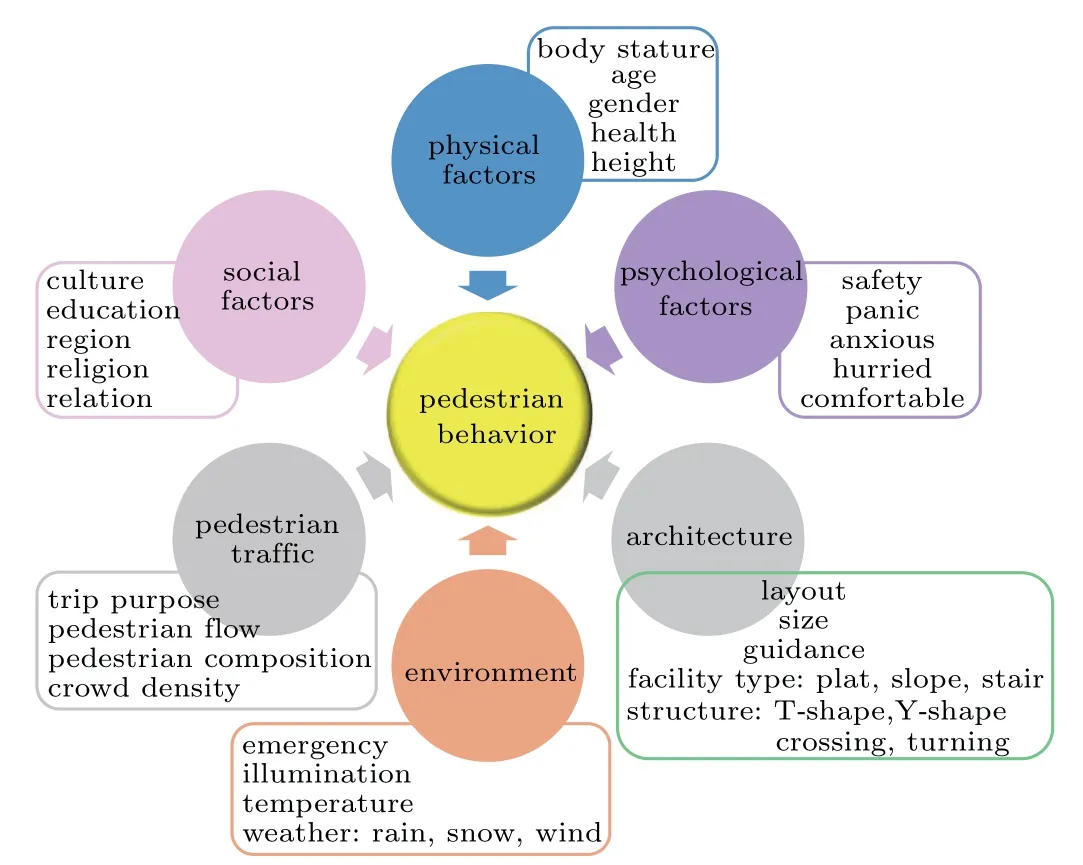
Fig.1.Influencing factors of pedestrian behaviors.
With respect to the effect of gender on free-flow speed,males have larger values than females both on sidewalks[12,13,16,17]and on off-road conditions[18,19]Siddharth and Vedagiri[20]investigated the effect of gender on walking speeds of pedestrians in the bi-directional sidewalk.It was found that male pedestrians had larger averaged speed than females.Huo et al.[21]analyzed pedestrian speed during stair descent and found that male pedestrians walked faster than female pedestrians.The differences in speed between males and females under no grouping were greater than those under grouping.Males have higher variations in speed than females.[13]The function between walking speed and age was influenced by gender for three different paces.[14]Montufar et al.[22]collected normal and crossing walking speed of older and younger pedestrians and investigated effect of gender on walking speed.Whether normal or crossing walking speed,females had smaller average walking speed and 15th percentile speed than males,regardless of age.However,other researches showed that the impact of gender on walking speed changes under the influence of age.[23]Fitzpatrick et al.[2]compared the 15th percentile and 50th percentile walking speed of old group between males and females.No statistical difference was found.The same conclusion was made in the 15th percentile walking speed of young pedestrians.However,for the young group females had smaller 50th percentile walking speed than males.
Age and gender also affect gait characteristics(step lengths,step frequencies and swaying amplitudes)of pedestrians.Significant differences in averaged step length and step frequency between different age groups were found.The youngest group has the smallest mean step length and the largest mean step frequency.[24]Himann et al.[14]found that the step length shows a curvilinear decline with increasing age,whereas step frequency declines linearly with the increasing age.Some studies showed that gender had effect on gait parameters.Hediyeh[24]found that differences in step frequencies between males and females were significant at all speeds,but differences in step lengths between males and females were significant only at speeds greater than 1.2 m/s.Versluis[19]found that men had larger step length than women in unhindered walking no matter at normal pace or hurry pace.However,men walked with a lower step frequency on average,implied that men have to put their weight on one leg for a longer time period than women.They need to shift themselves perpendicular to the walking direction more than women,agreed with the finding that men walked with larger swaying amplitude than women.In addition,the effect of gender on gait characteristics may be affected by other factors,like speed and age.Hediyeh[24]showed that when men and women walked slower than 1.2 m/s,their step lengths were similar.The difference in step frequency between men and women was smaller when they walked at hurry pace.[19]The effect of gender on gait characteristics reduced with the increasing age.[14]
The above discussions show that some findings about the effects of age and gender on pedestrian movement characteristics are inconsistent.For this reason,experiments of pedestrian single-file movement have been conducted,involving subjects in different age and gender.The second part shows the detailed description about the experiments and data processing methods.In the third part,the differences in pedestrian movement characteristics between different age groups and different gender groups are analyzed.In the last part,some conclusions are presented.
2.Experiments and methods
In this section,the detailed description about single-file experiments involving primary and middle school students is presented.Data processing methods are stated,including how to get pedestrian microscopic movement characteristics based on the experiments and how to get independent data to conduct comparative analysis.
2.1.Experiments
To study the influence of age and gender on pedestrian movement,92 students in different age and gender were recruited to participate in two sets of single-file experiments.39 primary school students including 22 males and 17 females participated in the first set of experiments.They are 11 years old and at the same grade.12 runs were performed on an ovallike path(see Fig.2)with different numbers of participants ranging from 6 to 29(see Table 1).The participants in eachrun were selected randomly.They were instructed to walk simultaneously and not to overtake each other.Each participant walked at least one circle of the path at a normal pace,which is comprised of two straight parts(l=2.5 m)and two semi-circle parts(the diameter of the inner line is d=2.9 m).The width of the path was set as 0.8 m.In this condition,only one participant could pass through the path and overtaking behavior or walking side-by-side could be avoided.Besides,each participant could keep a comfortable distance to the boundaries of the path.In the second set,53 middle school students aged 16 participated,including 34 males and 19 females.All of them were at the same grade.11 runs involving up to 25 middle school students were performed on the same path(see Table 2)and given the same instruction.The experiments were recorded by a camera with a frame rate of 25 frames per second installed on the ceiling.The trajectories of subjects were extracted by tracking the head of each subject via PeTrack.[25,26]
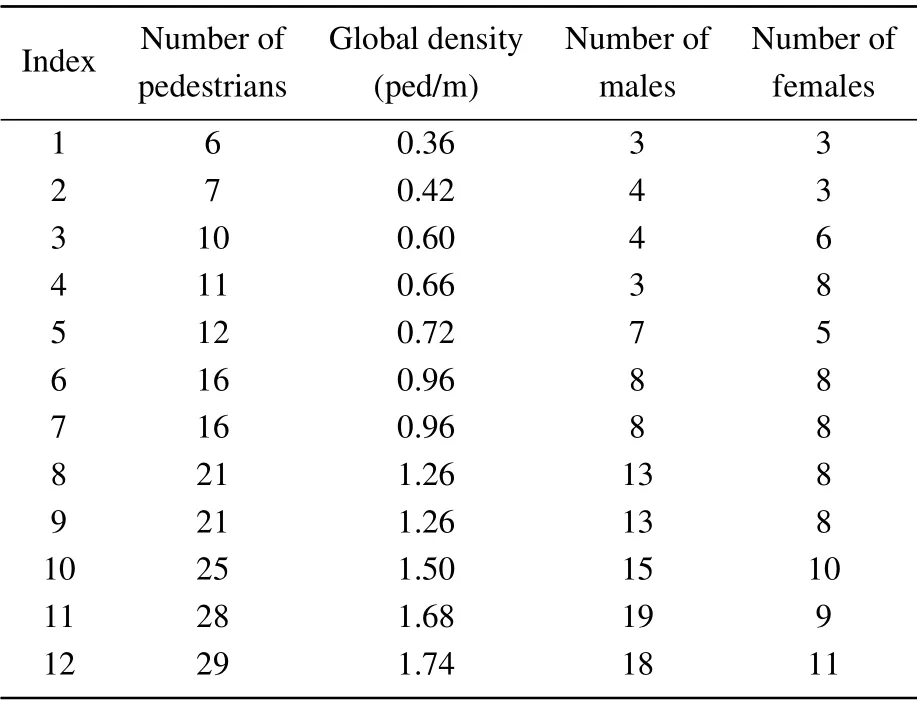
Table 1.Experiments of primary school students aged 11.

Table 2.Experiments of middle school students aged 16.
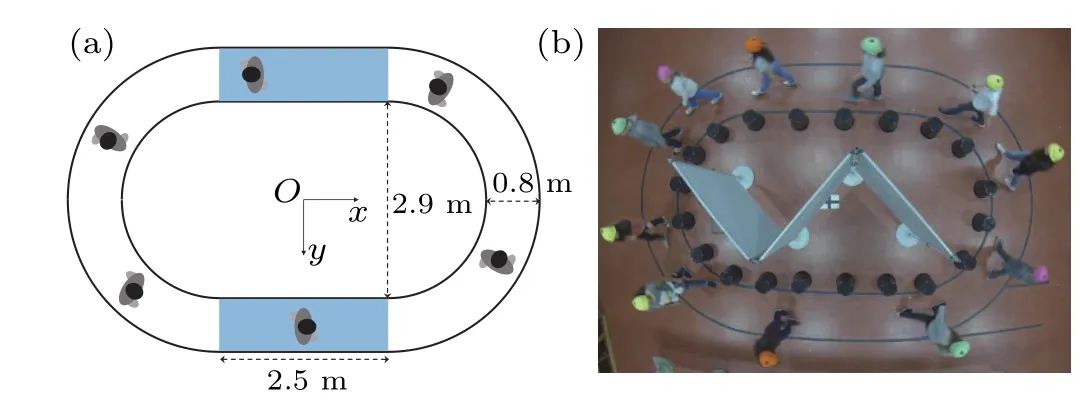
Fig.2.Experimental setup.The path composed of two straight parts(l=2.5 m)and two semi-circle parts(the diameter of the inner line is d=2.9 m)has a width of 0.8 m.The blue rectangles indicate the straight parts.
2.2.Data processing
Step length,swaying amplitude and step frequency are three main parameters of gait characteristics.Step length is the distance of one step in the walking direction.Swaying amplitude is the lateral oscillation when stepping.Step duration is the time for taking a step and its inverse is step frequency.When pedestrians take steps with their feet,their weights shift between right foot and left foot.Their bodies sway in a lateral direction.[19,27,28]Thus the trajectories of pedestrians oscillates like sine curve,based on which gait characteristics can be extracted(see Fig.3).Step length,swaying amplitude and step frequency are respectively corresponding to the horizontal distance,the vertical distance and the time interval between the peak and its nearest valley of trajectories in Fig.3.The detailed descriptions about the automatic identification method of stepping locomotion and measures of gait characteristics are shown in Refs.[29,30].Thus the headway,speed and gait characteristics(step length,step frequency and swaying amplitude)can be measured based on the trajectories of subjects.[29,30]
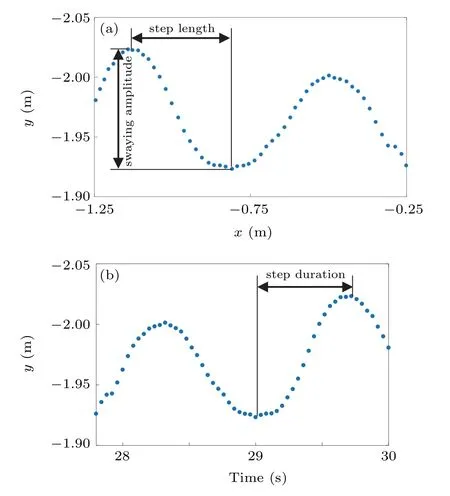
Fig.3.Illustrations of gait characteristics extracted based on the trajectory of one pedestrian.Blue dots indicates pedestrian positions from 27.8 s to 30 s.
To investigate whether gender and age have significant influence on microscopic movement characteristics,the observations should be statistically independent.The calculation of the autocorrelation,which is the correlation of a signal with a delayed copy of itself as a function of the delay,is adopted to obtain statistically independent observations.The interval with thresholds−0.1 and 0.1 is used for the decision whether the autocorrelation is significant.When the autocorrelation function(ACF)is inside the interval,the correlation is considered as not significant.The correlogram for a time lag ranging from 0 to 20 s for the observations on speed is presented in Fig.4(a).When the lag time is larger than 2.2 s,ACF is inside the range[−0.1,0.1]and the data can be accepted as being pseudo-independent.In this paper,the statistically independent observations for fundamental diagram are extracted every 3 s from the original data.Figure 4(b)shows the correlogram for the observations on step length.The lag ranges from 0 to 15 steps.When the lag is larger than 3 steps,the data can be accepted as being pseudo-independent.In this paper,the statistically independent observations for the analysis of gait characteristics are extracted as every 7 steps from the original data.
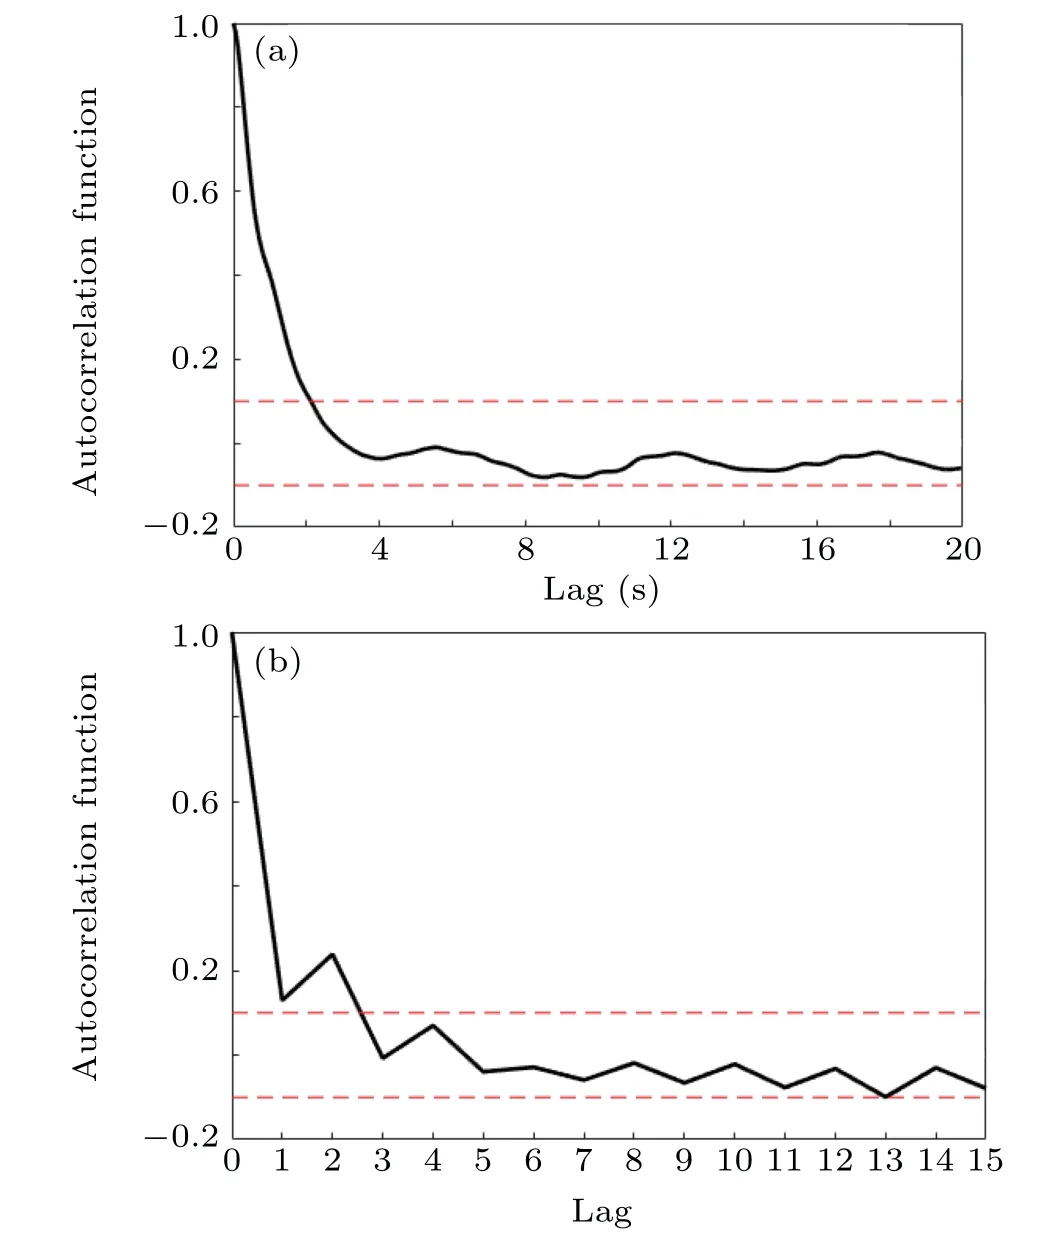
Fig.4.Correlograms for the observations on(a)speed for the time lag ranging from 0 to 20 s and(b)on step length for lags of 0 to 15 steps.
3.Results and discussion
In this section,the age and gender differences in microscopic movement characteristics of students were investigated by statistical tests.
3.1.Age and gender differences in headway-speed diagram and required space
Pedestrian walking speed is related with headway,indicating the available space for pedestrian movement.When the headway is large enough,pedestrians can have adequate space to freely move without limitation.They can walk as fast as they want,namely,at free-flow speed.As the headway reduces to a critical value,pedestrian moving state transitions from free to hindered.[31,32]Pedestrian walking speed decreases proportionally to headway.In summary,a piecewise linear function can be used to describe the relation between headway and speed,including an oblique line and a horizontal line:

where the x-intercept h0of the oblique line indicates the headway when v=0.It indicates pedestrians’least required distance to the preceding person,named stop space in this study.When the available distance is less than the stop space,pedestrians stop walking.heis the headway when the oblique line and horizontal line intersect,and it indicates the space where the speed is no longer influenced by the preceding pedestrian.If the available distance reaches he,the pedestrian movement is not limited by the available space anymore and pedestrians start to walk at free-flow speed v0.Therefore,heis the minimal required distance for pedestrians to walk at free-flow speed,named free-flow space in this study.
For the group at age 11,1376 and 1009 statistically independent observations are selected from male and female participants,respectively,based on autocorrelation(see Section 2),marked by black and pink points in Fig.5(a).In Fig.5(b),the blue and red points respectively indicate 2463 and 1251 statistically independent observations from males and females at age 16.Using these pseudo-independent observations,the headway-speed relations of different genders and ages are fitted with Eq.(1),shown in Fig.5 and Table 3.The one-tailed t-test is adopted for the comparison of the parameter estimates to check whether age and gender have significant influence.If the p-value of a one-tailed t-test is smaller than 0.05,significant difference is found between the two comparison objects at a significance level of 0.05.The results of the parameter estimates for group comparisons between different genders and ages are shown in Tables 3 and 4,respectively.
Figures 5(a),5(b)and Table 3 show the influence of gender.For the students aged 11,the stop space of males is larger than that of females.The main reason may be that males have larger body size(i.e.,shoulder breadth and chest depth)and they require more space to stand still.But compared with males,females have larger free-flow space possibly due to their strong desire to keep distance from others.Besides,there
is a situation where the headway of females is the same as the headway of males,referred to as equal space.So according to the stop space,free-flow space and equal space,there are three stages for the influence of gender on the headway.In the first stage,from the stop space to the equal space,males have larger space than females at the same speed mainly due to the physical factors like body size.The second stage is from the equal space to the free-flow space.Females keep larger distance from the preceding person than males at the same speed,maybe because in this stage psychological factors play the main role.For the third stage,the available space exceeds the free-flow space.Gender has no influence on personal space.In conclusion,personal space is not only influenced by physical factors like body size,but also by psychological factors.[33–35]Personal space due to physical factors is the most essential need.Only after it is satisfied do individuals attend to space arising from psychological needs.As the headway becomes larger,the available space is large enough to meet the space requirement caused by physical factor.Individuals start to pay more attention to psychological needs.Thus the influence of physical factors decreases while the impact of psychological factors increases.For the students aged 16,the same results can be obtained.With regard to the free-flow speed of students aged 11,males show a smaller value than females.However,for the students aged 16,the result inverses.Some possible reasons may be found in the fact that walking speed is obtained by making steps with a step length and a step frequency.[14,19,36]By analyzing the difference in step length and step frequency between different genders and ages(see Fig.6 and Table 4),this phenomenon may be explained.Using the best fitted functions for the dependencies of the step length and step frequency on speed(see Table 5),the step length and step frequency at free-flow speed can be estimated,as shown in Table 4.For students aged 11 at free-flow speed,females have larger step length and frequency than males.So the freeflow speed of females is larger than the one of males.However,for students aged 16 at free-flow speed,males have larger step length but smaller step frequency than females.The increase in the free-flow speed is mainly due to the rise in step length which is influenced by the body height.[37]
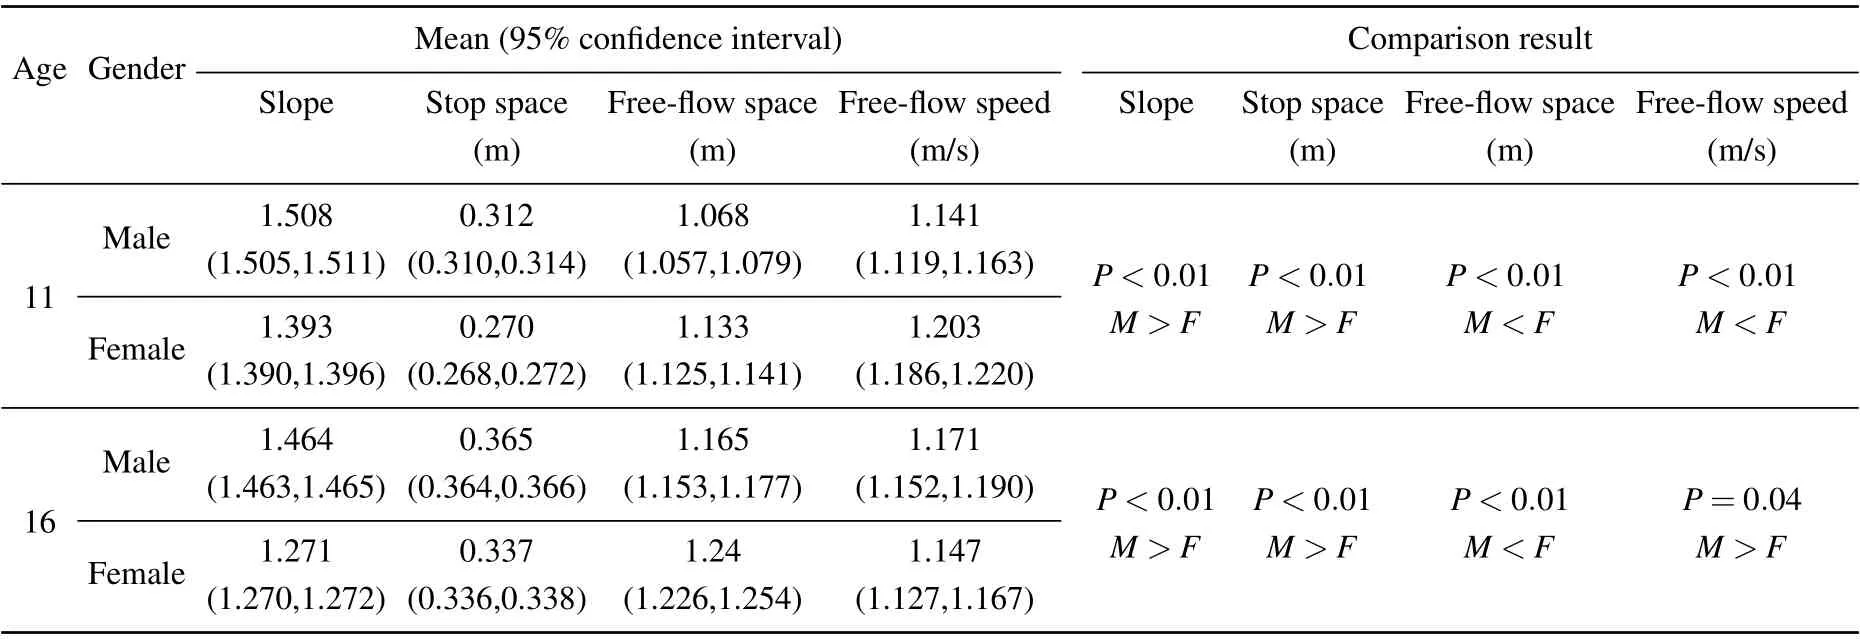
Table 3.The fitting results of headway-speed relation and comparison between different genders.

Table 4.The comparison of headway-speed relation between different ages.
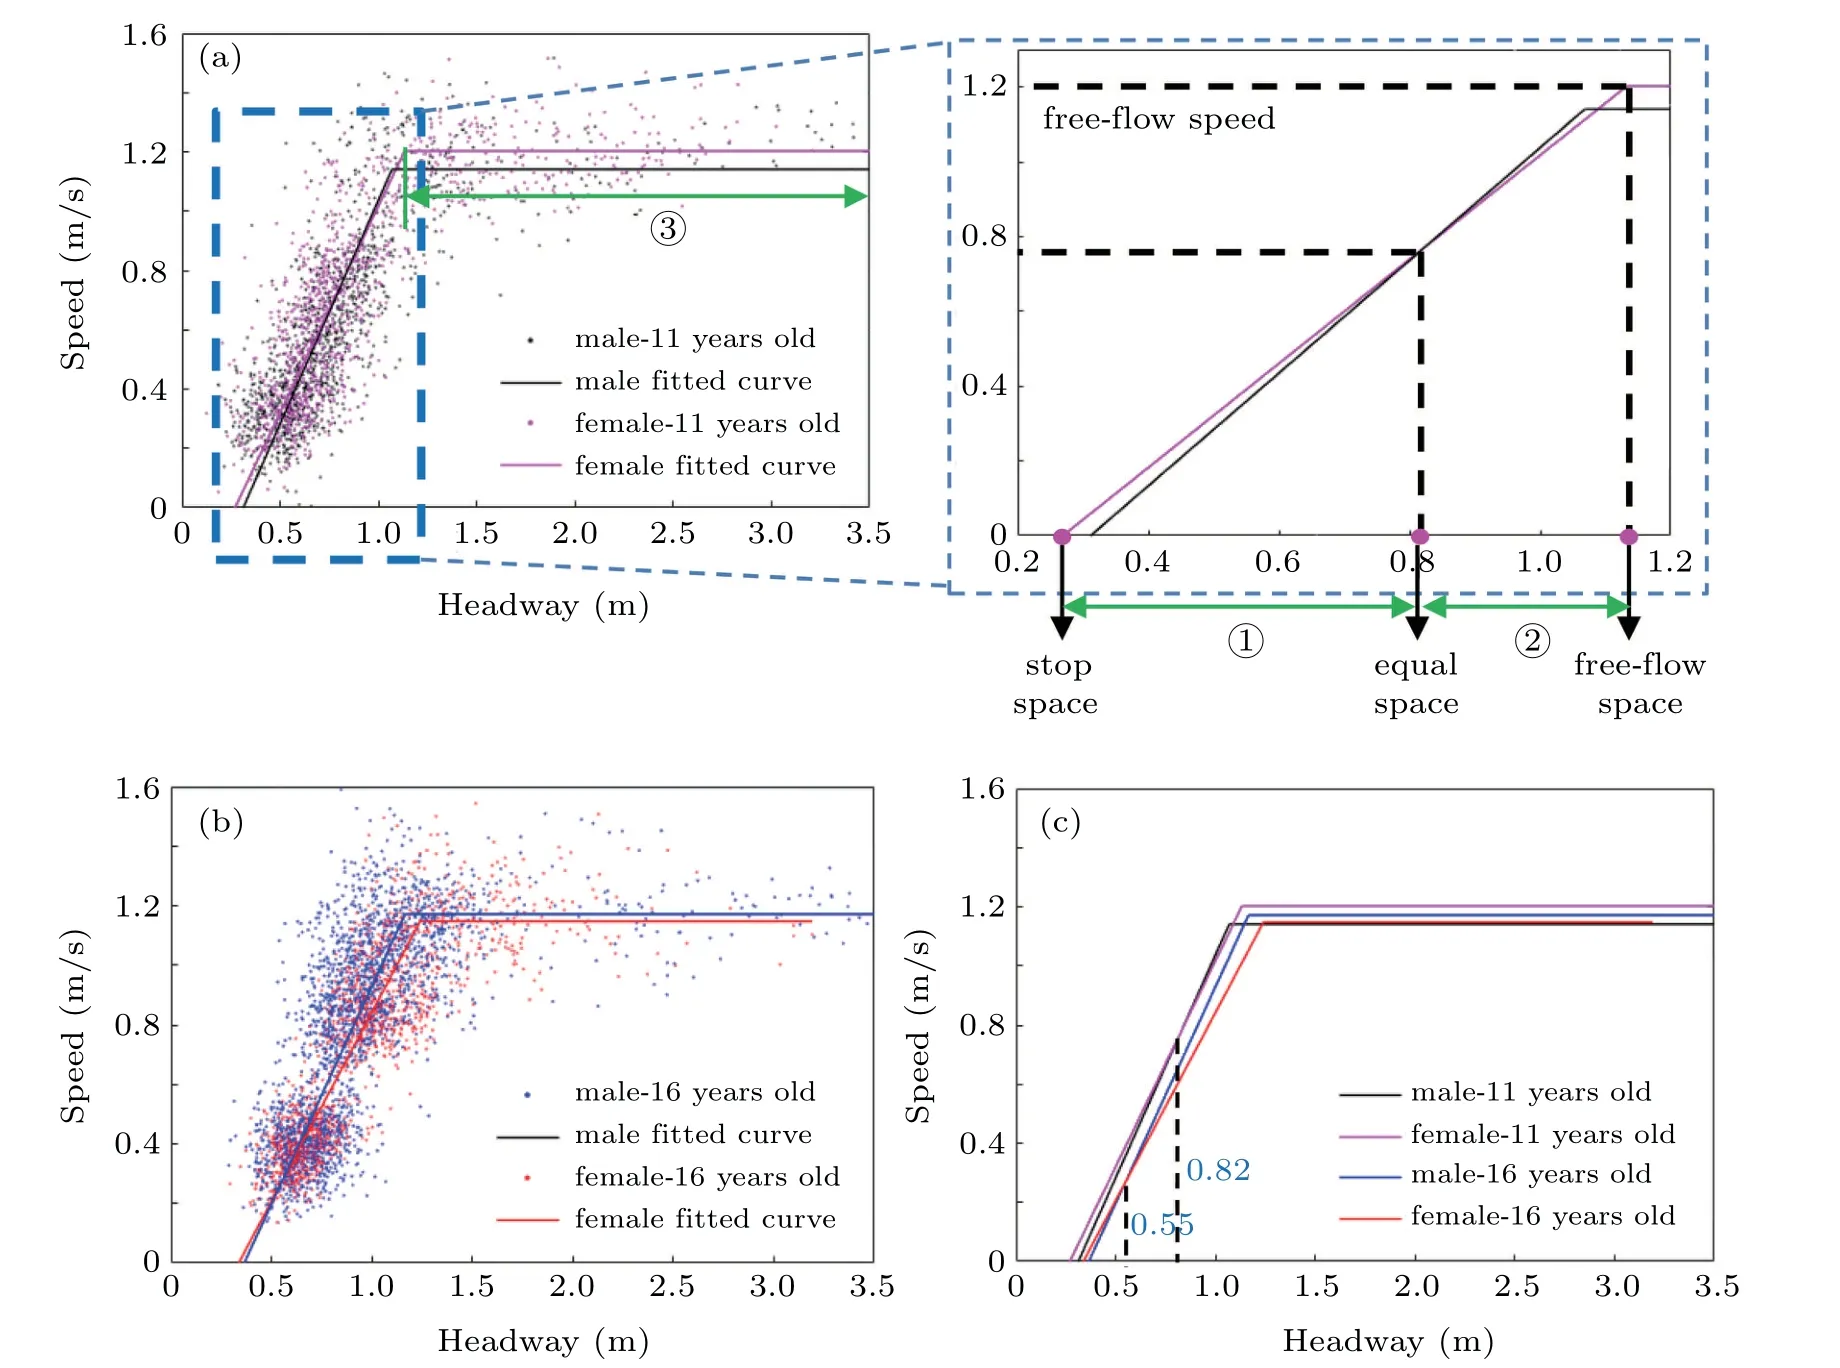
Fig.5.The relation between headway and speed for(a)students aged 11 and(b)students aged 16.The relation is fitted by a piecewise linear function.The statistically independent data and fitting results from different genders and ages are marked with different colors.On the right of(a),a cropped and enlarged sketch from the area marked by a rectangle is shown to illustrate the two important points for personal space(named stop space and free-flow space)and the condition where males and females have equal headway.(c)The combination of the fitted curves in(a)and(b)to show the difference in headway-speed curves between different age groups more clearly.
For the influence of age,students aged 16 always require more space than students aged 11 no matter if males or females(see Fig.5(c)and Table 4).This is because as age increases,both physical and psychological requirement for space rises up.The equal space for students at the age of 11 is 0.82 m,and therefore larger than the one of the 16 age group,0.55 m.This indicates that for the older group,psychological factors play a larger role with respect to personal space.For free-flow speed,the influence of age differs with gender.For males,the group of age 11 has smaller free-flow speed than the older group.For females,the comparison result is inverse.Females aged 11 have larger free-flow speed than females aged 16.This can be explained by the step length and step frequency at free-flow speed shown in Table 4.For both,males and females,students aged 16 have larger step length but smaller step frequency than the younger group.However,males show a larger difference(increasing)in step length between the two age groups than females,whereas step frequency of females decreases more with increasing age than step frequency of males.Therefore in our experiments,as age increases,a rise in the free-flow speed of males is mainly due to the growth of step length.However,for females the greater decrease in step frequency mainly determines the reduction of the free-flow speed.
3.2.Age and gender differences in gait characteristics
The natural process of human locomotion is stepwise.[38]The choice of the walking speed is a function of the step length and the step frequency.[14,39]Thus the study on the relation between speed and step length or step frequency helps to understand how pedestrians walk.By now,there are mainly two kinds of functions to describe it,namely the linear function and the power function.Some studies state that the step length changes with speed in a linear fashion under free-flow condition.[1,38,40–42]But the experiments presented here are conducted under congested condition.Jeli´c et al.[43]described the relation as linear based on pedestrian single-file movement experiments.However,the step duration is mostly constant when the speed is larger than 0.6 m/s.This is inconsistent with the experimental data in this study by visual inspection of Fig.6.In Fig.6,both step length and step frequency rise up with increasing speed.It indicates that pedestrians in the experiments speed up not only by increasing their step length but also by increasing the step frequency.Thus the power function is adopted to describe the relations quantitatively(see Fig.6),in accordance with Refs.[27,37].The fitting results of different genders and ages are presented in Table 5.It is known that the interdependence among step length s,step frequency f and speed v is

Under this condition,the parameters of step length-speed relation s=avband step frequency-speed relation f=mvnshould meet the following equations:

For the estimated parameters,the absolute errors of a·m and b+n are smaller than 0.02 and 0.10,respectively(see Table 5),showing a good fit.

Table 5.The fitting results of the relation between gait characteristics and speed using the power function.
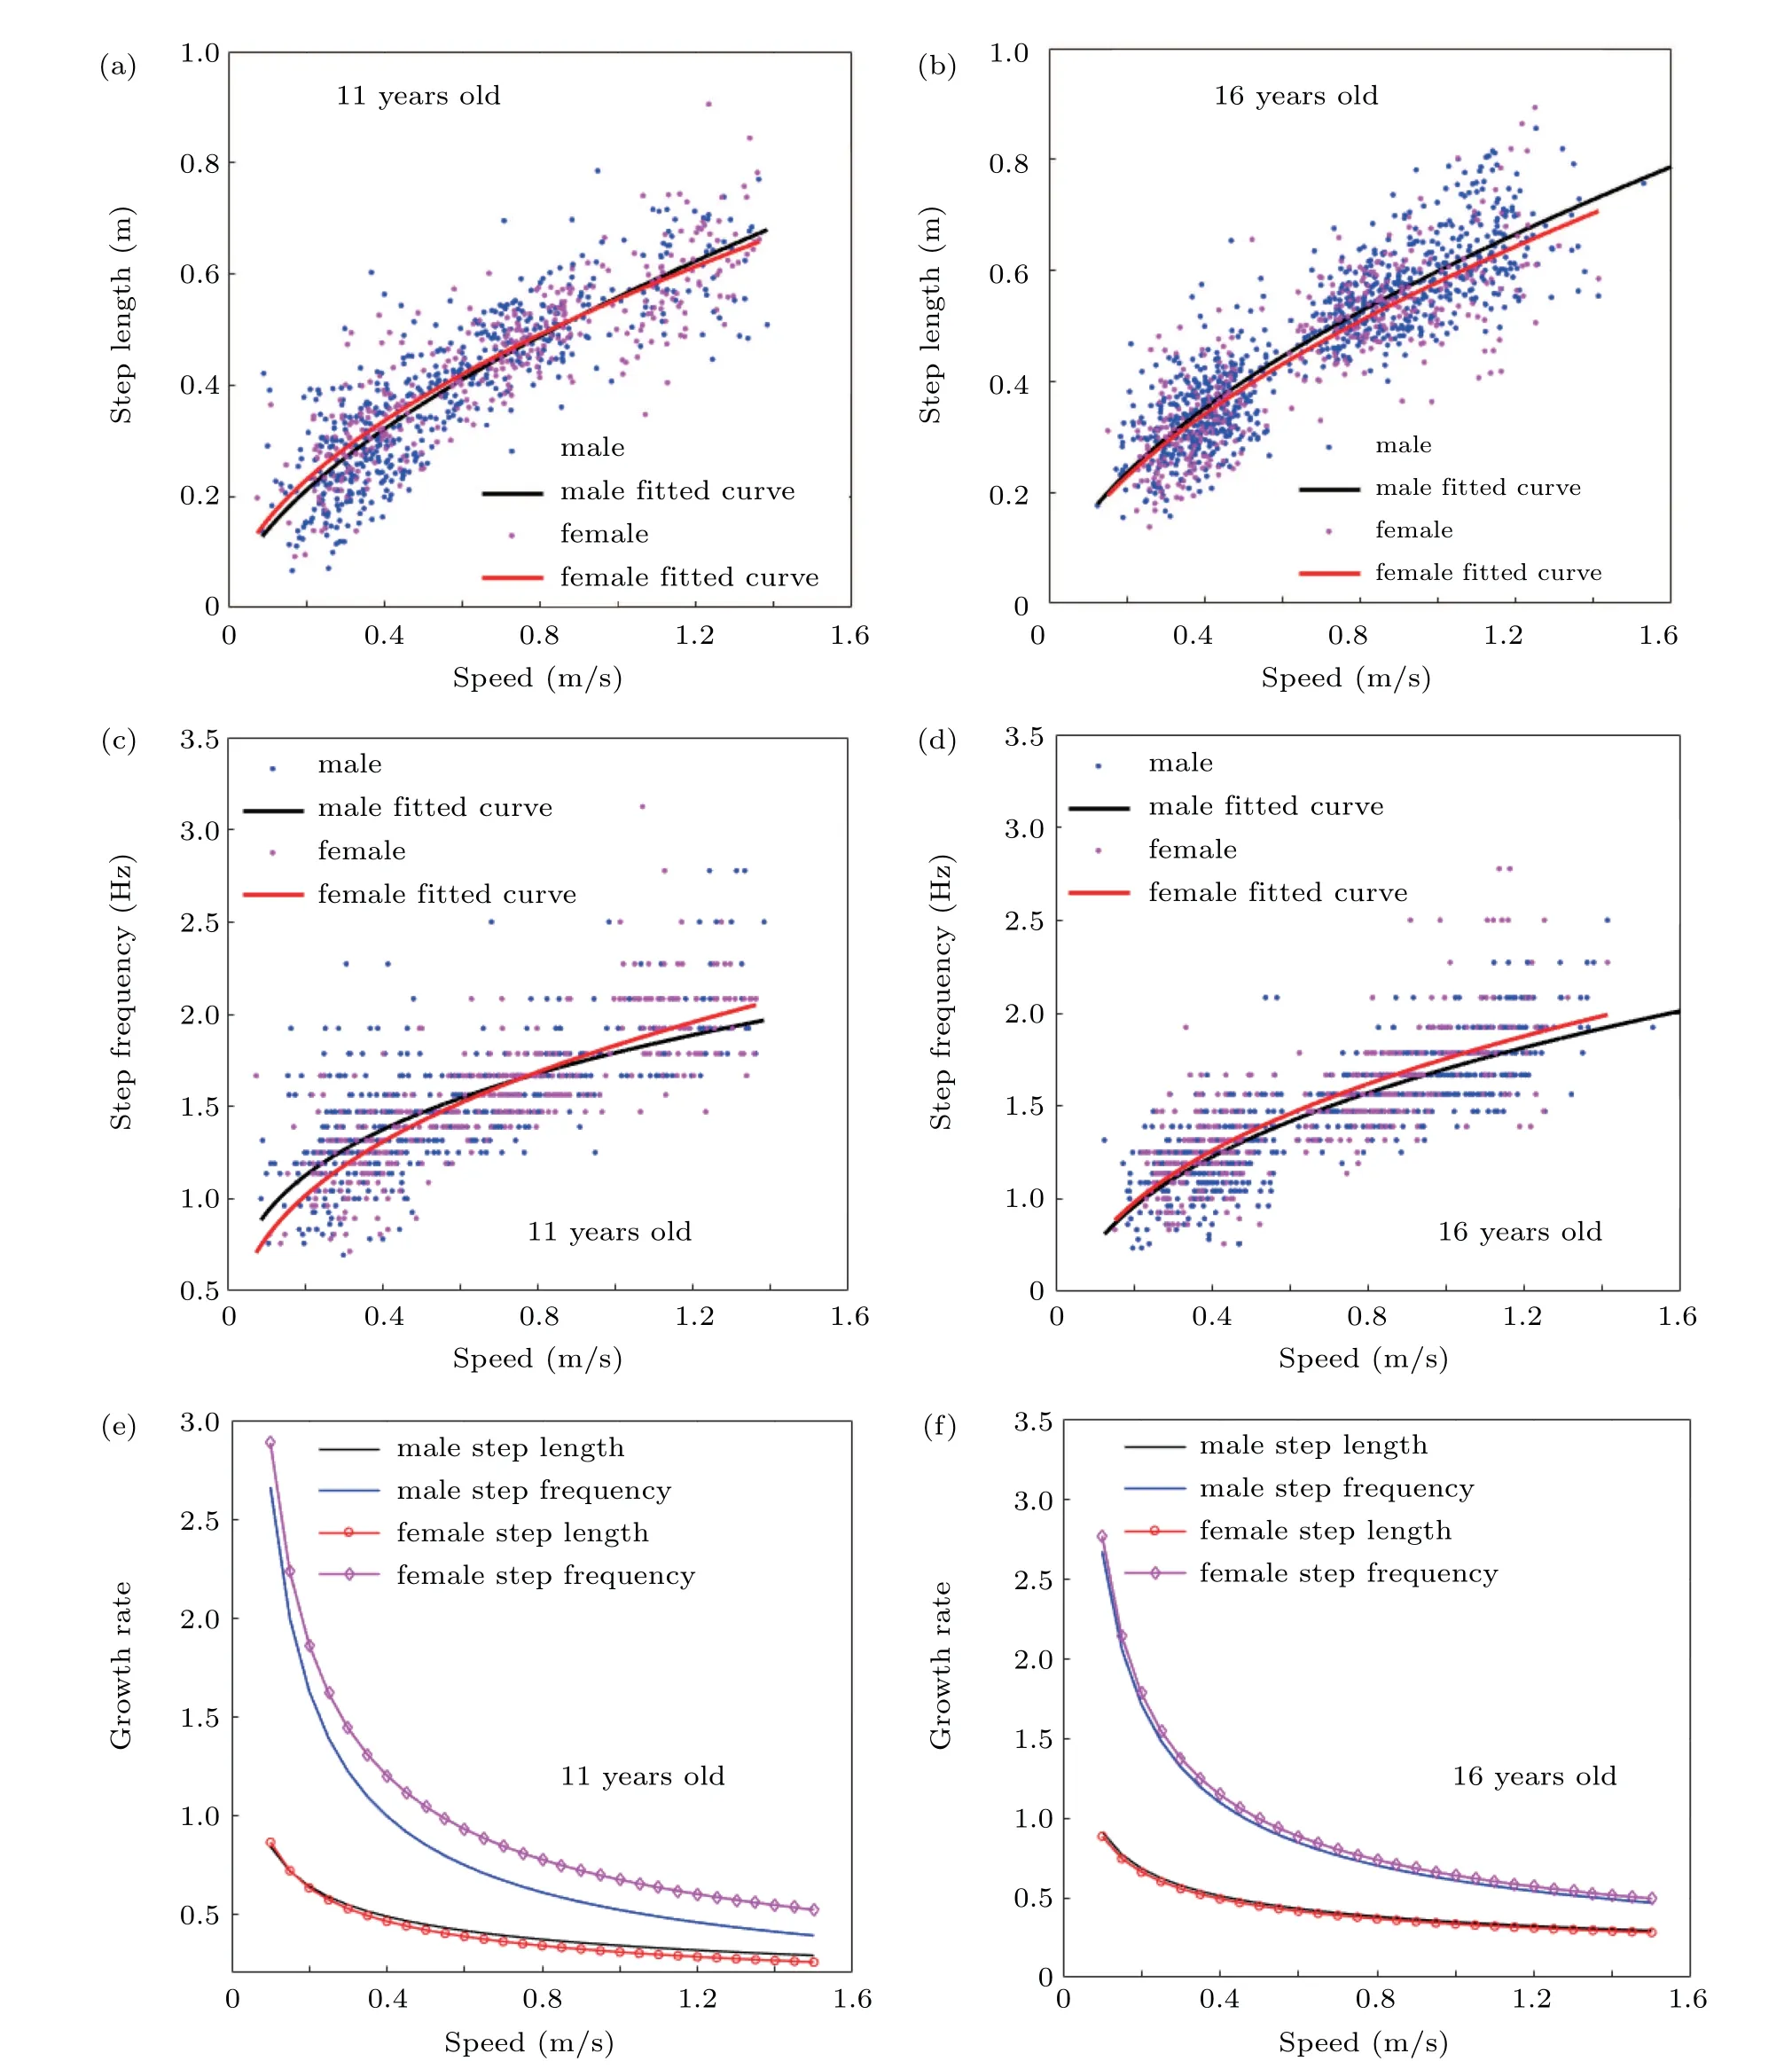
Fig.6.The step lengths and step frequencies of(a),(c)students aged 11 and(b),(d)students aged 16 as a function of speed.The statistically independent observations of males and females are marked with blue and magenta color respectively.The corresponding fitted curves by power function are marked with black and red lines,respectively.The first-order derivatives of the power functions indicate the growth rate of step lengths and step frequencies of(e)students aged 11 and(f)students aged 16.
The first-order derivatives of the power functions indicate the increase in step length and step frequency with speed,referred to as the growth rate of the step length and step frequency.Figures 6(e)and 6(f)show that the growth rate of step length is always smaller than that of step frequency no matter of gender or age.It says that to get a certain increase in the speed,a smaller growth of step length can meet the requirement,whereas the required growth of step frequency is larger.This indicates that step length plays a larger role than step frequency in walking speed,consistent with Versluis[19]and K¨oster et al.[36]Besides,the differences in the growth rate of the step length and the step frequency decrease with increasing speed,illustrating that the impact of the step frequency becomes larger with speed and gradually narrows the gap with the step length.
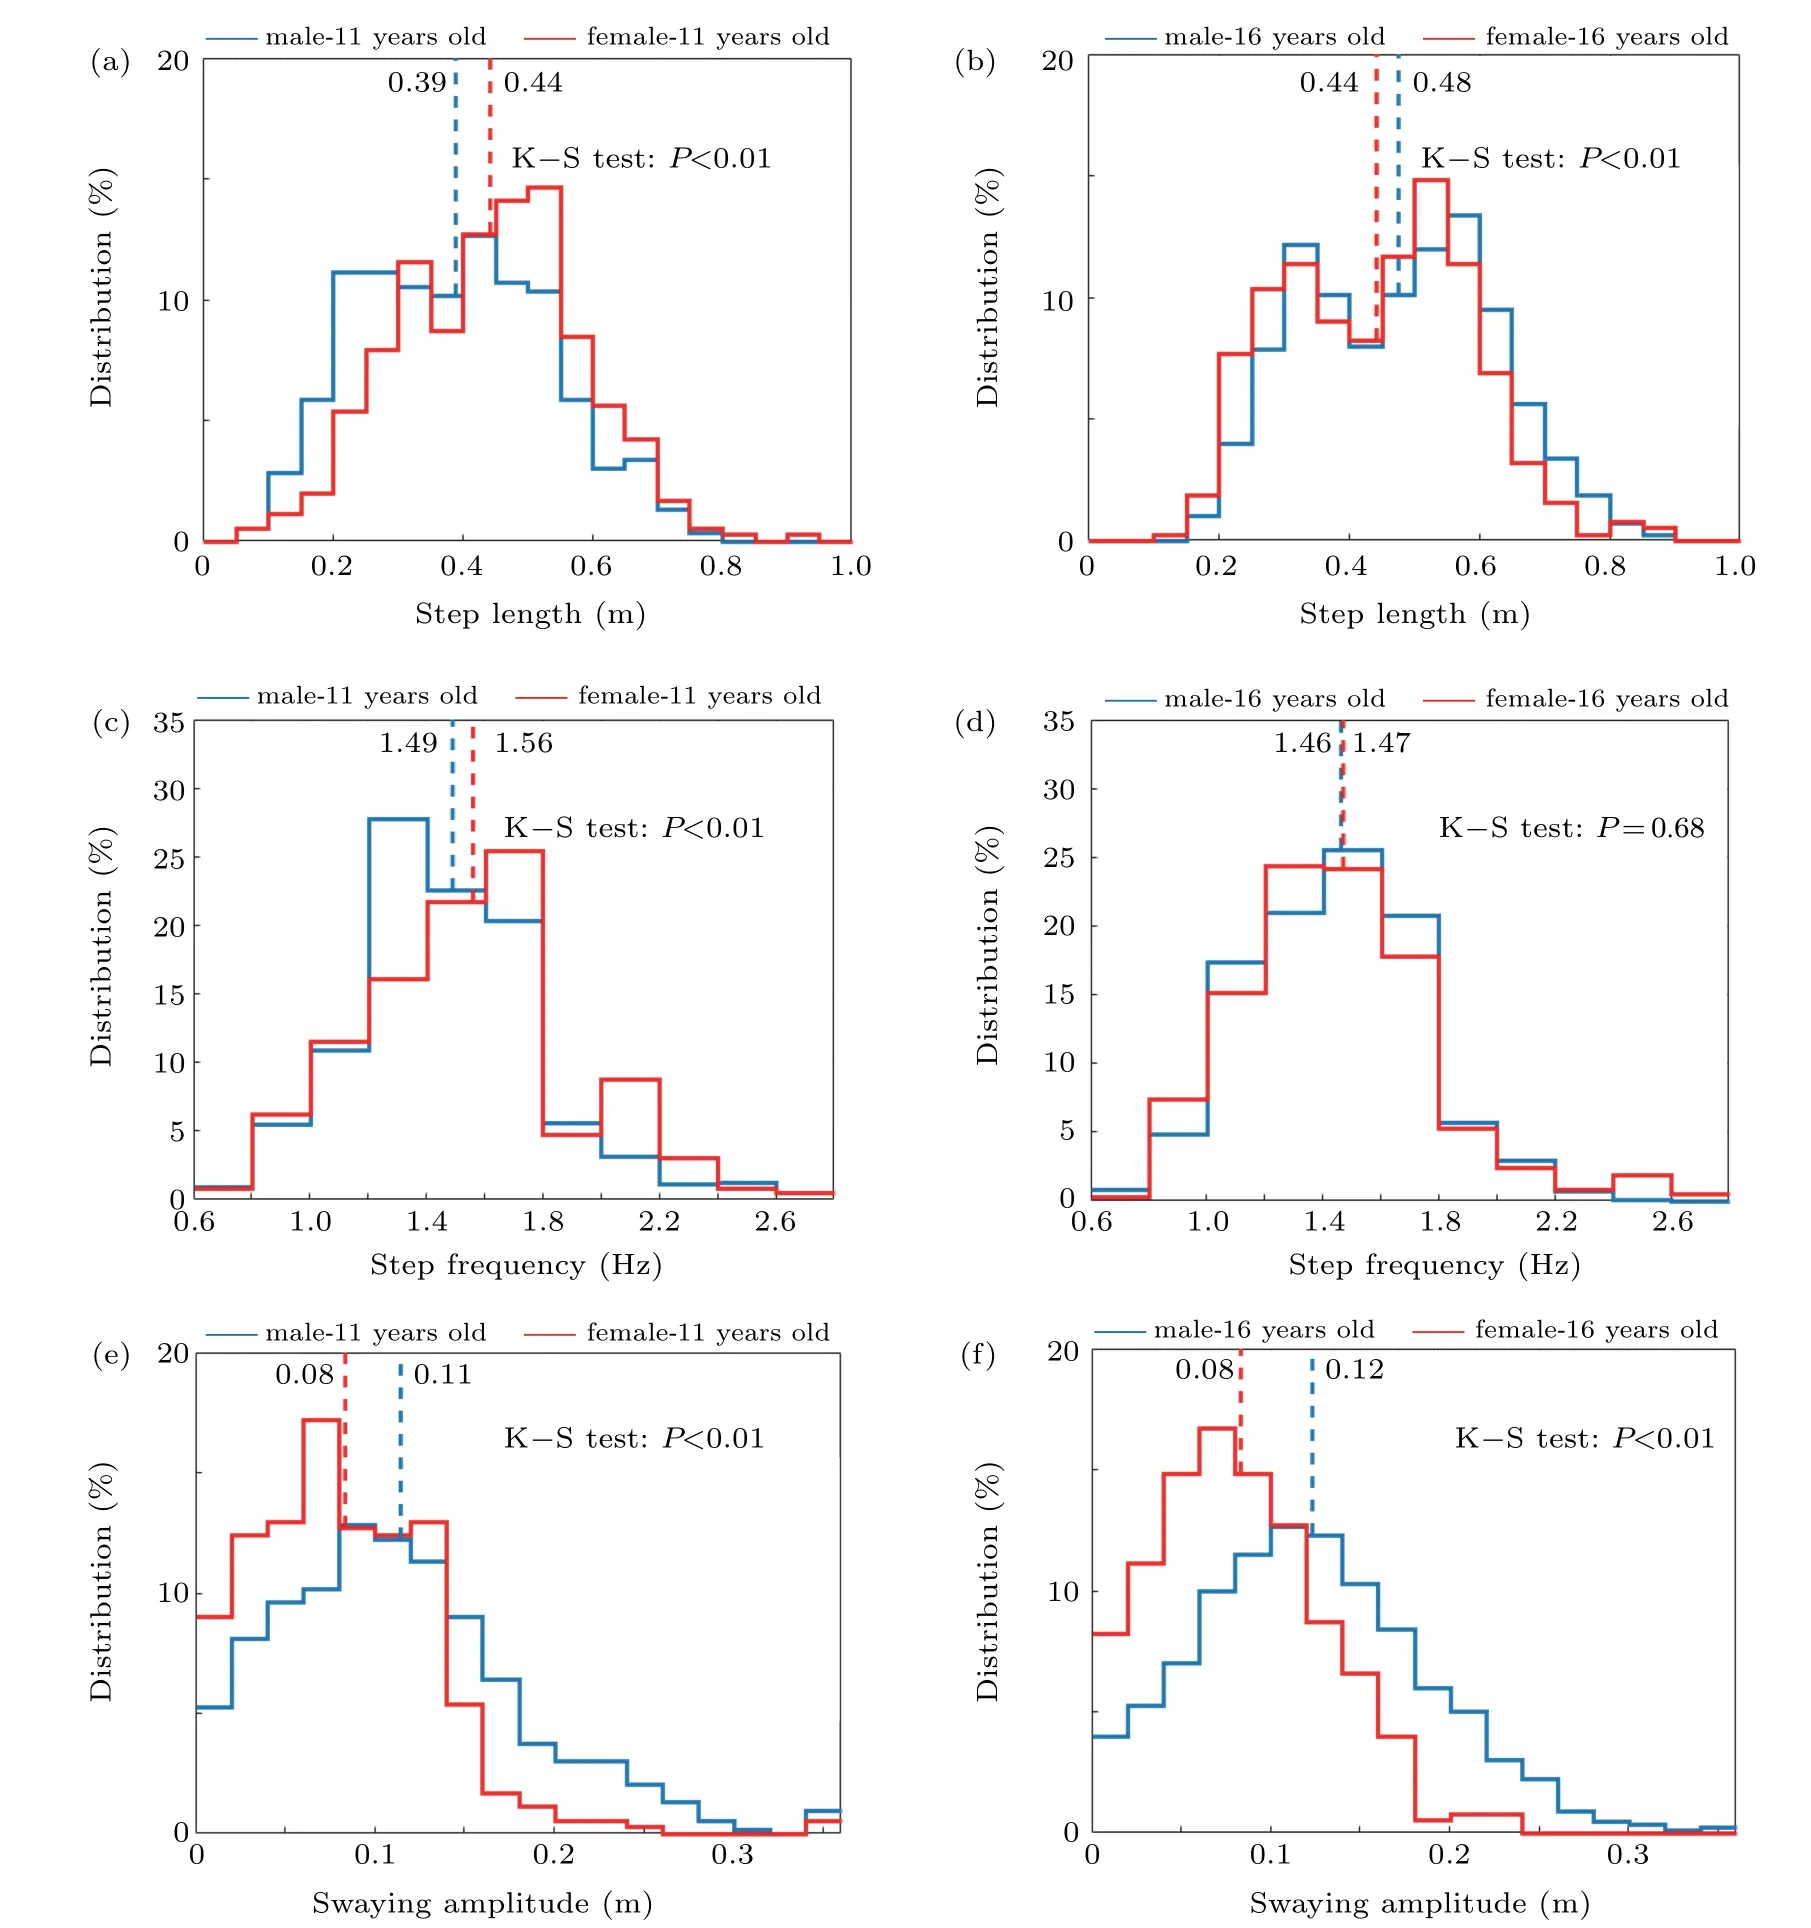
Fig.7.The distributions of step lengths,step frequencies and swaying amplitudes of(a),(c),(e)students aged 11 and(b),(d),(f)students aged 16.In each picture the distributions of males and females are marked with blue and red color,respectively.The mean value is illustrated by the dashed line using the corresponding color with the distribution.The P-value of the K–S test comparing the difference in distribution between males and females is shown in the corresponding picture.

Table 6.The comparison of gait characteristics of different gender.

Table 7.The comparison of gait characteristics of different age.
Figures 7(a),7(c)and 7(e)show the distributions of gait characteristics of males and females aged 11 using the same pseudo-independent database as in Figs.6(a),6(c)and 6(e).Figures 7(b),7(d)and 7(f)show the comparison of the pseudoindependent observations from males and females at the age of 16,using the same database as in Figs.6(b),6(d)and 6(f).The Kolmogorov–Smirnov(K–S)test is adopted to check whether the two comparison distributions originate from the same distribution.The t-test is adopted to compare the mean value of gait characteristics of the two comparison objects.The comparisons of different genders and ages using these two tests are shown in Tables 6 and 7,respectively.For the students aged 11,the difference in gait characteristics between males and females is significant.The result shows that compared with males,females have larger mean values of step length and step frequency,but smaller averaged swaying amplitudes.For the students aged 16,the results of K–S test show that gender has a significant influence on step length and swaying amplitude.But whether gender has significant impact on step frequency or not is not clear here because of the large P-value.Males aged 16 have significantly larger mean values of step length and swaying amplitude than females aged 16.Table 7 shows that for males,the influence of age on step length and swaying amplitude is significant.The group of age 16 has a larger step length and a smaller swaying amplitude than the younger group.Whether the step frequency of males is affected by age is not sure because of P-value larger than 0.05.For females,age has significant influence on step frequency,but the impact on other gait characteristics is not known due to the large Pvalue.The females aged 11 steps more frequently than females aged 16.
4.Conclusion
The research on students’behaviors can help to improve campus security and prevent stampede.To this end,an experimental study on single-file movements involving 92 primary and middle school students was performed.Pedestrian microscopic characteristics,including walking speed,headway,gait characteristics(step length,step frequency and swaying amplitude)and their relations were studied considering the influence of age and gender.Age and gender differences in the headwayspeed diagram and space requirements were analyzed by statistical tests.It was found that the impacts of age and gender were significant.The impacts on students’space requirements were consistent for different age and gender groups.But the impact of age and gender on free-flow speed were affected by each other.There were three stages for the influence of gender on the headway-speed diagram for both age groups.In the first stage,from the stop space to the equal space,males had larger space than females at the same speed.In the second stage,from the equal space to the free-flow space,females kept larger distance from the preceding person than males at the same speed.For the third stage,the available space exceeded the free-flow space and gender had no influence on personal space.
Due to the connection of walking speed and gait characteristics,the comparisons of gait characteristics between different ages and genders were performed to understand the corresponding differences in speed more deeply.The results showed that differences in step length and swaying amplitude between males and females were significant for both age groups.The effect of gender on step frequency was significant for primary students.But for middle school students,whether gender had significant impact on step frequency was not clear here because of the large P-value.Besides,the influence of age on gait characteristics changed with gender.For males,the influence of age on step length and swaying amplitude was significant.For females,age had significant influence on step frequency.
These results can help to improve models for pedestrians and minimize the gap between simulation and reality.In some models,humans are simplified as circles or ellipses.The size of circles or ellipses is set as a constant according to the body size of pedestrians.They move like robots rather than taking steps with feet alternately.Humans’free-flow speed is set to a uniform distribution or Gaussian distribution.The heterogeneity in pedestrians and stepping behaviors are neglected.In this condition,pedestrian movements cannot be simulated completely.The results in this paper can be applied to simulate students’behaviors as close as possible.In the modified model,students can be approximated as ellipses according to gait characteristics.The major axis and minor axis of ellipses are respectively set to step length and swaying amplitude of students,submit to different distributions considering the influence of age and gender.According to the power function of gait characteristics and speed,the walking speeds of students can be determined.Parameters of the power function are decided by students’age and gender.The interactions between students in different age and gender are considered and follows the headway-speed relation.Thus the model can be promoted to simulate students’movements taking the effect of age and gender into account.
Besides,the above efforts can also provide data and technical support for the organization of students’activities and building design in campus.When students’activities like sports games,performances and lectures are organized,large numbers of students from different grades gather together.Their characteristics are heterogeneous.In this case,the crowd safety is the most critical issue.The capacity of stadium,theatre and lecture hall must be estimated based on students’movement characteristics and space needs.The modified model can be used to simulate student movements before and after activities.It helps to decide whether guiding route is reasonable and students are safe.
Experimental study is advantaged by full flexibility,easily tracking individuals with high precision and controlling variables to investigate the influence of one certain factor.Therefore it is important and popular in the field of pedestrian dynamics.However,there is a gap between the pedestrian behaviors in reality and in experiments.Efforts to narrow the gap are made.For example,some instructions are given to make subjects walk naturally in experiments,like“You will walk alone in a passage”or“Imagine leaving the lecture hall one by one in a single line”.In the future,we can also set up real scenarios to make pedestrians act naturally.Meanwhile,pedestrian behaviors in some real situations can be recorded and studied.
猜你喜欢
杂志排行
Chinese Physics B的其它文章
- Multiple solutions and hysteresis in the flows driven by surface with antisymmetric velocity profile∗
- Magnetization relaxation of uniaxial anisotropic ferromagnetic particles with linear reaction dynamics driven by DC/AC magnetic field∗
- Influences of spin–orbit interaction on quantum speed limit and entanglement of spin qubits in coupled quantum dots
- Quantum multicast schemes of different quantum states via non-maximally entangled channels with multiparty involvement∗
- Magnetic and electronic properties of two-dimensional metal-organic frameworks TM3(C2NH)12*
- Preparation of a two-state mixture of ultracold fermionic atoms with balanced population subject to the unstable magnetic field∗
