Mid-infrared supercontinuum and optical frequency comb generations in a multimode tellurite photonic crystal fiber∗
2021-09-28XuHan韩旭YingHan韩颖ChaoMei梅超JingZhaoGuan管景昭YanWang王彦LinGong龚琳JinHuiYuan苑金辉andChongXiuYu余重秀
Xu Han(韩旭),Ying Han(韩颖),†,Chao Mei(梅超),Jing-Zhao Guan(管景昭),Yan Wang(王彦),Lin Gong(龚琳),Jin-Hui Yuan(苑金辉),and Chong-Xiu Yu(余重秀)
1Key Laboratory for Special Fiber and Fiber Sensor of Hebei Province,School of Information Science and Engineering,Yanshan University,Qinhuangdao 066004,China
2State Key Laboratory of Information Photonics and Optical Communications,Beijing University of Posts and Telecommunications(BUPT),Beijing 100876,China
Keywords:multimode tellurite photonic crystal fiber,supercontinuum,optical frequency comb,mid-infrared spectral region
1.Introduction
Supercontinuum(SC)in the mid-infrared(MIR)spectral region has extensive applications in optical frequency comb(OFC),[1]spectroscopy,[2]optical coherence tomography,[3]and optical communication.[4]When the short pulse propagates in the nonlinear medium,the SC could be generated from the interplay of some nonlinear effects,including stimulated Raman scattering(SRS),self-phase modulation(SPM),fourwave mixing(FWM),modulation instability(MI),and soliton fission(SF).[5–10]Photonic crystal fiber(PCF)is considered as one of the excellent nonlinear media for the SC generation due to its excellent optical properties such as adjustable dispersion,enhanced nonlinearity,high birefringence,etc.[5,11,12]In 2002,Dudley et al.[13]firstly reported the SC generation in the silica PCFs by using the short pulses as the pump source.Since then,there are lots of reports on the SC generation in the silica PCFs.[14–18]In recent years,some novel PCFs,which are fabricated from the fluoride,chalcogenide,and tellurite glasses are demonstrated.Compared with the silica glass,these glasses have lower transmission loss in the MIR spectral region and higher nonlinear refractive index n2,so they can be used as the materials of the PCF for investigating the nonlinear effects.[19,20]Among them,n2of the tellurite glass is one order of magnitude larger than that of the silica glass.In addition,it is chemically and thermally stable compared with the fluoride and chalcogenide glasses.[21,22]Therefore,the tellurite glass has been considering as the ideal nonlinear medium for the MIR SC generation.In 2008,Domachuk et al.[22]reported the SC generation spanning from 0.79µm to 4.9µm in a tellurite PCF.In 2016,Ou et al.[23]obtained the MIR SC spanning from 1.8µm to 14µm by using a highly nonlinear Ge–Sb–Se fiber.In 2017,Zhao et al.[24]demonstrated the MIR SC generation covering 2µm–16µm in a low-loss telluride singlemode fiber.In 2017,Li et al.[25]demonstrated the highly coherent and octave-spanning MIR SC generation in a tellurite PCF.In 2018,we investigated the self-similar pulse compression and its application in the MIR SC generation in the tellurite PCFs.[26]In 2019,Nguyen et al.[27]obtained a highly coherent SC spanning from 1.4µm to 3µm in a microstructured tellurite fiber pumped by a laser operating at 2µm.In the same year,Klimczak et al.[28]obtained the SC with a spectral width covering wavelengths of 1100 nm–2600 nm centered at 1560 nm using a highly nonlinear tellurite glass PCF.
Until now,most of investigations are concentrated on the SC generation based on the fundamental mode of the PCFs.As the fiber laser and optical communication technologies develop rapidly,the multimode nonlinear fiber optics has been attracting great research interests.[29–31]Recently,the SC generations based on the high-order modes in the multimode PCFs have already been reported.In 2008,Cherif et al.[32]reported the SC generation when the femtosecond pump pulses are coupled into the LP11and LP21modes of a silica PCF.In 2013,Chen et al.[33]demonstrated the SC generation from the visible to ultraviolet spectral region by coupling the sub-ns pulses at wavelength 532 nm into the LP02mode of a silica PCF.In 2016,Jiang et al.[34]experimentally generated the MIR SC when the pump pulses are launched into the fundamental and first higher-order modes of a ZBLAN PCF.In the same year,Kubat et al.[35]obtained the MIR SC when several higherorder modes are excited in a chalcogenide PCF.In 2018,Khalifa et al.[36]obtained a mid-infrared supercontinuum spanning 2µm to 4µm at−40 dB for mode HE11from 2µm to 3.5µm for HE12using a multimode As2S3PCF.In 2020,Eslami et al.[37]demonstrated the generation of a low-noise,octavespanning mid-infrared supercontinuum from 1700 nm to 4800 nm using a multimode step-index chalcogenide fiber with the higher-order modes.At present,there is still no report on the SC generation in the higher-order modes of the multimode tellurite PCF(MM-TPCF).
In this paper,the highly coherent and octave-spanning MIR SCs are generated when the femtosecond pump pulses are coupled into the anomalous dispersion region of the LP01,LP02,and LP12modes of the designed MM-TPCF.The influences of the pump pulse parameters including center wavelength,width,and peak power on the SC generations are investigated.The temporal and spectral evolutions of the SC generation for the three optical modes are demonstrated.Finally,the SC-based OFCs are obtained when a train of 50 pulses at 1 GHz repetition rate is used as the pump source.
2.Theoretical model and design of the MMTPCF
Figure 1(a)shows the cross-section of the designed MMTPCF,where the four rings of air-holes are arranged in a regular hexagonal lattice,the core diameter D is 4.6µm,hole to hole pitchΛis 15µm,and air hole diameter d is 0.7Λ.The single-mode propagation condition of the MM-TPCF can be described as follows:

where V is the normalized frequency,a is the core radius,λis the wavelength of the propagated light,and n1and n2are the effective refractive indices of the core and cladding regions,respectively.When V=2.405,the corresponding cut-off wavelengthλcut-off can be obtained by Eq.(1).When the pump wavelength is larger thanλcut-off,the single-mode propagation can be achieved.When the pump wavelength is smaller than λcut-off,the MM-TPCF supports the multimode propagation.According to Eq.(1),V is dependent on n1and n2.In order to ensure the multimode propagation,two kinds of materials,which have the large effective refractive index difference,need to be carefully chosen as the core and cladding materials to increaseλcut-off.The chosen materials should have the similar thermal expansion and softening temperatures,which is necessary for the actual fabrication of the MM-TPCF.Thus,TLWMN(TeO2–Li2O–WO3–MoO3–Nb2O3)and TZLKAP(TeO2–ZnO–Li2O–K2O–Al2O3–P2O5)are used as the core and cladding materials,respectively.[38–40]In practice,the designed MM-TPCF can be fabricated with the stack-and-draw technique.We use the full-vector finite element method(FVFEM)to calculate the propagation characteristics of the designed MM-TPCF.In the calculation,the perfectly matched layer(PML),whose thickness and refractive index are set as 10µm and nsilica+0.03,is used as the boundary condition.In addition,the grid sizes of the silica,air holes,and PML are set asλ/4,and the grid size of the core region filled with the nitrobenzene is set asλ/6.With the FV-FEM,the mode field distributions of the considered LP01,LP02,and LP12modes calculated at wavelength 3µm are shown in Figs.1(b),1(c),and 1(d),respectively.From Figs.1(b),1(c),and 1(d),the mode field energy can be well confined in the core region of the MM-TPCF,which consists of the TLWMN material and is marked by the circle.
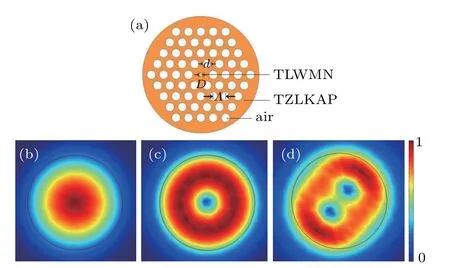
Fig.1.(a)The cross-section of the designed MM-TPCF.Mode field distributions of(b)LP01 mode,(c)LP02 mode,and(d)LP12 mode calculated at wavelength 3µm.
The curves of the effective refractive index Neffand effective mode field area Aeffcalculated as functions of the wavelength for the three optical modes are shown in Fig.2(a).From Fig.2(a),compared with the LP01mode,Neffand Aeffof the LP02and LP12modes decrease and increase faster as the wavelength increases,respectively.The group-velocity dispersion parameter D can be derived from Neffas follows:

where c is the light velocity in the vacuum.Figure 2(b)shows the D and nonlinear coefficientsγof the LP01,LP02,and LP12modes of the MM-TPCF.From Fig.2(b),the three optical modes show the anomalous dispersion characteristic at the initial pump wavelength 2µm.The first zero-dispersion wavelengths(ZDWs)of the LP01,LP02,and LP12modes are located at wavelengths 1.72,1.48,and 1.28µm,respectively.The second ZDWs of the LP12mode is located at wavelength 4.58µm.γcan be calculated from Aeff,which is related to the integration on the whole cross-section of the MM-TPCF as

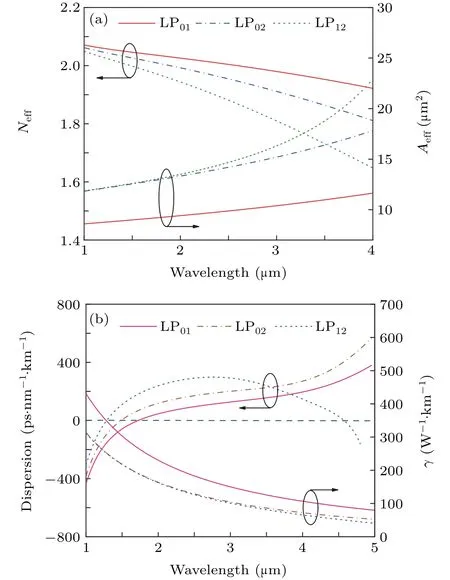
Fig.2.(a)The effective refractive index Neff and effective mode field area Aeff calculated for the LP01,LP02,and LP12 modes,respectively.(b)Groupvelocity dispersion parameter D and nonlinear coefficientγcalculated for the LP01,LP02,and LP12 modes,respectively.
where F(x,y)is the distribution of the mode fields and n2=5.9×10⁻¹⁹m2/W is the nonlinear refractive index of TLWMN.From Fig.2(b),γof the LP01mode is much larger than those of the LP02and LP12modes,andγcurves of the LP02and LP12modes are nearly overlapped,which means that they have the similar nonlinearity.
The nonlinear dynamics of the short pulse propagated in the designed MM-TPCF can be modelled by the following generalized nonlinear Schr¨odinger equation(GNLSE)[5,12]
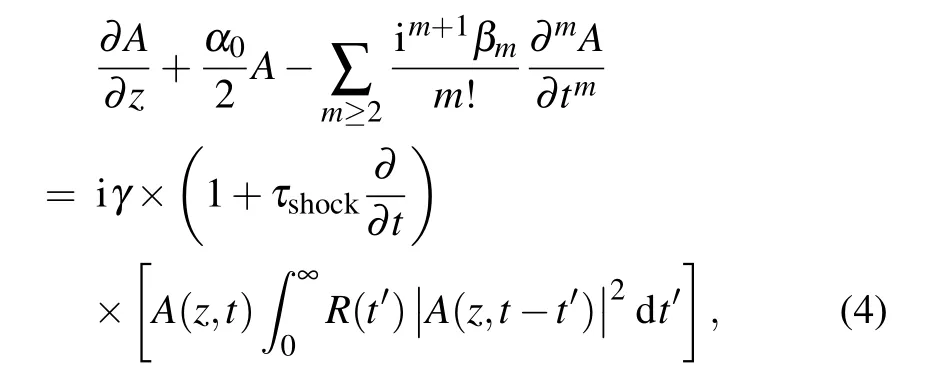
where A(z,t)represents the slowly varying envelope during the propagation,αis the linear propagation loss,βmmeans the m-order dispersion coefficient calculated from the Taylor expansion of the propagation constantβ(ω)at a specific wavelength,andγis the nonlinear coefficient.Nonlinear dispersionτshock=γ1(ω0)/γ(ω0)corresponds to the effect of selfsteeping(SS),whereγ1(ω)=dγ(ω)/dωandωis the central angular frequency.R(t)denote the nonlinear response function,which can be described as

where fRis the fractional contribution of the Raman response,andδ(t)represents the Kerr effect.The delayed Raman response function hR(t)is described as

whereτ1is the Raman period corresponding to the phonon oscillation frequency,andτ2is the spectral bandwidth of the Raman gain.Some parameters used in the simulation are listed in Table 1.[39]

Table 1.Some parameters used in the simulation.
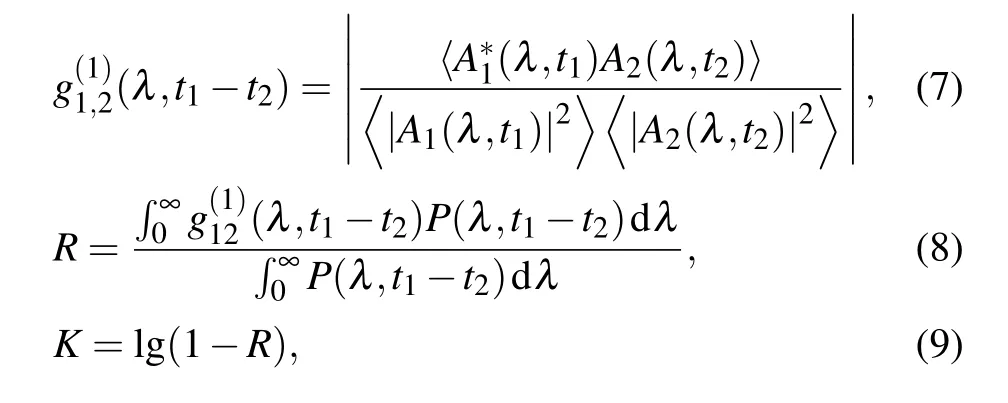
The coherence is one of the important parameters to evaluate the quality of the SC generated.The following three parameters can be used to quantify the coherence of the SC[41,42]
3.Simulation results and discussion
We use the fourth-order Runge–Kutta method to solve the GNLSE for investigating the nonlinear dynamics of the SC generation.[40]The hyperbolic secant pulses with different parameters are used as the pump source and coupled into the LP01,LP02,and LP12modes of the designed MM-TPCF with the length of 3 mm,respectively.In the simulation,the 12thorder dispersion coefficient is considered,as shown in Table 2.In the following,we will investigate the influences of the pump pulse parameters on the SC generation.
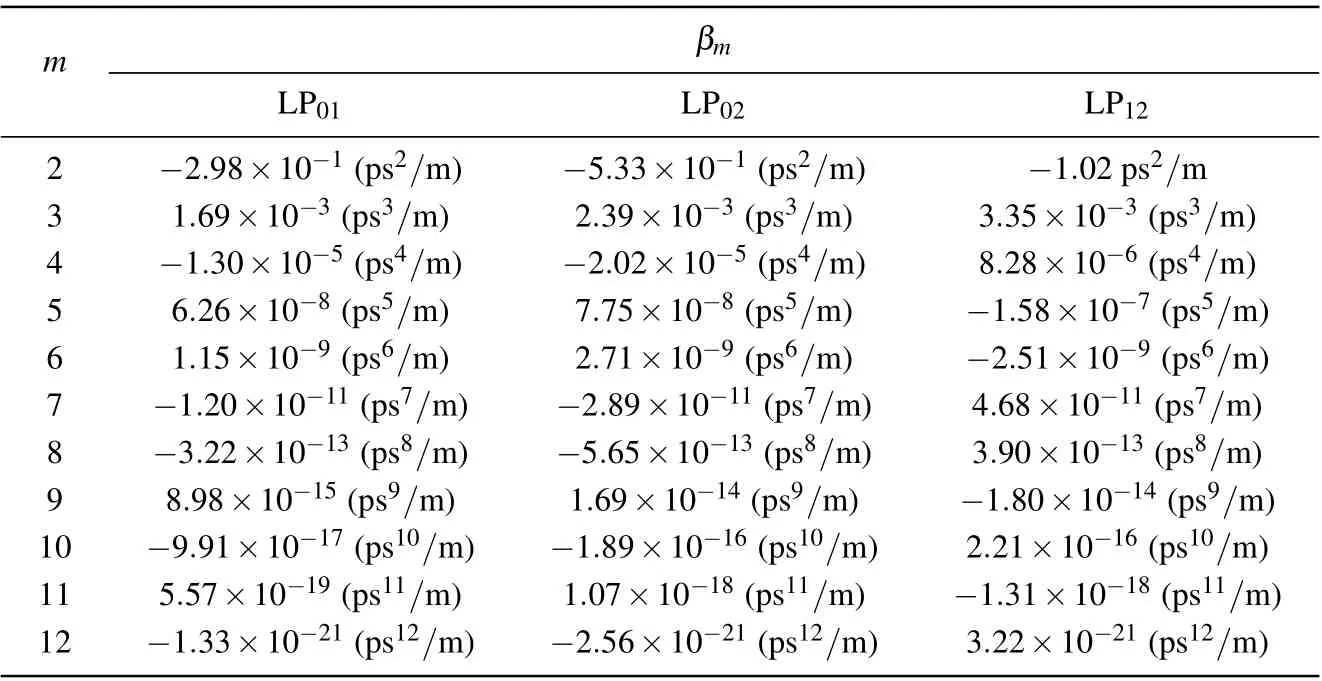
Table 1.The dispersion coefficientβm calculated at wavelength 2.5µm.
Figures 3(a)–3(f)show the temporal and spectral profiles of the generated SC when the pump pulse with width T=80 fs,peak power P=18 kW,and center wavelength λ=2.0,2.5,3.0,and 3.5µm are coupled into the anomalous dispersion region of the LP01,LP02,and LP12modes of the 3-mm-long MM-TPCF,respectively.In Figs.3(a)and 3(b),when the pump pulse atλ=2.0,2.5,3.0,and 3.5µm are coupled into the LP01mode,the soliton dynamics dominate the nonlinear process.From Fig.3(a),several small peaks can be observed,corresponding to the lower-order solitons.In addition,because of the intrapulse Raman scattering effect,the fundamental solitons formed by the higher-order soliton occur to red-shift and separate after a short propagation distance.With the increase ofλ,the satellite separates to the right side due to the SF effect.Moreover,because of the higher-order dispersions and resonance matching condition,the blue-shifted dispersive waves(DWs)are generated at the short wavelength side.After that,the cross-phase modulation(XPM)effect between the red-shifted solitons and DWs could further expand the optical spectra toward the longer and shorter wavelength sides.From Fig.3(b),whenλ=2.5µm,the−40-dB bandwidth of the SC generated spans from 0.9µm to 5.3µm,covering 2.56 octaves.It is worth noting that when λis further increased to 3.0µm and 3.5µm,the optical spectra become narrower.The main reason may be due to the increasing dispersion and decreasing nonlinearity.Figures 3(c)and 3(d)show the spectral and temporal profiles of the SCs generated with the LP02mode.Compared with the results shown in Figs.3(a)and 3(b),although the nonlinear process is similar,the spectral and temporal profiles are different.It can be seen from Figs.3(c)and 3(d)that the−40-dB bandwidth of the SC generated spans from 1.6µm to 4.2µm,covering 1.39 octaves,whenλ=2.5µm.The bandwidth is much smaller than that obtained with the LP01mode,especially forλ=2.0µm and 2.5µm.The main reason is considered thatγof the LP02mode is reduced obviously.Figures 3(e)and 3(f)show the spectral and temporal profiles of the SCs generated with the LP02mode.From Figs.3(e)and 3(f),the spectral and temporal profiles are similar to that obtained with the LP02mode because of the similar nonlinear process andγ.Whenλ=2.5µm,the−40-dB bandwidth of the SC generated spans from 1.8µm to 3.9µm,covering 1.12 octaves.Thus,whenλ=2.5µm,the octave-spanning SCs can be generated with the considered three optical modes.

Figures 4(a)–4(f)show the temporal and spectral profiles of the generated SC when the pump pulse withλ0=2.5µm,P=18 kW,and T=80,120,150,and 200 fs is coupled into the anomalous dispersion region of the LP01,LP02,and LP12modes of the 3-mm-long MM-TPCF,respectively.From the temporal profiles of the SCs for the three optical modes shown in Figs.4(a),4(c),and 4(e),the temporal width becomes larger as T increases,and several small peaks induced by the SF effect emerge for the narrower pulse.The soliton order N can be calculated by From Eq.(10),N is related to T,P,γ,and the 2nd-order dispersion coefficientβ2.Because N is proportional to T,N becomes larger as T0increases.From the spectral profiles of the SCs for the three optical modes shown in Figs.4(b),4(d),and 4(f),when T=80 fs and 120 fs,the optical spectra are asymmetrically broadened by the SF and XPM effects.Especially for T=80 fs,the−40-dB bandwidths of the SCs generated for the LP01,LP02,and LP12modes span from 0.9µm to 5.3µm,1.6µm to 4.2µm,and 1.8µm to 3.9µm,covering 2.56,1.39,and 1.12 octaves,respectively.When T=150 fs and 200 fs,the optical spectra are symmetrically broadened,and the spectral bandwidths become narrower.In addition,the coherence of the SC could be obviously degraded by the MI effect when T is larger.Thus,T=80 fs is chosen as optimized value.
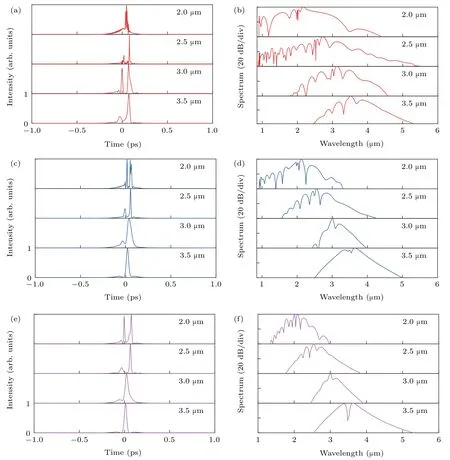
Fig.3.The temporal(panels(a),(c),(e))and spectral(panels(b),(d),(f))profiles of the SC generated when pump pulse with width T=80 fs,peak power P=18 kW,and center wavelength ofλ=2.0,2.5,3.0,and 3.5µm is coupled into(a)LP01,(b)LP02,and(c)LP12 modes of the MM-TPCF,respectively.

Fig.4.The temporal(panels(a),(c),(e))and spectral(panels(b),(d),(f))profiles of the SC generated when pump pulse withλ=2.5µm,P=18 kW,and T=80,120,150,and 200 fs is coupled into(a)LP01,(b)LP02,and(c)LP12 modes of the MM-TPCF,respectively.
Figures 5(a)–5(f)show the temporal and spectral profiles of the generated SC when the pump pulse withλ=2.5µm,T=80 fs,and P=12,15,18,and 25 kW is coupled into the anomalous dispersion region of the LP01,LP02,and LP12modes of the 3-mm-long MM-TPCF,respectively.When T0is fixed,the spectral broadening mainly depends on P.Thus,as P0increases,the optical spectra can be obviously broadened by the SF and XPM effects.From the temporal profiles of the SCs for the three optical modes shown in Figs.5(a),5(c),and 5(e),as P0increases,N increases,and the spectrum becomes broader gradually.Several small peaks along with some burrs emerge,and they separate to the right side due to the enhanced SF effect.From the spectral profiles of the SCs for the three optical modes shown in Figs.5(b),5(d),and 5(f),as P0increases,the spectral broadening increases gradually due to the combined effect of the MI,SF,and XPM,and some dips emerge because of the degradation of the coherence with the increase of N.When P=18 kW,the−40-dB bandwidths of the SCs generated for the LP01,LP02,and LP12modes span from 0.9µm to 5.3µm,1.6µm to 4.2µm,and 1.8µm to 3.9µm,covering 2.56,1.39,and 1.12 octaves,respectively.It is worth indicating that when P is further increased to 25 kW,the optical spectrum does not broaden any more.Thus,P=18 kW is chosen as the optimized value.
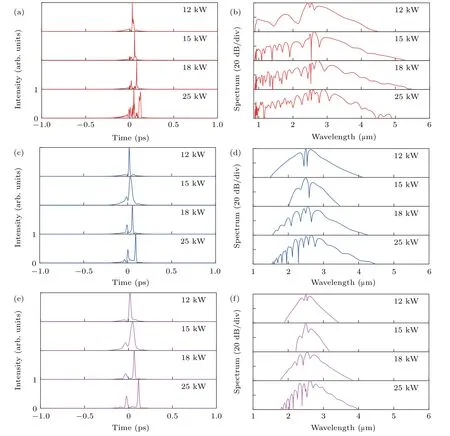
Fig.5.The temporal(panels(a),(c),(e))and spectral(panels(b),(d),(f))profiles of the SC generated when pump pulse withλ=2.5µm,T=80 fs,and P=12,15,18,and 25 kW is coupled into(a)LP01,(b)LP02,and(c)LP12 modes of the MM-TPCF,respectively.
Based on the above discussion,the optimized pump pulse parameters are chosen as following:λ=2.5µm,T=80 fs,and P=18 kW.When the pump pulse with these parameters is coupled into the anomalous dispersion region of the LP01,LP02,and LP12modes of the 3-mm-long MM-TPCF,respectively,the temporal and spectral evolutions of the LP01,LP02,and LP12modes are shown in Figs.6(a)–6(f).During the propagation,the pump pulse experiences the anomalous dispersion,so the SF and XPM effects play important roles in the SC generation.From the temporal evolution diagrams of the SCs for the three optical modes shown in Figs.6(a),6(c),and 6(e),with the increase of the propagation length z,the pump pulse is first compressed and then broadened.At the output end of the MM-TPCF,several small peaks emerge,and they separate to the right side because of the SF effect.From the spectral evolution diagrams of the SCs for the three optical modes shown in Figs.6(b),6(d),and 6(f),the solitons start to separate at z=2 mm,and the optical spectrum is broadened quickly.After that,the XPM-induced spectral broadening further expands the optical spectrum at the short and long wavelength sides as z increases.Some dips are observed from the optical spectra at the output end of the MM-TPCF because of the degradation of the coherence.For T=80 fs,the MI effect is depressed,and the degradation of the coherence could be resulted from the noise induced by the SF effect.After the 3-mm propagation in the MM-TPCF,the highly coherent and octave-spanning MIR SCs can be generated for the LP01,LP02,and LP12modes in the wavelength ranges of 0.9µm to 5.3µm,1.6µm to 4.2µm,and 1.8µm to 3.9µm,covering 2.56,1.39,and 1.12 octaves,respectively.
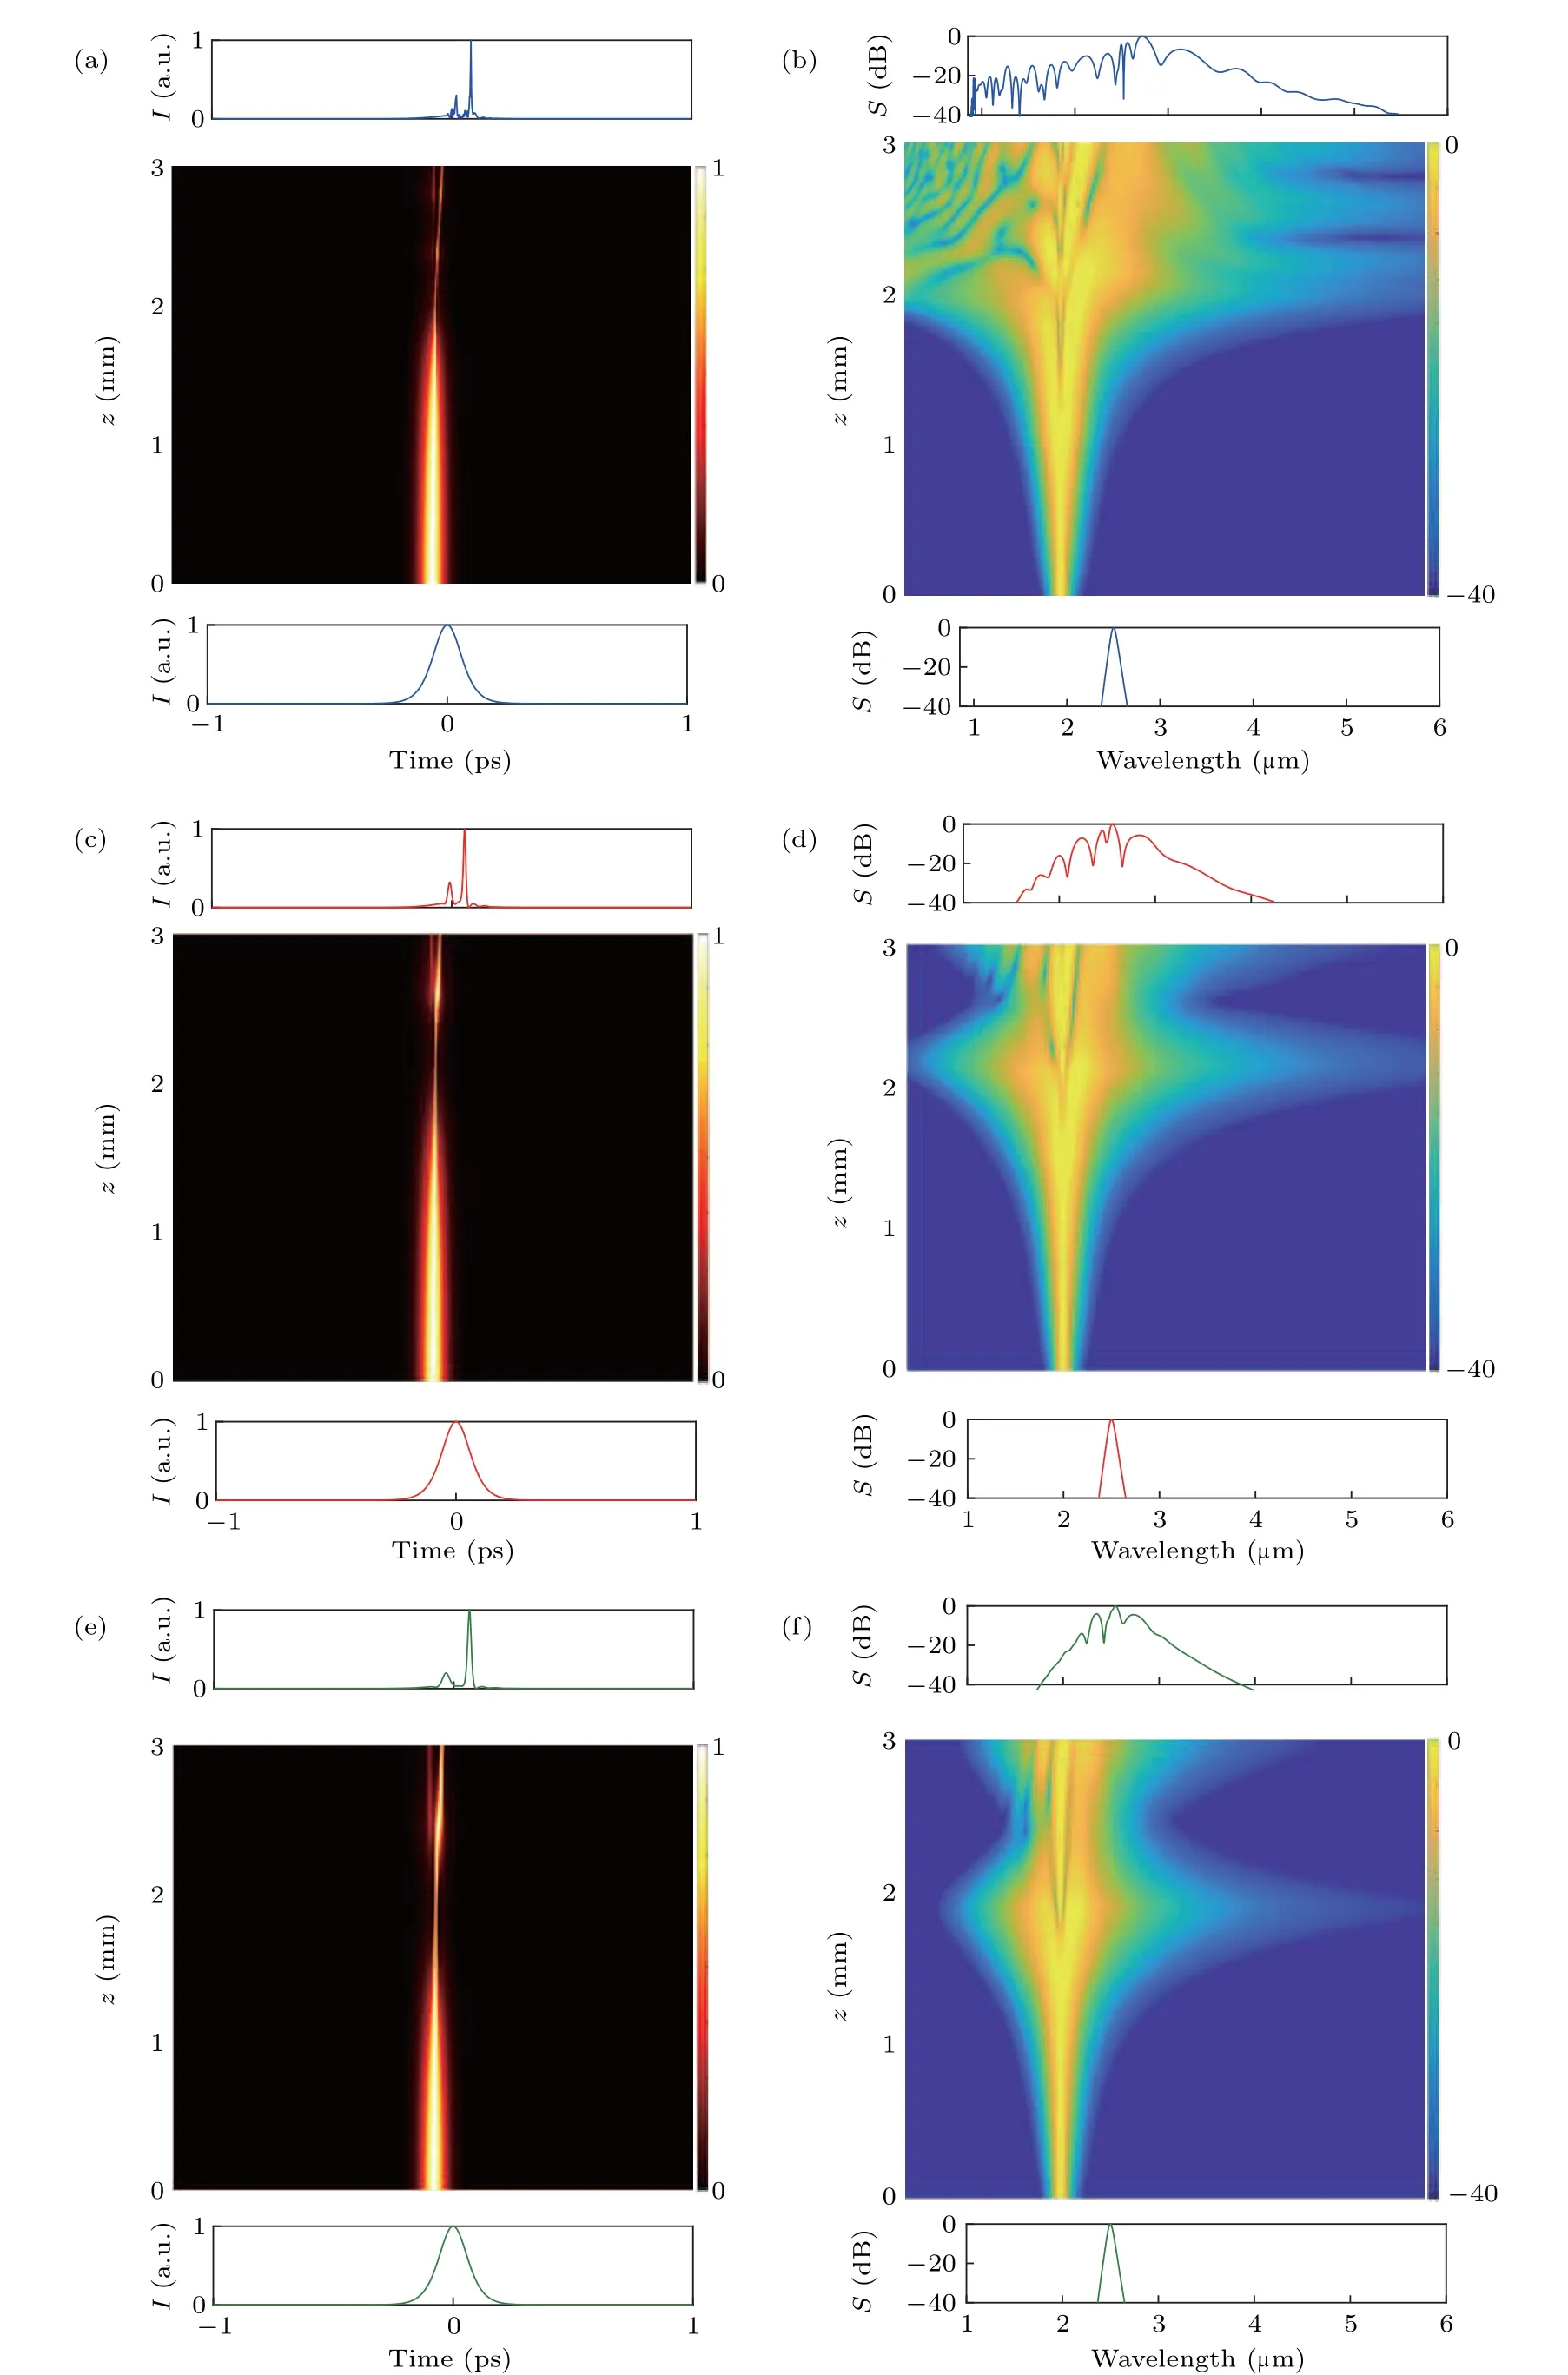
Fig.6.When the pump pulse withλ=2.5µm,T=80 fs,and P=18 kW are used,the temporal(panels(a),(c),(e))and spectral(panels(b),(d),(f))evolutions of the pump pulses along the propagation length z for(a)LP01,(b)LP02,and(c)LP12 modes.The temporal and spectral profiles at the input and output of the MM-TPCF are also shown at the bottom and top of the evolution diagrams.The unit a.u.is the abbreviation of arbitrary unit.
In the following,we will analyze the influence of the random noise on the MIR SC generation.We use the 50 shots of optical pulses withη=0.001 as the pump source.Figures 7(a),7(b),and 7(c)show the MIR SC generated and coherence of the LP01,LP02,and LP12modes for differentη,respectively.The gray lines are the overlapped spectra of 50 shots with the random noise.From Fig.7(a),the MIR SCs of 50 shots pulses differs obviously in the wavelength range of less than 2µm,and the corresponding coherence of the SC is very unstable.In contrast,the red curve almost overlaps with the gray curve in the wavelength range of larger than 2µm,and the coherence of the SC is very close to 1.From Figs.7(b)and 7(c),the blue,magenta,and gray curves for the LP02and LP12modes almost completely overlap.Thus,the coherences of the SC are maintained 1.It is worth indicating that although the pump pulse works in the anomalous dispersion region of the LP01,LP02,and LP12modes of the MM-TPCF,the MIR SC with good coherence could be generated since the pulse with T=80 fs is used as the pump source and the noise amplification induced by the MI effect can be depressed.
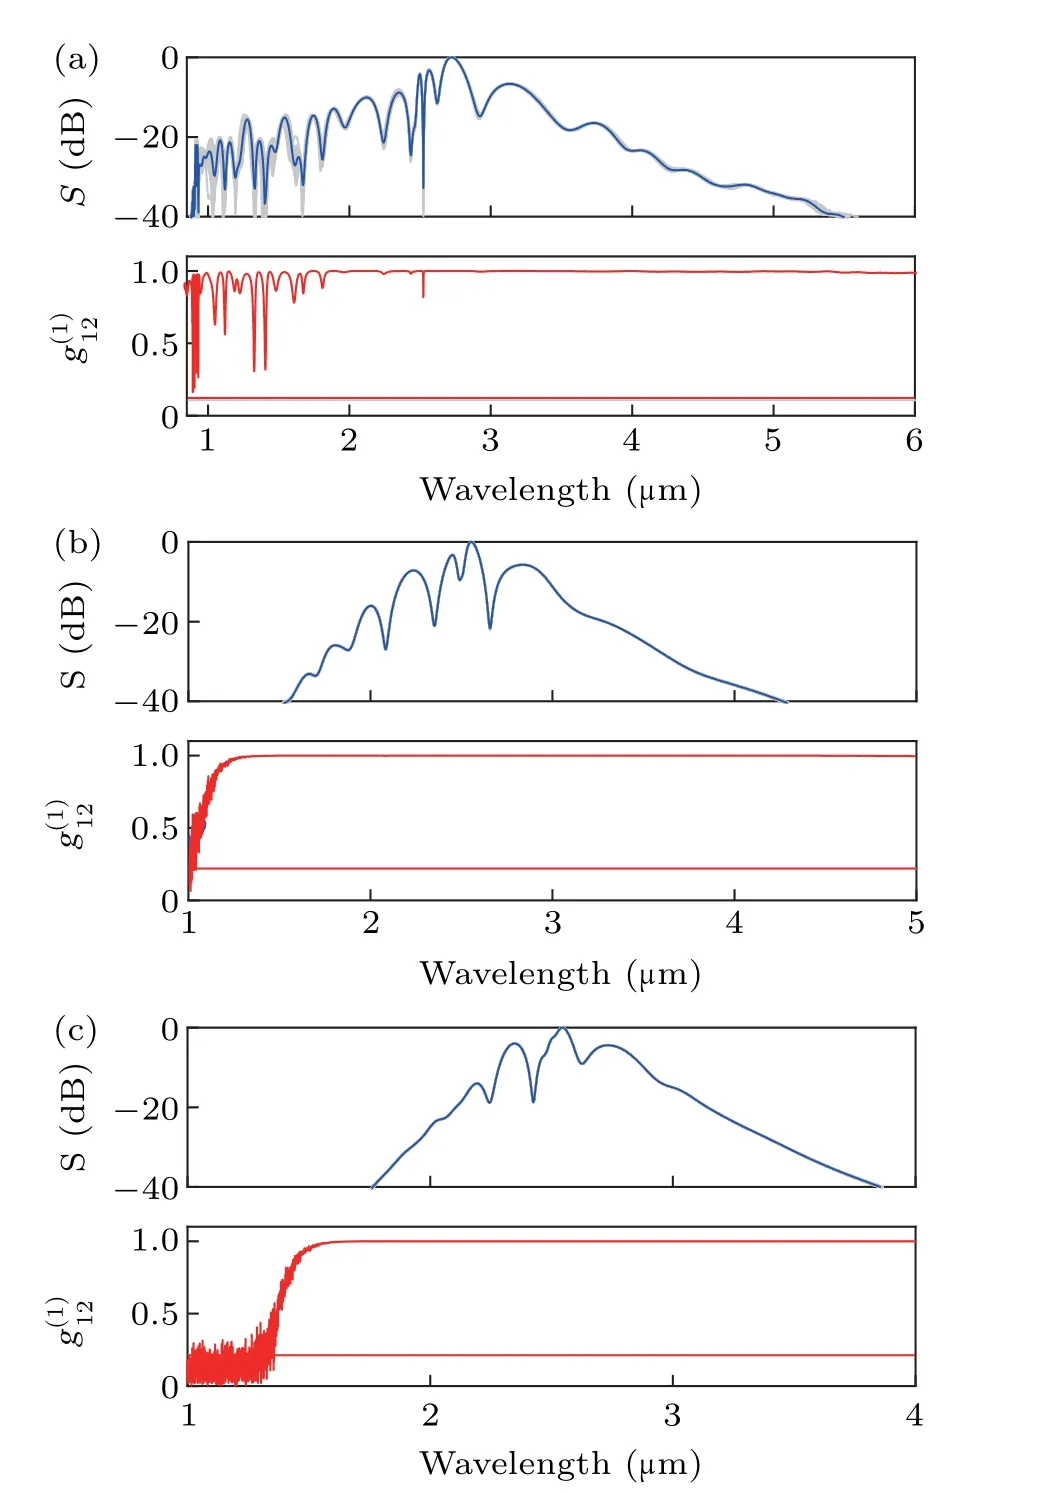
Fig.7.The generated SCs at the top andat the bottom with a noise level η=0.001 for(a)LP01,(b)LP02,and(c)LP12 modes.The grey lines are the overlapped spectra of the 50 shots with the random noise.The red,blue,and magenta lines represent the averaged spectra of the 50 shots,respectively.
To obtain the quantitative result of the coherence of the MIR SC in the considered wavelength range,ηis chosen in the range from 10−6to 10−1,and 50 shots pulses are still used as the pump source.After the coherence is obtained,R is calculated according to Eq.(8),and the curve of R with respect to lg(η)is shown in Fig.8(a).It can be seen from Fig.8(a)that when lg(η)≤−3,R of the LP01,LP02,and LP12modes is close to 1,which means that the SCs generated with the three optical modes have good coherence.When lg(η)increases to−2,R of the LP01mode drops rapidly to 0.59,while R of the LP02and LP12modes is still approximately 1.As lg(η)continues to increase,R of the LP01mode drops to 0.38,and R of the LP02and LP12modes both fall below 0.9.Since R of the three optical modes are very close to 1 when lg(η)≤−3,the curve of K with respect to lg(η)is calculated by Eq.(9),as shown in Fig.8(b).The three increasing curves indicate that as lg(η)increases,the coherence is degraded.From Fig.8(b),the coherence of the LP02mode is better than that of the LP12mode when lg(η)≤−3,and the coherence of the LP12mode is better than that of the LP02mode when lg(η)>−3.Compared with the LP01mode,when lg(η)=−6,the coherence of the LP01mode is between the LP02and LP12modes.When lg(η)=−5,the coherence of the LP01mode is almost the same as the LP02mode.When lg(η)≥−4,the coherence of the LP01mode degrades rapidly,which is much worse than the other two optical modes.
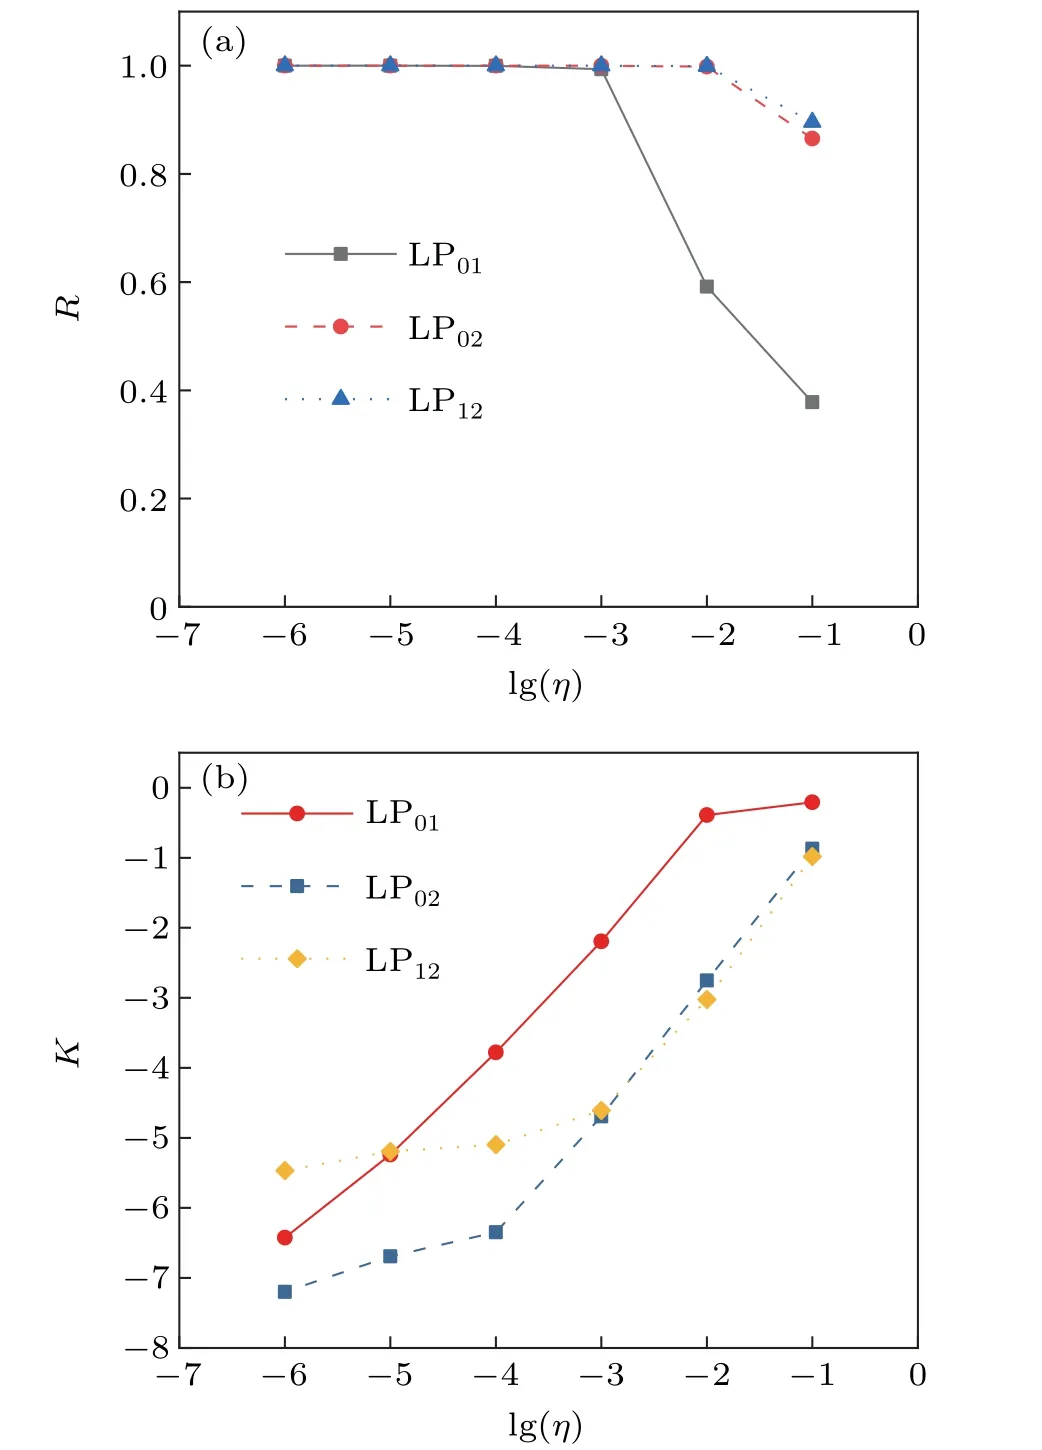
Fig.8.(a)R and(b)K as functions of lg(η)for the LP01,LP02,and LP12 modes,respectively.
In order to obtain the SC-based OFC source,we launch a train of 50 pulses at a repetition rate of 1 GHz into the anomalous dispersion region of the LP01,LP02,and LP12modes of the designed MM-TPCF.The OFCs generated with the LP01,LP02,and LP12modes are shown in Figs.9(a),9(b),and 9(c),respectively,where the shaded color regions represent the highly dense OFCs.To observe the individual comb lines clearly,the zoom-in views of the OFCs generated at 100 THz(upper)and 120 THz(lower)are shown in the inserts of Figs.9(a),9(b),and 9(c).It can be seen from the insets of Figs.9(a),9(b),and 9(c)that the discrete comb line has a frequency interval of 1 GHz,and the comb line amplitude in the sampling bandwidth of 5 GHz is equal.Among them,because the coherence of the SC generated with the LP01mode is not very good,each comb line of the LP01mode shows asymmetric.
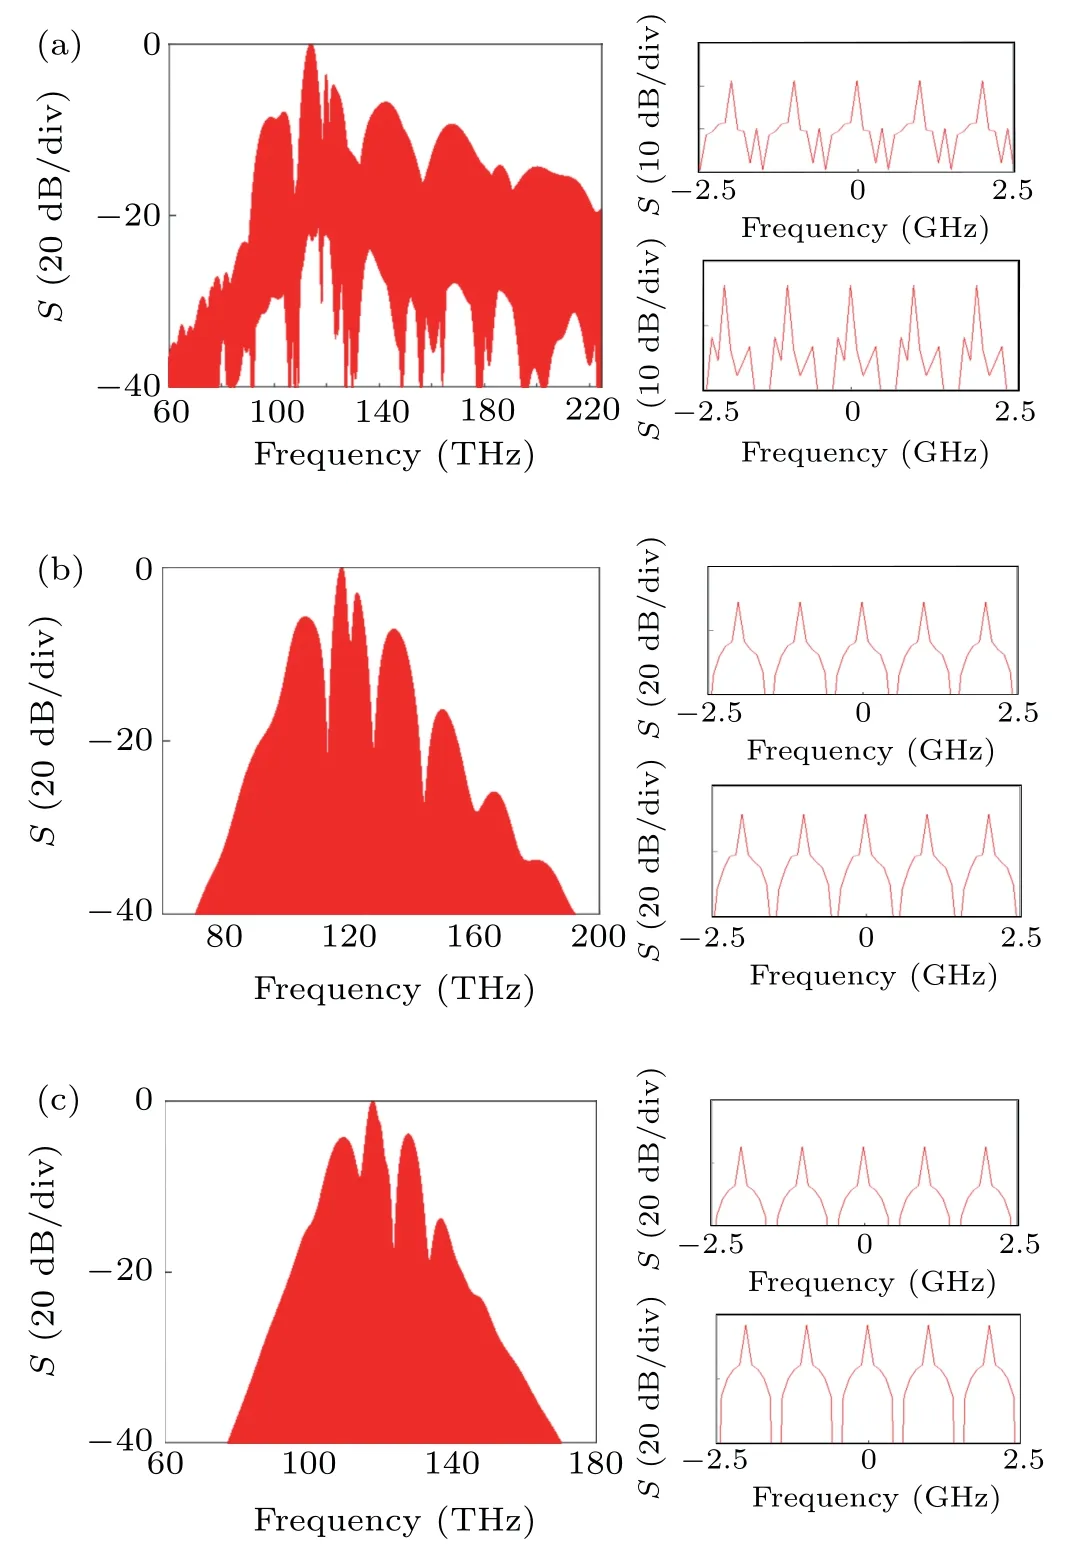
Fig.9.The OFCs generated by a train of 50 pulses at a repetition rate of 1 GHz for the(a)LP01,(b)LP02,and(c)LP12 modes,respectively.The shaded color areas represent the highly dense OFCs.The inserts of panels(a),(b),and(c)show the zoom-in views of the highly dense OFCs at 100 THz(upper)and 120 THz(lower).
4.Conclusion
In summary,we design an MM-TPCF for the MIR SC generation.The influences of the pump pulse parameters on the multimode nonlinear process of the SC generation are investigated.When the pump pulse withλ0=2.5µm,T0=80 fs,and P0=18 kW is coupled into the anomalous dispersion region of the LP01,LP02,and LP12modes of the 3-mm-long MM-TPCF,the highly coherent and octave-spanning MIR SCs can be generated.Finally,based on the generated MIR SCs,the OFCs are obtained when a train of 50 pulses at a repetition rate of 1 GHz is used as the pump source.Our research results can find important applications in optical communication,spectroscopy,metrology,etc.
杂志排行
Chinese Physics B的其它文章
- Multiple solutions and hysteresis in the flows driven by surface with antisymmetric velocity profile∗
- Magnetization relaxation of uniaxial anisotropic ferromagnetic particles with linear reaction dynamics driven by DC/AC magnetic field∗
- Influences of spin–orbit interaction on quantum speed limit and entanglement of spin qubits in coupled quantum dots
- Quantum multicast schemes of different quantum states via non-maximally entangled channels with multiparty involvement∗
- Magnetic and electronic properties of two-dimensional metal-organic frameworks TM3(C2NH)12*
- Preparation of a two-state mixture of ultracold fermionic atoms with balanced population subject to the unstable magnetic field∗
