Identification of unstable individuals in dynamic networks∗
2021-09-28DongliDuan段东立TaoChai柴涛XixiWu武茜茜ChengxingWu吴成星ShubinSi司书宾andGenqingBian边根庆
Dongli Duan(段东立),Tao Chai(柴涛),Xixi Wu(武茜茜),Chengxing Wu(吴成星),Shubin Si(司书宾),and Genqing Bian(边根庆)
1School of Information and Control Engineering,Xi’an University of Architecture and Technology,Xi’an 710311,China
2School of Mechanical Engineering,Northwestern Polytechnical University,Xi’an 710072,China
3Key Laboratory of Industrial Engineering and Intelligent Manufacturing(Ministry of Industry and Information Technology),Northwestern Polytechnical University,Xi’an 710072,China
Keywords:network,dynamic behaviors,stability,perturbation
1.Introduction
The rapid development of large-scale networks in various fields makes the research of complex networks more and more essential.[1]In many real systems with different dynamic processes,the exchange of substance,energy,and information occurs frequently to perform the functions of the system.Generally,a local perturbation will gradually spread to the whole system,which will even affect other networks through interdependencies between networks.[2]Hence,there is a growing concern on the dynamic processes to reveal the character and function of actual networks.[3,4]The stability of the network is defined as the system ability to maintain the steady state or function after being disturbed.The loss and impact caused by network failures or crashes makes the research of the network stability more valuable and practical.
The stability evaluation is one of the basic problems in various dynamic systems,such as neural network,epidemics process and critical infrastructure networks.In neural networks with time delay,one could derive the stability conditions of neural networks under different conditions by matrix inequalities based on stability theory and functionals,[5–7]the necessary and sufficient conditions of network stability could be obtained furthermore by Lyapunov stability theory.Duan et al.[8]studied the stability and decentralized control problems in linear and sector-nonlinear complex dynamical networks,and gave the necessary and sufficient conditions for stability under special decentralized control strategies.With these methods,Liu et al.[9,10]focused on the stability analysis and decentralized control problems for a special linear dynamic network by state space dynamic approach.The global asymptotic stability in epidemic models has also been extensively studied.The dynamic thresholds of epidemic models have been obtained by analyzing the networks with different traits,such as the SIRS epidemic model in the complex heterogeneous networks,[11]the SIS network model incorporating the influence of media,[12]the SIS epidemic model with feedback mechanism on networks,[13]the SIS and SIRS models in adaptive complex network.[14]For example,in the heterogeneous network with birth and death rates,Li et al.[11]found that the threshold value completely determines whether the disease-free equilibrium of the SIRS model can be stable.The traffic problems frequently occur with the rapid development of modern cities,which makes the robustness and stability of transportation networks receive more attention.[15,16]Yang et al.[17]assessed the robustness of Beijing Subway system(BSS)network and found that the BSS exhibits typical characteristics of a scale-free network,with relatively high survivability and robustness when faced with random failures,whereas error tolerance is relatively low when the hubs undergo malicious attacks.
The stability of the entire complex system is one of the major focuses in these systems.The research on neural network and epidemic model mainly uses stability theory to analyze the steady state of the complex system and explores the threshold of network activity state.For traffic networks the concern is the dynamical propagation characteristic and the stability of of the entire transportation networks under perturbation,which generally is performed by by modeling and simulation.
However,as the mesoscopic structure organization can describe the interaction mechanism and evolution process of the networks more precisely,it becomes the focus of network science research gradually replacing the research of macro statistical law.[4]Gao et al.[18]studied the system resilience by conducting intentional disturbance such as removing the node or the edge and changing the weight of network.Barzel et al.[19]proposed a correlation matrix to describe the interaction between the nodes and the activity change.They defined the stability of the disturbed node based on the adjacency matrix and the correlation matrix,which captures the magnitude of the response of disturbed node to individual perturbations of the nearest neighbors.The fluctuation occurs frequently due to the external disturbances in real systems.The changes of the entire network under perturbations,especially the impact of disturbances at the individual node on the entire network are critical to the controlling and optimization of complex networks.Compared with the stability analysis of the whole system,we tend to revel the stability impact of individual components on the whole network,especially the individual node which is disturbed in the dynamic networks.
In this paper,we explore the stability of nodes for a broad range of steady-state dynamical processes including biochemical dynamics,epidemic processes,birth–death processes and regulatory dynamics.Since the close relationship between the steady-state activity of the nodes and the structure,we try to directly revel the interaction and stability between the nodes by the structure feature.With the local correlation matrix(LCM)and the Markov process,we propose a new index of stability to identify the most unstable nodes in the dynamic networks.
2.Local correlation matrix and stability index
To explore nonlinear dynamics on various complex systems,the individual’s activity and its changes are always used to describe the evolution process.Suppose a complex network with N nodes(components),the dynamical process of each node i is captured by its activity following the rate equation as

Here W(xi(t))represents the self-dynamics on node i,and Q(xi,xj)describes the effect of the pairwise interaction.Equation(1)represents the dynamical models in Table 1 when xiis given with the corresponding actual meaning.In epidemic processes(E),xiis the infection probability.In biochemical dynamics(B),xidenotes the concentration of a reactant.In birth–death process(BD),xirepresents the population at i.In regulatory dynamics(R),xiis the expression level of gene i.[19]When the system comes to a steady state,the activities will not change any longer,so one gets dxi/dt=0,namely,

A perturbation is induced on node j to study the correlation between nodes,and the response of the neighboring node i is xi→xi+∂xi.Due to the disturbance at node j,the entire system will reach a new steady state,that is,
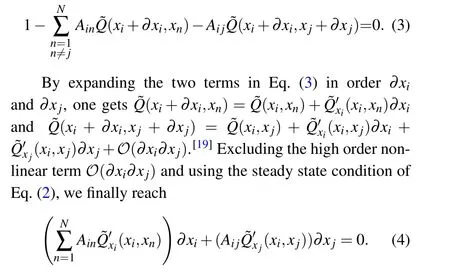
Therefore,one gets

In order to describe the influence of disturbed nodes j,the local correlation matrix Rijis proposed,which represents the degree of influence of all neighbors around the node j after it is disturbed.After the node j is disturbed,the neighboring nodes will continue to interact with each other following the local correlation matrix Rij,and the nodes i are only affected by the neighboring nodes to reach the steady state.Hence,the correlation matrix is


The self-dynamics and the interaction between nodes of the four frequently explored dynamical process are shown in Table 1,one can infer the corresponding LCM by Eq.(7).Since W(xi)and Q(xi,xj)are directly reacted by the initial steady state of the nodes in the network,we can obtain the relationship between local correlation matrix Rijand the initial steady state xi.
The local correlation matrix Rijcaptures the influence of the disturbed node j on all its nearest neighboring nodes.Actually,it only contains the first-step spreading information when perturbation is conducted on the system.In other words,the influence brought by the disturbance follows the rate equation spreading from its nearest neighboring nodes to the whole system.Hence,Rijrecords the activity change of the node after being only affected by the neighboring nodes before the entire network reaches the new steady state.Through the interaction between nodes,the influence of disturbance is continuously transmitted between neighboring nodes,and the transmission of each step follows the local influence relationship matrix,so it can be considered as a Markov process.Briefly,each node is only affected by its neighboring nodes,and the impact of each step follows the local correlation matrix,which can be regarded as the probability transfer matrix of the Markov chain.The matrix Rij=(rij)N×Nis normalized to obtain

We set the normalized matrix as R1ij,which is the transfer matrix of the interaction relationship between nodes.According to the regular Markov chain,there is a stationary distribution that satisfies

Here,α=[α1,α2,...,αN]Tdescribes average change of the node when its neighbors are disturbed.The node is more likely to be affected if the value ofαiis larger,that is,it is more unstable.Then the new stability is defined as Sa,

We can see that the local correlation matrix describes the interaction relationship between neighboring nodes.Taking it as the transfer rate matrix of Markov chain,the steady probability vector Sacould depict the influence caused by perturbation on its neighboring nodes.Therefore,the greater the value of Safor the nodes is,the greater the change is at the node after being affected by the disturbance,and the more unstable the corresponding node is.
3.Simulation results and theoretical solutions
With the appropriate choice of the nonlinear W(xi)and Q(xi,xj),Eq.(1)can be mapped exactly into several dynamical models explored in the literature.Equation(1)represents the dynamical models in Table 1 when xiis given the corresponding actual meaning.In this paper,we study four frequently explored models ranging from biochemical dynamics,birth–death process,gene regulatory dynamics,to epidemic process,as shown in Table 1.We capture the relationship between steady-state activity and node degree to revel the influence mechanism between the local influence matrix and the steady-state activity in Fig.1.
The stability of each node in the network can be obtained through the local correlation matrix Rij=(rij)N×N.According to Eq.(7),we have established a relationship between the local correlation matrix Rij=(rij)N×Nand the initial steady state of the network.However,the acquisition of the local influence relationship matrix is not convenient,because the initial steady state needs to be simulated.Therefore,we want to give the relationship between the local correlation matrix and the structural indexes,so that when we obtain the structure and dynamic behavior of the network,the local correlation matrix and the stability of all nodes can be obtained.We find a clear correlation between steady-state activity and node degree of structural index(Fig.1),which can be well fitted with a power function.
Obviously,the fitting parameters will change with the network structure and dynamic behavior,as the steady-state activity is very sensitive to the changes that occur in the network,whether it is a change in network structure or in dynamic behavior,which causes the fitting parameters difficult to beestimated.Fortunately,we give approximately the relationship between the fitting parameters and the network average〈k〉to make the stability directly related to the basic structural parameters(Fig.2).In BD,B and R,the power function(xi=σ·kiτ)containing two parameters can fit well,while in E,the power function with three parameters(xi=σ·kiτ+λ)can fit well.That is,when the structural parameters(average degree)and the dynamic behavior in the network are given,the steady-state activity is obtained from the relationship between the steadystate activity and the degree,then the local correlation matrix and the stability can be calculated.

Table 1.Dynamical models and its LCM.
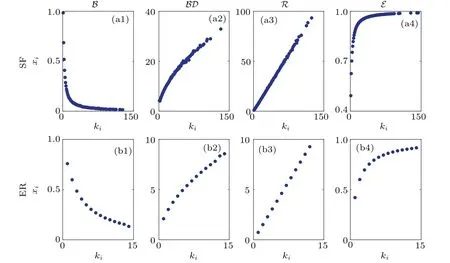
Fig.1.The relationship between the initial steady state xi and the degree ki in the network with four dynamic processes and N=1000,〈k〉=4.(a1)–(a4)Steady state for B,BD,E and R dynamics on scale-free networks.(b1)–(b4)Steady state for B,BD,E and R dynamics on ER networks.
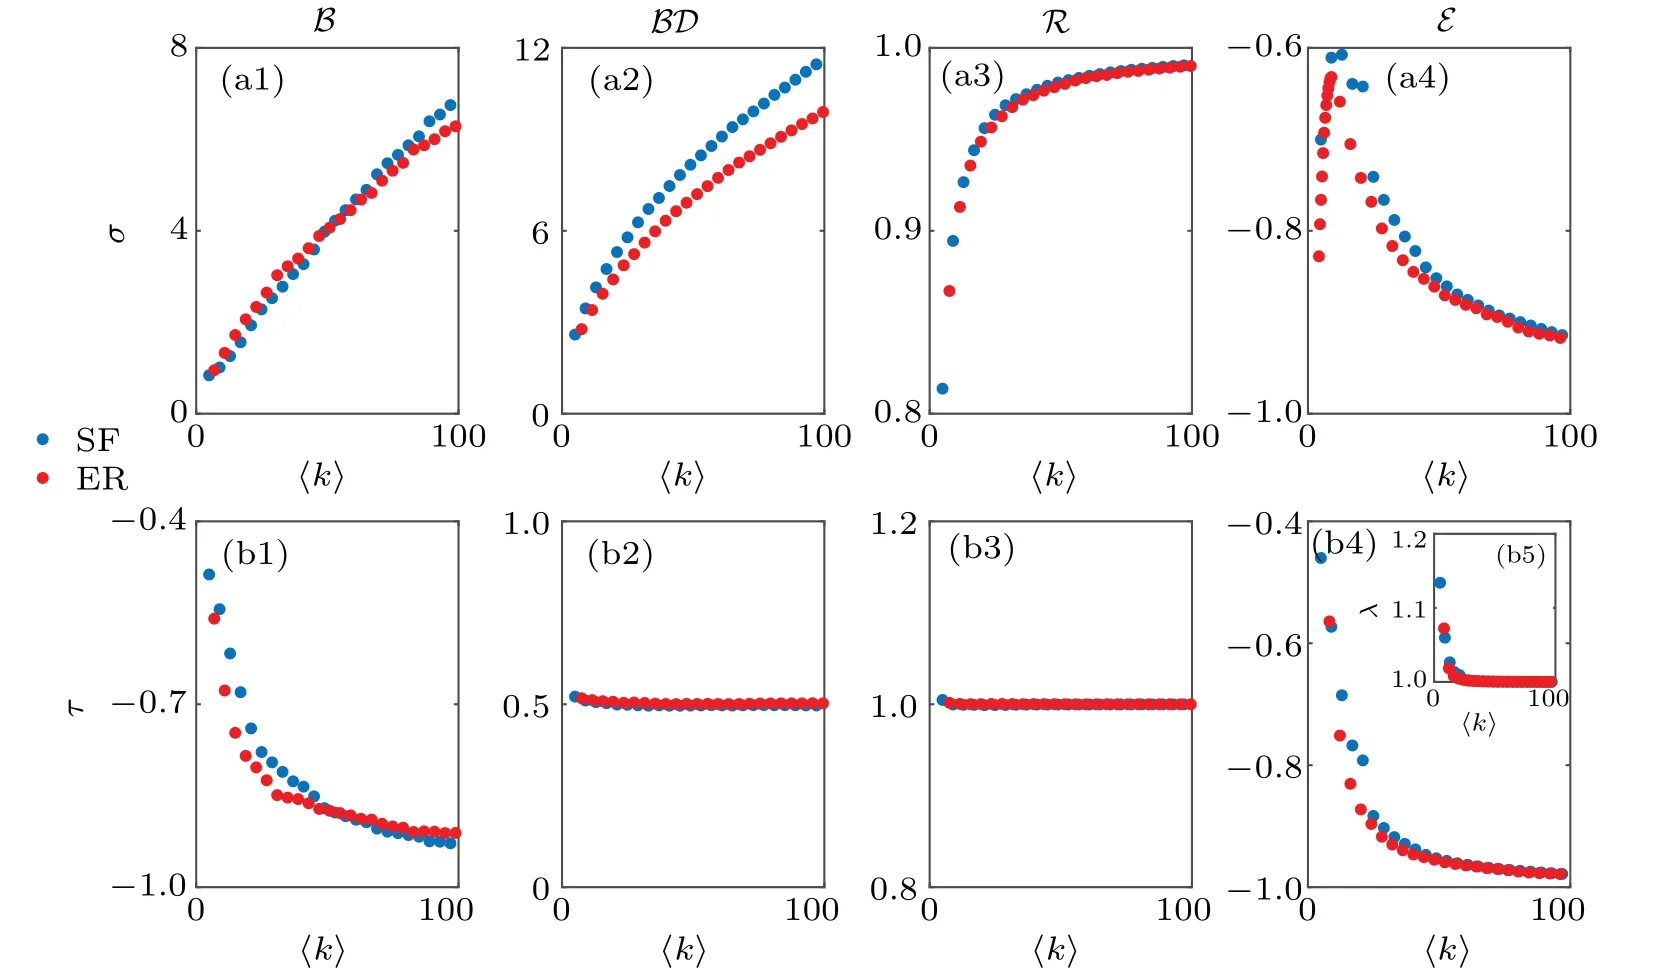
Fig.2.The relationship between the fitting parameter and the average degree in the network with four dynamic processes.We set the SF and ER network with N=1000 and〈k〉=100,then we continually remove the edges in the network to make the average degree〈k〉decrease.We establish the relationship between the average degree and the fitting parameters by removing the edges.(a1)–(a4)Fitting results ofσfor B,BD,E and R dynamics.(b1)–(b4)Fitting results ofτfor B,BD,E and R dynamics on ER networks.
As can be seen from Fig.3,the network structure affects the distribution of network node stability,the stability distribution in SF and ER networks is different mainly driven by their degree distribution.In ER networks,the stability Sais normally distributed,and the distribution P(Sa)of the stability is independent of the dynamics.Because the local correlation matrix and stability of the network can be resolved,we compare the simulation results with the results of the analysis(Figs.3(c1)–3(c4)and 3(d1)–3(d4)).The analysis agrees well with the simulation results,proving that it is feasible and reasonable to measure the stability of the nodes by structure.
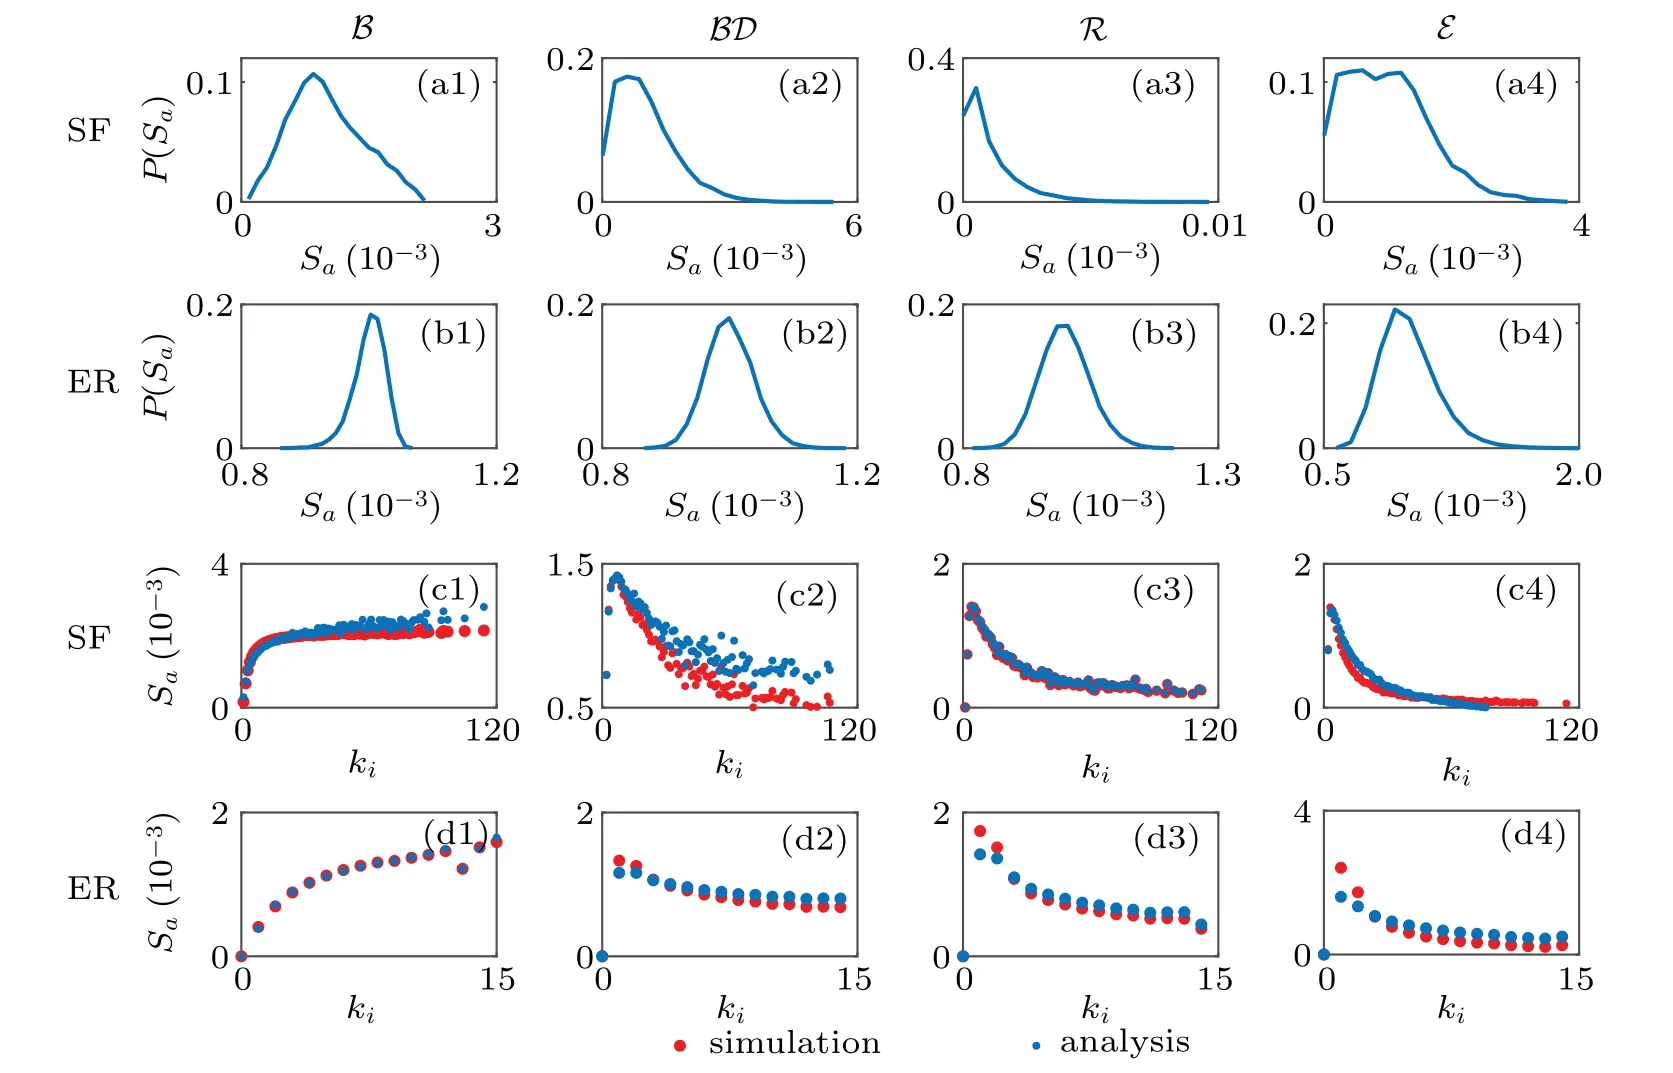
Fig.3.The stability distribution and the relationship between the node stability and its degree.[(a1)–(a4),(b1)–(b4)]The distribution of stability for B,BD,E and R dynamics on SF and ER networks respectively.[(c1)–(d4),(d1)–(d4)]Comparison of stability’s simulation and analytical results,the relationship between stability and node degree is given in the case of analysis and simulation for B,BD,E and R dynamics on SF and ER networks,respectively.
The curves of relationship between the stability and the degree are different in four dynamic processes,especially the curve of B is quite different from the other three dynamics.In SF with B(Fig.3(c1)),when the degree of node is less than a certain value,the stability value of the node increases as the degree of node increases.When the degree of the node is greater than a certain value,the stability of the node no longer increases significantly with the increase of the degree,and the value of the stability would stay steady.In SF with BD,R,E(Figs.3(c2)–3(c4)),when the degree of node is small(the degree of node is less than 4),the value of the stability increases as the degree of node increases.When the degree of node is large,the stability of the node decreases as the node degree increases.In ER with B(Fig.3(d1)),the stability value of the node increases as the degree of node increases.In contrast,the value of the node stability increases as the degree of node increases when the network is governed respectively by BD,R and E dynamics(Figs.3(d2)–3(d4)).
4.Case studies and comparisons
To test the effectiveness of our method,we compare our index with the node stability index in Ref.[19]for the four dynamics in Table 1.In B,the stability evaluation of the nodes given by the two stabilities is similar,whether it is SF network(Fig.4(a1))or ER network(Fig.4(b1)).However,it is different in the other three dynamics.Different network structures have a great impact on the stability Saof the network.In SF with BD,R and E,the stability of the node will decrease first and then increase with the increase of node’s degree.In the ER network,stability is positively correlated with node degrees.Compared with the linear performance of stability Si(Fig.4),the stability Sais relatively nonlinear and irrelevant with the degree of node.Relatively,Sais more suitable for measuring the stability of all nodes and identifying the most unstable nodes in the entire network.It should be noted that our proposed Sais to measure the change range caused by disturbance,so we take its reciprocal as the stability index.In addition,compared with Sithere is no need to simulate the stable dynamics of the system for our method,the structure information and its dynamical models are enough to estimate the Sa.
To illustrate the power of our method and the proposed stability index,we compare the evaluation results of Saand degree centrality of each node by ranking the indices in descending order for four dynamics on ER and SF networks.To measure the difference of the sorting sequence,we define the parameter ratio as the same nodes that the two sequences contain in the previous f percentile.The two sequences are more similar if the ratio is close to 1,else the value is 0 as the two sequences are completely different.The red curves in Fig.5 are the results of comparison between the descending sequences of Saand degree centrality in different dynamic networks.For B dynamics(Figs.5(a1)and 5(b1)),the ratio of the same nodes is close to 1,so the sequences of Sais positively correlated with the degree centrality.Compared B and BD on the same network(blue curves in Figs.5(a1)and 5(b1)),the value of the ratio increases from 0 to 1.The sequences given by our stability index for B and BD dynamics are obviously different.Obviously,for BD,R and E,the sequences sorted by Saand degree(red curves in Figs.5(a2)–5(a4)and 5(b2)–5(b4))are quite different,the value of Sais negatively correlated with the node degree.We can see as well that the dynamic process has different influence patterns on the measures of node stability(green and blue curves in Figs.5(a2),5(a3),5(b2),and 5(b3)).It should be noted that our index is an approximate solution of the dynamic systems,which means that it is unnecessary to simulate the dynamic behaviors to calculate the measure.One can get the dynamical stability index just by the structure parameters.
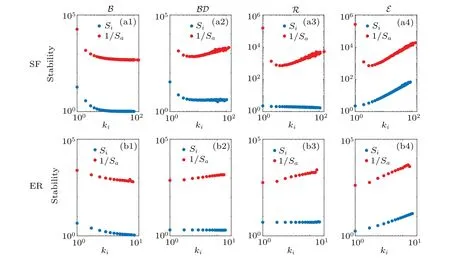
Fig.4.Comparison of the stability index 1/Sa with Si in SF and ER networks for four dynamics.Sa is the vectorα=[α1,α2,...,αN]T.The index Si=1/ AijGij proposed in Ref.[19]reflects the response of node i to individual perturbations of its neighbors.(a1)–(a4)The node stability for B,BD,E and R dynamics on SF networks.(b1)–(b4)The node stability for B,BD,E and R dynamics on ER networks.
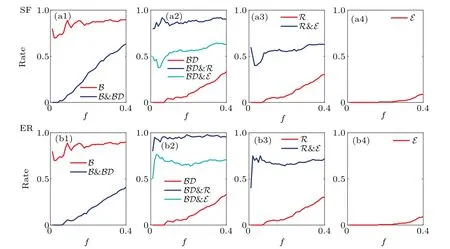
Fig.5.Ratio of the same nodes that both the Sa and degree sequences contain in previous f percentile.N=1000,〈k〉=4.f is the prepercentage of nodes in the sequence.The y-label rate represents the proportion of the same node in the pre-percentage f of the two sequences.If two sequences are the same with each other,one gets rate=1,while rate=0 if the two sequences are different completely.
5.Discussion and conclusion
In various fields,how to identify the unstable individuals is still one of the limitations to design and optimize a robust system.Considering the change of the activity of the nodes,we propose an index Sato measure the stability of the nodes based on the local correlation matrix and the Markov process,and study the stability of all nodes in the network.Based on the network dynamics rate equation and the local correlation matrix,we give the relationship between the stability of the nodes and the structure.Compared to other stability indices,our index is an approximate theory solution of the dynamic systems,which means that it is unnecessary to simulate the dynamic behaviors to calculate the measure.One can get the dynamical stability index just by the structure parameters,which enables the index to have much higher computing efficiency.
Exploring a broad range of steady-state dynamical processes including biochemical dynamics,epidemic processes,birth–death processes and regulatory dynamics,we find that:(i)It is feasible and effective to calculate the relationship parameters between the initial steady state and the node degree by the network average degree.(ii)The node stability can be obtained approximately with the degree and the dynamical rate parameters via simplifying the spreading process caused by one disturbance as a Markove chain.(iii)The stability Sawe proposed is suitable for identifying unstable nodes in the dynamical network.(iv)For ER networks,the most unstable nodes for B dynamics are the max degree nodes while the min degree nodes are most unstable for BD,R and E dynamics.For SF networks,the most unstable nodes are still the max degree nodes for B dynamics,however the unstable nodes for other tree dynamics are some intermediate degree nodes.
杂志排行
Chinese Physics B的其它文章
- Multiple solutions and hysteresis in the flows driven by surface with antisymmetric velocity profile∗
- Magnetization relaxation of uniaxial anisotropic ferromagnetic particles with linear reaction dynamics driven by DC/AC magnetic field∗
- Influences of spin–orbit interaction on quantum speed limit and entanglement of spin qubits in coupled quantum dots
- Quantum multicast schemes of different quantum states via non-maximally entangled channels with multiparty involvement∗
- Magnetic and electronic properties of two-dimensional metal-organic frameworks TM3(C2NH)12*
- Preparation of a two-state mixture of ultracold fermionic atoms with balanced population subject to the unstable magnetic field∗
