Machine learning combined with Langmuir probe measurements for diagnosis of dusty plasma of a positive column
2021-09-10ZheDING丁哲JingfengYAO姚静锋YingWANG王莹ChengxunYUAN袁承勋ZhongxiangZHOU周忠祥AnatolyKUDRYAVTSEVRuilinGAO高瑞林andJieshuJIA贾洁姝
Zhe DING (丁哲),Jingfeng YAO (姚静锋),Ying WANG (王莹),2,Chengxun YUAN (袁承勋),2,∗,Zhongxiang ZHOU (周忠祥),2,Anatoly A KUDRYAVTSEV,2,3,Ruilin GAO (高瑞林) and Jieshu JIA (贾洁姝)
1 School of Physics,Harbin Institute of Technology,Harbin 150001,People’s Republic of China
2 Heilongjiang Provincial Key Laboratory of Plasma Physics and Application Technology,Harbin 150001,People’s Republic of China
3 Physics Department,Saint Petersburg State University,St.Petersburg 198504,Russia
4 Shanghai Electro-Mechanical Engineering Institute,Shanghai 201109,People’s Republic of China
5 Science and Technology on Electromagnetic Scattering Laboratory,Shanghai 200438,People’s Republic of China
Abstract This paper reports the use of machine learning to enhance the diagnosis of a dusty plasma.Dust in a plasma has a large impact on the properties of the plasma.According to a probe diagnostic experiment on a dust-free plasma combined with machine learning,an experiment on a dusty plasma is designed and carried out.Using a specific experimental device,dusty plasma with a stable and controllable dust particle density is generated.A Langmuir probe is used to measure the electron density and electron temperature under different pressures,discharge currents,and dust particle densities.The diagnostic result is processed through a machine learning algorithm,and the error of the predicted results under different pressures and discharge currents is analyzed,from which the law of the machine learning results changing with the pressure and discharge current is obtained.Finally,the results are compared with theoretical simulations to further analyze the properties of the electron density and temperature of the dusty plasma.
Keywords: dusty plasma,machine learning,Langmuir probe
1.Introduction
Dusty plasma is a plasma system formed by adding dust particles to a plasma [1].The dust particles become charged due to the nature of the plasma itself [2].Dusty plasmas are often not intentional but sometimes formed intentionally for certain applications.Because the properties of charged dust particles are different from those of electrons and ions,dusty plasma has many unique characteristics [3].It plays an important role in the field of space and engineering applications [4,5].In carrying out laboratory research on dusty plasma,it is important to understand the specific parameters of the dusty plasma [6,7],especially its electron density and electron temperature [8].The diagnostic method is therefore at the heart of experimental research on dusty plasma,so that improving the diagnostic method is of great significance [9].
The very existence of the dust particles makes the diagnosis of dusty plasma in the laboratory a very challenging problem[10].Commonly used methods include spectrum diagnosis[11],microwave diagnosis[12],and probe diagnosis[13].In spectrum diagnosis,the fiber probe can usually diagnose only outside the plasma area[14].Dust particles in the dusty plasma interfere with the spectrum that the probe can receive,so that the measured spectrum cannot accurately reflect the real situation inside the dusty plasma.For microwave diagnosis,since the dust particles carry electric charges,they will,like electrons,interact with the electromagnetic waves passing through the plasma,causing attenuation of the waves and introducing errors in the measurement of parameters.For probe diagnosis [15],because the diagnostic system applies a voltage to the probe during the diagnostic process,the charged dust particles will adhere to the surface of the probe,preventing the probe from collecting the current in the plasma[10].Because the dust attachment process is relatively random,accurate corrections cannot be made during the diagnostic process and the probe data cannot be calculated correctly [16].So,the dust particles and especially the fact that they are charged prevent the accurate diagnosis of dusty plasma using conventional diagnostic methods.Therefore,improving the diagnostic methods is an important task in the study of dusty plasma [17].
At the same time,machine learning methods have been used to solve the Boltzmann equation of weakly ionized plasma[18].In plasma diagnosis,Jonathan Chalaturnyk[19]studied the feasibility of machine learning to enhance the diagnosis of dust-free plasma probes.In previous experiments,machine learning has also been successfully implemented to enhance the diagnosis of plasma probes [20].We conclude that improvement in diagnosing dusty plasma is feasible.Since the amount of dust in the dusty plasma has a direct influence on the diagnostic result,the use of machine learning to process the data obtained from the diagnosis and thereby to reduce the error of the result has great research value.At the same time,considering that in common probe diagnostic methods dust particles have relatively little influence,probe diagnosis can be used as the data source for machine learning in order to study parameters such as the electron density and temperature of the dusty plasma.
Here we present the results of a study in which diagnosing dusty plasma is combined with machine learning and probe diagnosis.The diagnostic result of a smaller dust density is input into the machine learning algorithm; then the result for a larger dust density is predicted,and the predicted result is analyzed.By comparing the results of machine learning with that of fluid model,the reliability of the machine learning algorithm is further verified,and the properties of electron density and temperature of the dust plasma are further analyzed by an improved probe diagnosis method.In section 2,the formulas and principles used in the simulation are introduced,and the machine learning algorithm is applied.In section 3,the experimental device and the process of carrying out the experiment are explained in detail,along with the specific research methods.In section 4,the results of the experiment are analyzed in detail and are compared with the results of a dust-free plasma.Finally,in section 5,conclusions are presented.

Figure 1.Schematic diagram of discharge device: (a) anode,(b) cathode,(c) dust particle,(d) Langmuir probe.
2.Setting up the experiment
In this section,the plasma generator,parameter selection,and some early data processing methods are introduced.
2.1.Dusty plasma generator and parameter selection
In order to obtain results of the initial dusty plasma probe diagnosis,the dusty plasma generator used by Ding [21] is adopted,as shown in figure 1.The experimental device can completely trap the dust particles in the curved part of the tube and thereby control the distribution of dust particles in the plasma.Because the density of dust particlesndis difficult to control accurately in the experiment,it is impossible to analyze accurately the influence of dust density on the experimental results.But by injecting a known amount of dust particles in this experimental device,the density of local dust particles can be changed regularly with changing the pressure and voltage,although the density of dust cannot be accurately known.Furthermore,accurate collection of probe data is realized,which provides better data for the prediction of the algorithm.
Figure 1 gives the overall structure of the plasma generator.It is bent 40 cm glass tube with an inside diameter of 3 cm.The electrode spacing is 25 cm.Some dust particles are placed in the glass tube,and after the discharge starts,they become suspended in the plasma to form a dusty plasma.The dust particles are made of aluminum oxide,there are about 200–300 dust particles in the bend.The dust particles are spherical and have a diameter of 5 μm.The plasma gas is helium,and DC glow discharge is used as the plasma environment in which the dust is suspended.The probe is at the curved part of the glass tube to measure the dusty plasma density and temperature in the positive column in that area.The probe used for measurement is the Impedans commercial probe system.By using high temperature to soften the wall of the glass tube,and passing the probe through the wall,the air tightness of the device is not affected.The plasma powersupply is a CE 1500 005T programed power-supply,which can directly read the power-supply current and voltage and continuously adjust its output parameters.The maximum power-supply voltage is 1500 V,and enough data can be obtained for machine learning training and verification.A 100 kW resistor is connected in series in the circuit.
In the probe diagnosis of plasma [22],due to the difficulty in measuring discharge current,the pressure and the total voltage of the circuit were selected as the input parameters of the algorithm for analysis.When diagnosing dusty plasma,by improving the accuracy of discharge current diagnosis,more basic discharge current can be selected as the input parameter.Therefore,discharge current and gas pressure are used as input parameters,and electron temperature and electron density are used as output parameters.The diagnostic results at a specific dust particle density are used to train the machine learning algorithms,in order to obtain diagnostic results at other dust particle densities.
2.2.Implementation details of machine learning
Because of its scalability and data-fitting ability,the multilayer perceptron (MLP) algorithm,with excellent performance in machine learning,was selected.The number of input nodes of the multilayer perceptron,=d2,corresponds to the pressure and voltage of the plasma.Similarly,the number of nodes in the output layer,=q2,corresponds to the electron temperature and electron density.Through a large number of experimental measurements,the model achieves the best performance when the number of network layers is =l1.The optimal number of nodes in each hidden layer ish1=20,h2=40,h3=40,andh4=20.The code is implemented by Pytorch 1.0 in Python,and the computing device is a desktop computer with Intel(R) Core(TM) i5-6500 CPU @ 3.20 GHz and NVIDIA GeForce GTX 1060 3 GB.To achieve better convergence of the model and avoid gradient disappearance,Gaussian regularization is adopted for both input and output data.We take the electron density data measured by experiments as the true value as the standard to evaluate the accuracy of data prediction.
The treatment method is as follows:
wherexis the data vector to be regularized,xregis the result of regularization,andTis the length of the vector.To measure the accuracy of the predicted results,an accuracy calculation method Ac is designed:

where(R∈0),1 is the maximum acceptable threshold,is the number of predicted data meeting condition equation(2)in the test phase.Ois the predicted result on the test set and is explained in detail in section 3.2.ˆOis the true value of test data,andPtotalis the number of test data,while ˆOandOare all the original values which are not regularized by equation (1).
3.Theories of dusty plasma and machine learning
After choosing the device to be used in the experiment and the selected parameters,the data obtained through the experiment need to be input into the machine learning algorithm for learning and training,and the predicted result needs to be compared with the simulation result of COMSOL Multiphysics software.In this section,the formulas for dusty plasma simulation and the machine learning algorithm that we used are introduced.
3.1.Model formulation of dusty plasma
We used Liang’s improved plasma fluid model [23] with the addition of the dust-charging process,and used helium as the gas.Simulations were performed using the finite element method in COMSOL Multiphysics software,which allows relatively simple solutions to complex problems in various fields.Below we briefly introduce the equations of the dusty plasma fluid model system.
The absorption term of each charged particle by dust particles is added to the plasma particle continuity equation:

where

k=(e,i) represents electrons or ions,nkis the density of electrons or ions,Skrepresents the sources and sinks caused by the plasma chemical processes,Ikis the corresponding electron or ion charging current,Γkis the flux density,μkandDkare,respectively,the corresponding mobility and diffusion coefficients,andEis the electric field,zkis the number of charges of the charged particles in the plasma.
Maxwellian electron energy distribution function was used for the calculation of rate constants in this work.The electron energy balance equation is written as

where

Hereneis the electron energy density and Γεis the heat flux density,εDis the electron energy diffusion coefficient.The first term on the right side of equation (6) expresses the thermal conductivity and the second term describes heat transfer due to electron drift in the electric fieldE.In equation (5),εSis the electron energy change due to the elastic and inelastic collisions.Energy loss of a single electron to a dust particle is assumed to beeφd.
The spatial distribution of the electric field is determined by the electric potential,obtained from the modified Poisson equation

whereε0is the vacuum dielectric constant.
The dust particle radiusrd=5μm.Assuming that at the center of the dust particle area,the electron density isne=4.01×10¹⁵m−3,the ion density isni=4.03×10¹⁵m−3,and the concentration of neutral molecules isng=1.56×10²²m−3.
We use the above formula to simulate dusty plasmas with different pressures,different discharge currents,and different dust particle densities,and compare the results obtained with the results obtained by the algorithm to further illustrate the feasibility of the algorithm and analyze the properties of electron density and temperature of the dusty plasma.
3.2.Theories of machine learning
MLP,also known as artificial neural network,is a neural network composed of fully connected layers with at least one hidden layer.The output of each hidden layer of the multilayer perceptron is transformed by the activation function so that the neural network can acquire the ability to fit a nonlinear function.Specifically,a small batch of sampleX∈Rn×dis given,with batch sizenand number of inputsd.For a MLP ofllayers,the number of hidden layers is −l1,and the number of neurons in each hidden layer ishi.We let the output of each hidden layer beHi∈Rn×hi,and the weight and bias parameters of a hidden layer be,respectively,Wi∈Rhi−1×hiandbi∈Rn×hi,so the output of the networkO∈Rn×qcan be written

whereqis the number of neurons in the output layer andφis the activation function.In our experiment,LeakyRelu [24] is selected as the activation function to avoid the problem of a vanishing gradient.This is expressed as
whereais hyperparameters,we follow the original value of LeakyRelu[24],which is set to 0.01 in the experiment.Mean square error (MSE) is the most commonly used loss function in regression problems.It is the mean of the sum of squares of the difference between the predicted value and the target value,and can be expressed as:
whereLis the loss function and ˆOis the true value of training data.In order to avoid falling into a local optimum in the training process,momentum parameters are added into the batch gradient descent,and the parameter update rule of the network is whereη> 0 is the learning rate,μis the hyperparameter of momentum,and ∇Lmse(θt)is the gradient at the tunable hyperparameterθt(includingWandB).

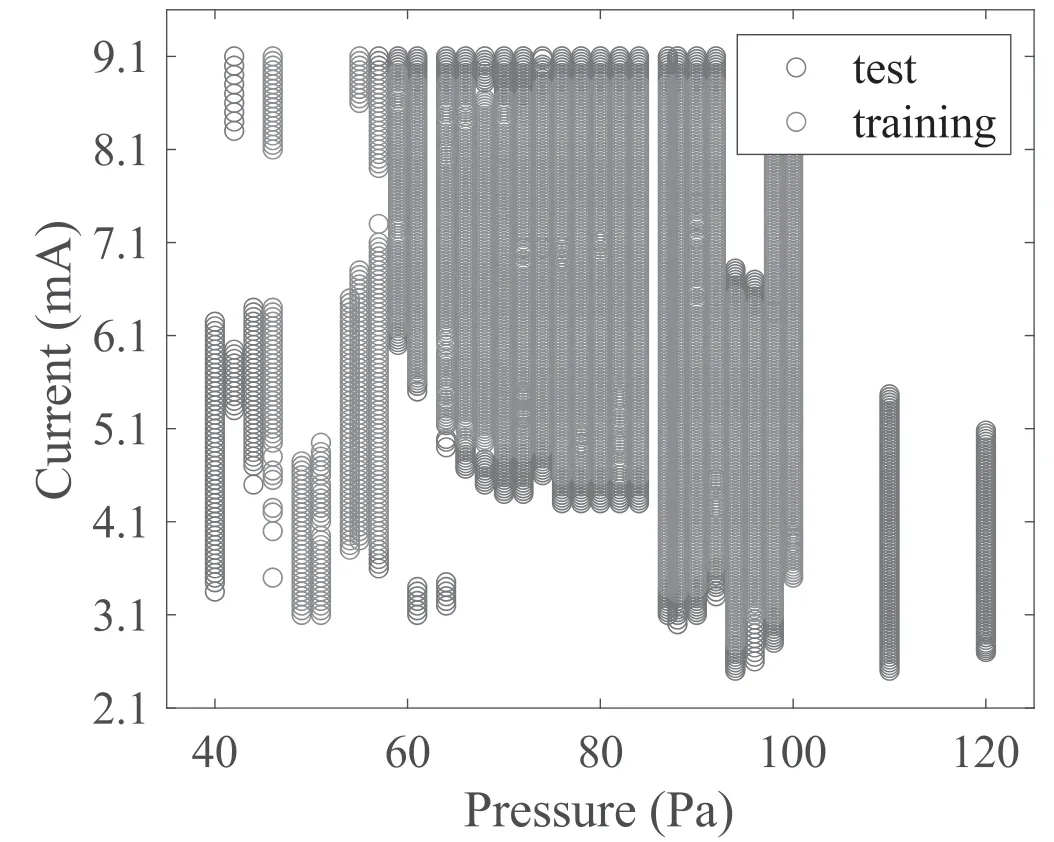
Figure 2.Distribution of probe measurement data.
4.Result
In the experiment,the plasma parameters under different dust injection volume,discharge currents,and pressures were measured.Regarding the distribution of pressure and discharge current in the probe data,as shown in figure 2,repeated measurements were made for different dust injection volumes,and 10%of the data were selected as the test set,the rest of the data being the training set.In the end,the machine learning algorithm was used to predict the electron temperature and electron density in a larger parameter range.The specific results are shown in figure 3.By fixing the volume of dust injected,the parameters of voltage and pressure will affect the dust density.Although it is difficult to directly control the dust density,the effect of the continuously changing dust density on the experimental results can clearly be seen and the machine learning algorithm allows the dust density to be simply used as an input parameter in subsequent applications.
Figure 4 shows the loss rate and accuracy rate of the machine learning algorithm as functions of the number of iterations.In figure 4(a),under the 10% standard,the accuracy rate of the electron density is finally stable at 92.23%,and under the 30% standard,the final accuracy can reach 100%,indicating that all data errors are less than 30%,according to the probe equation,the electron density can be calculated:
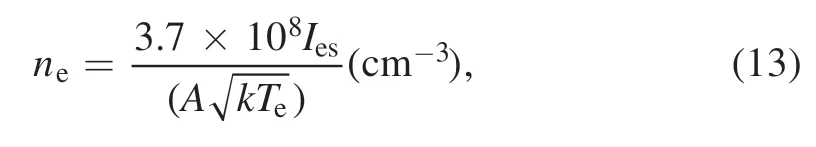
whereAis the surface area of the probe,andIesis the electron saturation current.
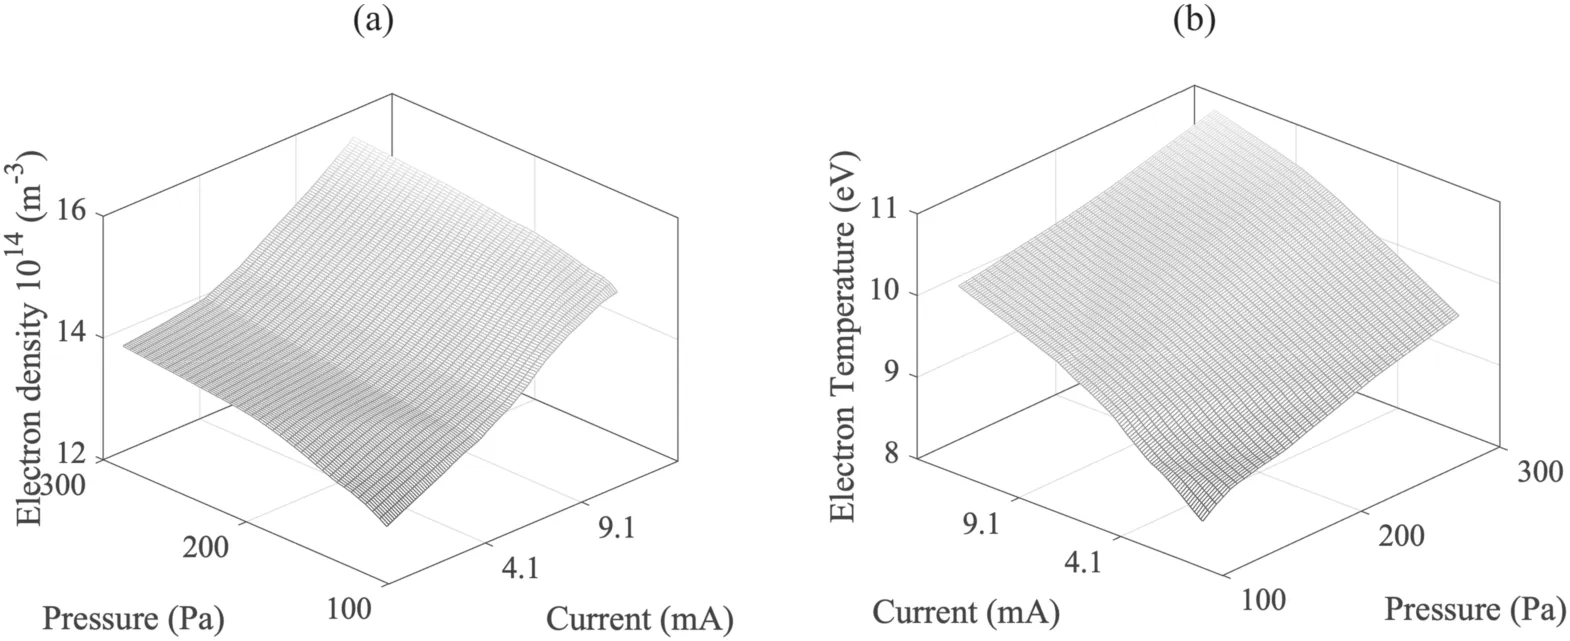
Figure 3.Distribution of predicted data: (a) electron density,(b) electron temperature.
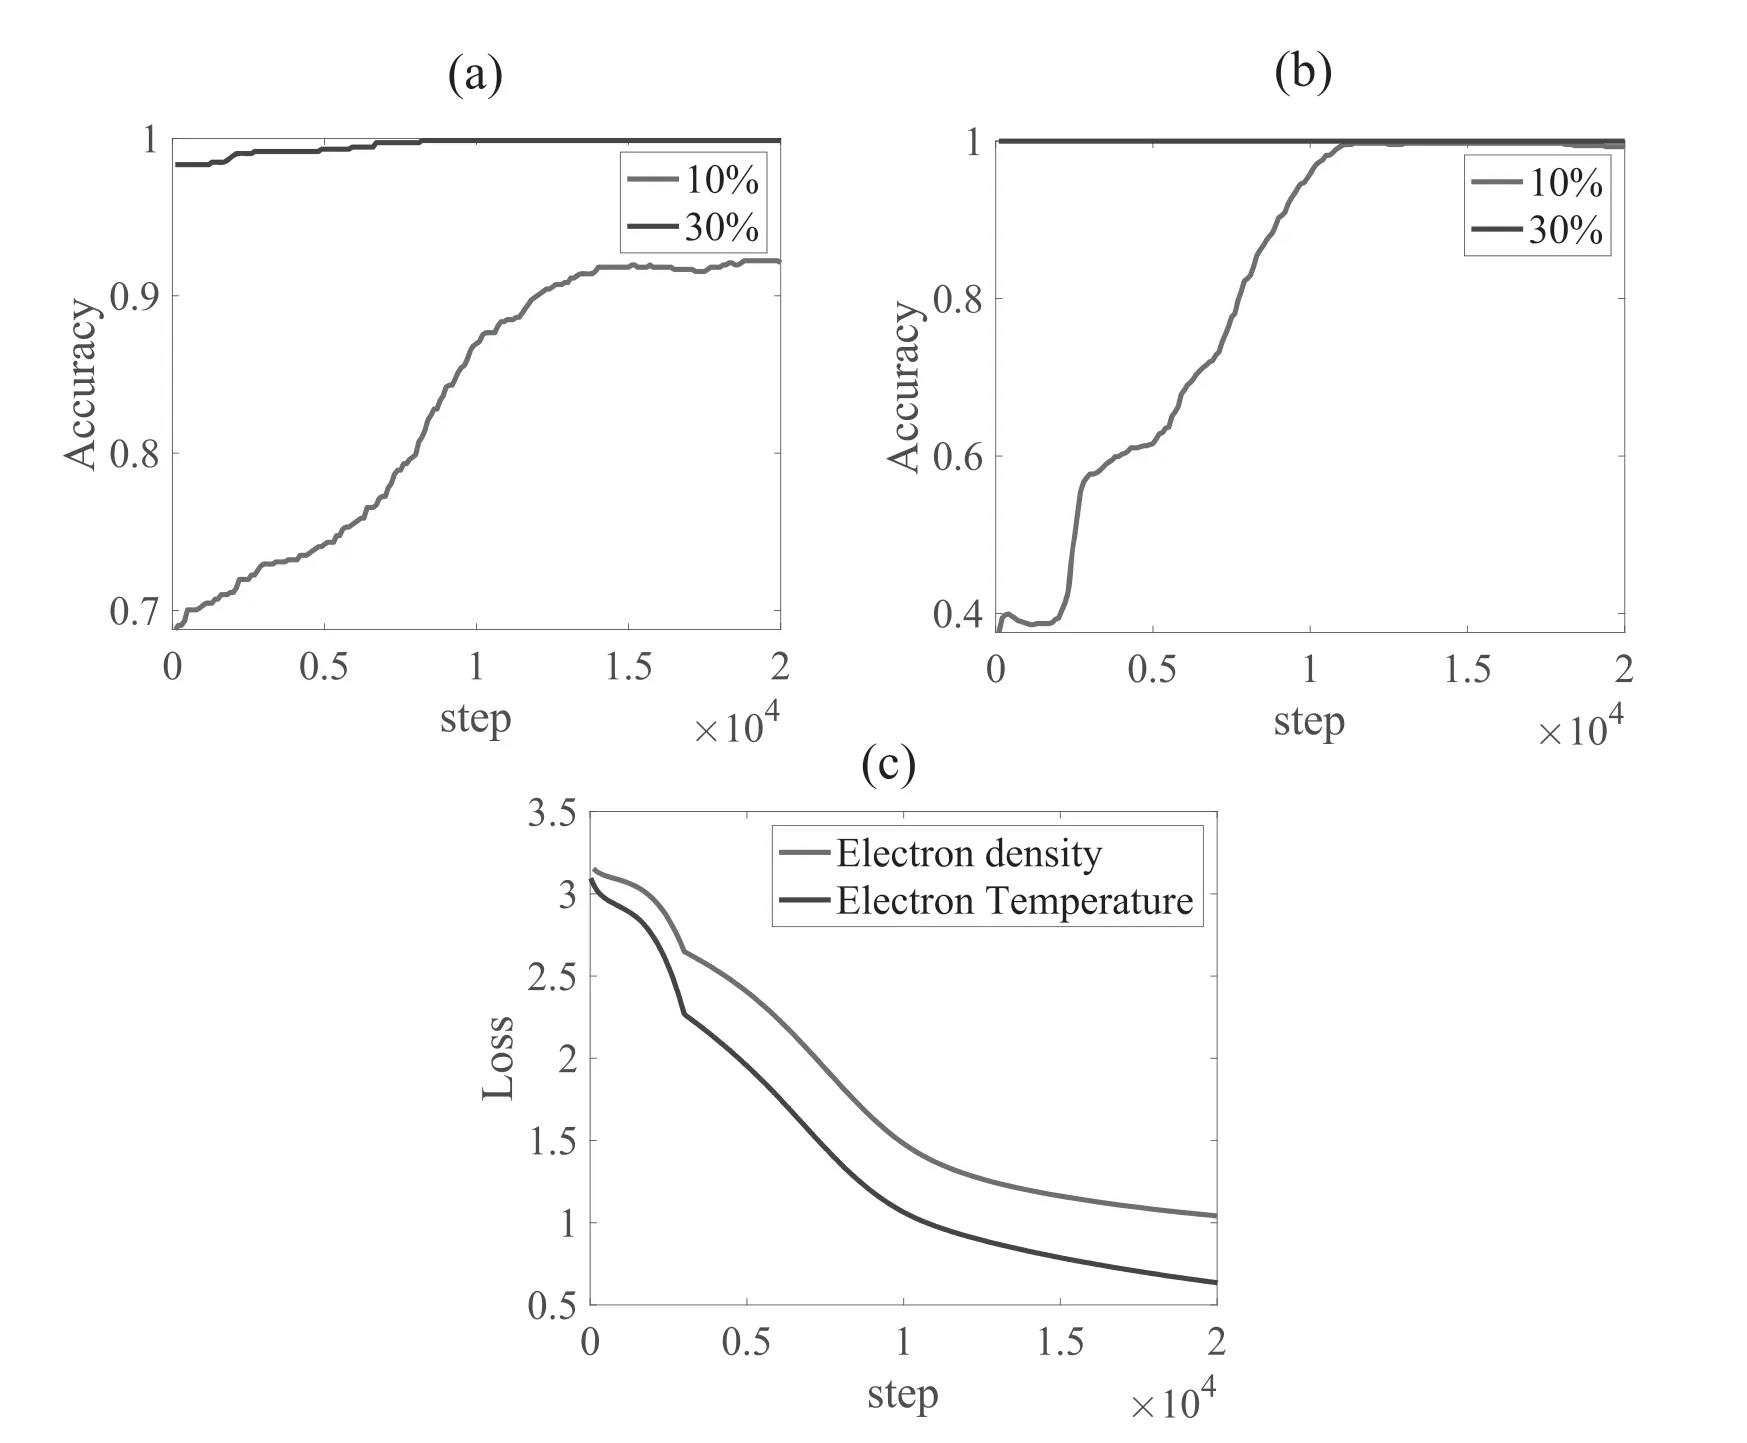
Figure 4.Various results as functions of the number of iterations.(a)Accuracy of electron density,(b)accuracy of electron temperature,(c)loss rates of electron density and electron temperature.
In the diagnosis of dust plasma,due to the adhesion of dust particles to the surface of the probe,Awill be reduced,but the originalAis still used in the calculation process,which causes the calculated electron density to be less than the true value.This is the reason why the accuracy rate of the electron density cannot reach 100%.As shown in figure 5,in the dust plasma,the electron saturation current measured by the probe decreases slightly,and the voltage that reaches the saturation current increases.The accuracy of parameters is corresponding to the situation of the probe surface influenced by dust.
For the electron temperature,according to the equation of the probe,the electron temperature can be calculated

whereIpis the probe current,VBis the probe potential,and ΦPis the plasma space potential.

Figure 5.I–V characteristic curve of the probe with free-dust and dust.
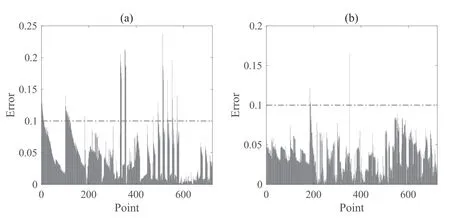
Figure 6.Error of each group of verification data: (a) electron density,(b) electron temperature.
There is noAterm in this equation,and it can be considered that the electron temperature diagnosis process is less affected by dust particles.Therefore,the machine learning algorithm can get good prediction results.One can see the expected results in figure 4(b).At the same time,for the same reason,the loss rate of electron temperature is also significantly lower than that of the electron density(figure 4(c)).
To get the error of the test set,we divide the data into two parts.The detailed error of the data of the test set is shown in figure 6.Due to the influence of dust on the probe,the error of the electron temperature is significantly less than that of the electron density.But as can be seen in figure 7,for large-scale prediction data,the distribution of the prediction results in figures 7(b) and (d) is well summarized and reflects the distribution of training data in figures 7(a)and(c).Especially for the electron temperature,the distribution of exploration data in the training set is relatively insignificant,and machine learning algorithms can also achieve good prediction results.In the experimental results,the law of electron density and temperature changing with pressure and discharge current is not clear.At the same time,due to the random nature of dust pollution,the law is difficult to formulate.But machine learning algorithms can reproduce this law well and make it more obvious.At the same time,figure 6(a) shows the obvious periodic distribution of the error distribution in the test set.
In order to study the periodic distribution of errors in detail,when the pressure is 120 Pa,discharge current is selected as the variable for studying the prediction data,and compared with the test set.Figure 8 shows that the difference between the predicted value and the measured value of the electron density gradually decreases when the discharge current increases.Combining with the experimental phenomenon shown in figure 8(c),it can be seen that when the discharge current increases,the dust density of the measuring part decreases.From equation (13) it can be concluded that when the dust density decreases,the surface area of the probe is less affected during the measurement,so the deviation between the measured value and the predicted value is also reduced.In the same way,the error of the electron temperature in figure 8(b) should remain stable(equation(14)),and the law of the prediction error changing with the discharge current is in good agreement with the experimental phenomenon and theory.One can compare the results of the modified plasma fluid model with the probe results after the machine learning correction.As shown in figure 9,compared with the predicted data and the simulated data,a better match is achieved.Evidently,machine learning has achieved a good prediction of electron density and electron temperature,and successfully demonstrated the influence of dust particles on the plasma diagnostic results.
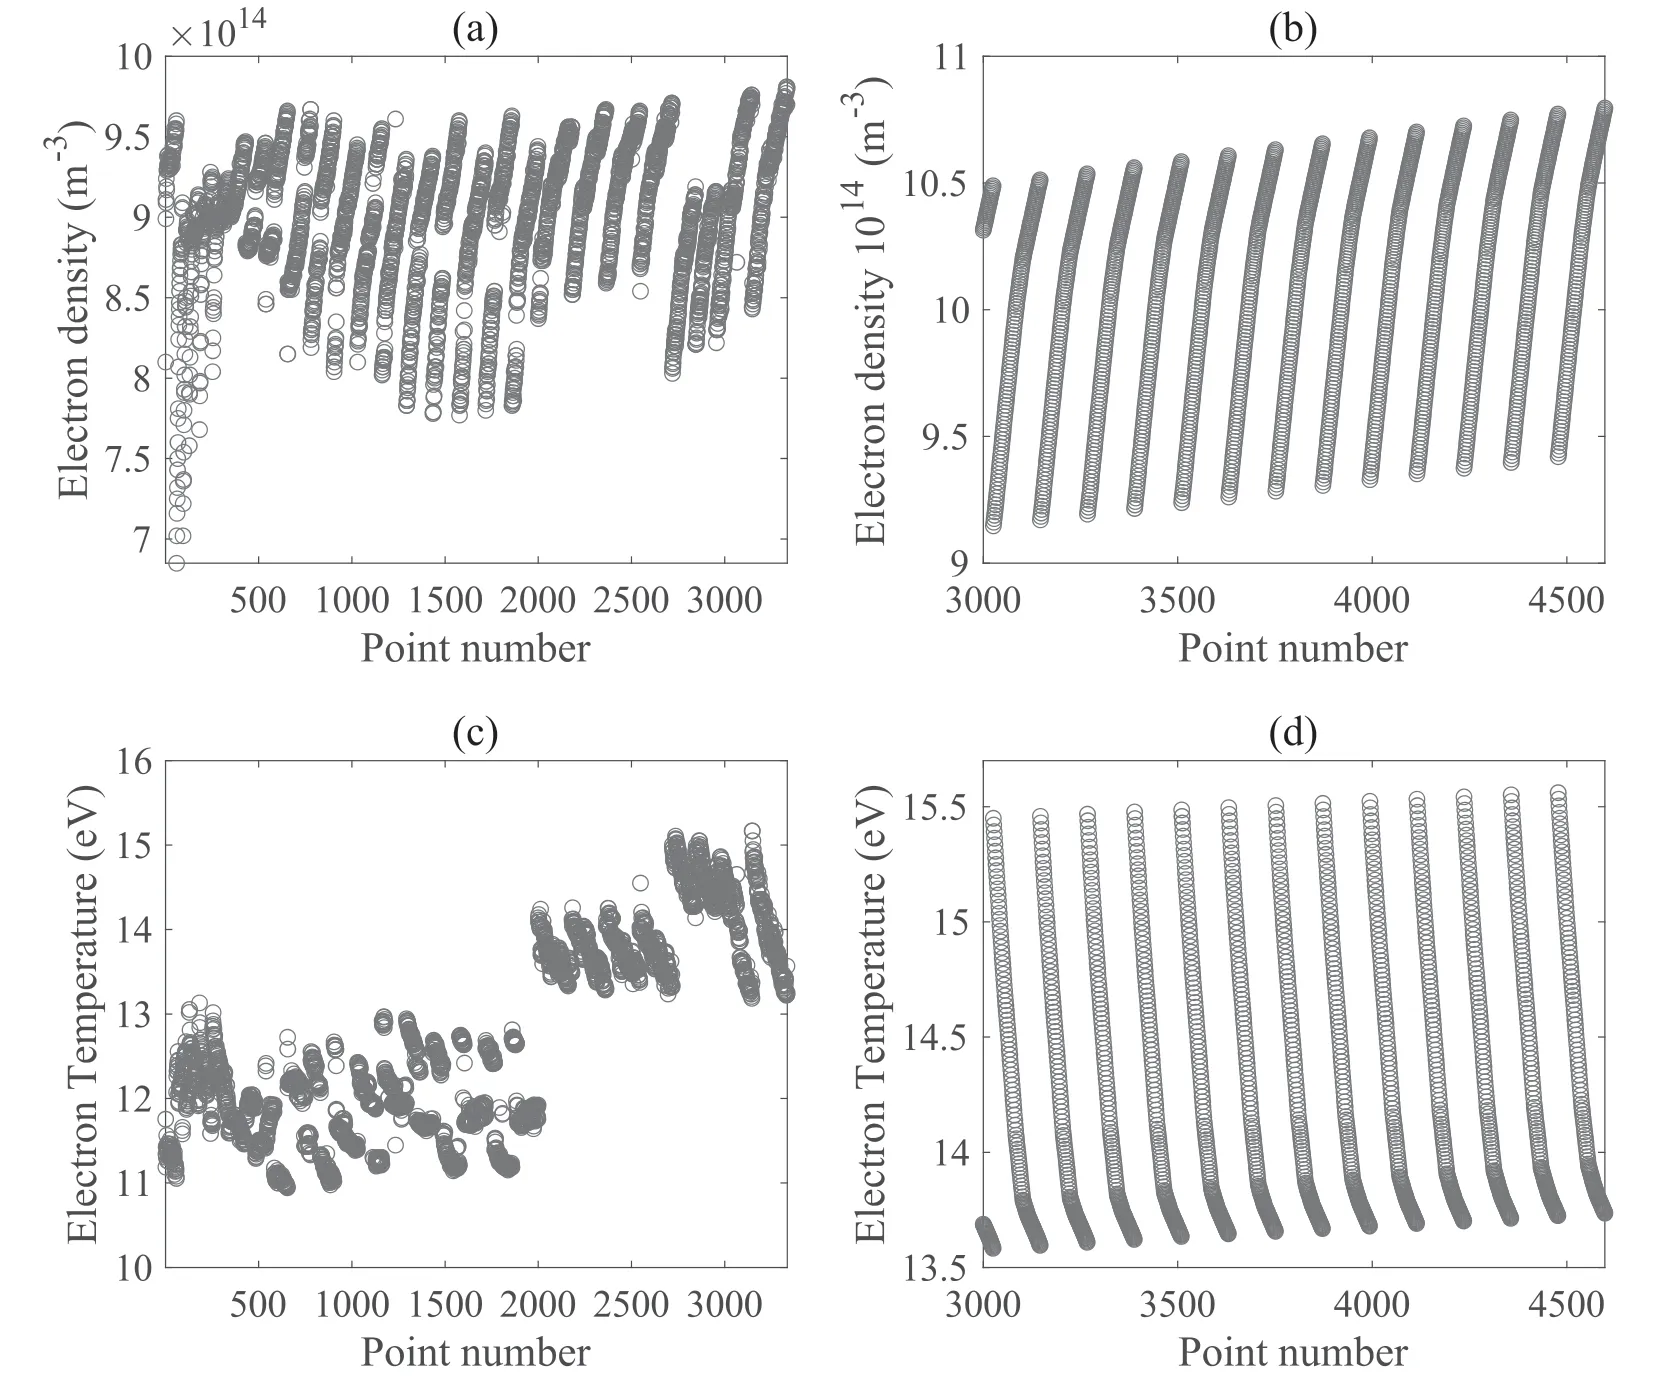
Figure 7.Comparison of predicted data and training data: (a) training data of electron density,(b) predicted data of electron density,(c) training data of electron temperature,(d) predicted data of electron temperature.
5.Conclusions
In the traditional probe diagnosis method,when diagnosing dust plasma,dust particles will be adsorbed on the surface of the probe during the diagnostic process,which causes the diagnostic result of the probe to deviate from the true value.The adsorption process of dust particles is random,so this effect cannot be corrected physically.For this reason,we extended the machine learning algorithm applied to the traditional probe theory to the probe diagnosis of dust plasma.
Our probe diagnosis used dusty plasma and processed the measurements using machine learning algorithms.The results show that for the electron density,under the 10% standard,a high accuracy rate cannot be achieved,while the electron temperature has a better accuracy rate.Through the analysis of the principle of probe diagnosis,we believe that such a result conforms to the rule governing the influence of dust particles on the probe.When comparing the predicted results and the measured results in detail,we found that the error showed a periodic distribution.In order to try to understand the reason,the change of the error was observed in detail,with the discharge current as the independent variable.By comparing with the dust density in the dusty plasma experiment,the law of change of the error and the law of change of the dust density were in good agreement.Finally,the results are compared with the results of the fluid mechanics model,and better results are obtained than for the data measured by the probe.We conclude that the machine learning algorithm shows great advantages in the diagnosis of dusty plasma.While revealing the dust’s influence on plasma,it can also correct this influence to a certain extent,achieving a good correction effect on the probe.

Figure 8.Differences in data:(a)electron density,(b)electron temperature.Image dust particle of different discharge currents:(c)5.9 mA,(d)8.8 mA.
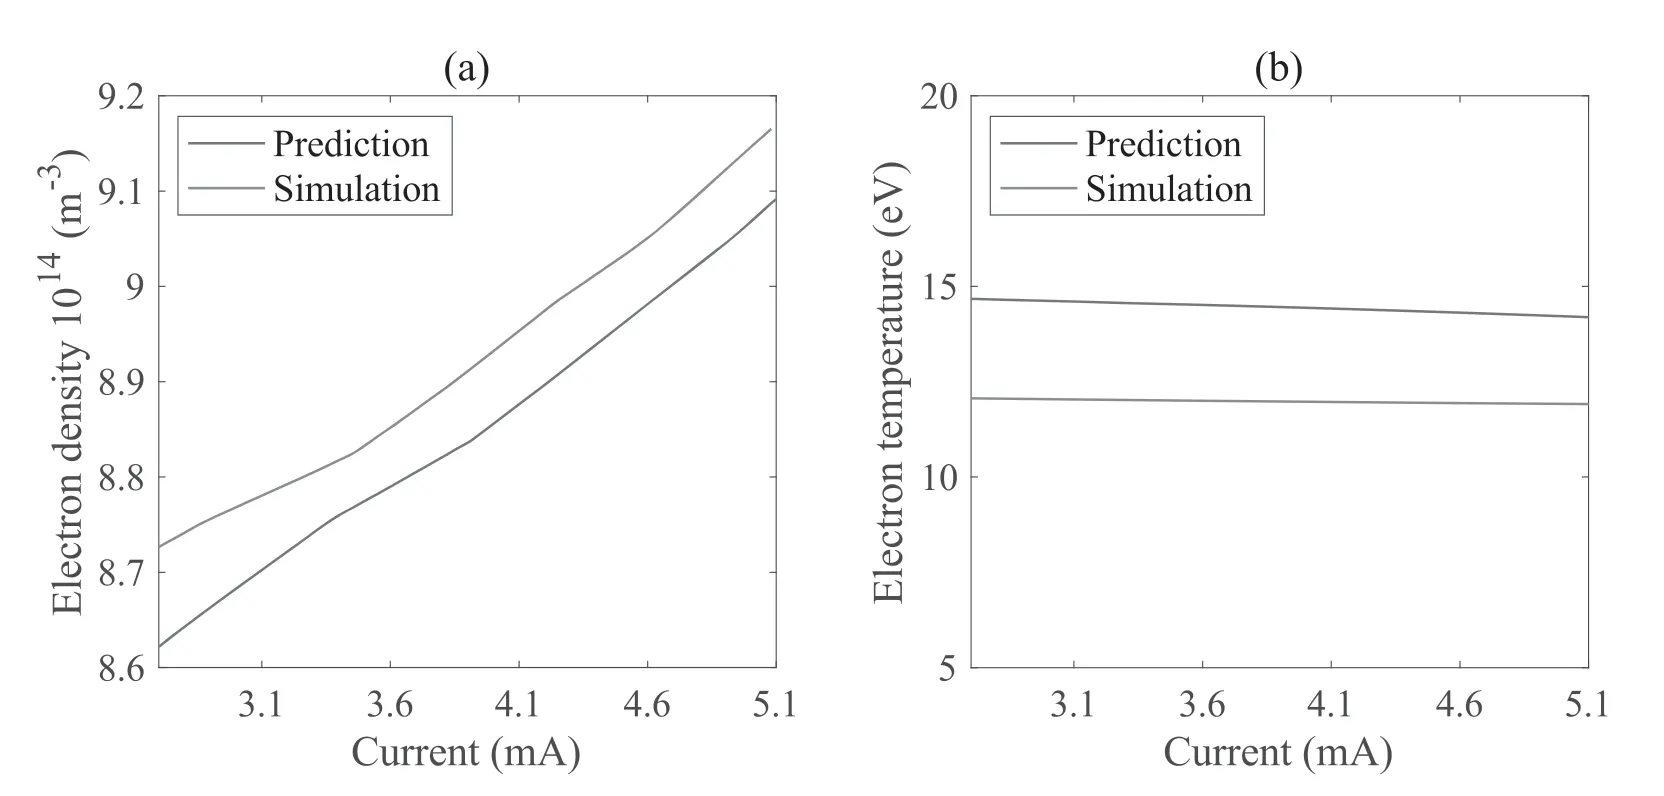
Figure 9.Comparisons of predictions and simulations.
Acknowledgments
The research has been financially supported by National Natural Science Foundation of China (Nos.11775062,11805130 and 11905125) and the Shanghai Sailing Program (Nos.19YF1420900 and 18YF1422200).
ORCID iDs
猜你喜欢
杂志排行

Plasma Science and Technology的其它文章
- Conceptual design and heat transfer performance of a flat-tile water-cooled divertor target
- Study of selective hydrogenation of biodiesel in a DBD plasma reactor
- Temporal and spatial study of differently charged ions emitted by ns-laser-produced tungsten plasmas using time-of-flight mass spectroscopy
- Analysis of the microstructure and elemental occurrence state of residual ash-PM following DPF regeneration by injecting oxygen into non-thermal plasma
- The low temperature growth of stable p-type ZnO films in HiPIMS
- Improving the surface insulation of epoxy resin by plasma etching