Competitiveness and Complementarity of Cocoon Silk Trade between China and Southeast Asia
2021-08-24QinghongRANYunhuaYUE
Qinghong RAN, Yunhua YUE
Western Humanities Research Institute, Chengdu Normal University, Chengdu 611130, China
Abstract In the context of the Belt and Road Initiative, it is of great significance to study the trade ties between China and Southeast Asia with cocoon silk as a link.Trend analysis, trade competitiveness index and trade complementarity index were comprehensively used in this paper to study the competitiveness and complementarity of the cocoon silk trade between China and Southeast Asia.The results show that the export trade volume of cocoon silk of China and Southeast Asia is decreasing while fluctuating, but it is difficult for other regions to replace their export trade status in the world market.The development trend of the replacement of the silkworm cocoon trade by the raw silk trade is presented.The cocoon silk trade of China and Southeast Asia is characterized by dislocation competition.China’s raw silk export trade is competitive and has become the leader of the raw silk export camp.This paper further analyzes the changes and complementarities of the cocoon silk trade competitiveness between China and Southeast Asia.
Key words Cocoon silk export, Trade competitiveness, Trade complementarity Index, China, Southeast Asia
1 Introduction
Southeast Asia is the region where the Indochina Peninsula and the Malay Peninsula and the Malay Archipelago in its southern section are located, including Vietnam, Laos, Cambodia, Thailand, Myanmar, Malaysia, Indonesia, Singapore, Philippines, Brunei and East Timor.China and Southeast Asian countries belong to the east and southeast of Asia.They are important densely populated areas and consumption areas, the world’s main agricultural and mineral product production areas and export areas.On the Maritime Silk Road, the geographical proximity between China and Southeast Asian countries has become an important reason for the occurrence of silk trade.As early as the Emperor Wu of the Han Dynasty in the 2century BC, Chinese silk sea-going ships departed from Xuwen and Hepu to Vietnam, Malaysia, Thailand, Myanmar and other places; in the Tang Dynasty, the Sri Vijaya in Sumatra became the main distribution center for the spread of Chinese silk and an important transit point for Chinese silk exports to South Asia, West Asia, and East Africa; and in the Song Dynasty, the overseas trade of silk reached an unprecedented height, and via the South China Sea silk route in Guangzhou, China’s silk reached Vietnam, Cambodia, Sumatra, Malaysia’s Pahang Tambelin and Java, Philippines and other places.In contemporary times, cocoon silk is a traditional export commodity in China.China needs to vigorously develop cocoon silk.Southeast Asian countries are the main importers of China’s cocoon silk exports.Silk has always been one of the important trade commodities linking China, the world’s largest producer, consumer and exporter of cocoon silk, and Southeast Asia.Gu Guodaet
al.
studied the world’s silk production and trade.Based on the economic analysis of China’s silk export trade, it is proposed that China’s silk export still has a great competitive advantage compared with other export commodities.The relationship between China and Southeast Asian countries in export trade has always been a hot spot in academic circle.The main results are focused on examining the economic and trade relations between China and Southeast Asian countries, analyzing the international trade relations between China and Southeast Asian countries, and exploring the diversified cooperation mechanisms of the Maritime Silk Road.Yang Xiaolibelieved that under the background of the Belt and Road Initiative, the structure of import and export and the structure of trade commodities of China and the countries along the Maritime Silk Road Economic Belt have been continuously optimized.More importantly, six of the top 10 countries along the Belt and Road with the largest total trade volume with China belong to Southeast Asia, including Vietnam, Malaysia, Thailand, Singapore, Indonesia and the Philippines.Zong Huiminget
al.
, Yu Zhenyueet
al.
analyzed the pattern and development trend of trade of China and Southeast Asian countries.Ran Qinghonget
al.
analyzed the status quo and cooperation prospects of China’s silk trade with Southeast Asia.Ren Yizhuoet
al.
analyzed the impact of interconnection under the Belt and Road Initiative on China’s silk export trade.Cocoon silk is the main industrial raw material for silk production, but there are few literatures on the trade of cocoon silk.The historical changes, competitiveness and complementarity of the export trade of silkworm cocoons and raw silk between China and Southeast Asia were rarely reported.Taking 10 countries in Southeast Asia as a whole, based on the export data of cocoons and raw silk from Southeast Asian countries and China in the FAO Trade Statistics Database(http://faostat.fao.org/), a comparative study was conducted with China’s cocoon silk export trade; based on the changes in the amount and gross value of cocoon silk exports from 1961 to 2018, the status and changes of cocoon silk export trade in the international market, and the competitiveness and complementarity of cocoon silk trade between China and ASEAN were discussed.This is of great significance to promoting China-ASEAN geo-economy and cocoon silk trade cooperation.2 Characteristics of cocoon silk export trade of China and ASEAN
2.1 China and ASEAN has gradually become the world’s largest zone for cocoon silk export trade
According to relevant statistics of FAO, in the world’s cocoon silk trade from 1961 to 2018, the export trade of China and Southeast Asia has undergone a process from "dramatic rise in fluctuations" to "long-term stable leading position in world exports"(Fig.1), and it has become the largest export trade area of cocoon silk in the world.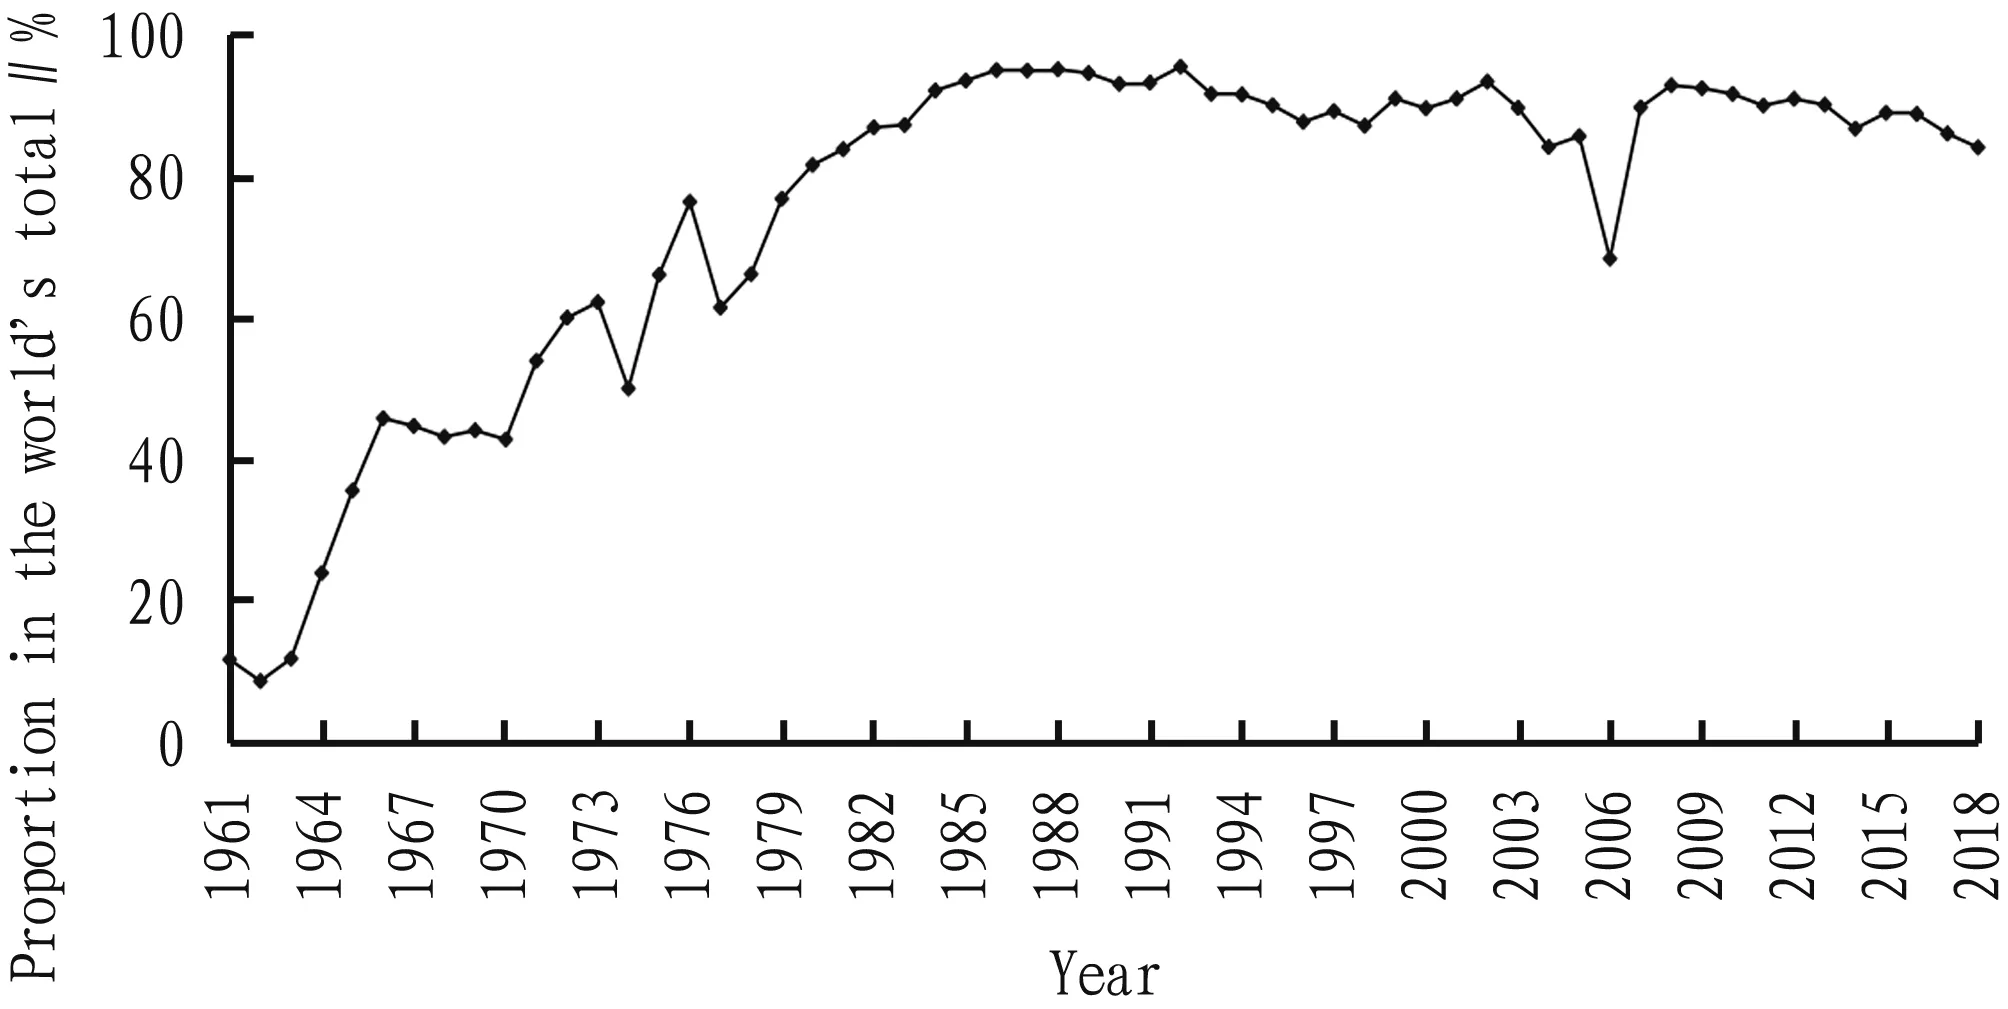
Source: Compiled based on relevant data from FAOSTAT, the same below.
In the 1960s and 1970s, the status of China and Southeast Asia’s cocoon silk export trade rose sharply in the world while fluctuating.From 1961 to 1963, the silk export trade value of China and Southeast Asia accounted for 8.11%-10.94% of the world’s total, and the three-year average was 9.98%.In 1964, the value was doubled, up to 21.94%.From 1965 to 1970, the value was on a higher level, ranging from 31.67% to 39.96%, with an annual average of 38.11%.A great leap was achieved in the early 1970s, with a net increase of 18.49 percentage points in 1971 compared to 1970, surpassing the threshold of 40%-50%.The proportion in the world’s total rose from 39.96% in 1970 to 58.22%.Compared with 1971, 1972 leaped another step, reaching 65.66%.It reached 76.30% in 1979, an increase of more than 10% in 7 years.After entering the 1980s, except a few years, the export trade volume of cocoon silk from China and Southeast Asia had a stable position in the world, with little volatility.If 2006 was excluded, the fluctuation between 1980 and 2018 was between 79.14% and 91.52%, and the amplitude was only 12.38, that is, the 30-year fluctuation amplitude was only equivalent to that in the 7-year period from 1972 to 1979.There were only 4 years exceeding 90%, there were only 3 years less than 80%, and the number of years between 80% and 90% was as many as 34.It could be said boldly, the export trade of cocoon silk of China and Southeast Asia would be further stabilized in the world and maintain dominance.The export of cocoon silk in the world depended on China and Southeast Asia, which would become the norm in the future.
2.2 China’s export trade volume is dominant
Since the mid to late 1960s, China’s cocoon silk export trade volume has dominated while fluctuating(Fig.2).(i)During the 34-year period from 1961 to 1994, it had undergone 6 declines and 6 rises.Each decline breeds a higher level of rise.Rising, accompanied by fluctuation, was the main theme of China’s cocoon silk export trade.The total export trade volume increased from 1 455 t in 1961 to 18 936 t in 1994.That is, the export volume of cocoon silk in 1994 was more than 13 times that of 1961.(ii)In the 24 years from 1994 to 2018, it experienced a process of declining in volatility, and the magnitude of each increase was lower than the magnitude of the previous decrease.Decline in fluctuation is the main theme of China’s cocoon silk export trade.In 2018, the export volume dropped to 4 588 t, only 24.2% of the export volume in 1994.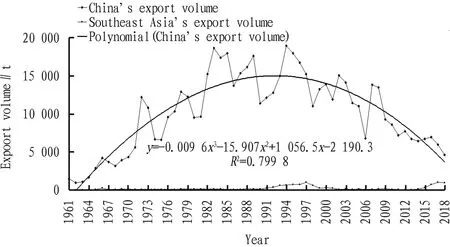
Fig.2 Correlation curve of export volume of cocoon silk from China and Southeast Asia from 1961 to 2018
2.3 The gap in export trade volume between China and Southeast Asia was narrowing
A regression analysis of China’s export trade volume data from 1961 to 2018 showed that the polynomial trend line was in the process of smooth descent, indicating that the export trade volume of cocoon silk might further decrease while fluctuate.The growth trend before the mid-1990s is difficult to reproduce.From 1961 to 2018, the export trade volume of Southeast Asia fluctuated greatly between 13 and 1 002 t.However, there was an overall upward trend from 2013 to 2018, and it was 916 t in 2018.Although the export trade volume of China and Southeast Asia had undergone multiple minor cycles between 1961 and 2018, China’s export trade volume had declined as a whole since 1994, and the export trade volume of Southeast Asia had been on the rise since 2003.As a result, the gap in export trade volume had narrowed very significantly.2.4 China’s export trade value dominates
When China and Southeast Asia were analyzed separately, it was found that the export value of China of the years with the least export accounted for 58.09% of the world’s total export value, and that of the years with the largest export accounted for 91.22% of the world’s total, while the proportion of Southeast Asia was only between 0.09% and 5.26%.Obviously, China’s absolute dominance is beyond doubt(Fig.3).The conclusion is confirmed by the research of Xiong Chaoet
al
.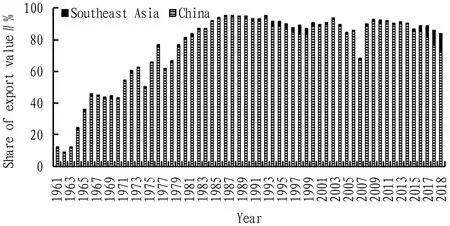
Fig.3 Dynamics of share of China-Southeast Asia’s foreign exchange earnings from cocoon silk exports in the world’s total during 1961-2018
2.5 Structural characteristics of cocoon silk export trade
2.5.1
Being dominated by silk was the overall characteristic of export trade of China and Southeast Asia.Silkworm cocoons were primary agricultural products, and raw silk was the labor product of silkworm cocoons after primary processing.In the "cocoon-silk-cloth" industrial chain, cocoons were in the upstream, silk was in the midstream, and cloth was in the downstream.Compared with cocoons, raw silk was technologically advanced and has higher added value.Whether it was from the perspective of amount(Fig.4)or value(Fig.5), from 1971 to 2018, the proportion of silkworm cocoon trade of China and Southeast Asia in the world’s total decreased in fluctuation, and the proportion of raw silk trade increased in fluctuation.From the perspective of trade value, the proportion of raw silk in the commodity structure had exceeded 90%, and from the perspective of trade volume, the proportion of raw silk in the commodity structure had entered the ranks of 80%.It was this difference that reflects the higher added value and faster changes in the value structure of raw silk relative to the silkworm cocoon trade.This difference would inevitably lead to the shrinkage of silkworm cocoon trade and the substitution of raw silk trade for silkworm cocoon trade.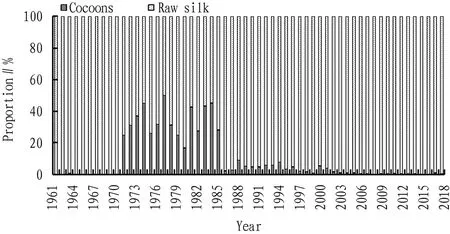
Fig.4 Dynamics of the export volume structure of cocoons and silk of China-Southeast Asia from 1961 to 2018
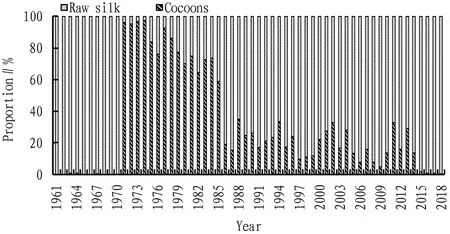
Fig.5 Dynamics in the export value structure of cocoons and silk of China-Southeast Asia from 1961 to 2018
2.5.2
The structure of cocoon silk export trade of China and Southeast Asia is different.China was dominated by raw silk trade, supplemented by silkworm cocoon trade.In the volume structure of cocoon silk trade after 1989, the proportion of silkworm cocoons in the export trade of cocoon silk was less than 40% and was declining in fluctuation.It fell to less than 20% in 2011, and the least was close to 10%(Fig.6).In the value structure of the cocoon silk trade after 1989, China’s silkworm cocoon trade accounted for less than 20% and declined in fluctuation.By 2011, it fell to less than 10%(Fig.7).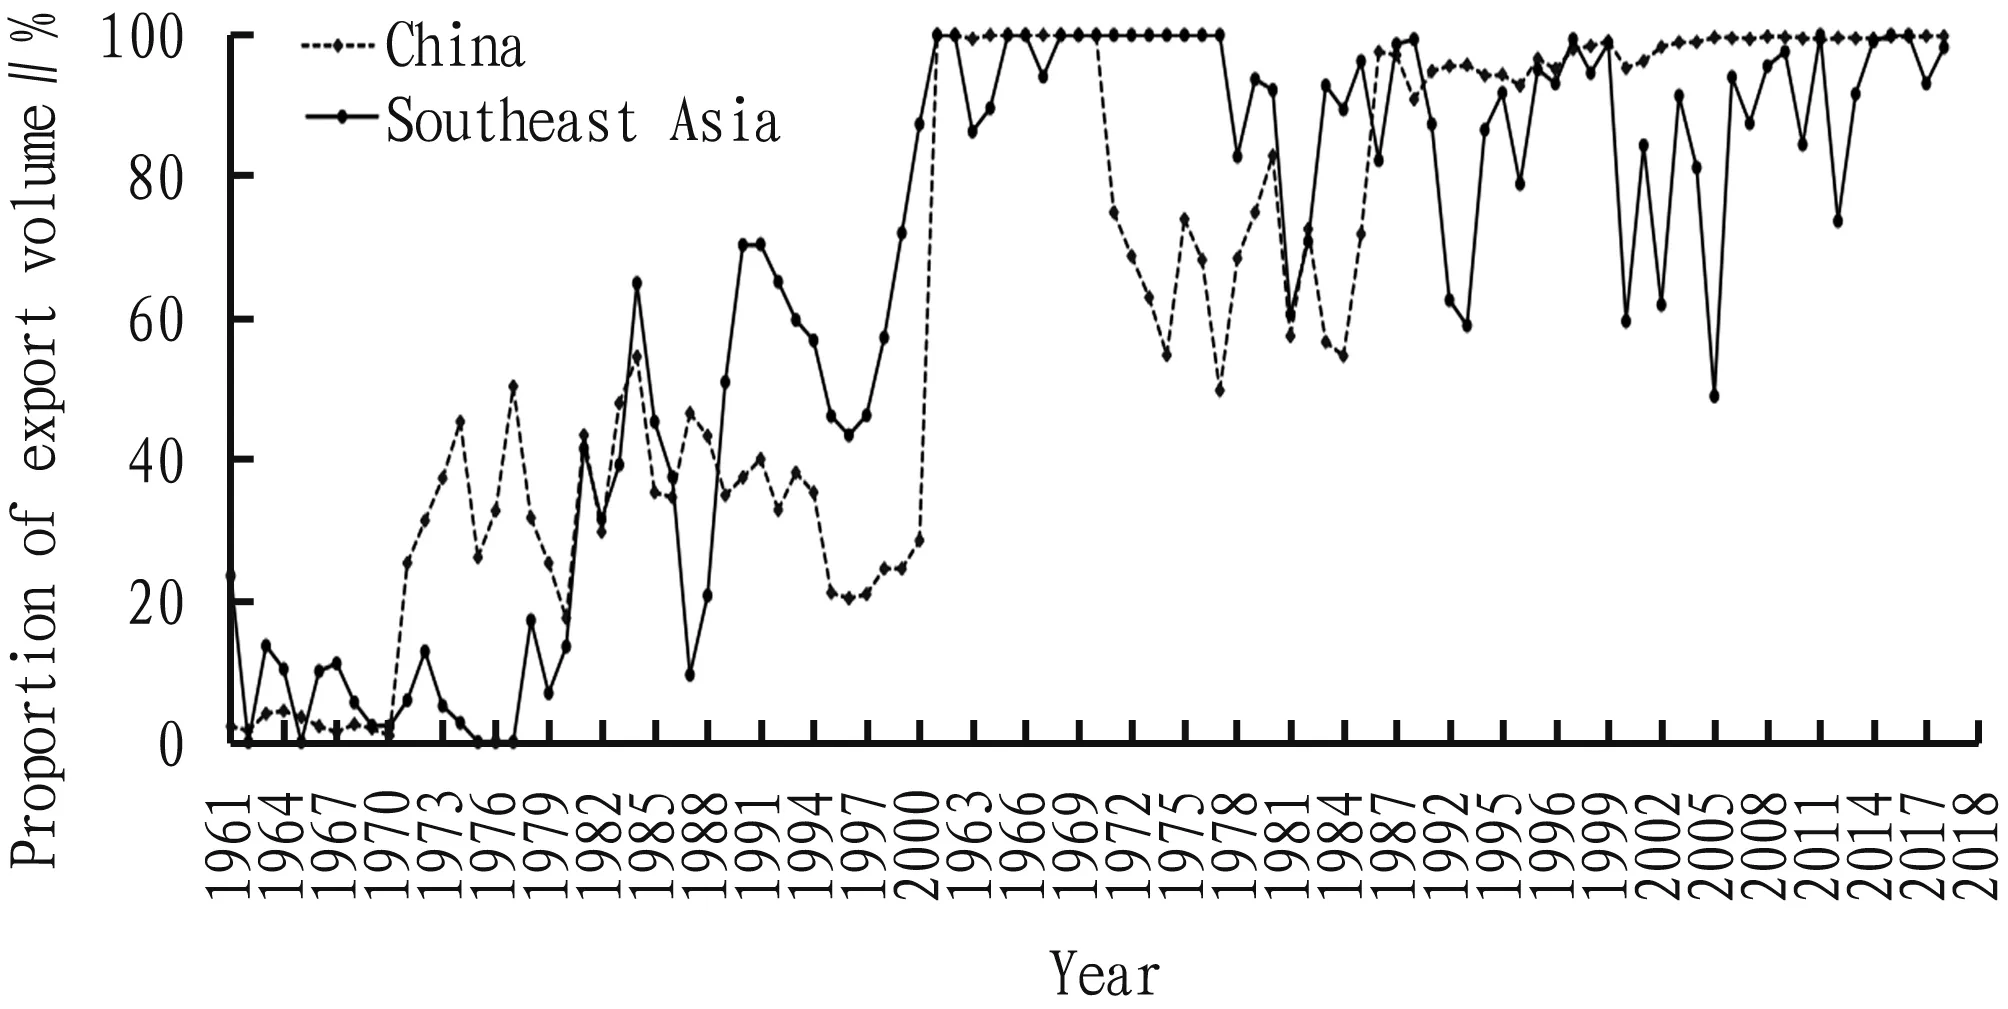
Fig.6 Comparison of proportion of silkworm cocoon export volume in cocoon and silk export trade between China and Southeast Asia from 1961 to 2018

Fig.7 Comparison of proportion of silkworm cocoons export value in cocoon and silk export trade between China and Southeast Asia from 1961 to 2018
Southeast Asia was dominated by silkworm cocoon trade, supplemented by raw silk trade.The proportion of silkworm cocoons exceeded 90% from 2002 to 2007, and over 70% in 1999-2008 and 2010.As a whole, it fluctuated at a high level of more than 40%.In terms of volume structure or value structure of the cocoon silk trade, since the 1990s, Southeast Asia was dominated by silkworm cocoon trade and supplemented by raw silk trade.According to Japanese scholar Akamatsu’s Flying Geese Pattern theory, the regional differences in the structures formed the raw silk trade "geese formation" led by China and the silkworm cocoon trade "geese formation" led by Southeast Asia.These two "geese formations", to a certain extent, reflect the development level of the cocoon and silk industry chain and the difference in the vertical level of the industrial structure.
3 Competitiveness and changes of cocoon silk trade
3.1 Research method
There is a certain research foundation for using models to quantitatively calculate the contribution of competitiveness to trade growth.Porter established the theory of industrial competitiveness inThe
Competitive
Advantage
of
Nations
.To specifically evaluate the competitiveness of products, the popular approach is to use the international trade competitiveness index.International trade competitiveness index=(Export value-Import value)/(Export value+Import value).
It represented the ratio of the balance of a country’s import and export trade to the total import and export trade.As a relative value to the total trade volume, the index excluded the impact of fluctuations in macroeconomic factors such as economic inflation and inflation.That is, regardless of the absolute amount of imports and exports, the index is between-1 and 1.The closer its value was to 0, the closer the competitiveness was to the average level.When the index is-1, it means that the industry only imports but not exports.The closer it is to-1, the weaker the competitiveness.When the index is 1, it means that the industry only exports but not imports.The closer it is to 1, the stronger the competitiveness.The international trade competitiveness index was used to evaluate the competitiveness of silk trade of China and Southeast Asian countries.
3.2 Competitiveness of cocoon silk trade and its changing characteristics
3.2.1
The competitiveness of silkworm cocoon trade fluctuates greatly, but the difference between China and Southeast Asia is obvious.China’s silkworm cocoon trade competitiveness index from 1978 to 2018 changed between-0.557 and 0.928(Fig.8), and its characteristics were as follows: first fell and then rose.It decreased from 0.928 in 1978 to 0.098 in 2011, and had since increased year by year.In 2018, it exceeded 0.9.The phased changes in competitiveness were very obvious.From 1978 to 1994, the competitiveness index had been distributed above the axis of abscissa.Although showing a decreasing change, it was all greater than 0 and fluctuated around 0.5 in most years, belonging to a period of certain competitiveness.During the period from 1995 to 2010, the complexity of changes increased, and the fluctuation around 0 increased, indicating that there was basically no export competitiveness.During the period from 2011 to 2018, the competitiveness index was between 0.874-0.997, with an average of 0.955.The cocoon trade competitiveness index of Southeast Asia varied from-0.835 to 0.855(Fig.8).The fluctuation was large, and there were few years with value greater than 0, suggesting that most years were not competitive.In summary, lack of competitiveness was a common feature of silkworm cocoon trade of China and Southeast Asia.This was also one of the important reasons why the export trade volume of silkworm cocoons had decreased, and raw silk was the dominance in the export trade of cocoon silk.
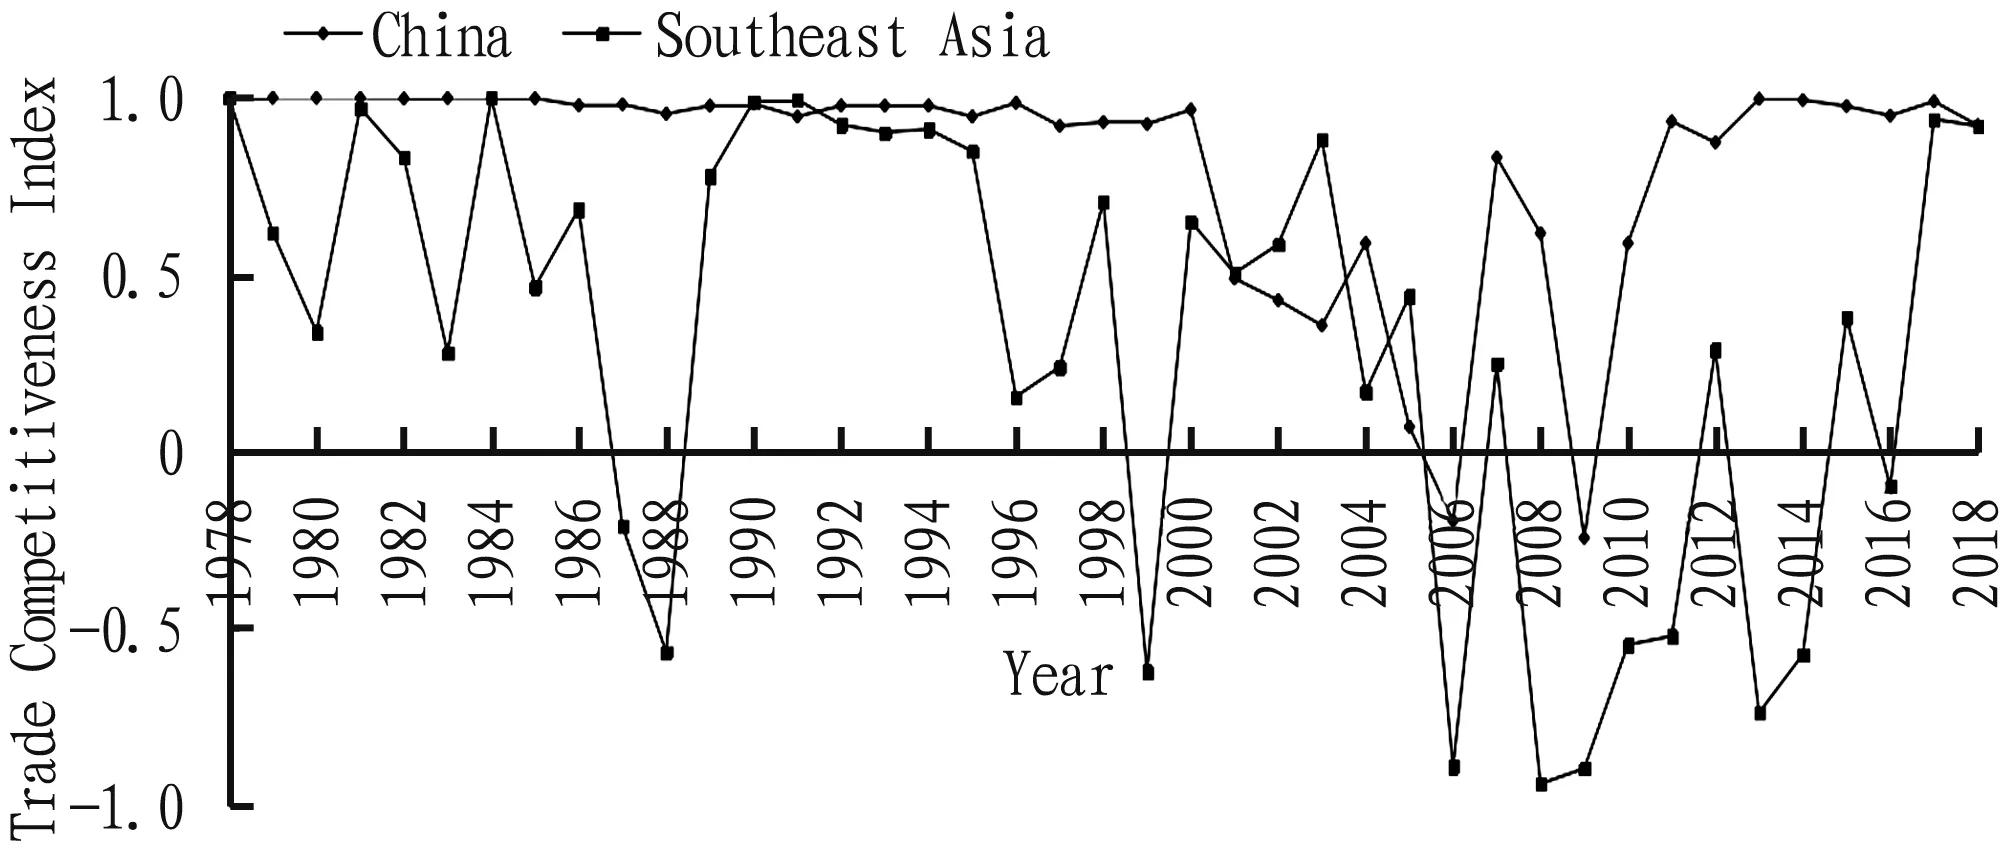
Fig.8 Dynamics in the cocoon trade competitiveness index of China and Southeast Asia from 1978 to 2018
3.2.2
The competitiveness of raw silk export trade is strong in China and weak in Southeast Asia.China’s raw silk trade competitiveness index from 1961 to 2018 ranged from 0.531 to 0.996 7(Fig.9), with strong export trade competitiveness and a continuous and stable export advantage.Especially since 2000, the export trade of raw silk had maintained a good momentum, and the competitiveness index had stabilized at a high level above 0.9.The raw silk trade competitiveness index of Southeast Asia was between-0.908 and 0.7(Fig.9), which fluctuated greatly.The years with competitiveness index greater than zero were concentrated in the 1970s.Since then, export trade had been sluggish.Especially since 1993, the export trade not only was sluggish, but also declined in fluctuation.The difference in the competitiveness of raw silk export trade between China and Southeast Asia affected the export capacity.It is this difference that makes China’s position in total exports more and more stable, and the effect of "a major exporter of raw silk" is becoming more and more obvious.
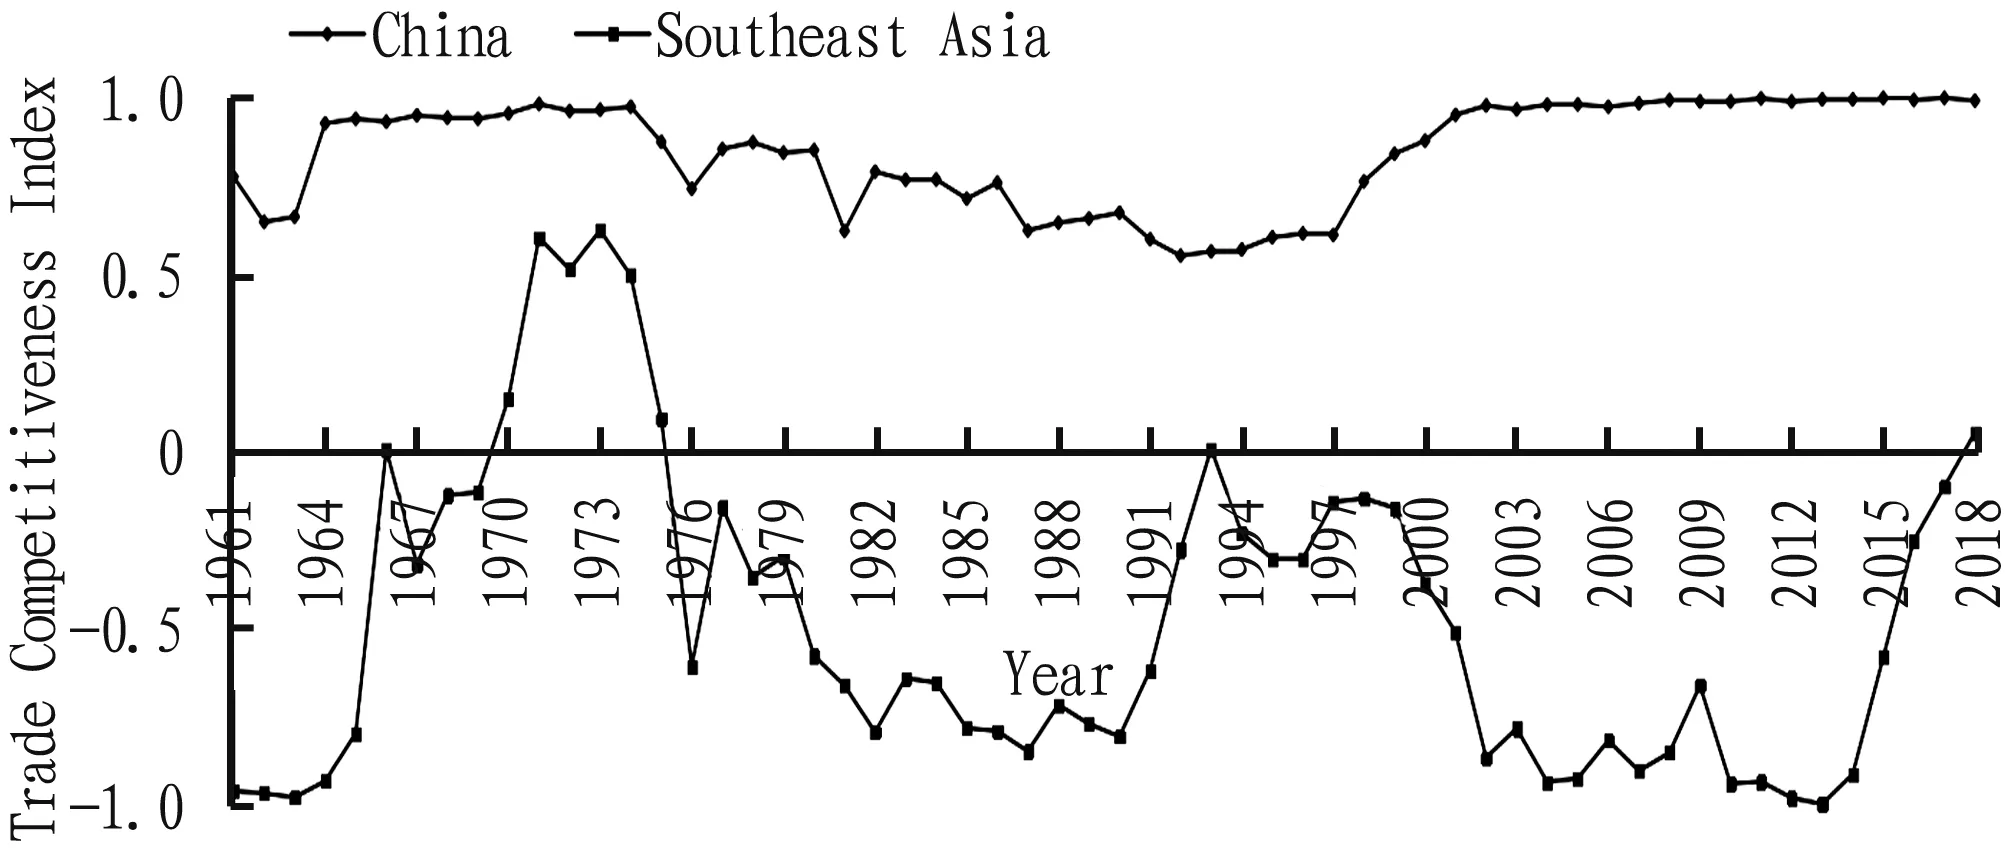
Fig.9 Dynamics in the raw silk trade competitiveness index of China and Southeast Asia from 1978 to 2018
4 Complementarity of cocoon silk trade between China and Southeast Asia
4.1 Research method
Peter Drysdaleproposed a trade complementarity index that measures the strength of trade complementarity between two countries.Domestic research on trade complementarity is relatively late.In the study on North-South trade and trade between developed countries in the 1980s, Lian Pingused the concept of trade complementarity.Yu Jinpingearlier used the trade complementarity index to study the trade complementarity between China and major East Asian countries and regions.The trade complementarity index is equal to the product of countrya
’s explicit comparative advantage index measured by export of commodityk
and countryb
’s comparative disadvantage index measured by import of commodityk
.If the countrya
has a large comparative advantage in productk
, and the countryb
has a large comparative disadvantage in productk
, the trade complementarity index of the single productk
between the two countries a andb
is large.It means that in terms of trade of productk
, the countrya
’s exports and the countryb
’s imports are complementary.4.2 Complementary characteristics of cocoon silk trade between China and Southeast Asia
Based on relevant FAO data, the complementary coefficient of silk trade between China and Southeast Asia from 1961 to 2018 was studied, and the results are shown in Fig.10.The dynamics of comparative advantage of China’s silk exports, comparative disadvantage of Southeast Asia’s silk production, and complementarity index between China and Southeast Asia are shown in Fig.10 a.The dynamics of comparative advantage of Southeast Asia’s silk exports, comparative disadvantages of China’s silk production, and complementarity index between Southeast Asia and China are shown in Fig.10 b.The results show that China is highly complementary with Southeast Asia in silk trade.Between 1978 and 2018, China-Southeast Asia silk trade complementarity index was between 8.612 3 and 49.068 8, all greater than 1.It shows that China’s silk export trade was highly complementary with Southeast Asia’s silk import trade, and the trade relationship between the two was excellent.The Southeast Asia-China silk trade complementarity index was between 0.000 2 and 2.126 3.Except for 1992-1998 when the trade complementarity index was greater than 1 and the trade relationship was relatively good, in the remaining years, the trade complementarity coefficient was less than 1, indicating the complementarity of Southeast Asian silk export was not good with China’s import.Weak complementarity has become an important factor affecting the intensity of silk trade between China and Southeast Asia.Fig.10 further shows the changes in the trade complementarity index from 1961 to 2018.It is found that on the one hand, the comparative advantage index of silk exports of China was between 14.558 1-35.499 0, and that of Southeast Asia was between 0.005 8-1.367 3, indicating that China had a strong comparative advantage in silk exports to Southeast Asia; and on the other hand, the comparative disadvantage index of silk of Southeast Asia was between 0.298 1-2.181 2, and that of China was between 0.011 3-4.3033.Therefore, China’s comparative advantage in silk exports to Southeast Asia and Southeast Asia’s strong silk import demand from China have become the main reasons for the strong complementarity of silk trade.
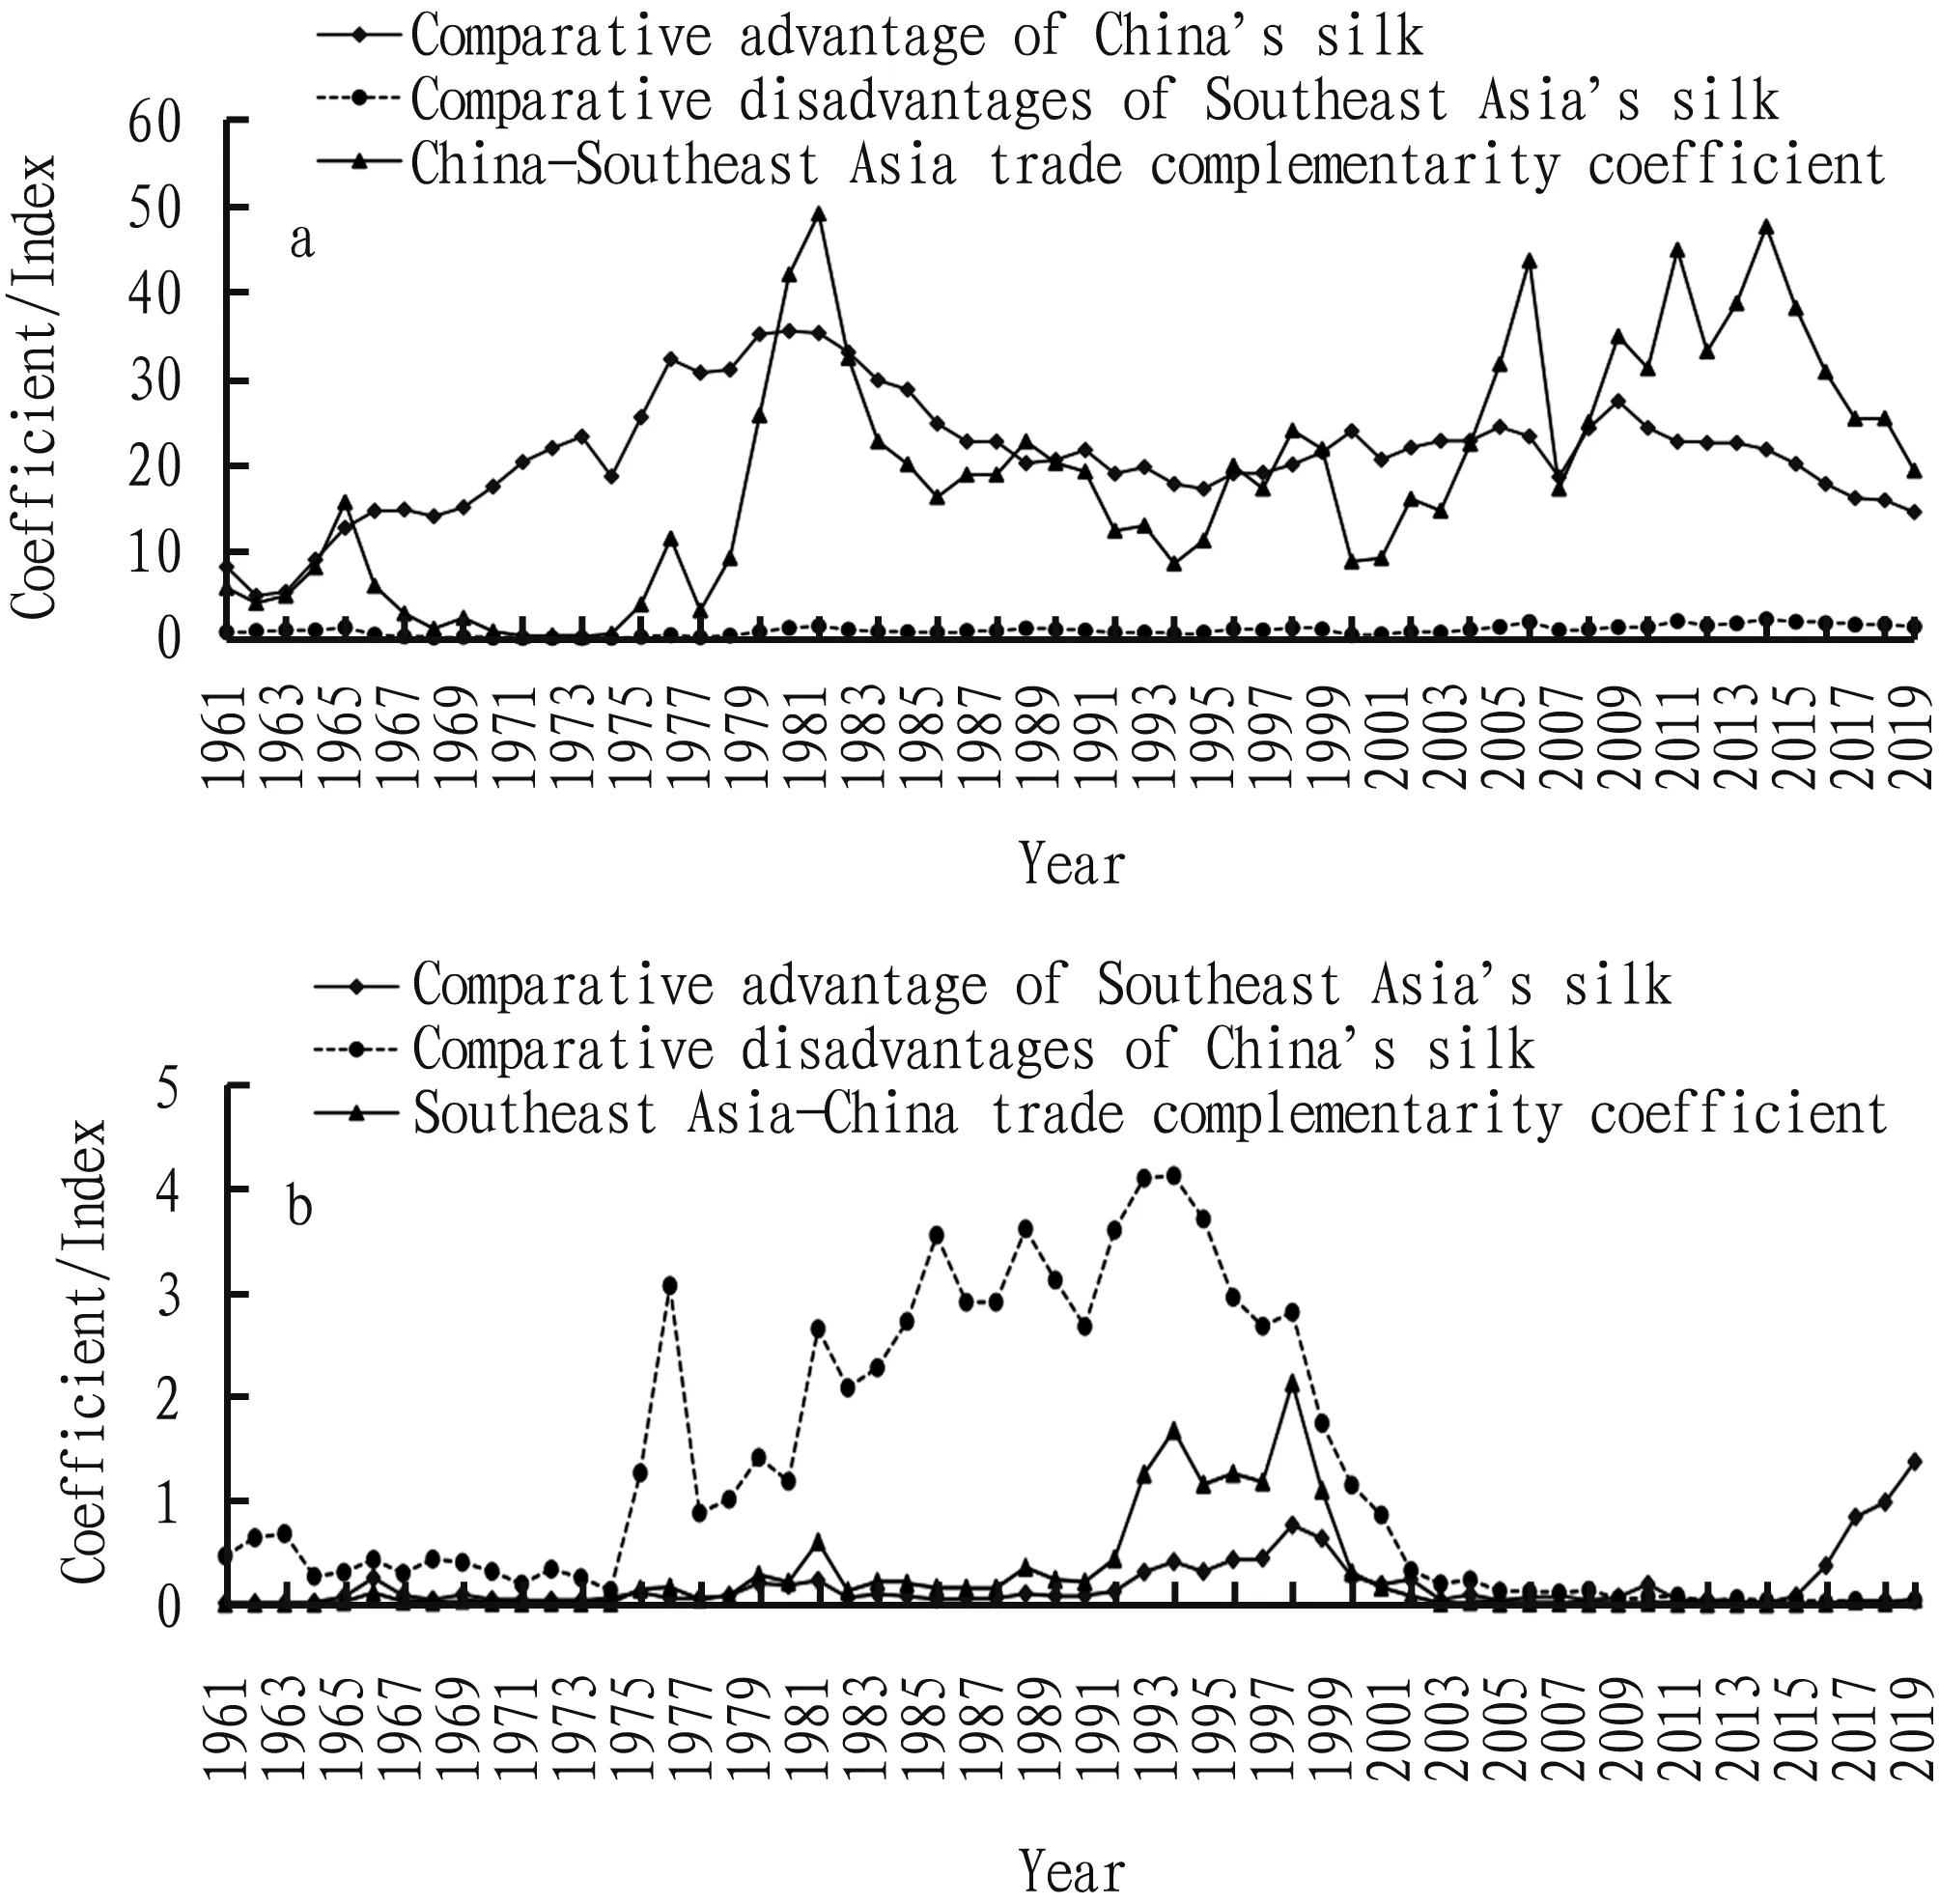
Fig.10 Complementary coefficient of silk trade between China and Southeast Asia from 1961 to 2018
5 Conclusions
From 1961 to 2018, China and ASEAN were the world’s largest export trade zones for cocoon silk, and their export volume accounted for more than 80% of world’s export trade volume.China’s export trade volume occupied a leading position in China and Southeast Asia’s export zone, however, China’s advantages were constantly being lost, and the gap between Southeast Asia and China was narrowing.The cocoon silk trade was dominated by raw silk as a whole.The silkworm cocoon trade continued to shrink, and it is an inevitable trend that raw silk trade replaces the silkworm cocoon trade.However, there are differences between China and Southeast Asia.China is dominated by raw silk, while Southeast Asia is the opposite.
The competitiveness of silkworm cocoon trade had fluctuated greatly in 58 years, but the difference between China and Southeast Asia was obvious.The raw silk export trade competitiveness is strong in China and weak in Southeast Asia.China’s position in total raw silk exports is becoming more and more stable, and the effect of "a major exporter of raw silk" is becoming more and more obvious.China’s silk trade with Southeast Asia is highly complementary and has an excellent trade relation.The complementarity of export of raw silk from Southeast Asia to China is relatively weak.China’s comparative advantage in silk exports to Southeast Asia and Southeast Asia’s strong silk import demand from China have become the main reasons for the strong complementarity of silk trade.
杂志排行
Asian Agricultural Research的其它文章
- Prevalence Characteristics of Rice Black-streaked Dwarf Virus Disease and Continuous Control Strategies
- Advances in Integrated Control Techniques of Rice Blast
- Experience in Remediation of Contaminated Sites at Home and Abroad
- Impact of COVID-19 on Agriculture, Countryside and Farmers and Countermeasures
- Research on the Revitalization of Rural Talents under the Strategy of Rural Revitalization
- Effects of Biological Flocs on Growth Performance of Cyprinus carpio var.Furui No.2 and Aquaculture Water Quality