Large-scale Application of Silicon-based Anodes Is Coming Soon, and Manufacturers Are Making Greater Efforts in Deployment
2021-08-13
Large-scale Application of Silicon-based Anodes Is Coming Soon, and Manufacturers Are Making Greater Efforts in Deployment
Currently, NEV manufacturers use artificial graphite as anode material for lithium battery. However, per-gram capacity of graphite anode material has climbed to the ceiling, i.e. 372mAh/g. The battery energy density can hardly exceed 290Wh/kg in spite of the collocation with high nickel cathode material (NCM811), which means it fails to meet the energy density goal of 300-350 Wh/kg set by our country. So far, 60% NEV power batteries are equipped with energy density of below 160Wh/kg. There is great potential in urgent demands for upgraded commercialization of battery energy. As there is some lag in development of cathode material, anode material research has become the focus. Among all, silicon-based anode, relying on its per-gram capacity of 4200 mAh/g (10 times that of graphite anode material), has grown into ideal breakthrough point for power battery upgrading. This material is a hot topic for research at this stage.
Tesla has officially launched “Roadrunner”, the self-produced power battery project, which is hopefully to break bottleneck in technology. Scale commercialization is coming true soon and battery material manufacturers and power battery manufacturers are devoting greater efforts to making deployment in silicon-based anodes. The players who come first gain special advantages.
1. Silicon-based Materials Are The Upgrading Trend for Next-generation Anodes
Theoretical discharge capacity of silicon is as high as 4200mAh/g, 10 times that of graphite anode material. Free from hidden risks of lithium precipitation, silicon is safer than graphite anode material. Abundant reserves and low cost make it the most promising next-generation anode material.
Silicon-based anode material consists of two types, i.e. silicon-carbon anodes and silicon-oxygen anodes. Commercialized application capacity of silicon-carbon anode is about or below 450mAh/g. The cost is relatively low and it is mainly applied in 3C digital field. Commercialized application capacity of silicon-oxygen anode is about 450-500mAh/g. The cost is relatively high and it is mainly applied in power battery field.
2. International Manufacturers Have Applied Power Batteries Produced with Silicon-based Anodes while Domestic Manufacturers Are Still at Initial Stage of Development
The development of silicon-based anodes can go back to the year of 1996, when they were first invented by Hitachi Chemical. In 2015 and 2017, silicon-based anodes were introduced to the sectors of consumption and power battery. In recent years, some auto manufacturers like Tesla have applied power batteries produced with silicon-based anodes. Tesla-model3 has fully applied silicon-based anodes to its power batteries. In the future, Tesla will gradually apply silicon-based anodes to all of its mid-to-high-end collections, which will surely lead to global power battery manufacturers promoting their development and application of silicon-based anodes.
Japan and Korea are the two countries that take the lead in technology, including Hitachi Chemical from Japan, Shin-Etsu Chemical from Japan, GS Caltex Corporation from Korea, Daejoo from Korea and Amprius from USA. Panasonic started batch application of silicon-based materials to power batteries to supply Tesla in 2017. Samsung and LG mainly apply silicon-based anodes to consumption battery filed but most likely they are going to approach power battery field in these years.
In our country, silicon-based anodes are at initial stage of development, with small scope of application. Most enterprises are still at sample testing stage and are making relatively slow progress. However, leading battery material enterprises are gradually promoting applications. BTR, a leading enterprise in anodes material, has become a part of Panasonic supply chain with its silicon-based anodes, thus becoming the first in China to supply supporting materials for power batteries for Tesla.
3. The Hardest Bottleneck Being Broken Will Give Impetus to Marketization Application
From the perspective of battery capacity, silicon-based anodes have surpassed the maximum capacity of current mainstream graphite anodes. However, large-scale application still needs more efforts. The hardest bottleneck is the alloying reaction with lithium during charging and discharging process, and this will result in severe volume expansion. When volume expansion reaches as high as 300%, battery cycle performance and initial charge-discharge efficiency (which means charge-discharge performance) will be hindered.
Once this bottleneck is broken, silicon-based anodes will enter an era of scale production. Currently, there are two mainstream solutions: 1) Professor Weifei and his team of Tsinghua University brought up the idea of using carbon layer to mitigate volume expansion and improve electroconductibility; 2) to adopt Tesla dry electrode technology that is already in use to solve problems of short cycle life and low initial coulomb efficiency.
The highly-anticipated Tesla dry electrode technology is a part of “Roadrunner”, an officially launched self-produced power battery project. This technology comes from Maxwell, a company acquired by Tesla with a 55% premium, and it is related to silicon-based anodes.
Specifically, dry electrode technology is to compress anodes/cathodes. We mix a little flour adhesive (PTFE) with anodes/cathodes, use extruding machine to get electrode material belts and calender them onto metal foil collectors to get lithium electrode.
This technology boasts below advantages: 1) It does not require binder, which helps to improve production yield and service life. 2) It does not require solvent, which helps to control energy loss during charge-discharge process. Besides, dry electrode technology includes pre-lithium process, which improves energy density and capacity. 3) Processing is simplified and production cost reduces by 10-20%.
在循环系统疾病中,心律失常是导致器官性病变的最常见类型,严重危及患者的生命安全。随着医疗水平的不断提高,心脏起搏器植入术作为一种高效的手术治疗方法,具有安全性高、创伤小、操作简便等特点[3],因此广泛应用到临床治疗当中,然而患者在术后恢复的过程中因护理不及时会出现全身乏力、胸闷气短等症状,严重降低术后患者的生活质量,延缓了治疗效果。通过此研究,对心脏起搏器植入术患者采用综合护理干预措施,加以结果分析,现报道如下。
The application of dry electrode technology to lithium ion battery is likely to solve the problem of volume expansion in mid-and-high-nickel cathodes/silicon-based anodes in prismatic cells and soft package cells, which is conducive to making improvement in energy density to 500Wh/kg and realizing energy density improvement by 25% every 2 years. Furthermore, cost will be continually reduced by 10% and the bottleneck of energy density of ternary lithium ion batteries will surely be broken.
The entire lithium battery industry needs to promote technology upgrading of power battery enterprises and raw material suppliers, especially advancing development and deployment in silicon-based anodes. On the other hand, silicon-based anodes enterprises can have the access to Tesla’s advanced technologies and can get a slice of Tesla’s market bonus.
As the technologies are getting more developed and promoted, silicon-based anodes industry is going to reach explosive scale commercialization. The players who come first gain special advantages.
4. Huge Market Potential Exists. The Players Who Come First Gain Special Advantages.
(1) Market penetration rate is just 1%, which means great potential for industrial development
Silicon-based anodes are now relatively low in shipment rate and market penetration rate, compared with artificial graphite materials. In Chinese market in 2018 and 2019, shipment of silicon-based anodes of lithium battery was respectively 2600 tons and 3700 tons, with a penetration rate of only 1.4% among all anodes materials. Compared with graphite anodes, silicon-based anodes materials account for a very small market volume.
Industrial concentration is rather high in current anode market. In 2019, CR3 (the sum of output of top three enterprises) and CR5 (the sum of output of top five enterprises) was respectively 57% and 79%, and this is a favorable competition pattern. However, there is a shortage in supplying and capacity of high-end products. Market penetration rate of silicon-based anodes that are leading future development is just 1%. This indicates that future competition will take place among leading enterprises and low-end capacity will be gradually eliminated. High-end materials are getting expanded while market concentration is further consolidated. Once the problems of volume expanding and cycle are solved for silicon-based anodes, they are going to swiftly advance in application, so great potential exists in market scale.
It is predicted that when high-energy-density products are developed for battery materials, market demands for silicon-based anodes will be 10 times the current scale, exceeding 30000 tons. Their penetration rate in power battery anodes will reach 40%. Market room for silicon-based anodes in the coming 3-5 years is about RMB 5 billion.
Market potential is huge but technical barrier is rather high. So far, there are no more than five enterprises that have realized mass production, so market concentration is rather high. During upgrading and transformation, the manufacturers that become the first to realize batch shipment and to seize technical commanding point and market opportunities will gain special advantages.
(2) Silicon-based anodes industry is strong in profitability
Scale application of silicon-based anodes is likely to speed up thanks to continuous improvement in preparation process, ever-enhanced scale production and new battery technologies of Tesla. Unit price of silicon-based anodes is high, which indicates strong profitability. High technical barrier indicates that the manufacturers that become the first to realize batch shipment are likely to gain excess earnings.
1. Profitability is stronger than graphite anode material. Silicon-based anodes get their price based on capacity. The lowest-end silicon-based anodes are priced at over RMB 100000/ton, with gross profit rate of over 40%. Graphite anodes are priced at about RMB 70000-RMB 80000 per ton, with gross profit rate of 20%-30%. That is to say, silicon-based anodes have better performance than graphite anodes in unit price and profitability.
5. Domestic Related Enterprises Accelerate Deployment in Silicon-based Anodes to Seize Opportunities
Domestic anode material enterprises are accelerating deployment in silicon-based anodes, including leading silicon-based anode material manufacturers, i.e. BTR, Shanshan Co., Ltd., Putailai, Zhengtuo Energy, Shinzom, Sinuo and so on. They are making continuous development in capacity and technology and actively promoting industrialization of silicon-based anodes, so as to seize great opportunities in fierce competition.
Among all, BTR silicon-based anode is taking the lead comprehensively. Its market share in 2019 being 90% made it stand first on the list. Half of its production was exported to foreign countries. BTR has become a part of Panasonic-Tesla industry chain. It is estimated that BTR’s yield will achieve 5000-6000 tons in 2020. Silicon-based products of BTR are featured by high capacity, low expansion and long cycle life, and its technologies are 2-3 years ahead of domestic peers.
BTR has upgraded its silicon-based anodes from the first generation (650mAh/g capacity per gram) to the third generation (1500mAh/g capacity per gram), and now is developing the fourth generation silicon-based products with higher capacity.
Moreover, many power battery enterprises are accelerating development and commissioning of silicon-based anode batteries, including Ningde Amperex technology, Lishen, Gotion High-tech, BYD and BakPower. Ningde Amperex technology, Lishen and Gotion High-tech have accomplished mid-term acceptance inspection. Ningde Amperex technology and BakPower are expected to start small-scale production in 2020.
Conclusion: The upgrading of anode materials is to meet the demands of market. Moreover, it also is an important technology innovation supported by strategic planning for the development of new energy of the country. In the meantime, the upgrading also has professional support of “high-specific-energy lithium ion battery technology”, a key technical research project of “13th Five-Year” NEV special pilot projects. The industrial competition pattern is favorable. Silicon-based anode is faced with a critical point of industrialization breakthrough and high concentration leads to the fact that only leading enterprises are competent for the competition in China, so the competition pattern is rather favorable. It is suggested that players pay close attention to new technology innovations and developing trend of silicon-based anode industry to actively connect market demands. Player should rely on favorable cooperative partnership with user enterprises to follow and utilize swift development of silicon-based anodes and opportunities for industrialization.
Unit: metric ton

Name of province or cityProduction inFeb. 2021Total outputJan.-Feb. 2021% Change2020-2021 Zhejiang Jiangxi 812474.62 Hunan 575197.22 Guangxi Yunnan 1731115.49 Total output China 3439741.64
Unit: metric ton

Name of provinceProduction inFeb. 2021Total outputJan.-Feb. 2021% Change2020-2021 Shanxi 1906020.48 Henan 444921.95 Shaanxi Ningxia Xingjiang Total output China 14730423.87
Unit: metric ton

Name of province or cityProduction inFeb. 2021Total outputJan.-Feb. 2021% Change2020-2021 Tianjin Hebei Shanxi 2323212.49 Inner-Mongolia 11575628.42 Liaoning 21189 Jilin Shanghai Jiangsu 5258114.67 Zhejiang 8731921.04 Anhui 18595213.30 Fujian 11462714.68 Jiangxi 23279911.10 Shandong 145940-5.12 Henan 9006726.79 Hubei 58417-23.62 Hunan 214116.04 Guangdong Guangxi 17060733.89 Sichuan Yunnan 99215-7.78 Tibet 1278-12.94 Shaanxi Gansu 12249818.79 Xinjiang 206614.25 Total output China 162986612.27
Unit: metric ton

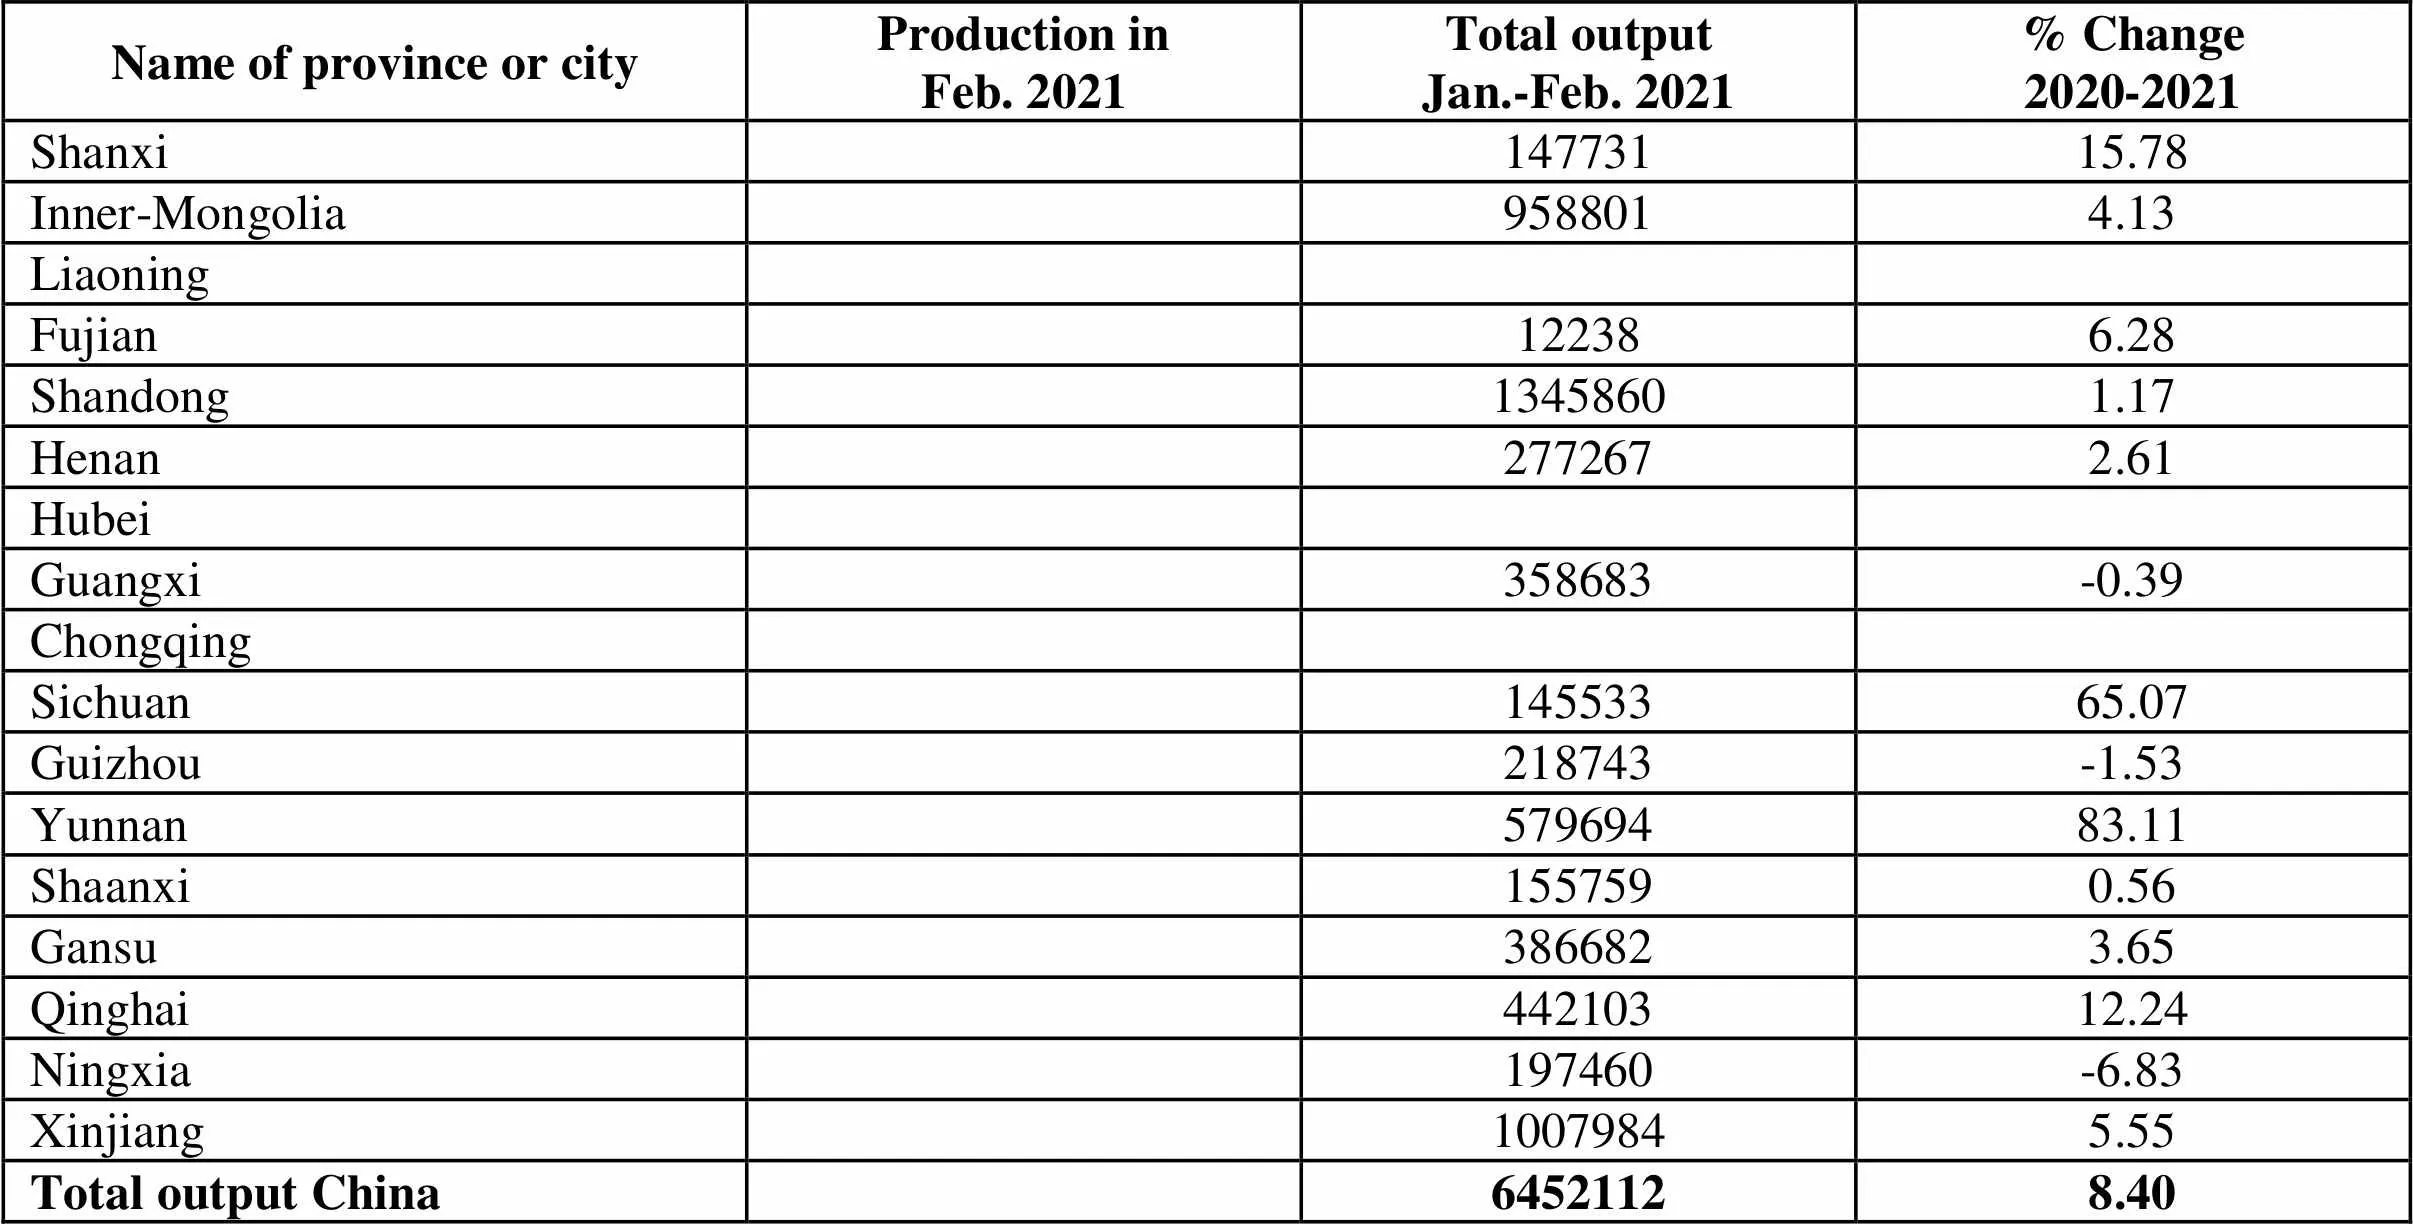
Name of province or cityProduction inFeb. 2021Total outputJan.-Feb. 2021% Change2020-2021 Shanxi 14773115.78 Inner-Mongolia 9588014.13 Liaoning Fujian 122386.28 Shandong 13458601.17 Henan 2772672.61 Hubei Guangxi 358683-0.39 Chongqing Sichuan 14553365.07 Guizhou 218743-1.53 Yunnan 57969483.11 Shaanxi 1557590.56 Gansu 3866823.65 Qinghai 44210312.24 Ningxia 197460-6.83 Xinjiang 10079845.55 Total output China 64521128.40
Unit: metric ton

Name of province Production inFeb. 2021Total outputJan.-Feb. 2021% Change2020-2021 Shanxi 307772211.30 Inner-Mongolia Shandong 47368867.73 Henan 184688232.38 Guangxi 168214127.77 Chongqing 164467-18.17 Sichuan Guizhou 82254921.74 Yunnan Total output China 1264264714.81
Unit: metric ton

Name of province or cityProduction inFeb. 2021Total outputJan.-Feb. 2021% Change2020-2021 Liaoning Jiangxi 162444.32 Henan Hubei Guangdong--- Guangxi Shaanxi--- Gansu 250326.52 Xinjiang 205426.95 Total output China 4841631.30
Unit: metric ton

Name of metalProduction inFeb. 2021Total outputJan.-Feb. 2021% Change2020-2021 Copper 162986612.27 Aluminium 64521128.40 Lead 110905327.77 Zinc 10747452.76 Nickel 4841631.30 Tin 3439741.64 Antimony 3369135.15 Mercury 201-35.68 Magnesium 14730423.87 Titanium 2656521.30 Total China 1055635110.60
Unit: metric ton

Name of province or cityProduction inFeb. 2021Total outputJan.-Feb. 2021% Change2020-2021 Beijing Tianjin 3420141.60 Hebei 1956238.29 Shanxi Inner-Mongolia Liaoning 1517869.76 Heilongjiang--- Shanghai 4145342.21 Jiangsu 45527638.71 Zhejiang 32131830.16 Anhui 2650697.08 Fujian 2016312.95 Jiangxi 61473544.25 Shandong 1379682.56 Henan 11086379.19 Hubei 68792135.27 Hunan 2511438.26 Guangdong 30951137.27 Guangxi 18073-5.84 Chongqin 4062474.56 Sichuan 34577116.06 Guizhou Yunnan 172293.62 Shaanxi 6986108.57 Gansu 75313-7.69 Qinghai--- Ningxia Xinjiang 130131072.11 Total output China 264606133.99
Unit: metric ton

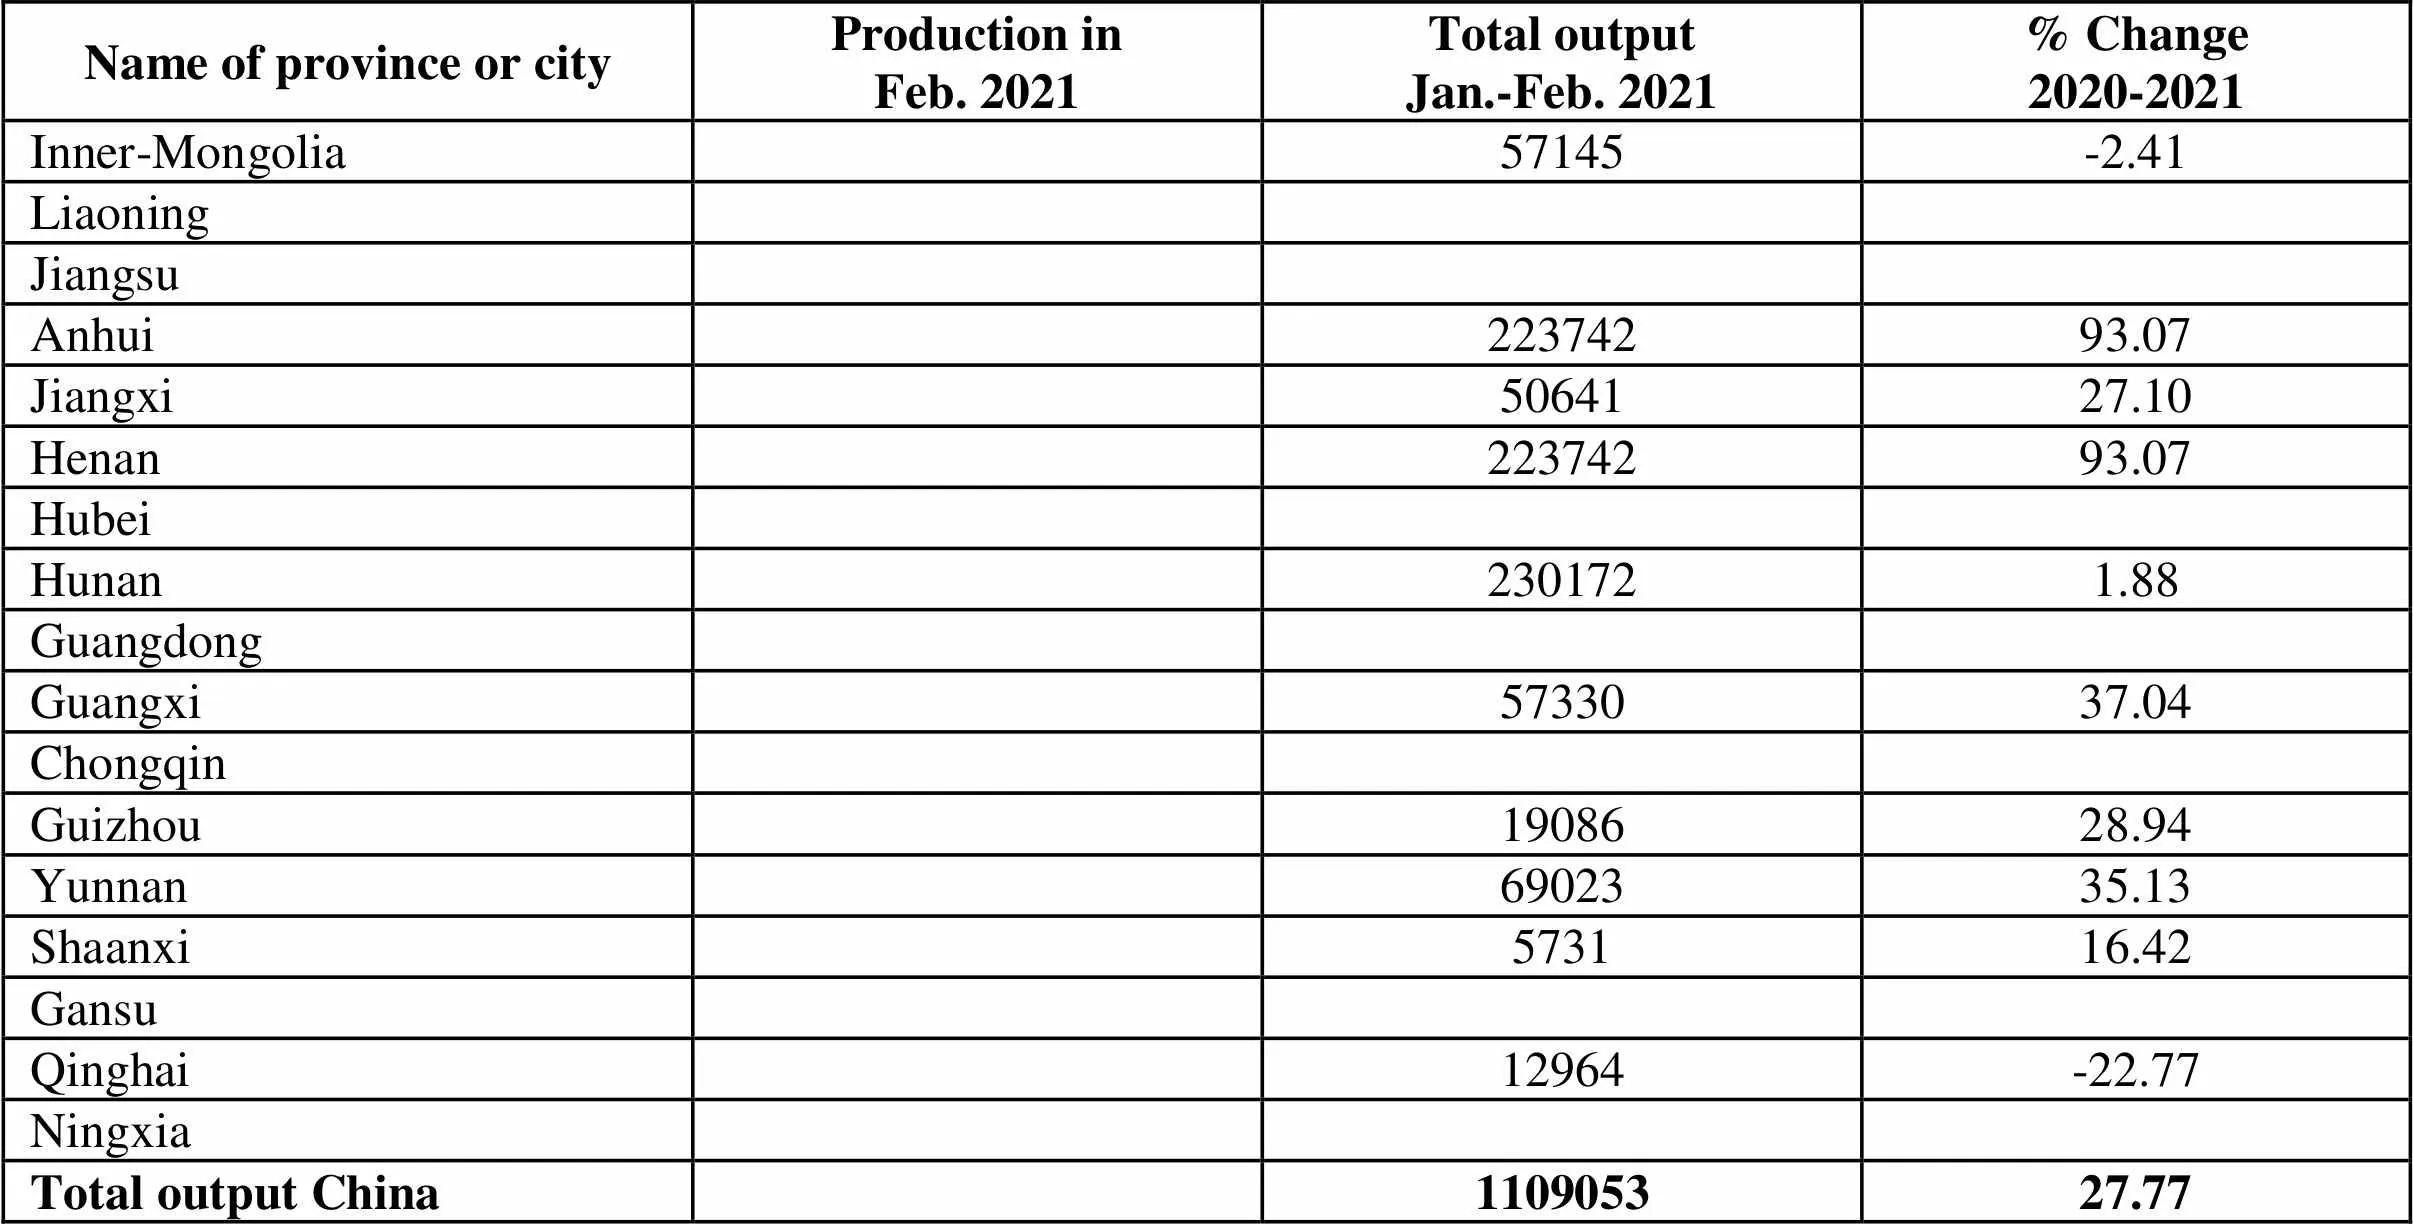
Name of province or cityProduction inFeb. 2021Total outputJan.-Feb. 2021% Change2020-2021 Inner-Mongolia 57145-2.41 Liaoning Jiangsu Anhui 22374293.07 Jiangxi 5064127.10 Henan 22374293.07 Hubei Hunan 2301721.88 Guangdong Guangxi 5733037.04 Chongqin Guizhou 1908628.94 Yunnan 6902335.13 Shaanxi 573116.42 Gansu Qinghai 12964-22.77 Ningxia Total output China 110905327.77
Unit: metric ton(metal content)

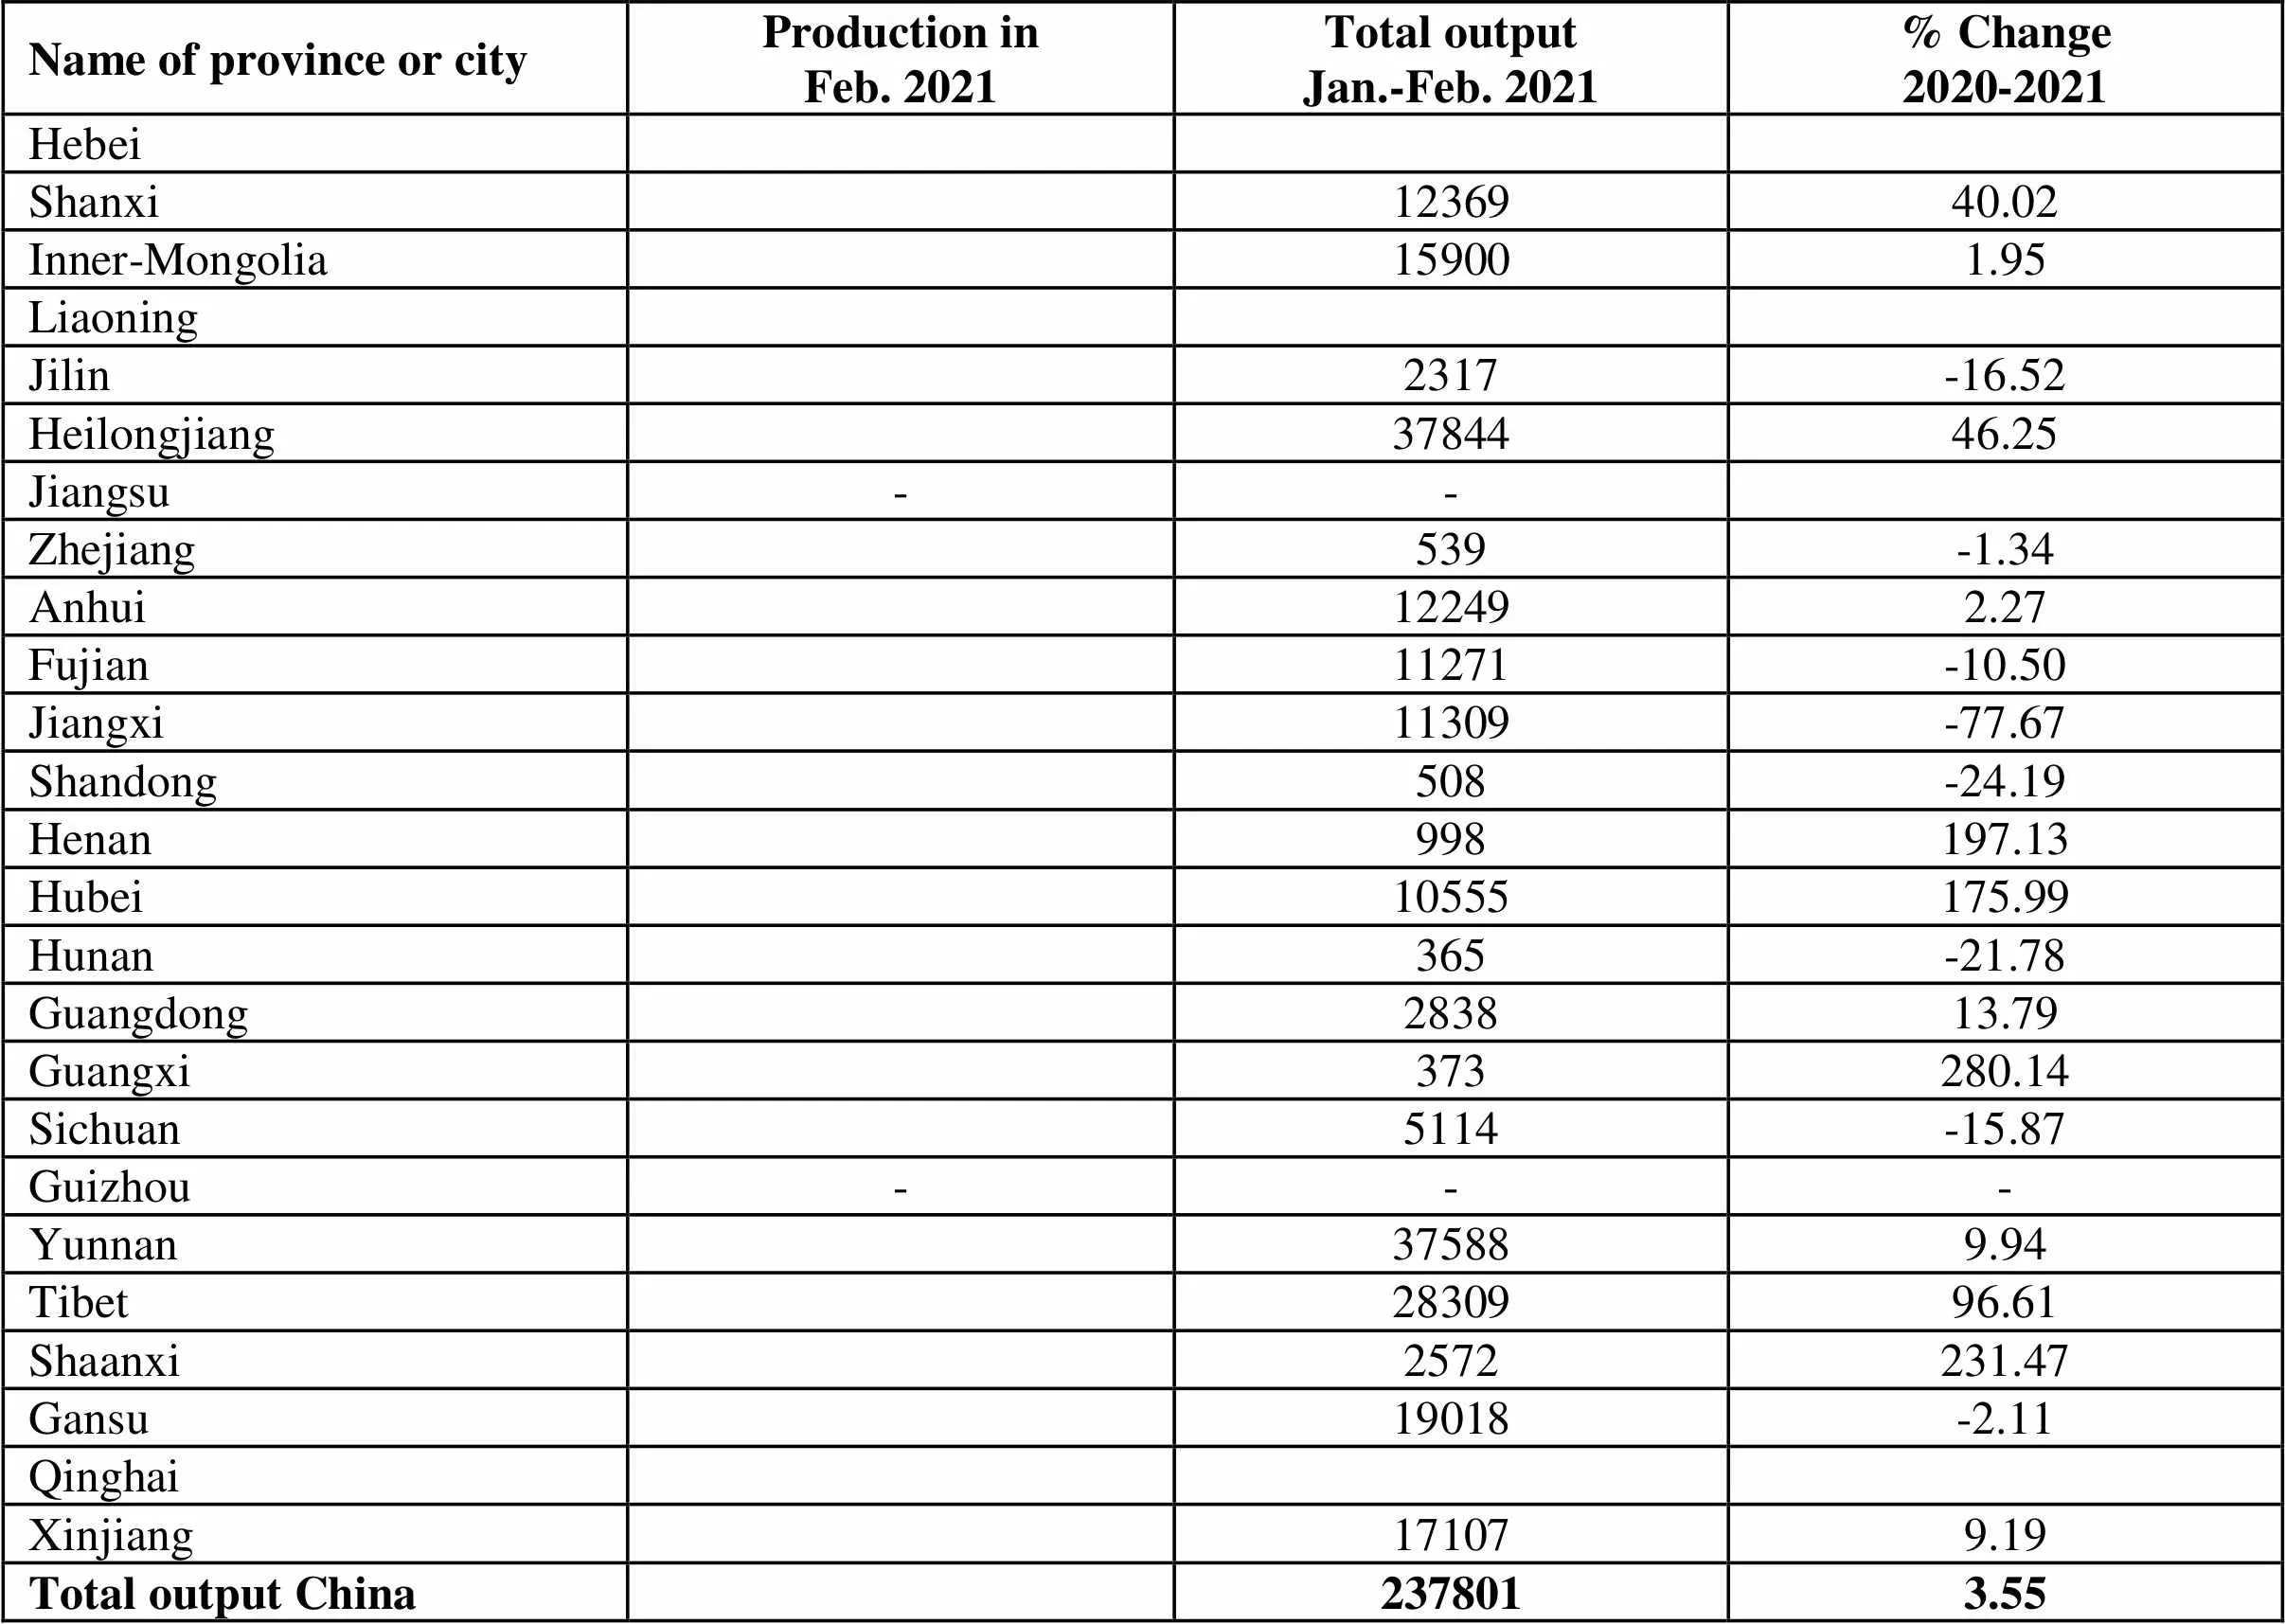
Name of province or cityProduction inFeb. 2021Total outputJan.-Feb. 2021% Change2020-2021 Hebei Shanxi 1236940.02 Inner-Mongolia 159001.95 Liaoning Jilin 2317-16.52 Heilongjiang 3784446.25 Jiangsu-- Zhejiang 539-1.34 Anhui 122492.27 Fujian 11271-10.50 Jiangxi 11309-77.67 Shandong 508-24.19 Henan 998197.13 Hubei 10555175.99 Hunan 365-21.78 Guangdong 283813.79 Guangxi 373280.14 Sichuan 5114-15.87 Guizhou--- Yunnan 375889.94 Tibet 2830996.61 Shaanxi 2572231.47 Gansu 19018-2.11 Qinghai Xinjiang 171079.19 Total output China 2378013.55

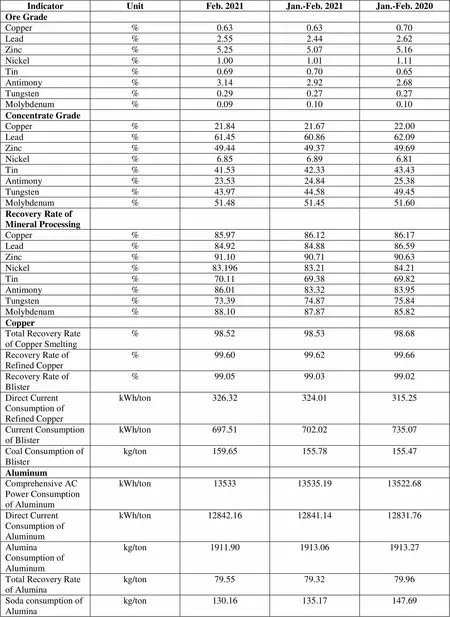
IndicatorUnitFeb. 2021Jan.-Feb. 2021Jan.-Feb. 2020 Ore Grade Copper%0.630.630.70 Lead%2.552.442.62 Zinc%5.255.075.16 Nickel%1.001.011.11 Tin%0.690.700.65 Antimony%3.142.922.68 Tungsten%0.290.270.27 Molybdenum%0.090.100.10 Concentrate Grade Copper%21.8421.6722.00 Lead%61.4560.8662.09 Zinc%49.4449.3749.69 Nickel%6.856.896.81 Tin%41.5342.3343.43 Antimony%23.5324.8425.38 Tungsten%43.9744.5849.45 Molybdenum%51.4851.4551.60 Recovery Rate of Mineral Processing Copper%85.9786.1286.17 Lead%84.9284.8886.59 Zinc%91.1090.7190.63 Nickel%83.19683.2184.21 Tin%70.1169.3869.82 Antimony%86.0183.3283.95 Tungsten%73.3974.8775.84 Molybdenum%88.1087.8785.82 Copper Total Recovery Rate of Copper Smelting%98.5298.5398.68 Recovery Rate of Refined Copper%99.6099.6299.66 Recovery Rate of Blister%99.0599.0399.02 Direct Current Consumption of Refined CopperkWh/ton326.32324.01315.25 Current Consumption of BlisterkWh/ton697.51702.02735.07 Coal Consumption of Blisterkg/ton159.65155.78155.47 Aluminum Comprehensive AC Power Consumption of AluminumkWh/ton1353313535.1913522.68 Direct Current Consumption of AluminumkWh/ton12842.1612841.1412831.76 Alumina Consumption of Aluminumkg/ton1911.901913.061913.27 Total Recovery Rate of Aluminakg/ton79.5579.3279.96 Soda consumption of Aluminakg/ton130.16135.17147.69 Lead Total Recovery Rate of Lead Smelting%97.2397.2597.31 Recovery Rate of Lead Bullion%98.2698.2898.15 Coal Consumption of Lead Bullionkg/ton277.82291.77292.78 Direct Current Consumption of Refined LeadkWh/ton116.15117.13120.64 Zinc Total Recovery Rate of Refined Zinc%96.4596.3196.04 Direct Current Consumption of Refined ZinckWh/ton3043.793051.703048.23 Tin Total Recovery Rate of Tin Smelting%97.9997.3598.25 Direct Current Consumption of Tin SmeltingkWh/ton1630.071934.302136.14 Coal Consumption of Tin Smeltingkg/ton2291.242284.451484.97 Nickel Total Recovery Rate of Nickel Smelting%94.1094.3194.18 Antimony Total Recovery Rate of Antimony Smelting%97.0797.195.91 Direct Current Consumption of Antimony SmeltingkWh/ton605.48649.57862.15 Yield of Processed Material Rate of Total Copper Products%79.6290.779.56 Copper Melting %95.7696.0195.98 Copper Processing Products%82.8583.7782.76 Rate of Total Aluminum Products%67.1867.4366.7 Aluminum Melting%89.4289.6887.67 Aluminum Processing Products%74.9174.5975.23
Unit: metric ton

Name of provinceProduction inFeb. 2021Total outputJan.-Feb. 2021% Change2020-2021 Hebei 505197.76 Inner-Mongolia 10964114.48 Liaoning 484702 Jiangsu Zhejiang 4817117.13 Anhui 10920-34.78 Fujian Jiangxi 227843.51 Henan 624174.68 Hubei Hunan 14496317.94 Guangdong 467637.16 Guangxi 103008-35.28 Sichuan 77033-5.58 Guizhou 446359.1 Yunnan 2086548.61 Shaanxi 114288-3.23 Gansu 6077125.05 Qinghai 2166914.03 Ningxia Total output China 10747452.76
