Influence of air addition on surface modification of polyethylene terephthalate treated by an atmospheric pressure argon plasma brush
2021-08-05JiacunWU武珈存KaiyueWU吴凯玥JunyuCHEN陈俊宇CaihongSONG宋彩虹PengyingJIA贾鹏英andXuechenLI李雪辰
Jiacun WU (武珈存), Kaiyue WU (吴凯玥), Junyu CHEN (陈俊宇),Caihong SONG (宋彩虹), Pengying JIA (贾鹏英),2 and Xuechen LI (李雪辰),2,∗
1 College of Physics Science and Technology, Hebei University, Baoding 071002, People’s Republic of China
2 Institute of Life Science and Green Development,Hebei University, Baoding 071002,People’s Republic of China
Abstract An atmospheric pressure argon plasma brush with air addition is employed to treat polyethylene terephthalate (PET) surface in order to improve its hydrophilicity.Results indicate that the plasma plume generated by the plasma brush presents periodically pulsed current despite a direct current voltage is applied.Voltage−current curve reveals that there is a transition from a Townsend discharge regime to a glow one during one discharge period.Optical emission spectrum indicates that more oxygen atoms are produced in the plume with increasing air content,which leads to the better hydrophilicity of PET surface after plasma treatment.Besides,an aging behavior is also observed.The hydrophilicity improvement is attributed to the production of oxygen functional groups, which increase in number with increasing air content.Moreover, some grain-like structures are observed on the treated PET surface, and its mean roughness increases with increasing air content.These results are of great importance for the hydrophilicity improvement of PET surface with a large scale.
Keywords: plasma brush, water contact angle, surface modification, plasma treatment,hydrophilicity improvement
1.Introduction
Polyethylene terephthalate (PET) is widely used in various application fields, including packaging, manufacturing, electronics and biomedicine due to its excellent physical and mechanical properties as well as chemical stability [1–3].However, PET suffers from certain drawbacks such as poor wetting, dyeing, printing and adhering properties due to low surface energy.Hence, it is of great importance to find an effective way to improve the hydrophilicity of PET surface,which can be fulfilled by an environmental-friendly plasma treatment.Besides, the chemical and physical properties of the bulk keep unchanged after plasma treatment.
Among diversified plasma sources, atmospheric pressure plasma jet is a prominent one in low-temperature plasma research.Utilizing a plasma jet, three-dimensional PET even with irregular shape can be treated because plasma plumes with desirable length are produced in open air atmosphere[4–6].Nevertheless, plasma plume normally covers a small diameter ranging from submillimeter to millimeter,leading to low efficiency of modification for large scale PET surface[7, 8].Therefore, a large scale plasma plume is desirable.Arranging multiple jets to form an array can extend lateral scale of plasma plume[9,10].Unfortunately,strong jet-to-jet interactions often lead to plume divergence [11–13], which impairs treatment uniformity.
In order to achieve uniform treatment of PET with high efficiency[14],other attempts have also been implemented to produce large scale plasma plumes [15].Using a half-confined dielectric duct equipped with barrier discharge,an argon and oxygen plume with a brush shape is excited by a sinusoidal voltage[16].Similarly,argon plume with a fairly large scale is also produced downstream of a plasma brush composed of two opposite naked electrodes[17,18].Besides inert gas,the plasma brush can also be fed with air[18,19].Using the argon plasma brush, surface modification has been investigated in our previous work [20], indicating that reactive oxygen species (ROS) play an important role for PET surface modification.Due to insufficient ROS production,the hydrophilicity improvement is not satisfactory.Hence, better hydrophilicity will be expected if air is added into argon to increase ROS production in the plasma brush.
For the above-mentioned purpose,argon with air addition is used to feed the plasma brush.The influence of air content is investigated on the aspects of plume discharge and the properties of modified surface.
2.Material and methods
Figure 1 presents a schematic diagram of the experimental setup.The plasma brush consists of a 60.0 mm long rectangular gas duct with inner and outer cross sections of 15.0 mm×1.0 mm and 25.0 mm×3.0 mm, respectively.Independently regulated by two flowmeters (Sevenstar CS200), argon with 99.999% purity and air with about 40%humidity are introduced into the duct after sufficient mix.A total flow rate of the gas mixture is kept at 10.0 l min−1.Two tungsten rods with a diameter of 0.8 mm contact the free end of the duct,which are separated with a 15.0 mm gap.One rod is electrically connected to the high voltage output of a direct current(DC)power supply(Glassman EK15R40)via a ballast resistor(R=100 kΩ),and the other is grounded.Gap voltage between the two rods is detected by a high voltage probe(Tektronix P6015A).Discharge current is measured by a current coil(pearson 8600).Accordingly,their waveforms are recorded simultaneously by an oscilloscope (Tektronix DPO4104).A digital camera (canon EOS 5D) is used to capture the discharge with an exposure time of 20.0 ms.After being focused by a lens, light emission from the discharge is transmitted via an optical fiber into the entrance slit of a spectrometer (Acton SP2750) with a grating of 1800 mm−1grooves.
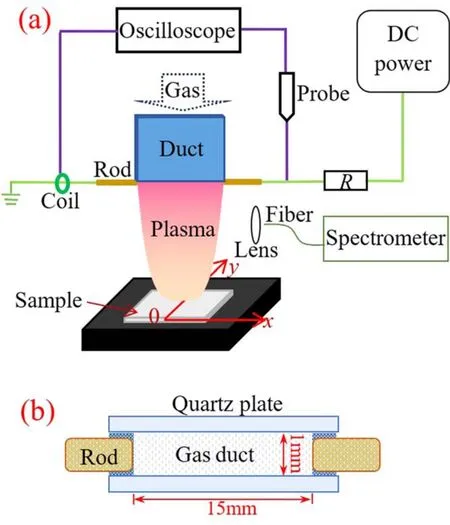
Figure 1.Schematic diagram of the experimental setup: (a) front view, (b) top view.
Before plasma treatment, commercial semi-crystalline PET samples (Dupont) with a thickness of 0.2 mm and an area of 50.0×15.0 mm2are soaked in alcohol for 30 min,rinsed with deionized water and dried at room temperature for an hour.For plasma modification, a scanning stage (FUYU FSL40) is situated at 10.0 mm downstream of the plasma brush, which provides PET sample with a scanning velocity of 1.0 cm min−1alongyaxis.After a single scan,static water contact angle(WCA)is measured immediately with a contact angle analyzer (powereach JC2000D4) through dropping 2.0 μl deionized water on PET surface [21].Every WCA value is averaged for five measurements.Moreover, PET samples are analyzed with a Raman spectrometer (Horiba/Jobin Yvon HR evolution) and an x-ray photoelectron spectroscopy (XPS) instrument (thermo fisher ESCALAB250Xi).The base pressure in the XPS analysis chamber is about 2×10⁻⁹Pa.Samples are excited with x-rays over a 500 μm-diameter spot area with a monochromatic Al Kα1,2radiation at 1486.6 eV.Since samples are insulators, an additional electron gun is utilized for surface neutralization.All spectra are corrected with the main C 1s peak of carbon atoms (284.4 eV) as an internal reference.Atomic force microscope (AFM) (OXFORD MFP-3D Origin) is used to evaluate surface morphology, which is operated in AC air topography mode with a scan rate of 1.0 Hz and a drive frequency of 139.922 kHz.
3.Results and discussions
With increasing gap voltage to some extent, a stable plasma plume with a fairly large scale is formed downstream of the plasma brush, which looks like a trapezoid.The trapezoid is roughly 18 mm in height, whose two bases are 15 mm and 10 mm, respectively.The trapezoid plume has a nearly symmetrical profile with the two edges brighter than the center.Along gas flow direction,middle region of the plasma plume varies from purple to pink, as presented in figure 2(a).Dissipated power (P) of the plasma brush can be calculated from gap voltageu(t) and electric currenti(t).
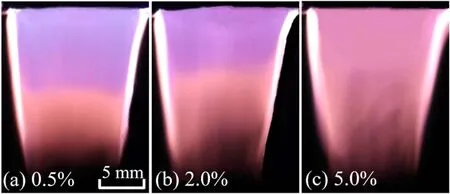
Figure 2.Images captured with an exposure time of 20 ms for the plasma plume with varying air content.Gas flow rate is 10.0 l min−1,and dissipated power is 94 W.

Here,Tdenotes a discharge period.At a constantPof 94 W,the trapezoid plume keeps a nearly constant length with varying air volumetric content, while the lower pink part extends upward in the plume with increasing air content(figure 2(b)).The whole plume turns pink completely with about 5.0% air content (figure 2(c)).
Despite a DC voltage is applied, both gap voltage and discharge current are periodically pulsed, as presented in figure 3.It can be found that gap voltage increases with time before discharge initiates (current keeps almost zero).Once gap voltage reaches its amplitude,discharge current suddenly increases,which is accompanied with an abrupt decrement in gap voltage.After gap voltage reaches a minimum,discharge current decreases with time and discharge quenches gradually.With the decreasing current,gap voltage recovers,which will induce a subsequent initiation.From figure 3, it can also be found that voltage and current amplitudes as well asTincrease with increasing air content.Besides,voltage−current curve for one discharge period is presented in figure 3(d).The curve has a slightly positive slope from points A to B, indicating that it is a Townsend discharge regime.From points B to C,a negative slope is presented,which suggests that a glow discharge regime is involved [17, 22].The glow discharge regime maintains during the falling current phase.Resultantly,there is a regime transition from a Townsend discharge to a glow one during one period.Besides, all the voltage−current curves are similar, while the curve encircled area,representingT, increases with increasing air content.
As is well known, field threshold for breakdown increases with increasing air content due to the electronegativity of oxygen.Apparently, a higher voltage is needed to initiate a discharge with increasing air content, which results in the increasing voltage amplitude with air content.Moreover, the first Townsend ionization coefficient increases with increasing field, which means that more electrons are produced and a higher current amplitude is induced.Hence,current amplitude also increases with increasing air content.Compared with a lower amplitude, it takes a longer time for gap voltage to reach a higher value.Consequently,Tincreases with increasing air content.
Figure 4(a) demonstrates time-integrated spectra in the range from 300 to 900 nm,which mainly include Ar I,O I and the second positive system of nitrogen molecules(C3∏μ→ B3∏g).Some spectra originating from vibrational or rotational transitions of molecules are superposed on continuous spectra in the enlarged spectra of figure 4(b).Shortwavelength emissions ranging from 380 to 440 nm are purple,while long-wavelength ones from 620 to 660 nm are red.Hence, the plasma plume will turn pink with increasing intensity ratio of the two parts(the long wave part to the short one).As illustrated in figure 4(c),the intensity ratio increases with increasing distance from the nozzle or increasing air content.This result explains the color change with varying air content.Absolute intensity of O I such as 777 or 844 nm can be used to determine the atomic oxygen concentration (nO)[23].Related results (not shown here) indicate that more atomic oxygen is produced with increasing air content.Besides,nOcan also be estimated by the intensity ratio of O I to Ar I(750 nm)according to the following formula[24,25].

Here, subscripts Ar, O, and O2denote argon atom, atomic and molecular oxygen,respectively.Moreover,subscripts e and de ofk*denote direct and dissociative excitation rate coefficients,respectively.I,a,nare intensity,effective optical branching ratio,and concentration, respectively.For a small amount of air addition, the right second part of the formula can be neglected, andnArcan be roughly thought as a constant.Thus,nOis correlated with the intensity ratio ofIOtoIAr(777 to 750 nm or 844 to 750 nm)[26].It can be inferred from figure 4(d)thatnOincreases with increasing air content from 0 to 5.0%.
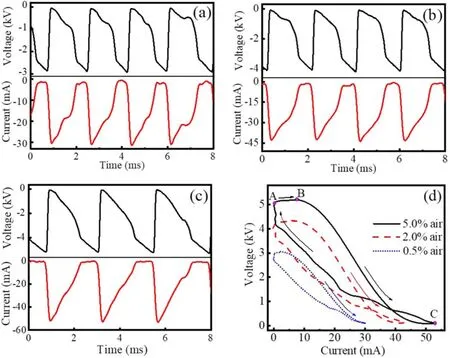
Figure 3.Waveforms((a)to(c))of gap voltage and discharge current,which correspond to figures 2(a)to(c),respectively.(d)Their voltage–current curves.
Figure 5(a) presents WCA of PET surface treated by the plasma brush with varying air content.As a comparison,WCA of 79.8°is also presented for untreated surface.After a single scan with pure argon brush,WCA decreases to roughly 21.2°.Under the constantP, WCA decreases greatly with increasing air content,reaching an optimal value of about 9.8°with 3.5% air, which is much lower than that treated by the pure argon brush.It hardly changes with further increasing air content.As presented in figure 5(b),WCA almost recovers to a constant during the first 6 d exposing treated PET surface to ambient air.The constant WCA is lower for PET surface treated with higher air content.
Figure 6(a) presents Raman spectra of PET surface.The spectrum of untreated PET sample basically presents several characteristic peaks [20, 27, 28], such as C–H bending vibration of benzene ring below 900 cm–1, asymmetric stretching vibration of C–O–C at 1092 and 1190 cm–1, and stretching vibrations of C–O at 1287 cm–1.A strong peak at 1617 cm–1is attributed to skeletal stretching vibration of benzene ring,adjacent to which carbonyl stretching vibration of C = O is located at 1730 cm–1.Peaks between 2900 and 3080 cm–1come from C–H stretching vibration of CH2and benzene ring, respectively.After plasma treatment, a new peak appears at 3436 cm–1, which originates from OH stretching vibration.Peak intensity of oxygen-containing polar groups(C–O–C, C–O,C=O,and OH)extracted from figure 6(a) is investigated as a function of air content, as presented in figure 6(b).It is clear that the intensity from oxygen functional groups increases with increasing air content.These oxygen functional groups can increase surface energy of PET effectively [29], which accounts for the decreasing WCA with increasing air content.
Figure 7(a) illustrates XPS survey spectra, which show peaks corresponding to binding energies of C 1s and O 1s.After plasma treatment, the intensity of C 1s peak is decreased, whereas O 1s peak is increased.Moreover, this tendency continues with increasing air content.Table 1 summarizes the changes of elemental compositions before and after plasma treatment.Results show that O/C ratio of PET surface has experienced a continual growth with increasing air content.It should be pointed out that the O/C ratio calculated from XPS spectra may be smaller than its real value, given that the surface layer scanned by XPS is larger than the plasma-modified layer[30,31].Compared with PET surface just after plasma treatment,a decrease in O/C ratio is observed after 7 d of ageing.However,the aged PET samples after treatment with higher air content still exhibit higher O/C ratio, which is consistent with the WCA measurements.The oxygen content increment suggests that oxygen-containing polar groups are formed on surface, which are mainly related to C 1s peak[32].Thus,high-resolution XPS is performed for C 1s peak of untreated PET, in which the concentration of different chemical states of carbon is determined by fitting the curves with symmetrical Gauss−Lorentz functions,as shown in figure 7(b).Result indicates that C 1s peak consists of three peaks: C–C group at 284.8 eV, C–O group at 286.6 eV, and(C = O) –O group at 288.9 eV [33].The concentration of chemical groups is summarized in table 2.Apparently, after plasma treatment the concentration of C–C group decreases,whereas that of C–O and (C = O) –O group increases.Moreover, this tendency continues with increasing air content, which means that C–C groups are broken from attacks of active species and oxygen-containing polar groups are produced[29,34,35].This result is consistent with that of Raman spectra.These oxygen-containing polar groups appear partly as low molecular-weight oxidized materials(LMWOMs) [36], which are highly oxidized polymer fragments,loosely bounded to PET surface.Besides,they are also likely to be linked to the macromolecular chains.
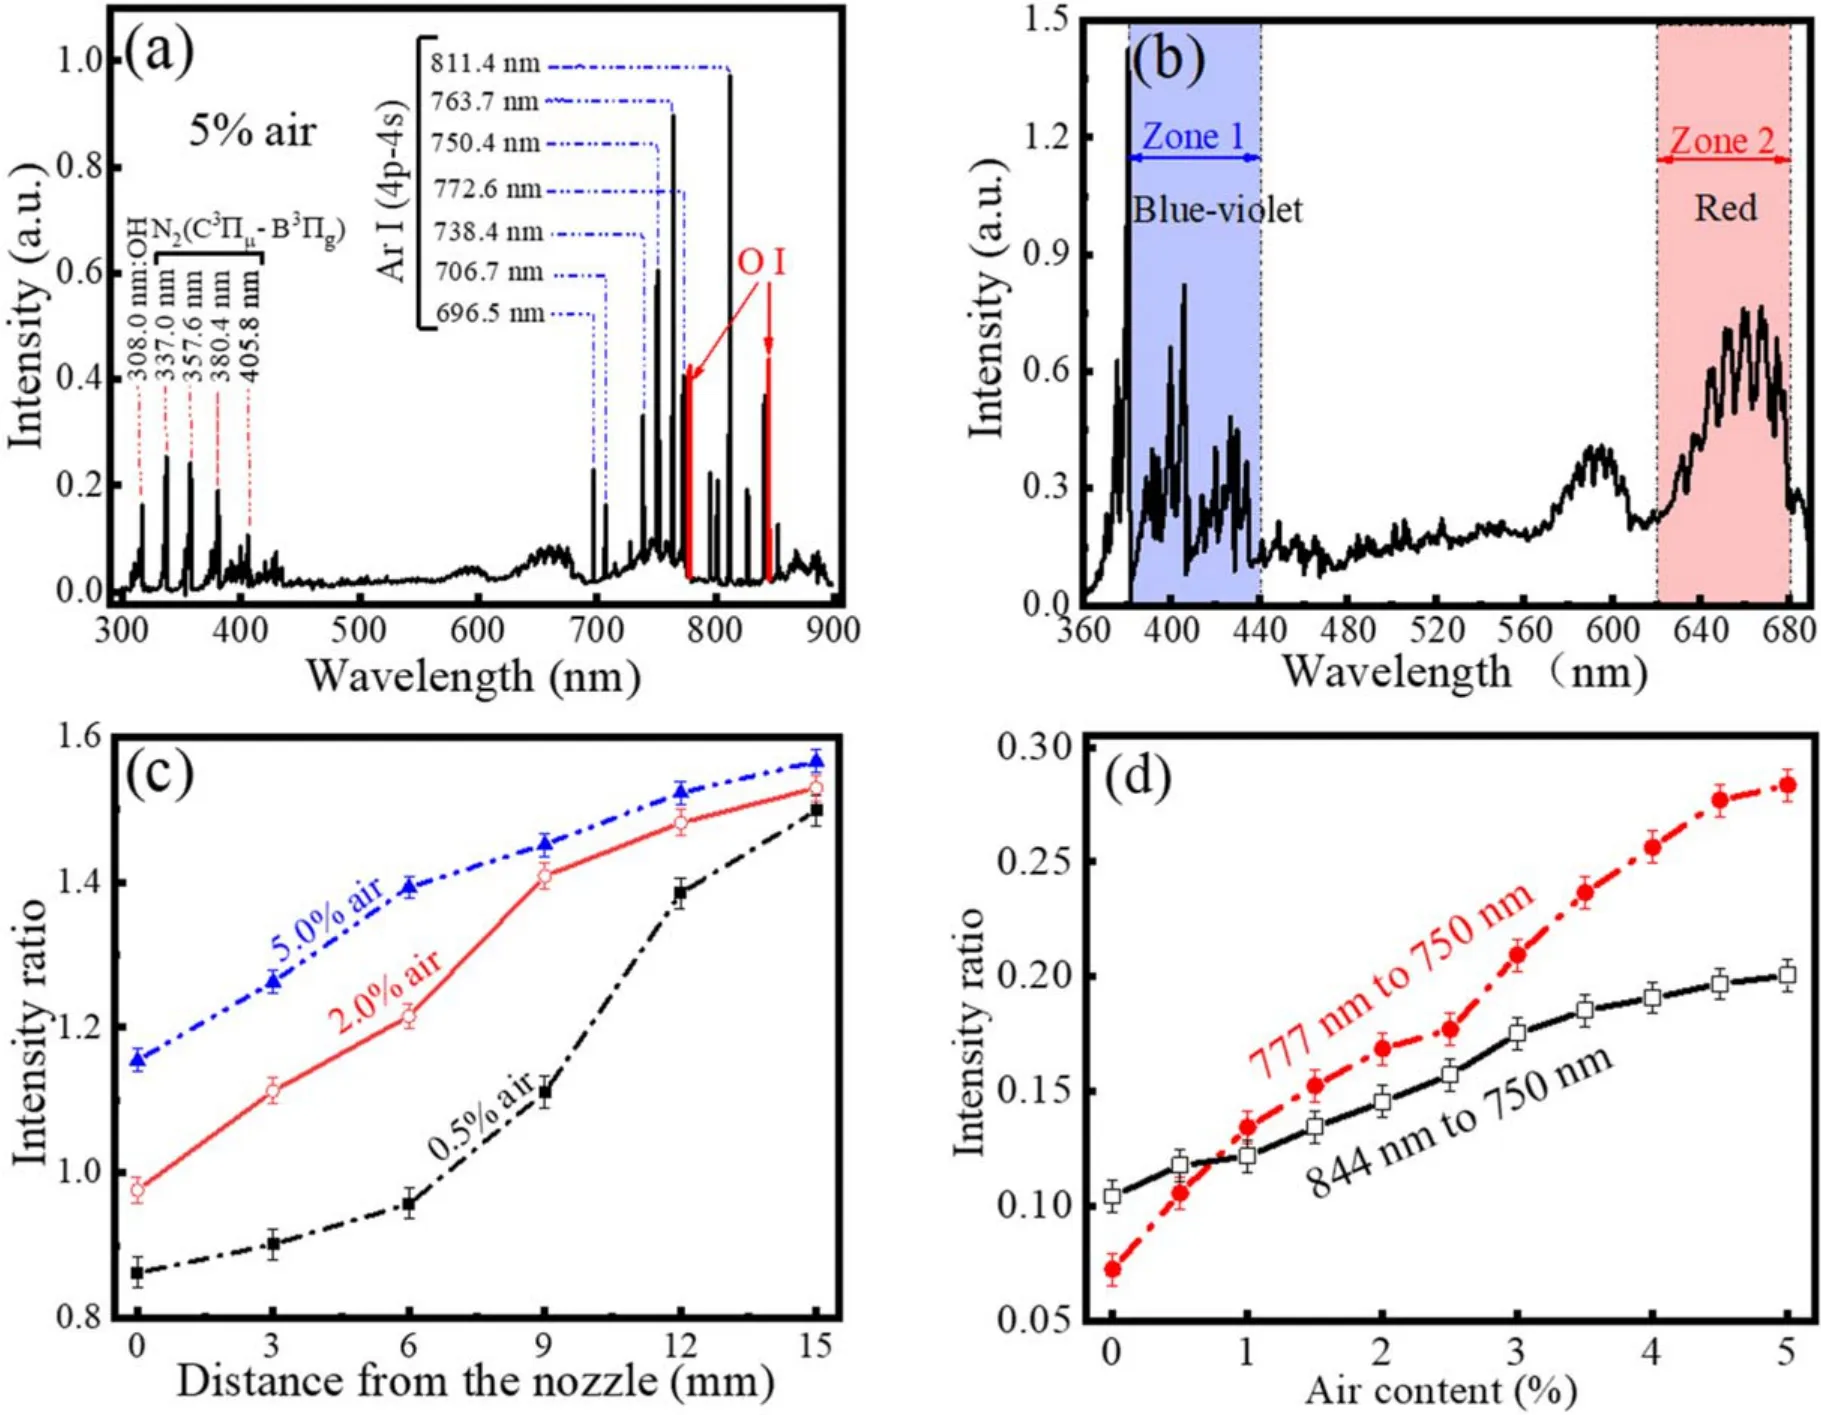
Figure 4.300 to 900 nm scanned spectra from the plasma plume (a), and enlarged spectra (b).Spatial distribution of intensity ratio (c), and intensity ratio as a function of air content (d).Other parameters are the same with those in figure 2.
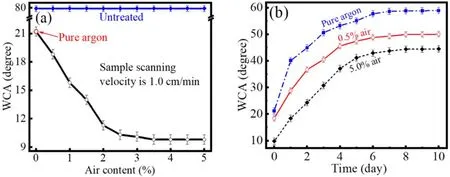
Figure 5.WCA of PET surface after a single scan of the plasma brush as a function of air content (a), and its aging behavior (b).Other parameters are the same with those in figure 2.
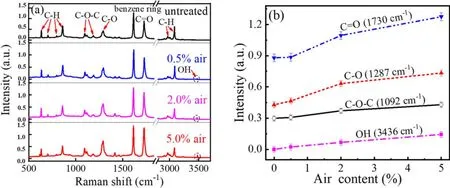
Figure 6.(a)Raman spectra of PET untreated and treated by a single scan of the plasma brush with different air contents.(b)Peak intensity of oxygen-containing polar groups as a function of air content.Other parameters are the same with those in figure 2.
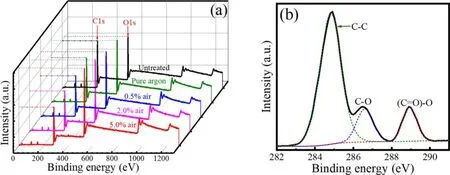
Figure 7.(a) XPS survey spectra of PET untreated and treated by a single scan of the plasma brush with different air contents.(b) Highresolution XPS of C 1s peak of the untreated PET.
The morphology of untreated PET sample is quite smooth as shown in figure 8, with a mean surface roughness value(Ra)of 0.53 nm,determined in a 3 μm×3 μm areas of PET surface.After pure argon plasma treatment, some grainlike structures are observed on PET surface.Besides, the number of grains andRaincrease with increasing air content.These grain-like structures are derived from LMWOMs and crystalline creation [37, 38], or preferential etching of amorphous regions [39].Due to the solubility of LMWOMs [40],most of the grain-like structures are removed (figure 8(e)),andRadecreases to about 1.39 nm.Hence,most of the grainlike structures are attributed to LMWOMs.Compared with untreated PET,Rais higher and some grains can also be found on the washed surface,which reveals that a part of the grainlike structures originates from the crystalline generation and the preferential etching of amorphous regions.AFM images also indicate thatRais decreased after 7 d of aging(figure 8(f)).Combined with the decreasing O/C ratio, it can be deduced that aging behavior is mainly caused by the disappearance of the oxygen-containing polar groups.
As mentioned before, a higher current is induced with increasing air content.Hence, more oxygen atoms are produced in the plume due to the dissociation of more oxygen molecules,which will produce more oxygen-containing polar groups on treated PET surface.As a result, WCA of treated PET surface decreases with increasing air content.IfnOexceeds some extent, the grafting sites reach saturation[25, 38, 41].Under this circumstance, hydrophilicity keeps invariant with increasing air content.Due to the reorientation of PET chains after exposure to ambient air [33, 38, 42],oxygen-containing polar groups migrate from PET outer surface into its subsurface and non-polar groups migrate oppositely, resulting in the aging behavior of treated PET surface.In fact, crosslinking reactions are also induced on PET surface during plasma treatment, which form chemical links between the molecular chains by covalent bonds [43].The surface crosslinked layer acts like a barrier to the migration.It can be speculated that a higher degree of crosslinking is produced after treatment with increasing air content.The increment of crosslinking degree results in the lower removal of oxygen-containing polar groups in case of higher air content in plasma, which accounts for the better hydrophilicity of aged PET surface treated with increasing air content.
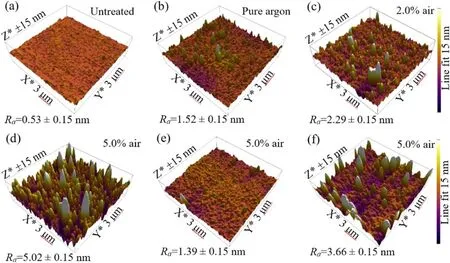
Figure 8.AFM images of PET surface: untreated (a), treated ((b) to (d)) after a single scan of the plasma brush with different air contents,water washed after treatment (e) and 7 days aging without water wash (f).
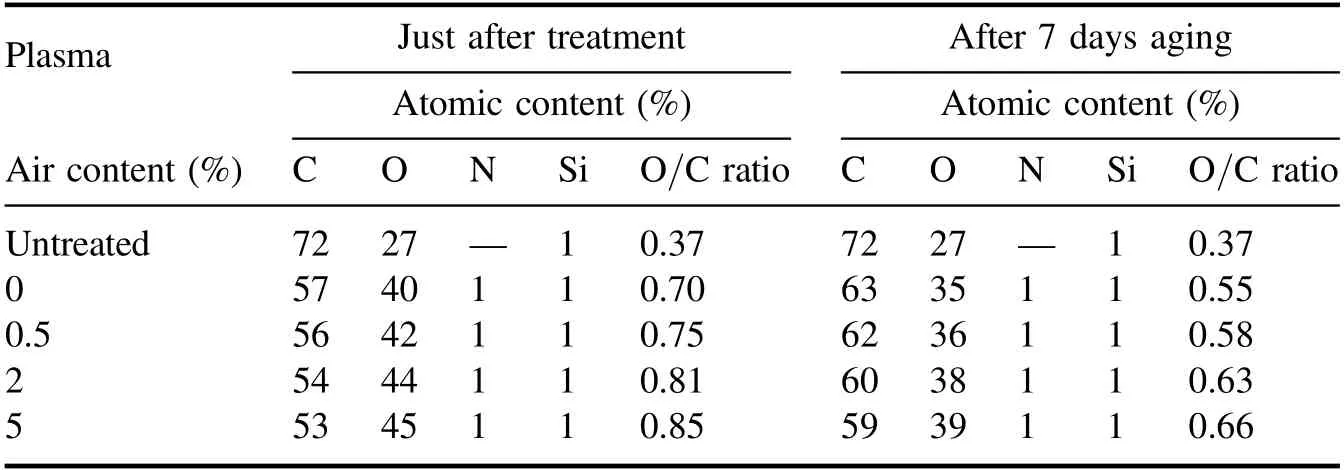
Table 1.Elemental composition(before and after ageing)for PET surface untreated and treated by the plasma brush with varying air content.
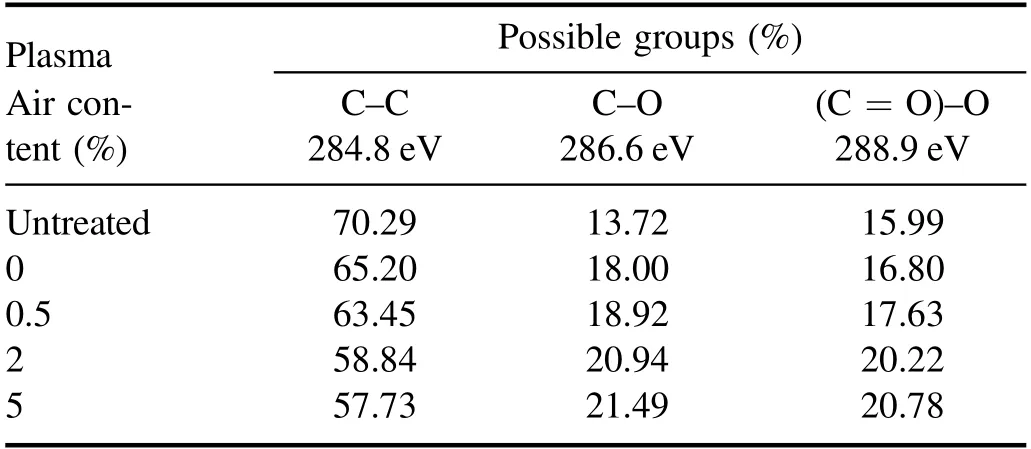
Table 2.Concentration of chemical groups on PET surface before and after plasma treatment with varying air content.
4.Conclusions
In summary, a DC excited argon plasma brush with air addition has been investigated by electrical and optical methods.The plasma brush generates a large scale plasma plume downstream of the nozzle, whose pink region at the lower part extends upward with increasing air content.Despite a DC voltage is applied, gap voltage and discharge current are periodically pulsed.As well as discharge period,amplitudes of gap voltage and discharge current increase with increasing air content.During one period, there is a regime transition from a Townsend discharge to a glow one.For plasma treatment, WCA of PET surface decreases until reaching an optimal value of 9.8°with increasing air content.Besides, aging behavior has also been found with exposing treated PET sample to ambient air.Raman spectra and XPS analysis indicate that the oxygen-containing polar groups are generated on PET surface during plasma treatment, and their number increases with increasing air content.The oxygencontaining polar groups are partly contained in LMWOMs,which agglomerate to form most of the grain-like structures in AFM images.Besides,the number of grain-like structures on PET surface increases with increasing air content, resulting from the reaction with more atomic oxygen produced in plasma plume.During this process, the roughness of treated PET surface increases accordingly.
Acknowledgments
This work was supported by National Natural Science Foundation of China (Nos.11875121, 11575050 and 51977057); the Midwest Universities Comprehensive Strength Promotion Project, the Natural Science Foundation of Hebei Province, China (Nos.A2019201100 and A2020201025); College Hundred Outstanding Innovative Talent Support Program of Hebei Education Bureau(No.SLRC2017021), Post-graduate’s Innovation Fund Project of Hebei Province (Nos.CXZZBS2019023 and CXZZBS2019029), the Natural Science Interdisciplinary Research Program of Hebei University (No.DXK201908),and Post-graduate’s Innovation Fund Project of Hebei University (No.HBU2021bs011).
杂志排行
Plasma Science and Technology的其它文章
- Energy and flux measurements of laserinduced silver plasma ions by using Faraday cup
- Experimental investigation on DBD plasma reforming hydrocarbon blends
- Research on active arc-ignition technology as a possible residual-energy-release strategy in electromagnetic rail launch
- Distinguish Fritillaria cirrhosa and non-Fritillaria cirrhosa using laser-induced breakdown spectroscopy
- On abnormal behaviors of ion beam extracted from electron cyclotron resonance ion thruster driven by rod antenna in cross magnetic field
- Research on quinoline degradation in drinking water by a large volume strong ionization dielectric barrier discharge reaction system
