Comparative transcriptome analysis of atmospheric pressure cold plasma enhanced early seedling growth in Arabidopsis thaliana
2021-08-05DongjieCUI崔东洁YueYIN阴悦HuandongLI李洹东XiaoxiaHU胡小霞JieZHUANG庄杰RuonanMA马若男andZhenJIAO焦浈
Dongjie CUI (崔东洁), Yue YIN (阴悦), Huandong LI (李洹东),Xiaoxia HU (胡小霞), Jie ZHUANG (庄杰), Ruonan MA (马若男),,∗and Zhen JIAO (焦浈),,∗
1 Henan Key Laboratory of Ion-Beam Bioengineering,School of Physics and Microelectronics,Zhengzhou University, Zhengzhou 450052, People’s Republic of China
2 Zhengzhou Research Base, State Key Laboratory of Cotton Biology, School of Agricultural Sciences,Zhengzhou University, Zhengzhou 450001, People’s Republic of China
3 Suzhou Institute of Biomedical Engineering and Technology, Chinese Academy of Sciences, Suzhou 215163, People’s Republic of China
Abstract The stimulatory effects of atmospheric pressure cold plasma (APCP) on plant growth have attracted much attention due to its great potential as a new approach to increase crop growth and production.However,the transcriptome changes of plants induced by APCP treatment are unknown.Herein,the comparative transcriptome analysis was performed to identify the transcriptional response of Arabidopsis thaliana seedlings to APCP.Results showed that APCP exhibited a dual effect(stimulation or inhibition) on Arabidopsis seedling growth dependent on the treatment time and the maximum stimulatory effects were achieved by 1 min APCP treatment.The metabolic analysis of amino acid,glutathione(GSH)and phytohormone demonstrated that 1 min APCP treatment decreased most amino acids concentrations in Arabidopsis seedling, while the accumulations of GSH,gibberellins and cytokinin were significantly increased.The RNA-Seq analysis showed that a total of 218 differentially expressed genes(DEGs)were identified in 1 min APCP-treated seedlings versus the control, including 20 up-regulated and 198 down-regulated genes.The DEGs were enriched in pathways related to GSH metabolism,mitogen-activated protein kinase(MAPK)signaling transduction and plant resistance against pathogens.Moreover, most of the DEGs were defense, stimuli or stressresponsive genes and encoded proteins with oxidoreductase activity.Expression determination of six randomly selected DEGs by quantitative real-time PCR demonstrated similar pattern with the RNASeq data.These results indicated that the moderate APCP treatment may regulate the expression of stimuli/stress-responsive genes involved in GSH,phytohormone/amino metabolism and plant defense against pathogens via MAPK signal transduction pathway,accordingly enhance Arabidopsis seedling growth.This study provides a theoretical basis for the application of APCP in agriculture.
Keywords: atmospheric pressure cold plasma, Arabidopsis thaliana, growth parameters,metabolism, RNA-Seq, transcriptional response
1.Introduction
Atmospheric pressure cold plasma (APCP) is a neutral ionized gas including high energy particles (electrons, positive and negative ions),various radicals(reactive oxygen and nitrogen species (RONS)), neutral substances (excited state atoms and molecules), photons (visible-light and UV), and electromagnetic fields[1].During the last ten years,APCP as an innovative non-thermal physical technology has attracted much attention from researchers in agriculture and plant science, and demonstrated excellent applications in various agricultural aspects, thus leading to the phenomenon of‘plasma agriculture’ [2].Many researches have shown that APCP exhibited excellent antimicrobial activity against a variety of pathogenic bacteria and fungi on seeds or plants and almost left no lingering residues or harmful by-products[2–4].Meanwhile, APCP has been evidenced to be effective for increasing seed germination and enhancing seedling growth for a wide range of plant species (including wheat,oat, soybeans, poppy, hemp, oilseed rape, lentils, and mungbean) [5–9].More recently, several researches have reported that APCP can also enhance plant resistance against various stresses(such as salt and drought stress and pathogen invasion) [4, 8, 10].Taken together, all of these aforementioned positive effects induced by APCP can contribute to an increased yield.Given that most of the APCP devices have low energy consumptions, APCP technology holds great potential as an approach to improve agricultural production [11].
Among the complex constituents in APCP, RONS (e.g.superoxide anion (·O2−), hydrogen peroxide (H2O2), ozone(O3),hydroxyl radical(·OH),nitric oxide(NO),peroxynitrite(ONOO–), nitrite (NO2−) and nitrate (NO3−)) were considered as the major agents responsible for the agricultural applications [12, 13].Numerous studies have demonstrated that RONS(especially H2O2and NO)in APCP can trigger a series of signaling events including endogenous phytohormones secretion, antioxidant system activation and host defense system activation in seeds or plants,accordingly regulate seed germination,seedling growth,development and plant defense responses [14–16].Besides exploring the aforementioned physiological and biochemical alterations in APCP-treated plant cells, some researchers have also investigated the molecular mechanisms underlying the APCP-plant interactions.For example, Moghanlooet alreported that APCP influenced the transcription of universal stress protein and phenylalanine ammonialyase (PAL) genes inAstragalus fridae[17].Iranbakhshet alfound that APCP induced the expression of the WRKY1 transcription factor gene and four key genes referred to the Cannabinoids biosynthesis of Hemp(Cannabis sativa L.)[18].Giercziket alobserved that APCP could regulate the expression of genes related to nitrogen metabolism in barley seedlings under salt stress [19].Adhikariet alreported that APCP could activate the expression of antioxidant genes (such as superoxide dismutase, catalase(CAT)and glutathione s-transferase(GST))in plant cells and maintain redox homeostasis [20].
However, all these studies have only investigated the expression response of some critical genes or biological pathways in plants under APCP treatment,which cannot fully decipher the molecular mechanisms of APCP-enhanced plant growth due to the complex regulatory mechanism for plant growth and development.To our knowledge, the transcriptomics of plant response to APCP treatment has not been reported.Therefore, comparative transcriptome analysis was carried out inArabidopsis thaliana(a model plant)treated by APCP herein.This study investiagted the changes of the growth parameters (primary root length, rate of lateral root,the lateral root number, fresh weight, dry weight and leaf area) between APCP-treatedArabidopsis thalianaseedlings and the control.The amino acid, glutathione and phytohormone metabolism inArabidopsisseedlings were also analyzed.More importantly, this work presents the transcriptome changes ofArabidopsis thalianaafter APCP treatment, which provides useful information for the application of APCP in agritculture.
2.Materials and methods
2.1.APCP device
The experimental set-up was depicted in figure 1.The APCP device was designed based on the dielectric barrier surface discharge.The APCP device consisted of a three-layer structure, as shown in figure 1(b).Two layers of 30 μm thickness copper plane electrode and hexagonal mesh electrode were attached to the two sides of a 1.6 mm FR-4 fiberglass dielectric substrate as high voltage (HV) and ground electrode,respectively.The discharge electrodes were constructed by the widely used electronic technique of printed circuit board.The grounded electrode was exposed to the ambient air in the discharge chamber, which was used as the working gas.Each mesh element of the grounded electrode had a hexagon shape with 8 mm distance between two parallel sides and 0.75 mm width of the hexagonal mesh.The plane electrode placed on the opposite of the dielectric material with an area of 65 mm×70 mm was attached to an AC power supply and formed a dielectric barrier discharge configuration.In particular, the powered electrode was fully insulated using acrylic resin to avoid the formation of plasma on the plane electrode’s edges.In this device, the experimental subjects were exposed to the afterglow of APCP, i.e.the airflow of rich RONS (figure 1(b)).The reactive species of APCP were measured by optical emission spectrum(OES)in our previous work [21].The OES results showed that abundant excited nitrogen molecules and ion(N2and N2+),atomic oxygen (O) and NO generated in the air plasma, which can react with each other to form various kinds of RNS and ROS(·OH, H2O2, NO2−, (NO3−, O3, etc) due to their high activity[21].As shown in figure 1(c), the low-frequency power supply provided sinusoidal HV with an adjustable frequency ranging from 5 to 30 kHz.The discharge voltage and current were detected by a HV probe (P6015A, Tektronix) and a current probe (2877, Pearson Electronics), respectively [22].An oscilloscope (Teledyne, WaveSurfer 3000) was used to record the sinusoidal data.The mean discharge power was obtained by averaging the production between the applied voltage and discharge current over 14 AC cycles.The discharge parameters were 8 kHz frequency,5 kV voltage,2.5 W power consumption, and 0.055 W cm−2power density.During the 10 min plasma discharge, the temperature was maintained at about 28.5°C.The humidity increased slightly from 64.79% to 66.75% (figure 1(d)).
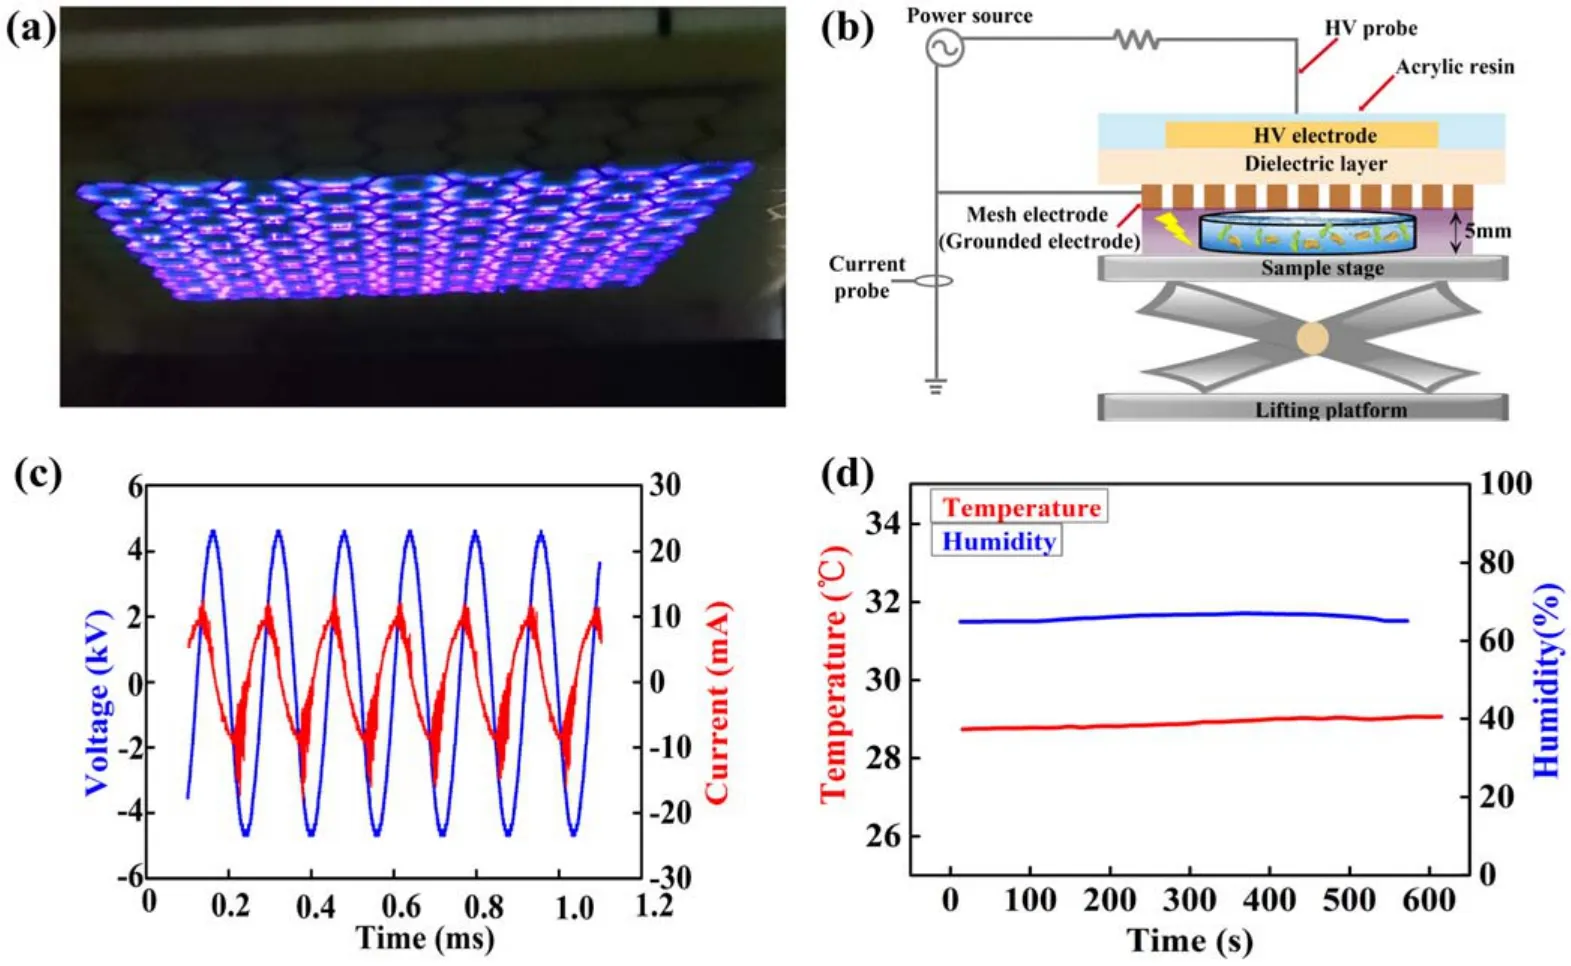
Figure 1.The characteristics of APCP device.(a)Photo of air APCP.(b)Schematic diagram of Arabidopsis seedlings treated by air APCP.(c) Waveforms of applied voltage and discharge current.(d) Temperature and humidity of APCP discharge chamber.
2.2.Plant growth conditions and APCP treatment
Wild-typeArabidopsis thaliana(col-0) was used to investigate the effects of APCP treatment on the plant’s early growth.The seeds used in the experiment were stored at 4°C by adding desiccant (allochroic silicagel) after harvest.Six days prior to APCP treatment,Arabidopsisseeds were surface-sterilized using a disinfectant fluid (85% ethanol:30%hydrogen peroxide=4:1, v/v) with a seed to fluid ratio of 1:5 (approximately 5 μl of disinfectant per seed) for 30–45 s and then rinsed with the sterile deionized water to remove any disinfectant residues.After that, the seeds were placed in an ultra-clean table under visible-light illumination (14 W/6500k, 2014-05, T5, TUS) for 30 min to dry off naturally.Then the seeds were grown in petri dishes (Φ=90 mm,δ=11 mm) containing 1/2 MS (Murashige and Skoog mineral salts)medium(Sigma)and vernalized for 48 h at 4°C in the dark.4 d prior to APCP treatment, the plates were placed vertically in a growth box at 23 °C with 140 ± 20μmol m−2s−1fluorescent light at 16/8 h light–dark cycle[23].The seedlings that germinated for 4 d initially having a complete morphology were chosen for APCP treatment.For APCP treatment, the 4 day-old seedlings (35 samples per group) were moved into a petri dishes (Φ=35 mm,δ=5 mm) with 5 ml ddH2O and treated by APCP for 0, 0.5 1, 3, 5 and 10 min, respectively.The experimental subjects were placed on a vertical-axis positioning stage to adjust the gap length (Lg) between the discharge surface and petri dishes.TheLgwas fixed to be <1 mm (infinitely close) by adjusting the height of the sample lifting platform.The seedlings under 0 min APCP treatment were set as control.
2.3.Measurement of seedling growth parameters
For the plant growth studies, APCP-treated seedlings and the control were planted in new petri dishes containing 1/2 MS.The plates were placed vertically in a growth chamber with the same incubation conditions as above.After 4 d cultivation, the primary root lengths were measured by Image J(Rawak Software,Inc.,Germany)[24],and the number of the lateral root was counted by the method reported by Wanget al[25].8 day-old seedlings were separated from the culture medium and the roots were thoroughly washed with distilled water, then drained with paper towels and weighed to determine their fresh weight [24].Then these seedlings were placed in an oven at 105°C–110°C for 30 min,then set to 70°C and dried to a constant weight(dry weight)[26].The fresh weight and dry weight of 8 day-old seedlings were measured by electronic balance (AR223CN, OHAUS Corporation,Japan).
After 4 d cultivation in the dish, the seedlings were transferred to a substrate enriched with a commercial watersoluble fertilizer(Peters Professional,Everris Inc.,USA)until the seeds were harvested, and each gram of solid fertilizer required 1000 ml of deionized water to be dissolved for watering the substrate.Then the seedlings were grown in incubation room under 16/8 h light–dark cycle at 23 °C and 60% relative humidity for 28 d.Individual leaf area was measured with Image J (Rawak Software, Inc., Germany)[27].The measurements of root length, lateral root number,fresh weight and dry weight were conducted with 50,50,100 and 100 seedlings per replicate, respectively.All the experiments were conducted on three replicates.
2.4.Determination of free amino acid concentrations in Arabidopsis seedlings
Free amino acid metabolism was determined by Nanjing Ruiyuan Biotechnology Co., Ltd [28, 29].Each 0.5 g sample was accurately weighed and added with 3 ml extraction buffer(20% ethanol solution containing 0.001 M HCl).Amino acid was extracted by sonication in a low-temperature(4°C)water bath for 30 min and centrifugated at 12 000 g for 5 min at 4°C,the supernatant was collected.Then 1 ml of the extraction buffer was added to the precipitate and extracted the remaining amino acid twice.The supernatants were collected together and diluted to 5 ml with extraction buffer.The extraction was filtered with 0.22 μm aqueous membrane and stored at −20 °C.The free amino acid concentration was detected by HPLC-MS/MS (AGLIENT1260 and AB4000,America).All the experiments were conducted on three replicates.
2.5.Determination of hormone accumulation in Arabidopsis seedlings
The abundance of gibberellins (GA1 and GA3), trans-zeatinriboside (TZR), zeatin, and indole-3-acetic acid (IAA) inArabidopsisseedlings was determined by Nanjing Ruiyuan Biotechnology Co., Ltd [30–32].Each 1.5 g sample was accurately weighed and grinded with liquid nitrogen,and then added extraction buffer(15 ml acetonitrile and 4 μl of internal standard mother liquor).The mixtures were extracted overnight at 4°C,and centrifugated at 12 000 g for 5 min at 4°C,the supernatant was collected.Then 5-fold volume of acetonitrile was added to the precipitate and extracted the remaining hormone twice.The C18filler (35 mg) was added and shook vigorously for 30 s, and centrifugated at 10 000 g for 5 min,the supernatant was collected.The supernatant was blow dried with nitrogen and redissolved with 400 μl methanol.The dissolving solution was filtered with 0.22 μm aqueous membrane and stored at −20 °C.The hormone metabolism accumulation was detected by HPLC-MS/MS(AGLIENT1260 and AB4000,America).All the experiments were conducted on three replicates.
2.6.Determination of glutathione concentration and glutathione-related enzyme activity in Arabidopsis seedlings
The concentration of reduced glutathione (G-S-H) and oxidized GSH (G-S-S-G) as well as the activity of glutathione s-transferase (GST) and glutathione reductase (GR) inArabidopsisseedlings were determined with the assay kits of GSH-1-W,GSSG-1-W,GST-1-W,GR-1-W(Comin,Suzhou,China) according to the manufacturer’s instructions,respectively.GR and GST activities were detected by micromethod with a multifunctional microplate reader (VARIOSKAN LUX, Thermo, USA) and G-S-H and G-S-S-G concentrations were detected by spectrophotometry (UV mini-1240, SHIMADZU, Japan).All the experiments were conducted on three replicates.
2.7.RNA-seq, data analysis and quantitative real-time PCR(qRT-PCR validation
RNA was extracted using TRIZOL reagent (Invitrogen)according to the manufacturer’s manual.mRNA was isolated using Oligo (dT) after RNA extraction and genomic DNA removal, and PCR was performed to construct the library.RNA sequencing was performed after the library quality test.Once RNA-seq was completed,the raw data were first filtered to obtain high quality clean data.Clean data were compared to the reference genome by HISAT software, and then the R package HTSeq was used to calculate the fragments per kilobase of exon model per million mapped fragments(FPKM) for each transcript [33, 34].The R package DESeq was used to analyze expression distinction between the APCP-treated seedlings and control [35].The screening conditions for differentially expressed genes (DEGs) were as follows: expression difference multiple |log2Fold-Change| > 1, significanceP-value < 0.05 [36].The expression pattern of DEGs under different experimental conditions in this study was presented by cluster analysis [37].DEGs were functionally annotated and deeply analyzed through the following databases: NCBI non-redundant protein sequences(NR); Kyoto Encyclopedia of Genes and Genomes database(KEGG)and gene ontology(GO).The DEG localization was based on the blast results of DEG sequences to genomic sequences, and then visualized the localization results by the software TBtools [38].
qRT-PCR was introduced to verify the expression of six DEGs (three up-regulated DEGs and three down-regulated DEGs in 1 min APCP-treated seedlings compared with the control).A total of 3 biological replicates and 3 technical replicates were employed.As shown in table 1, the betatubulin gene (Tub1, AT1G75780) was used to normalize the RNA expressed levels [39].
2.8.Statistical analysis
All data were presented as mean standard deviation (SD)using a completely randomized design.The graphs in this study were plotted by Origin (OriginLab Inc., version 9.0,USA).The picture of DEGs cluster analysis and chromosomal locations, genome circos DEGs location at the genome were analyzed by TBtools [38].SPSS statistical software package (SPSS Inc., version 17.0, USA) was used for statistical analysis.One-way analysis of variance was used to compare the effects of APCP treatment on growth parameters(root length, lateral root number, fresh weight, dry weight,and leaf area).Significant differences between treatments were tested using the least significant difference (LSD) test with a confidence level atP≤ 0.05.Paired-samples t-test wasemployed to compare free amino acids concentrations, GSH related substance concentration, hormone metabolism, RNASeq and qRT-PCR validation after 1 min APCP treatment.The difference was expressed as*P< 0.05,**P< 0.01, and***P< 0.001.
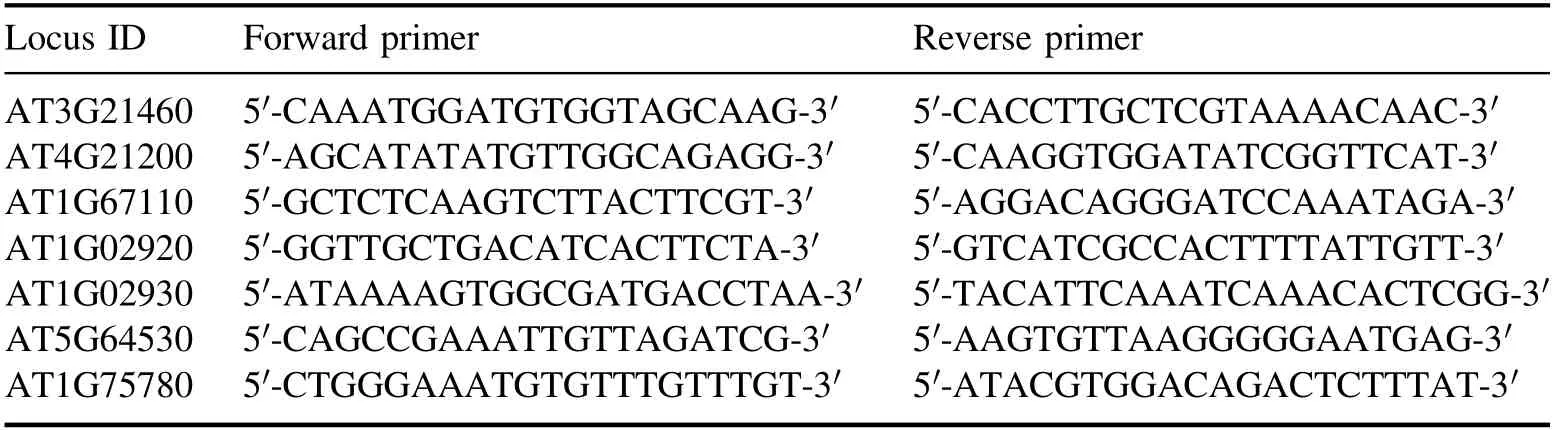
Table 1.The primers of each gene for qRT-PCR in Arabidopsis seedlings.
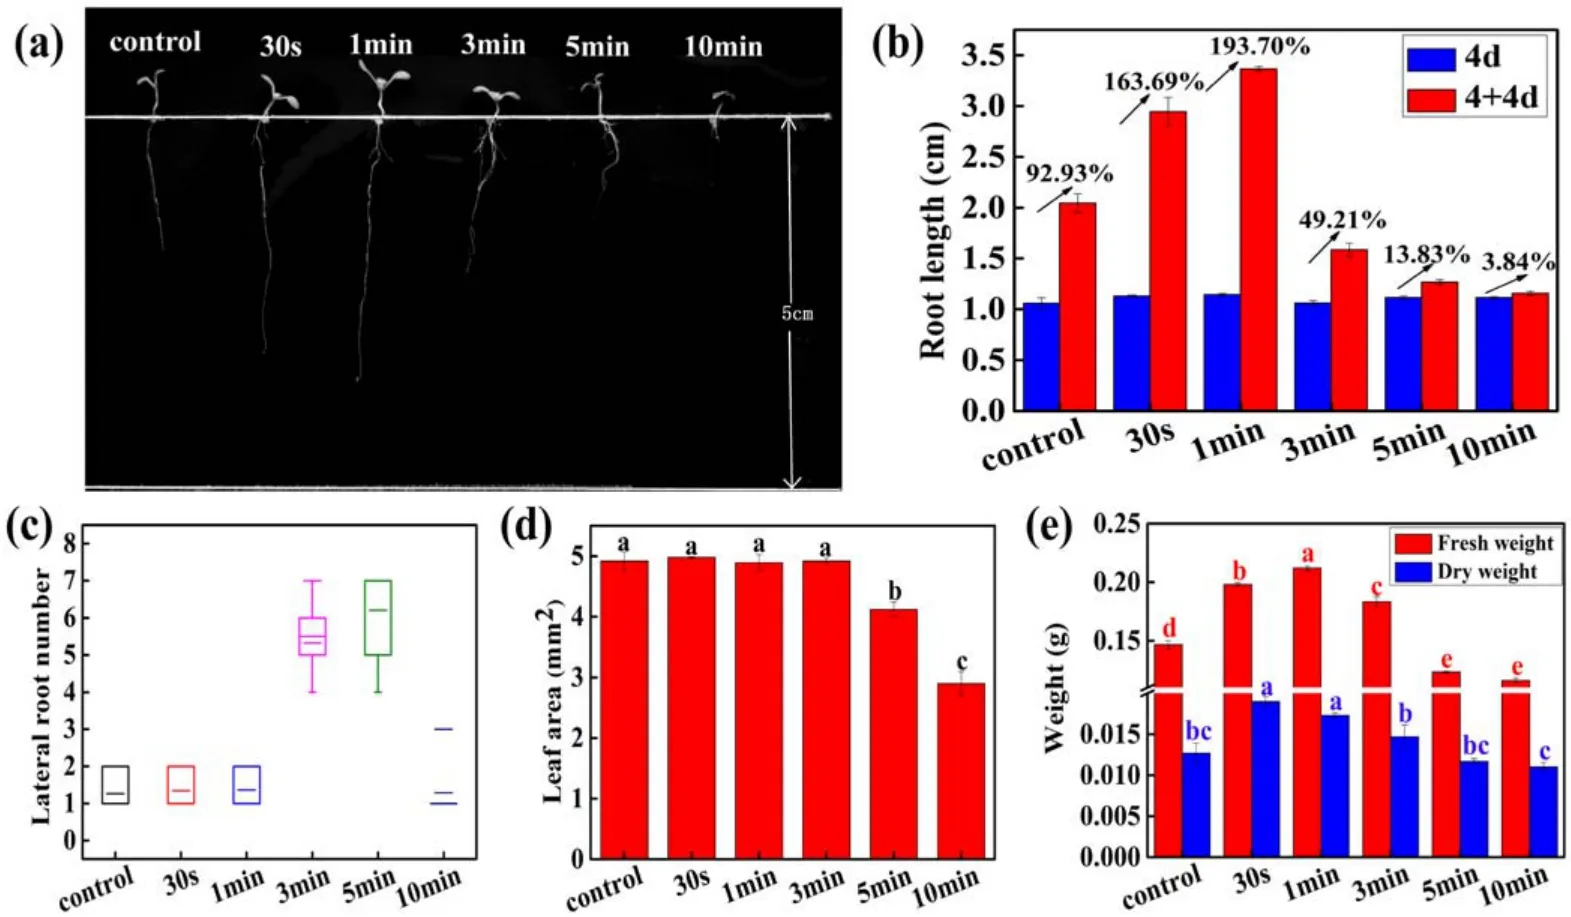
Figure 2.Short-term effects of APCP treatment on early growth of Arabidopsis seedlings after 4 d cultivation.(a)Phenotypic appearance,(b)primary root length,(c)lateral root number,(d)leaf area and(e)fresh and dry weight of Arabidopsis seedlings.The plasma discharge power of all treatment groups is 2.5 W.The error bars indicate the means ± SD.Different letters(a)–(e)indicate significant differences in LSD test between treatments (P < 0.05).
3.Results
3.1.Effect of APCP treatment on the early seedling growth of Arabidopsis
To characterize the effects of APCP on the early growth ofArabidopsisseedlings.The growth parameters of initial root length,lateral root number,fresh weight,dry weight,and leaf area as well as the morphological feature were evaluated.The 4 day-oldArabidopsisseedlings were exposed to APCP treatment for different times (0, 0.5, 1, 3, 5 and 10 min) and the growth parameters were measured after 4 d cultivation following APCP treatment.
Initially, the 4 day-old seedlings (4d) for each group almost had the same root length (figure 2(b)).After 4 d cultivation (4 + 4d), the primary root lengths of 0.5 and 1 min APCP-treated seedlings were increased by 163.69%and 193.78%, which were significantly higher than the control (92.93%), while 3, 5 and 10 min APCP-treated seedlings were increased by 49.21%, 13.83% and 3.84%, which were obviously lower than control.These results indicated that the 0.5 and 1 min APCP treatment significantly promoted the growth of primary root, while 3, 5 and 10 min APCP exposure inhibited the seedlings’ roots elongation (figures 2(a),(b)).Figure 2(c) represents the box plots of lateral root number inArabidopsisseedlings in each treatment group.The lateral root number was increased with APCP treatment time at the first 5 min, then significantly decreased at 10 min.Compared with the control, 0.5, 1 and 10 min APCP treatment only slightly increased the lateral root number, while 3 and 5 min APCP treatment remarkably increased the lateral root number, indicating that 3 and 5 min APCP treatment could improve the lateral root development inArabidopsisseedlings.Figure 2(d) shows the differences in leaf area ofArabidopsisseedlings after APCP treatment.The results show that APCP treatment had no significant effects on the leaf area of seedlings within 3 min compared to control, while 3 and 10 min APCP treatment caused a remarkable reduction in leaf area.As shown in figure 2(e), 0.5, 1, and 3 min APCP treatment led to a significant increase of 34.96%,44.51%,and 24.94% in fresh weight as well as 49.60%, 36.22%, and 15.74% in dry weight compared with control, while 5 and 10 min APCP treatment resulted in a decrease of fresh and dry weight.
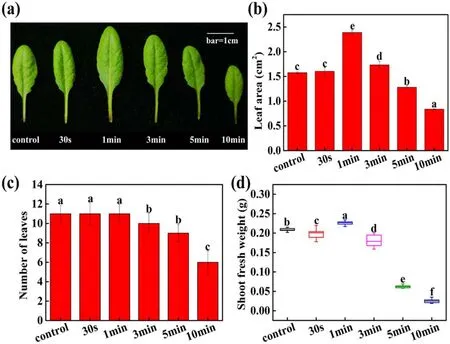
Figure 3.Long-term effect of APCP treatment on growth of 28 day-old Arabidopsis plants.(a)Phenotypic appearance of rosette leaves(Scale bars=1 cm), (b) leaf area, (c) leaf number and (d) shoot fresh weight.The plasma discharge power of all treatment groups is 2.5 W.The error bars indicate the means ± SD.Different letters (a)–(e) indicate significant differences in LSD test between treatments (P < 0.05).
To further validate whether APCP treatment has longterm effects on plant growth ofArabidopsis, the leaf area ofArabidopsisplant was also measured after 28 d cultivation following APCP treatment.As shown in figures 3(a)and(b),the leaf area after 0.5, 1, and 3 min APCP treatment was increased by 1.02, 1.51 and 1.1-fold compared with control,respectively, while 5 and 10 min APCP treatment had negative effects on the growth ofArabidopsis, which was consistent with that of short-term effects induced by APCP treatment.The leaf number ofArabidopsison day 28 is shown in figure 3(c).Compared with control, short-term (0.5 and 1 min) APCP treatment did not change the number of leaves, whereas the long-term (≥3 min) APCP treatment reduced the number of leaves.The shoot fresh weight of single plants on day 28 (figure 3(d)) inArabidopsiswas also counted.1 min APCP-treated seedlings had the maximum fresh weight (0.23 g), which was higher than that of control(0.21 g).Based on above results, although the measured growth parameters had different change patterns over APCP treatment time, 1 min APCP treatment apparently exhibited the maximal beneficial effects on the early growth ofArabidopsisseedlings.Thus, in follow-up experiments, 1 min APCP treatment was chosen as the optimum regime to investigate the transcriptome changes of APCP-induced stimulatory effects on seedling growth.
3.2.Effect of APCP treatment on amino acids metabolism in Arabidopsis
Amino acids are key elements in the balance between catabolism and biosynthesis of various compounds during plant growth.The effects of APCP on the amino acid metabolism including eighteen amino acids and one non-protein amino acid-γ-aminobutyric acid (GBAB) were investigated.As shown in figure 4, both in APCP-treated seedlings and the control, Glu was the most abundant amino acid, while the concentration of Tyr was the lowest and Cys was not detected.Moreover, most of the amino acid concentrations decreased after APCP treatment and seven amino acids(GABA, Ala, Glu, His, Pro, Ile, Met) exhibited significant differences among them.Only Trp and Tyr concentrations in APCP-treated seedlings were significantly higher than those of the control seedlings.These results indicate that APCP treatment may enhance the capacity ofArabidopsisseedlings to utilize the free amino acids to synthesize new proteins or other key metabolic intermediates, consequently leading to improved seedling growth.
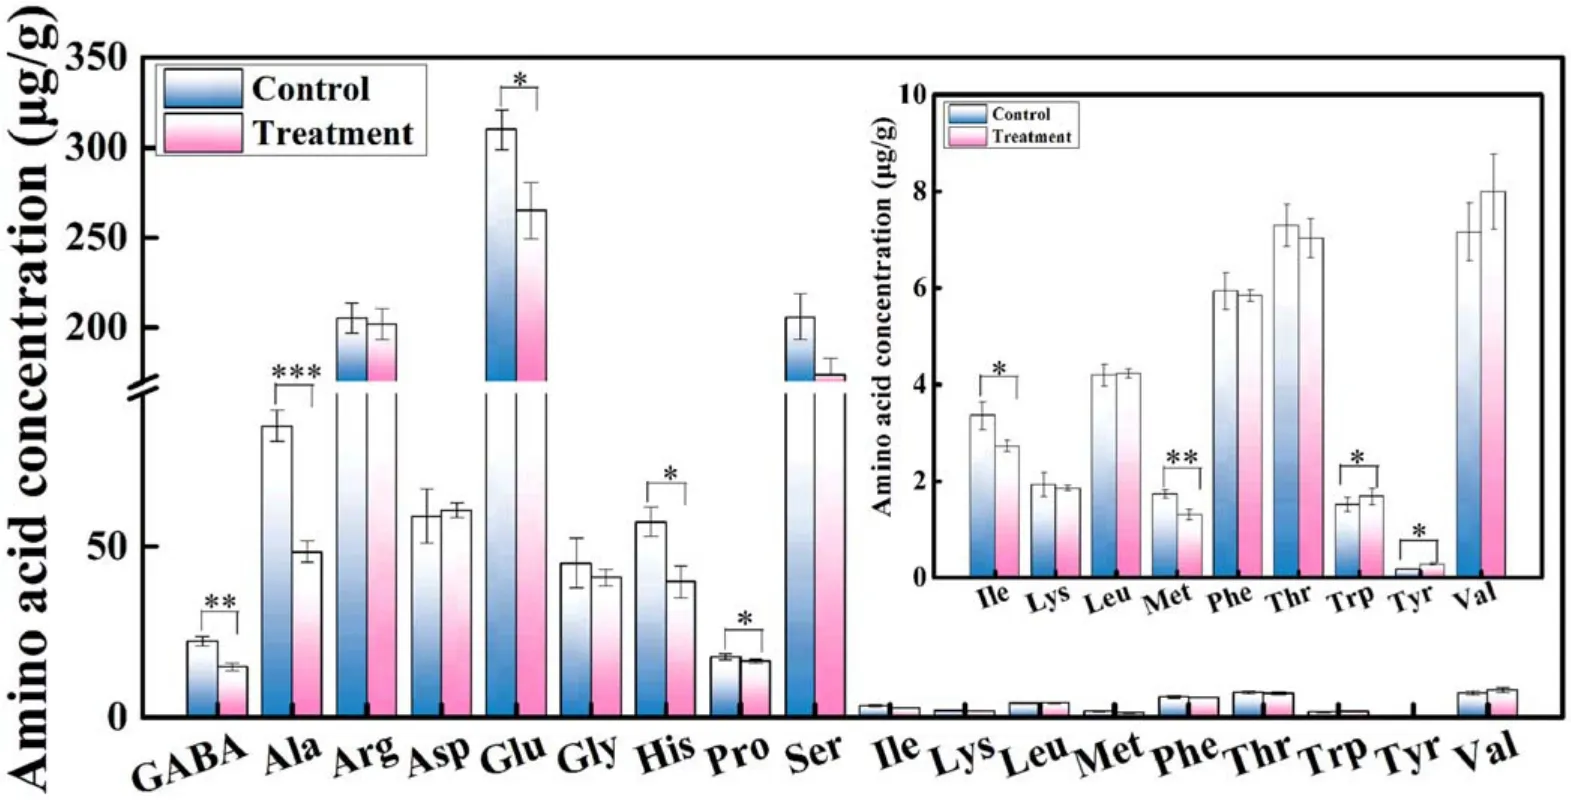
Figure 4.The free amino acids concentrations in control and 1 min APCP-treated Arabidopsis seedlings.The inset is an enlarged view of the concentration of Ile,Lys,Leu,Met,Phe,Thr,Trp,Tyr,and Val.The error bars indicate the means ± SD.The significant difference between control and treatment is expressed as *P < 0.05, **P < 0.01, and ***P < 0.001.
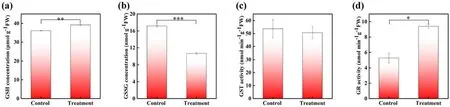
Figure 5.The concentrations of(a)G-S-H and(b)G-S-S-G as well as the activity of(c)GST and(d)GR in control and 1 min APCP-treated Arabidopsis seedlings.The error bars indicate the means ± SD.The significant difference between control and treatment is expressed as*P < 0.05, **P < 0.01, and ***P < 0.001.
3.3.Effect of APCP treatment on glutathione and phytohormone metabolism in Arabidopsis
Previous researches have shown that glutathione metabolism plays an important role in plant growth and development,which involves many glutathione regenerations and degradation enzymes, such as GR and GST [40].Herein, four metabolites associated with glutathione metabolism (G-S-H,G-S-S-G, GST and GR) were measured.As shown in figure 5,a significant increase of G-S-H level and GR activity,reduced G-S-S-G level and GST activity were observed in APCP-treatedArabidopsisseedlings.The G-S-H level and GR activity were 8.33% and 77.84% higher than control(figures 5(a),(d)).The G-S-H/G-S-S-G ratio was remarkably increased by 157%.All these results indicate that APCP treatment could affect glutathione metabolic processes in seedlings, which may further influence the growth and development ofArabidopsisseedlings.
As shown in figure 6,gibberellins(GA1 and GA3),TZR,zeatin, and indole-3-acetic acid (IAA) levels were measured inArabidopsisseedlings after 1 min APCP treatment.The concentrations of GA1, TZR, and zeatin in APCP-treated seedlings were 49.6%,72.05%and 2.1%higher than control,respectively.GA3 was not detected in control seedlings,while GA3 concentrations in the APCP-treated seedlings were 0.042 ng g−1.IAA accumulation in seedlings under APCP treatment was 15.28% less than that in the control(figure 6(e)).These results indicate that the enrichment of gibberellins(GA1,GA3)and cytokinin(zeatin,TZR)induced by APCP treatment may affect the growth and development ofArabidopsisseedlings.
3.4.High-throughput sequencing and mapping
High-throughput sequencing of 1 min APCP-treatedArabidopsisseedlings was performed by an illumina-based nextgeneration sequencing approach.As shown in table A1, we obtained at least 38 million raw reads per group from RNAseq with low-mass sequences below 0.02% and more than 93.5% of the sequences reached quality control Q30.As presented in table A2, after the short reads, low-quality sequences and unclear nucleotides were removed from the original reads, over 35 million (>92.2%) clean reads in each group were used for further analysis.
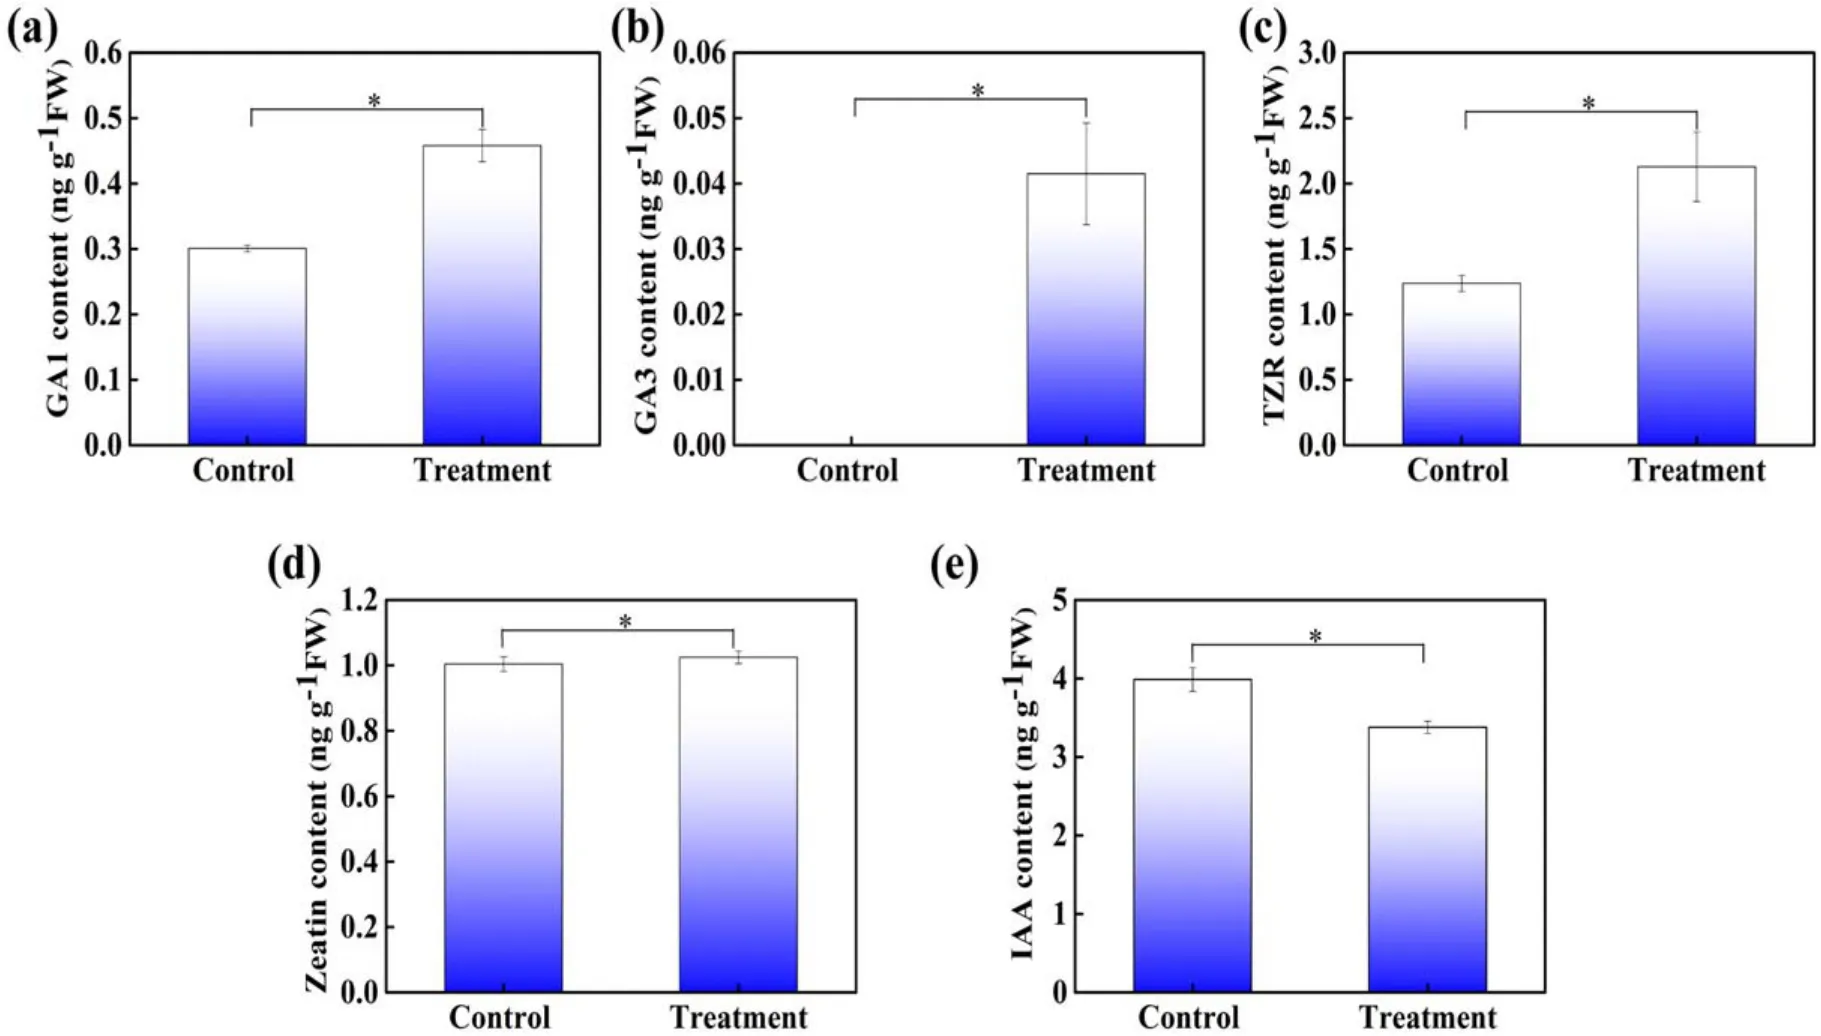
Figure 6.The level of (a) GA1, (b) GA3, (c) TZR, (d) zeatin, and (e) IAA in control and 1 min APCP-treated Arabidopsis seedlings.The error bars indicate the means ± SD.The significant difference between control and treatment is expressed as *P < 0.05, **P < 0.01, and***P < 0.001.
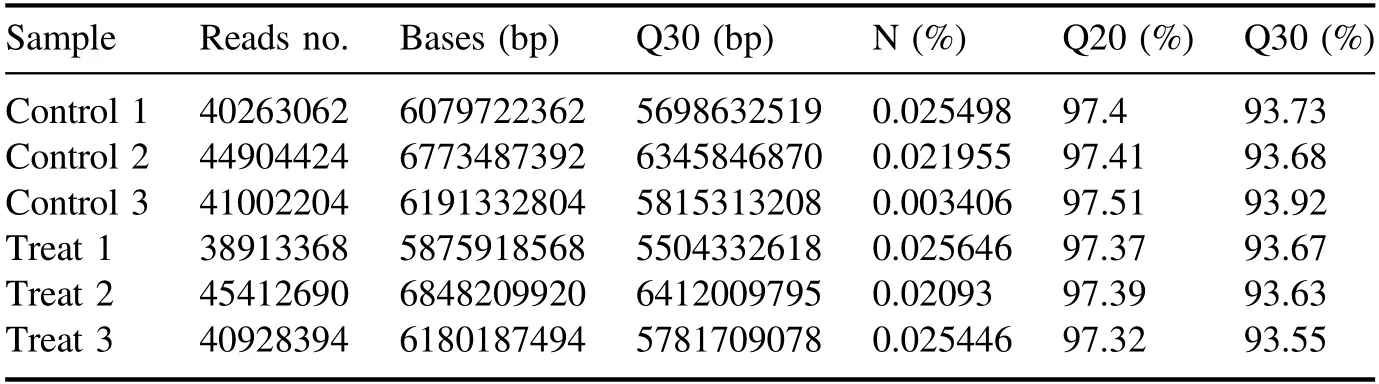
Table A1.Samples were sequenced by Illumina HiSeq,and image files of the sequencing results were simultaneously transformed to generate the raw data in FASTQ format.We performed statistics on the raw data for each sample,including sample name,Q30,percentage of fuzzy bases, and Q20 (%) and Q30 (%).
All clean reads were compared to theArabidopsisgenome using Tophat2.Of these clean reads, more than 97.3%were mapped reads,and more than 97%were unique mapped reads(table A3).The distribution of reads on the genome was shown in table A4.Compared to the reference annotation,over 97% of the reads were mapped on the gene region.The majority of the mappings (99.6%) were concentrated in the exon regions.
3.5.Effect of APCP treatment on transcriptome sequencing in Arabidopsis seedlings
In order to investigate the molecular mechanism of APCPenhanced early seedling growth inArabidopsis, the comparative transcriptome analysis was conducted to identify the DEGs between 1 min APCP treated seedlings and control.The correlation of gene expression levels among samples was an important indicator of experimental reliability and reasonableness of sample selection, which should be checked before doing differential expression analysis (figure 7(a)).As shown in figure 7(b), the transcripts of 1 min APCP treated seedlings and the control demonstrated good repeatability among three biological samples for each group.A total of 218 genes showed significantly differential expression (|log2Fold Change| > 1 andP-value < 0.05) including 20 up-regulated genes and 198 down-regulated genes in 1 min APCP-treated seedlings compared with the control.Details of these up-and down-regulated DEGs (chromosome location, gene length,and function) were listed in tables A5 and A6, respectively.These results indicated that 1 min APCP treatment onlyinduced a small-scale transcriptional change (218 DEGs)compared with the whole genome ofArabidopsis thalianaand these DEGs were mostly down-regulated by 1 min APCP treatment.
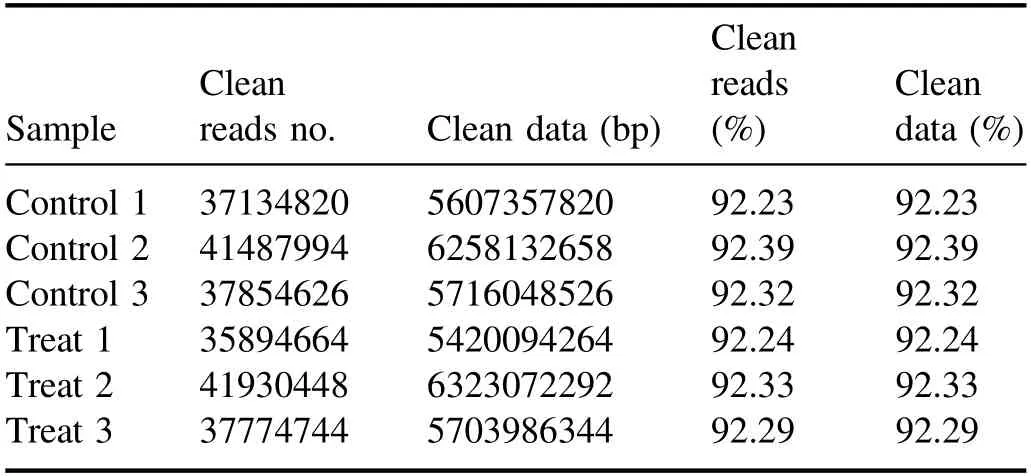
Table A2.The raw data were filtered to remove sequences containing adaptor-polluted, low-quality reads, and high content of unknown base (N) with the following results.
3.6.KEGG pathways analysis of DEGs
To identify the biological pathways of DEGs between APCPtreated seedlings and the control, the KEGG pathway annotation and maps were obtained using the KEGG database(https://kegg.jp/).As shown in figure 8, the KEGG pathways analysis classified 218 DEGs into 29 different categories.Most of the pathways were belong to metabolism (24 categories), followed by genetic information processing (3 categories), environmental information processing (1 category) and biological systems (1 category), indicating the expression of metabolism-related genes inArabidopsis thalianaseedlings was significantly affected by 1 min APCP treatment.The DEGs were significantly enriched in GSH metabolism, mitogen-activated protein kinase (MAPK) signaling pathway, indole alkaloid biosynthesis and plantpathogen interaction pathway [−log10 (P-value) > 1], indicating that these pathways play important roles in response to 1 min APCP treatment.
3.7.GO enrichment classification of DEGs
As another important tool for bioinformatics, GO annotation can clarify the various metabolic pathways involving individual genes (http://geneontology.org/).The DEGs in response to 1 min APCP treatment were categorized according to GO annotation,being assigned to the biological process(BP), molecular function (MF) and cellular component (CC).Figure 9 shows the top-10 most significantly enriched GO terms in each category.The GO terms in BP group had very highly significantP-values [−log10 (P-value) > 10], followed by the GO terms in MF group [−log10 (P-value)ranging from 2.5 to 7.5], while theP-value of GO terms in CC group was the least significant[−log10(P-value) < 2.5].In the BP group, response to external biotic stimulus,response to other organisms, defense responses, response to stress and response to biotic stimulus were the highly represented GO terms.The oxidoreductase activity, glutathione transferase activity, jasmonic acid hydrolase, glutathione binding and oligopeptide binding were dominant GO terms in the MF group.
A directed acyclic graph was introduced to analyze the enriched GO terms in BP and MF groups.For the BP group(figure 10(a)), except the multi-organism process term, the other 9 enriched GO terms were all belong to response processes, including defense response, response to biotic stimulus, response to stress, response to an external stimulus,response to chemicals, response to external biotic stimulus,response to other organisms and defense response to other organism.Among the top-10 GO terms in the BP group,defense response was the most significantly enriched GO term.These results indicate that 1 min APCP treatment can be regarded as a stimulus or stress to regulate the expression of genes related to plant defense.With respect to the MF group(figure 10(b)), the top-10 GO terms were divided into three categories: catalytic activity (4 terms), transporter activity (1 term) and binding (5 terms).The GO terms in the binding category (oligopeptide binding, amide binding, modified amino acid binding and sulfur compound binding) were all associated with GSH binding.Among the ten enriched GO terms in the MF group, most of them were related to GSH metabolism and binding, indicating that 1 min APCP treatment had a significant effect on the expression of GSH-related genes, which was consistent with the KEGG pathway analysis.
3.8.qRT-PCR validation of DEGs in RNA-Seq analysis
To confirm the reproducibility and accuracy of DEGs identified by RNA-seq analysis,three genes associated with GSH metabolism(GSTF6,GSTF8 and ROXY3),two genes related to hormone metabolism (CYP735A2 and GA2ox8) and one gene related to plant defense(XND1)were selected for qRTPCR analysis.As represented in figure 11, the gene expressions between 1 min APCP-treated seedlings and the control by qRT-PCR and RNA-seq were compared.XND1, GSTF6 and GSTF8 were down-regulated DEGs in 1 min APCPtreated seedlings (figures 11(a)–(c)), and CYP735A2,GA2ox8 and ROXY3 were up-regulated DEGs(figures 11(d)–(f)),demonstrating that the expression patterns of these six genes obtained by qRT-PCR and RNA-Seq were consistent, which verified the validity of RNA-seq analysis for DEGs.After linear fitting of the different multiples obtained by the qRT-PCR and RNA-seq methods, a positive correlation coefficientrvalue is obtained as 0.84836(R2=0.7197) (figure A1), which also demonstrates that the RNA-seq results are reliable.
3.9.Chromosomal localization of DEGs
Next, the chromosomal localization of DEGs inArabidopsiswas also analyzed to further determine the APCP treatmentsensitive region of the chromosome.As reported in figure A2,chromosome 1 can be considered as the so-called hot spot,where DEGs frequently occurred,indicating that chromosome 1 is more sensitive to APCP treatment,which may be a stressresponse hot spot of APCP treatment.
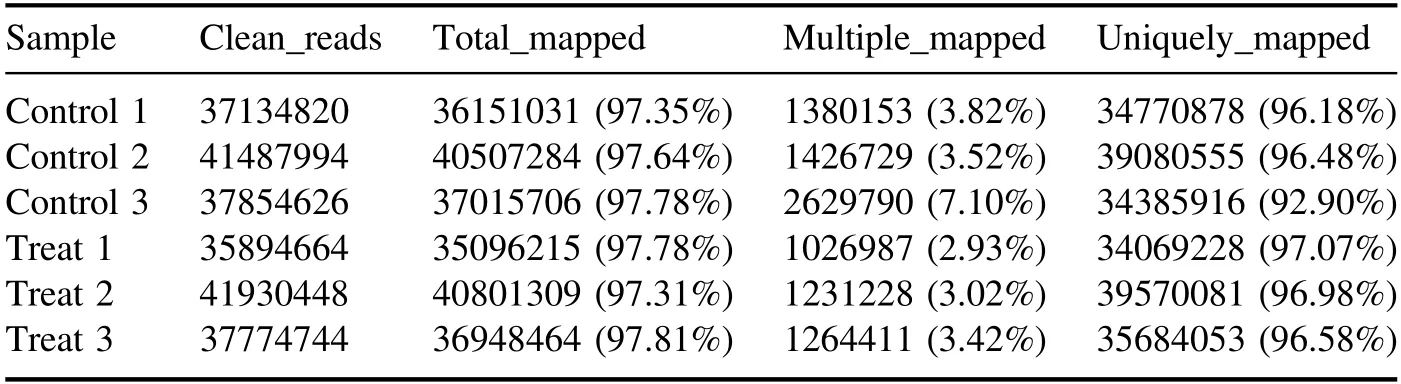
Table A3.The software HISAT2 was used to match the filtered reads to the reference genome.
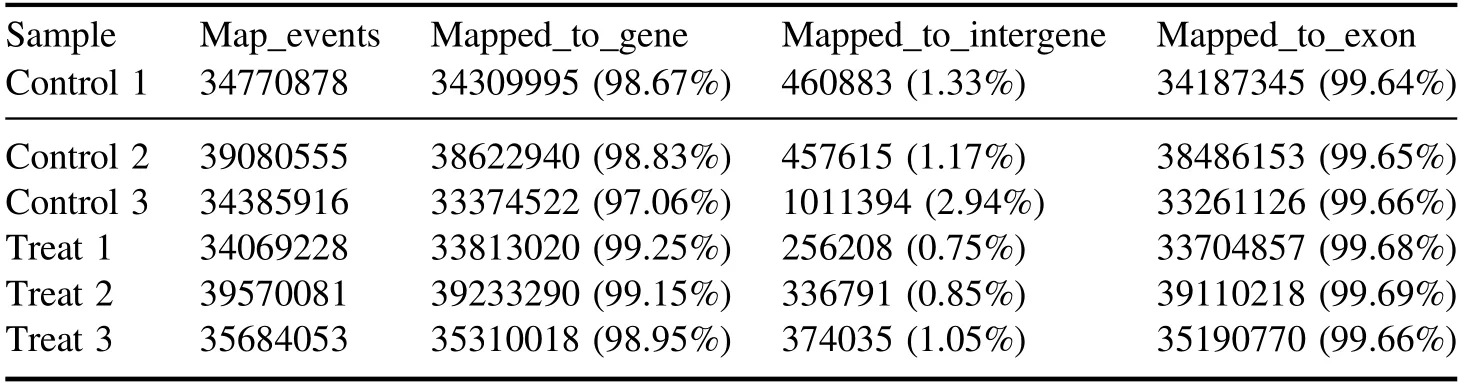
Table A4.Statistical distribution of reads that will be matched to genomes.
4.Discussion
In the past few decades,with the increasing world population and decreasing food sources, new technologies are urgently needed to promote agricultural production.APCP holds great potentials to solve the problem of food shortage via decontaminating seeds, increasing seed germination and seedling growth,improving crop yields and controlling plant diseases,thereby attracting much attention from scientists in agriculture and plant science[41,42].Although the stimulatory effects of APCP on plant growth are undisputed, the molecular mechanisms are still not fully understood.RNA-Seq is an efficient and widely-used approach to understand complex biological phenomena.Therefore, the comparative transcriptome analysis ofArabidopsisseedlings between APCP treatment and the control was performed by RNA-Seq in this study.
Growth data showed that APCP treatment differentially affected theArabidopsisseedling growth in a dose-dependent manner.The short-term APCP treatment (0.5, 1, and 3 min)improved the growth of seedlings, while long-term APCP treatment (5 and 10 min) inhibited the growth of seedlings(figures 2 and 3).This phenomenon is not entirely new.The similar stimulating effects induced by APCP have also been reported in a variety of plants, such asCatharanthus roseusandBrassica napus L.[43, 44].Interestingly, besides increasing the root length,fresh weight and dry weight,APCP could also enhance lateral root formation (figure 2(c)),which may improve the plant stress tolerance due to the fact that the branched root system of higher plants plays a crucial role in the growth and survival of the whole plant [45] and the modulation of root branching provides enhanced root structure plasticity in response to adverse environment [46–48].Moreover,the present results also showed that the stimulatory effects of APCP on plant growth still remained after a longer cultivation period (28 d) (figure 3), indicating that APCP has long-term positive effects on plant growth.The long-term stimulatory effects of APCP treatment on plants have also been observed previously, which was most likely due to ROS-triggered induction of cellular responses and higher enzymatic activity [49].
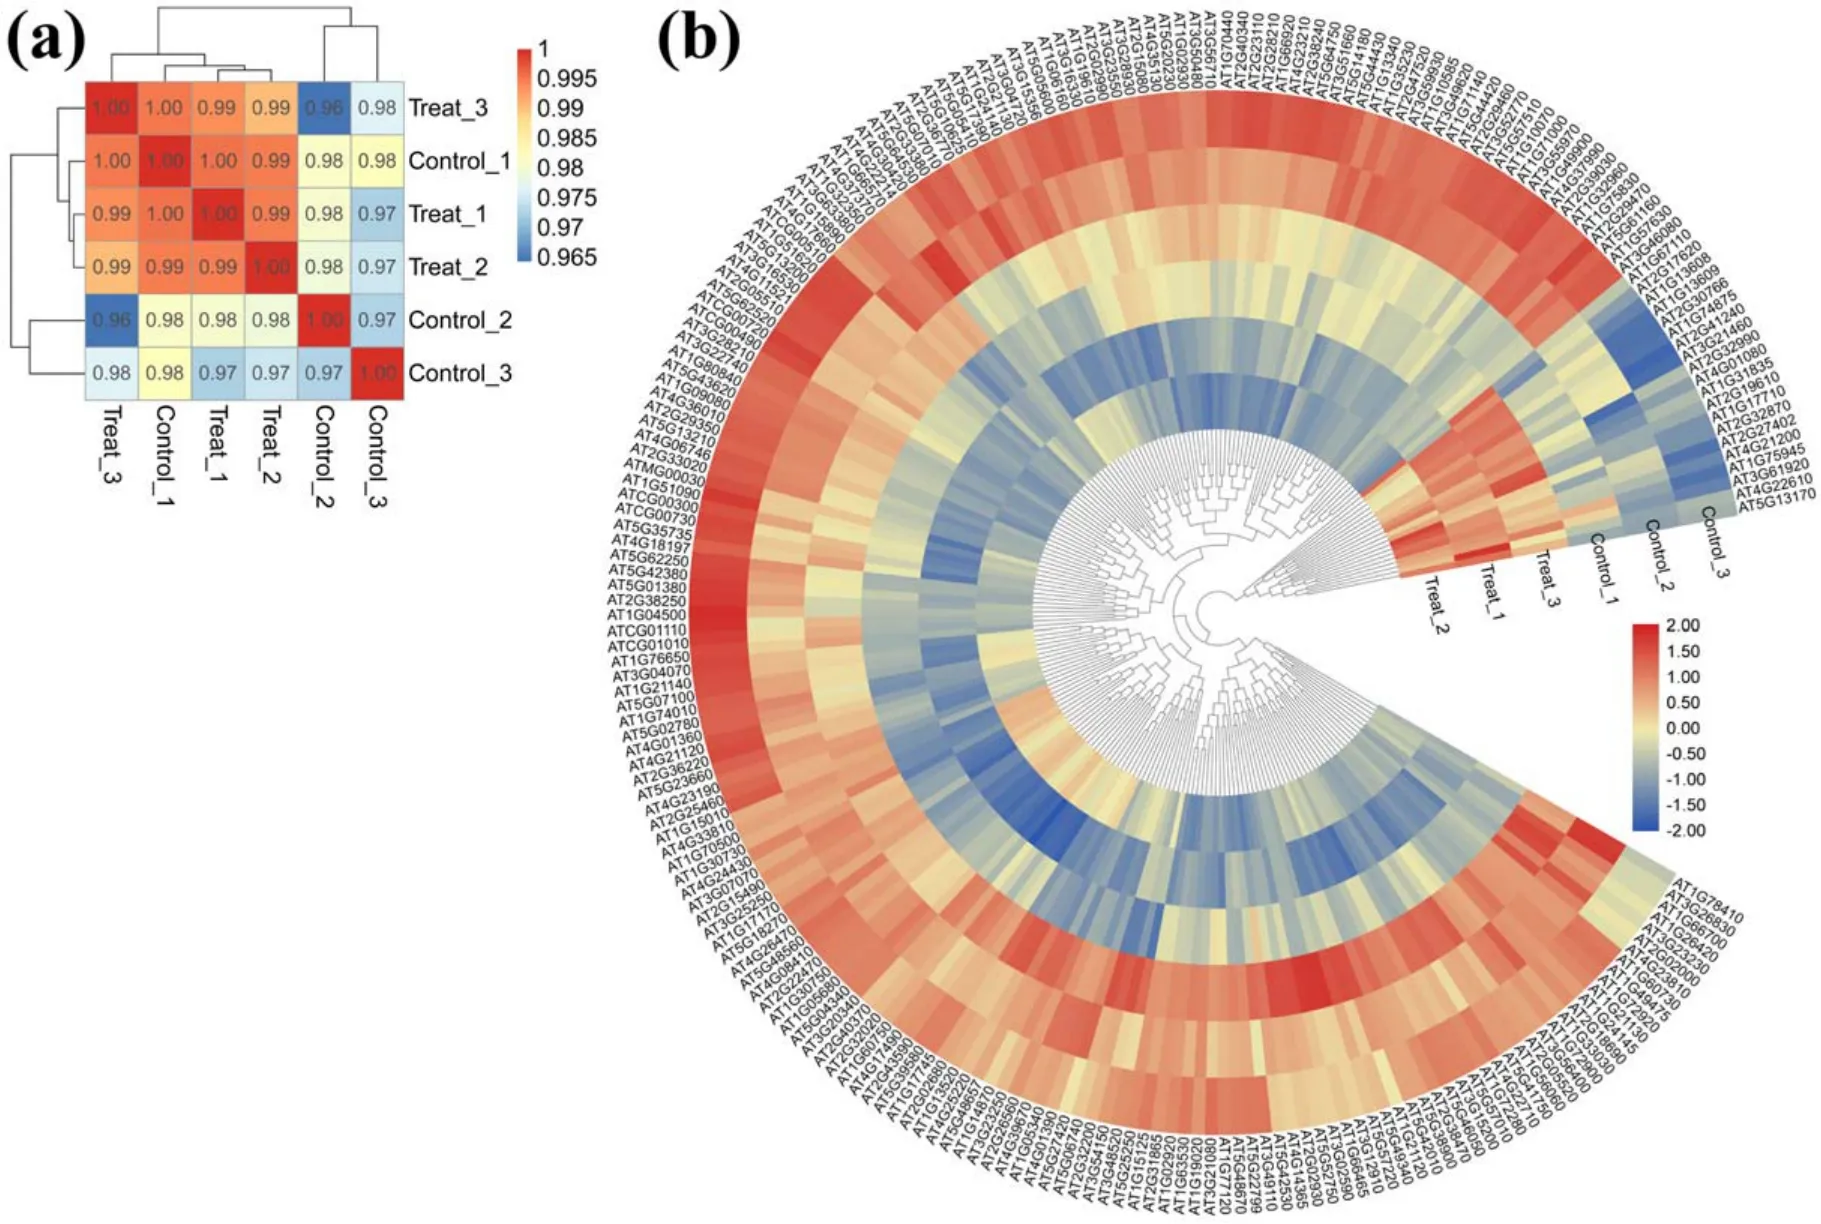
Figure 7.Similarity profile of expression patterns between samples and the heat map of all DEGs in 1 min APCP-treated seedlings and control.(a) Pearson’s correlation coefficient was used to indicate the correlation of gene expression levels between samples.In general,correlation coefficients between 0.8 and 1 are extremely strong correlations.If the correlation coefficient between biological replicates is less than 0.8,it indicates a low correlation between samples.(b)The heat map and clustering results of DEGs demonstrate the expression patterns of DEGs under different experimental conditions.Red and blue on the heat map indicates up-regulated and down-regulated genes,respectively.Every group has three replicates, namely Control-1, Control-2, Control-3, Treat-1, Treat-2 and Treat-3.
High amino acids biosynthetic activity has been found in seedlings previously, resulting in the high concentrations of free protein amino acids which support the synthesis of proteins and plant development[50].The determination of amino acid metabolism (figure 4) showed that Glu was the most abundant amino acid among eighteen amino acids and GABA both in APCP-treatedArabidopsisseedlings and the control,indicating that Glu plays important roles during the early seedling growth and development inArabidopsis.The N in Glu can be transferred to a wide variety of amino acids,nucleic acids [51], ureides [52] and polyamines [53].Aminotransferases in plants prefer using Glu and the corresponding keto-acid 2-oxoglutarate in transamination reactions.More importantly, given the fact that the amino acids and their derivatives are used for the synthesis of new proteins,which can be used as metabolic intermediates or supply energy for seedlings growth [54], it is speculated that theArabidopsisseedlings under APCP treatment may need much more free amino acids to synthesize proteins or other metabolites essential forArabidopsisgrowth (figures 2 and 3),which led to the final decease of most amino acid level in APCP-treatedArabidopsisseedlings (figure 4).
Previous researchers have identified that GSH metabolism is involved in diverse functions, including the induction of antioxidant defenses, regulation of signaling pathways,enzyme activity, gene expression and transport of phytohormone or other endogenous compounds [55, 56].GR recycles the G-S-S-G back into its active reduced form G-S-H[56].GST catalyzes the conjugation of electrophilic compounds to G-S-H and targets them for storage in vacuoles or apoplast [57].In addition, specific GSTs are reported to be induced upon infection, in response to treatment with G-S-H[57].APCP treatment stimulated a defense response through enhancing GR activities to maintain the G-S-H concentration.Meanwhile, APCP treatment decreased the accumulation of G-S-S-G, keeping the G-S-H/G-S-S-G ratio higher than that in control.Maintaining the G-S-H/G-S-S-G ratio at a high level indicates that plant responsiveness to APCP will be improved,which was similar to the results reported by Wanget alon ochratoxin A [58].
In addition to GSH metabolism, phytohormone metabolism was also emphasized as another major metabolic pathway for plant growth.Generally, gibberellins and auxin together promote cell elongation.Cytokinin plays a dominant role in improving the cell numbers, volume enlargement and nitrogen availability [59, 60].As shown in figure 6, GA1,GA3, zeatin, and TZR concentrations of 1 min APCP-treated seedlings were obviously much higher than those of the control.The accumulation of gibberellins and cytokinin indicates that the superior growth of APCP-treated seedlings compared with the control was related to the enrichment of plant phytohormones.
Cluster analysis showed that there was only a small amount of DEGs between the 1 min APCP-treated seedlings and the control (figure 7(b)), indicating that 1 min APCP treatment was a relatively mild treatment dose, which can only cause minor transcriptional changes.KEGG pathway analysis revealed that the majority of DEGs were involved in the GSH metabolism in response to 1 min APCP treatment(figure 8).The result was in agreement with the G-S-Haccumulation inArabidopsisseedlings, demonstrating a significant difference between APCP-treated seedlings and control(figure 5).Previous research has identified that APCP treatment produces a large amount of RONS and GSH is an important substance to remove RONS [13, 61].Numerous studies have reported that APCP could activate the antioxidative defense system in cells, consequently leading to a positive effect on plant growth [62–64].In this study, RNAseq analysis showed that ROXY3 related to GSH was significantly up-regulated after APCP treatment,which was also verified by qRT-PCR(figure 11(f)).The results suggested that ROXY3 may play an essential role in APCP-enhanced seedling growth inArabidopsis thalianaby relieving APCPinduced oxidative stress.
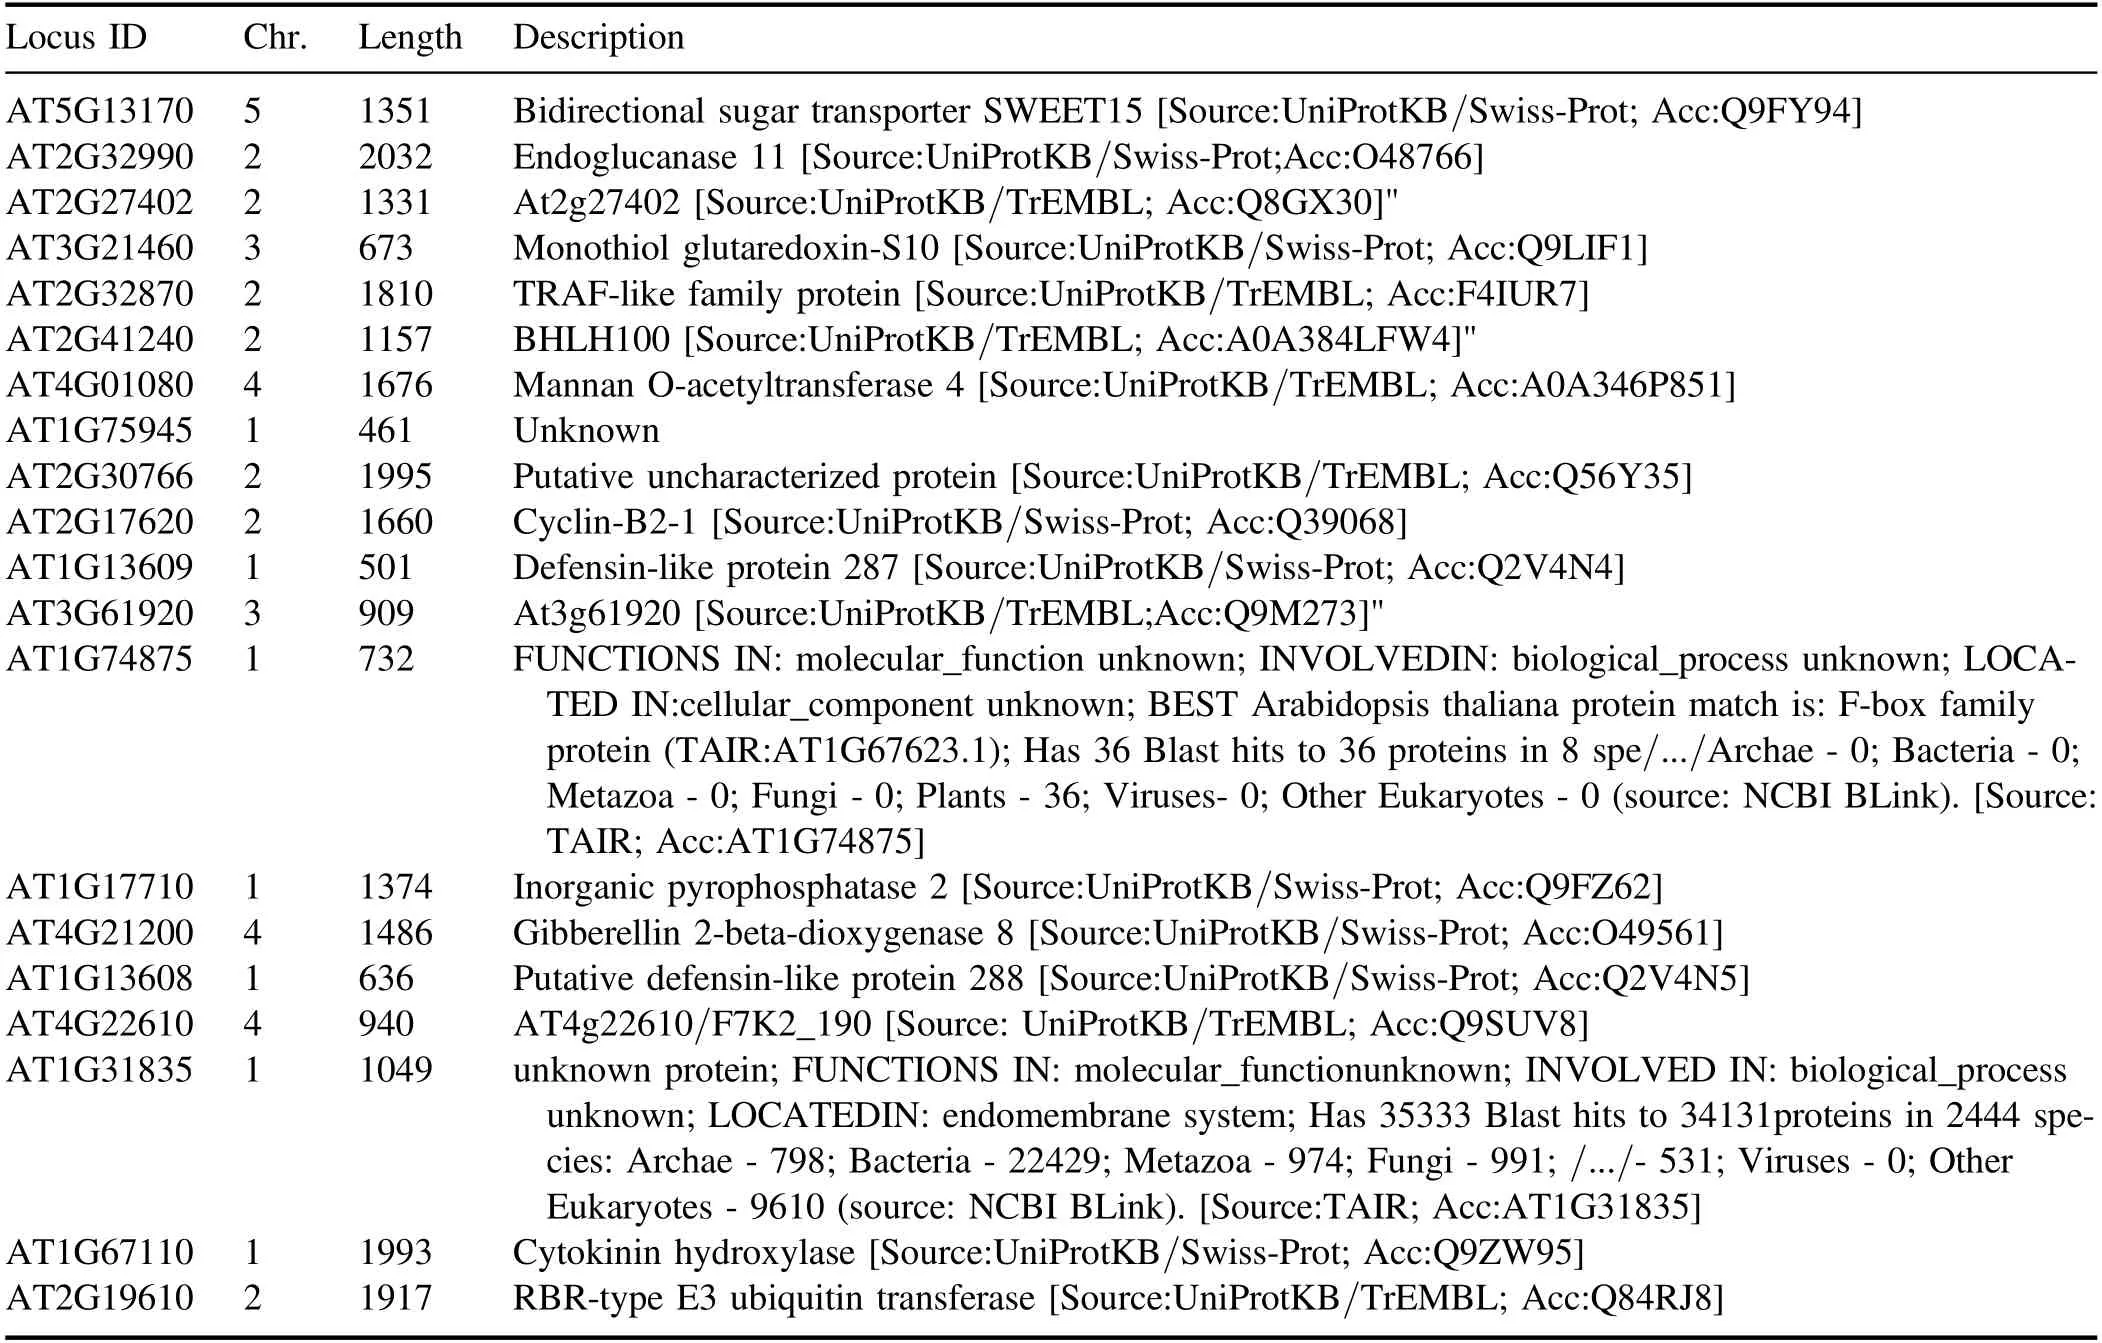
Table A5.Chromosome location and function description of the up-regulated DEGs in APCP-treated seedlings compared with control, the Uniprot was used to announce the function of DEGs.
GSTF3 (AT2G02930), GSTU24 (AT1G17170), GSTL1(AT5G02780),GSTU3(AT2G29470),GSTF6(AT1G02930), GSTF8 (AT1G02920) and GSTU4(AT2G29460) encoded GSTs, which are a ubiquitous family of multifunctional enzymes not only playing important roles in detoxification reactions but also functioning as GSH peroxidases in responding to oxidative stress [65, 66].RNA-seq analysis demonstrated that all the seven genes were downregulated in APCP-treated seedlings (table A6) and the expression patterns of GSTF6 and GSTF8 were also verified by qRT-PCR (figures 11(b), (c)).Moreover, the transcriptional results were consistent with GR activity determination,which exhibited a decreased activity after 1 min APCP treatment (figure 5).However, the expression of GSH synthetic genes was not activated by 1 min APCP treatment in this study, which may be due to the following two reasons.One is that GSTs might not be involved in APCP-induced oxidative stress response; the other is that 1 min APCP treatment only caused slight oxidative stress, which was not enough to induce GSTs.
MAPK signaling pathway-plant was also a highly DEGsenriched pathway by KEGG analysis (figure 8).Numerous studies have shown that the MAPK mediates signal transduction through phosphorylation of other signaling pathway proteins and is involved in a variety of biological processes such as hormone metabolism, plant defense responses to biotic and abiotic stresses, and plant immunity in plants[67–69].Recent studies have reported that the H2O2and NO in plasma-activated water (PAW) can act as the signaling molecules to induce pathogenesis-related expression of proteins,antioxidant enzymatic activities,salicylic acid(SA)and jasmonic acid (JA) pathway enzymes in tomato seedlings through the MAPK signaling pathway, resulting in an improved plant growth and defense [20].In this study, there were five DEGs (WRKY33 (AT2G38470), PAD3(AT3G26830),OXI1(AT3G25250),PDF1.2 A(AT5G44420) and PDF1.2 C (AT5G44430)) belonging to MAPK signaling pathway-plant.The result suggested that MAPK signaling pathway may be involved in the enhancedArabidopsisgrowth by APCP.
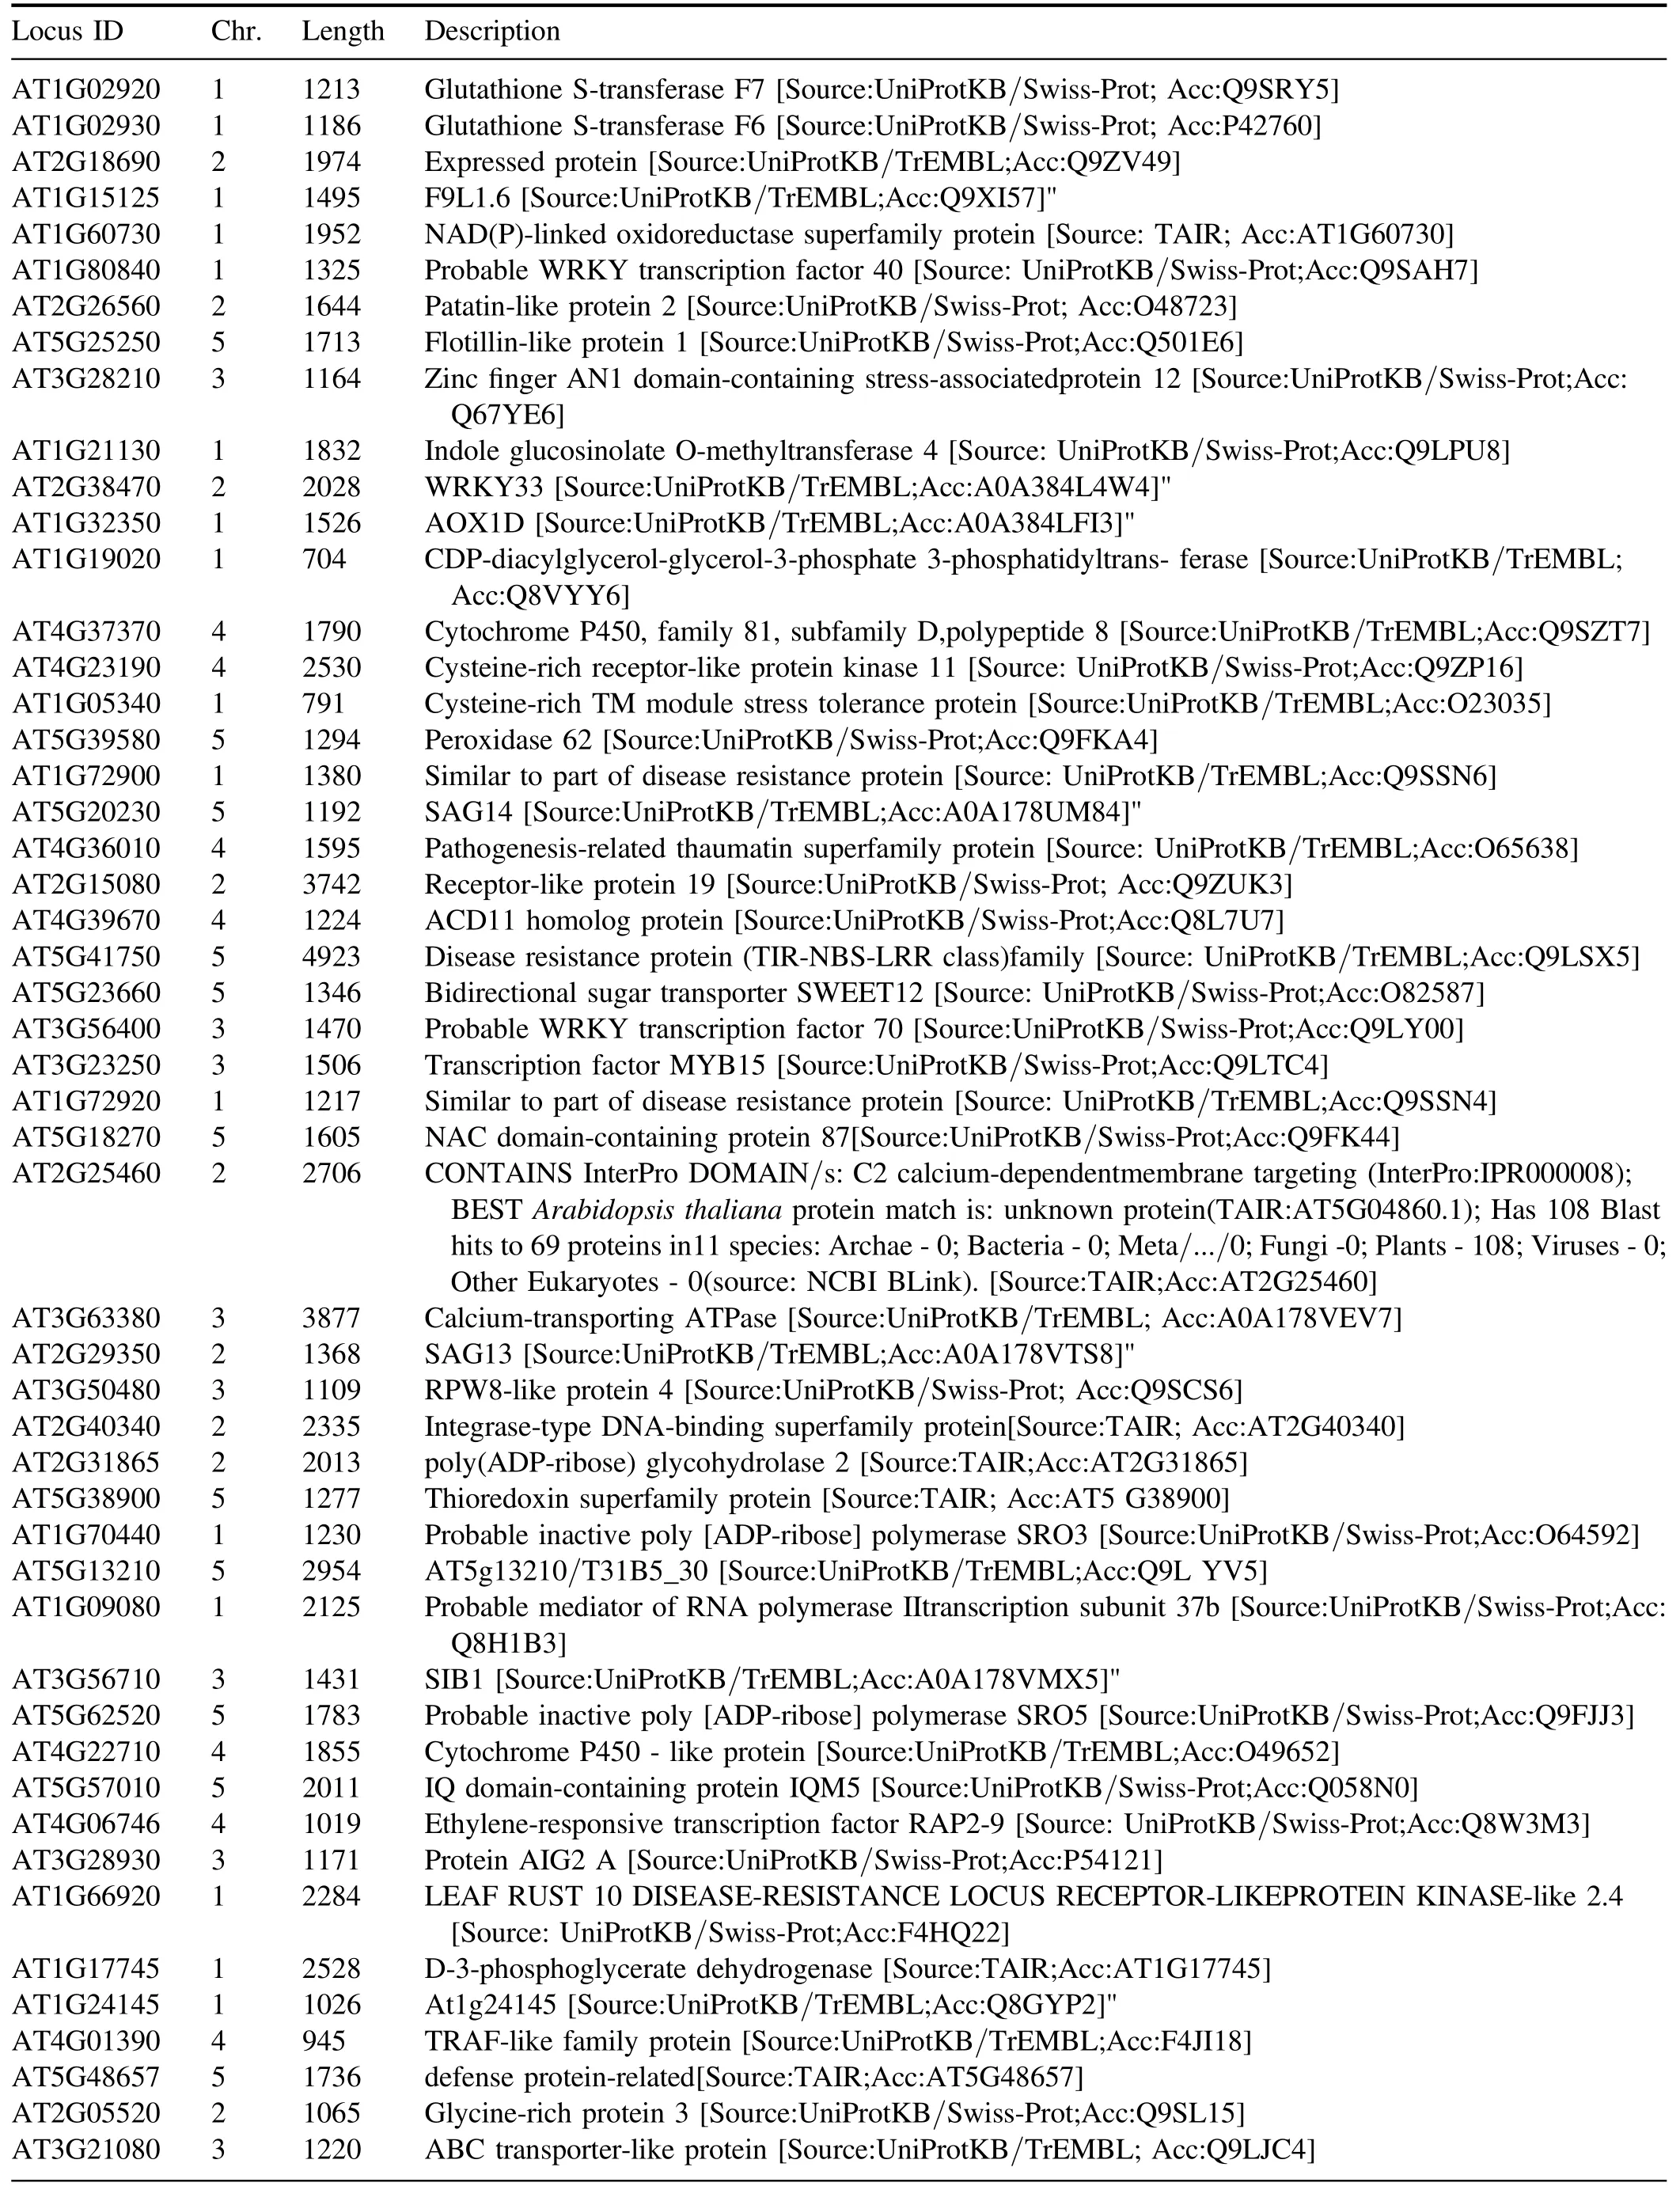
Table A6.Chromosome location and function description of the down-regulated DEGs in APCP-treated seedlings compared with control,the Uniprot was used to announce the function of DEGs.
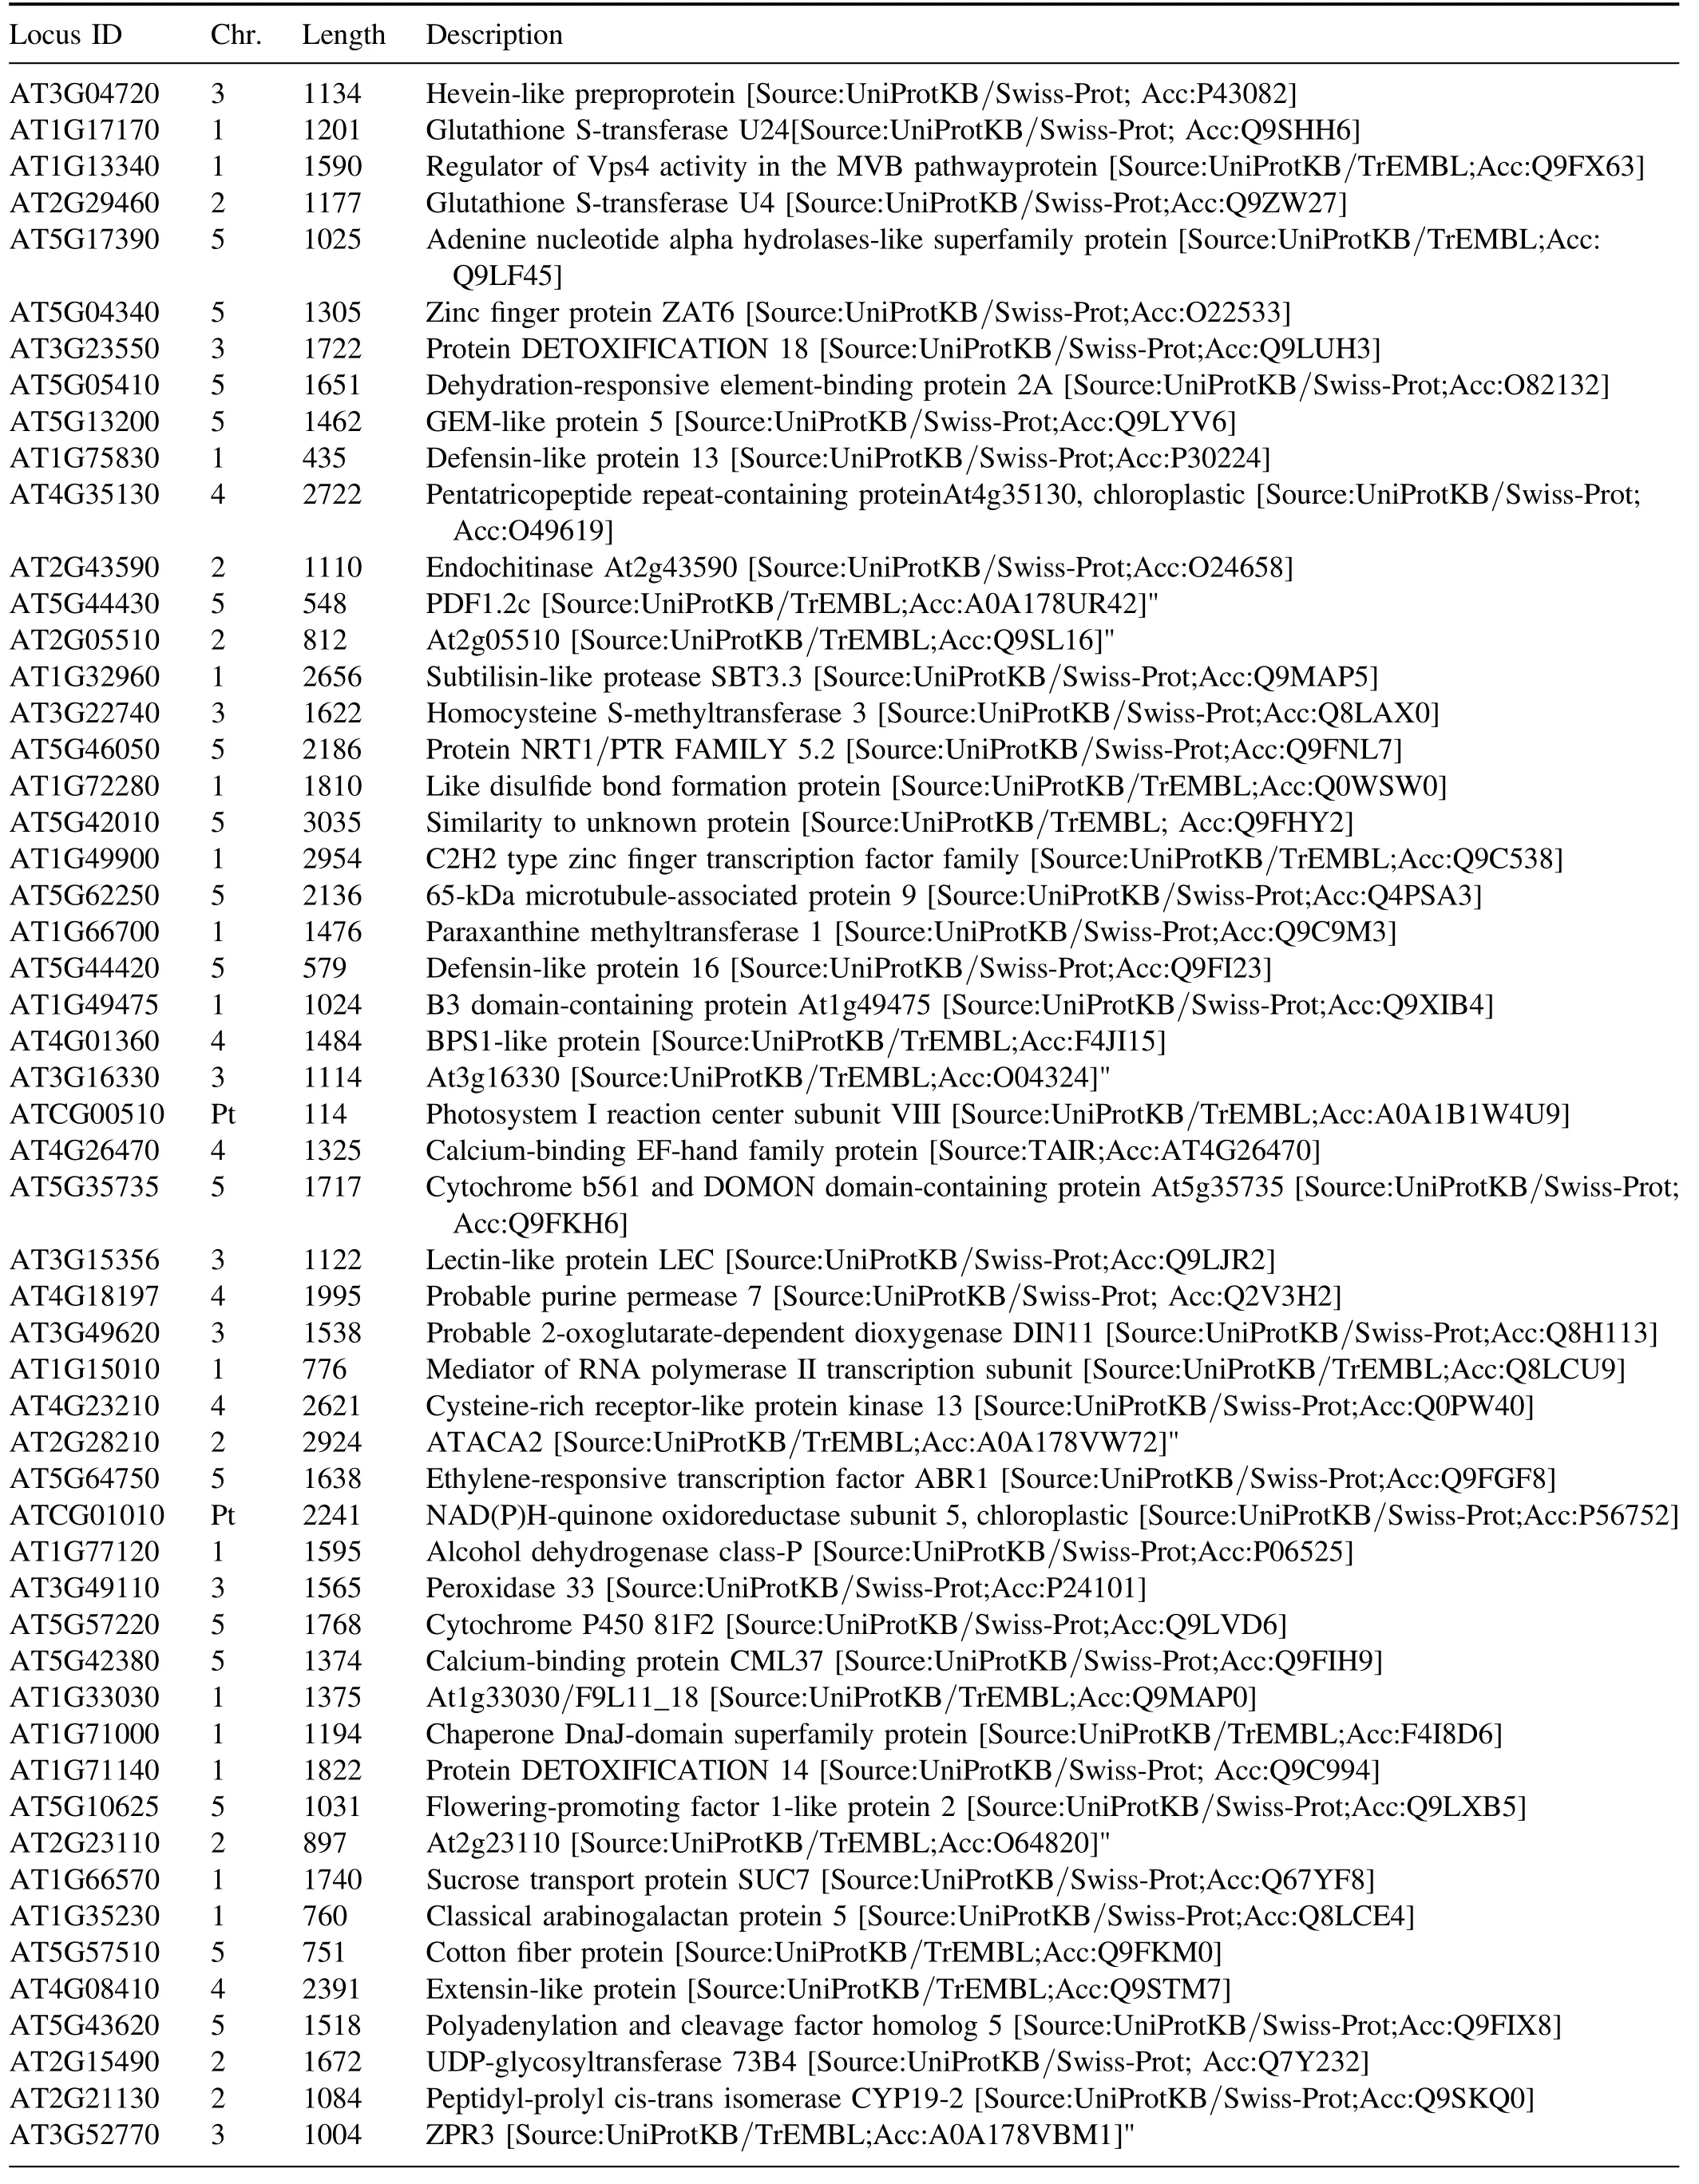
Table A6.(Continued.)
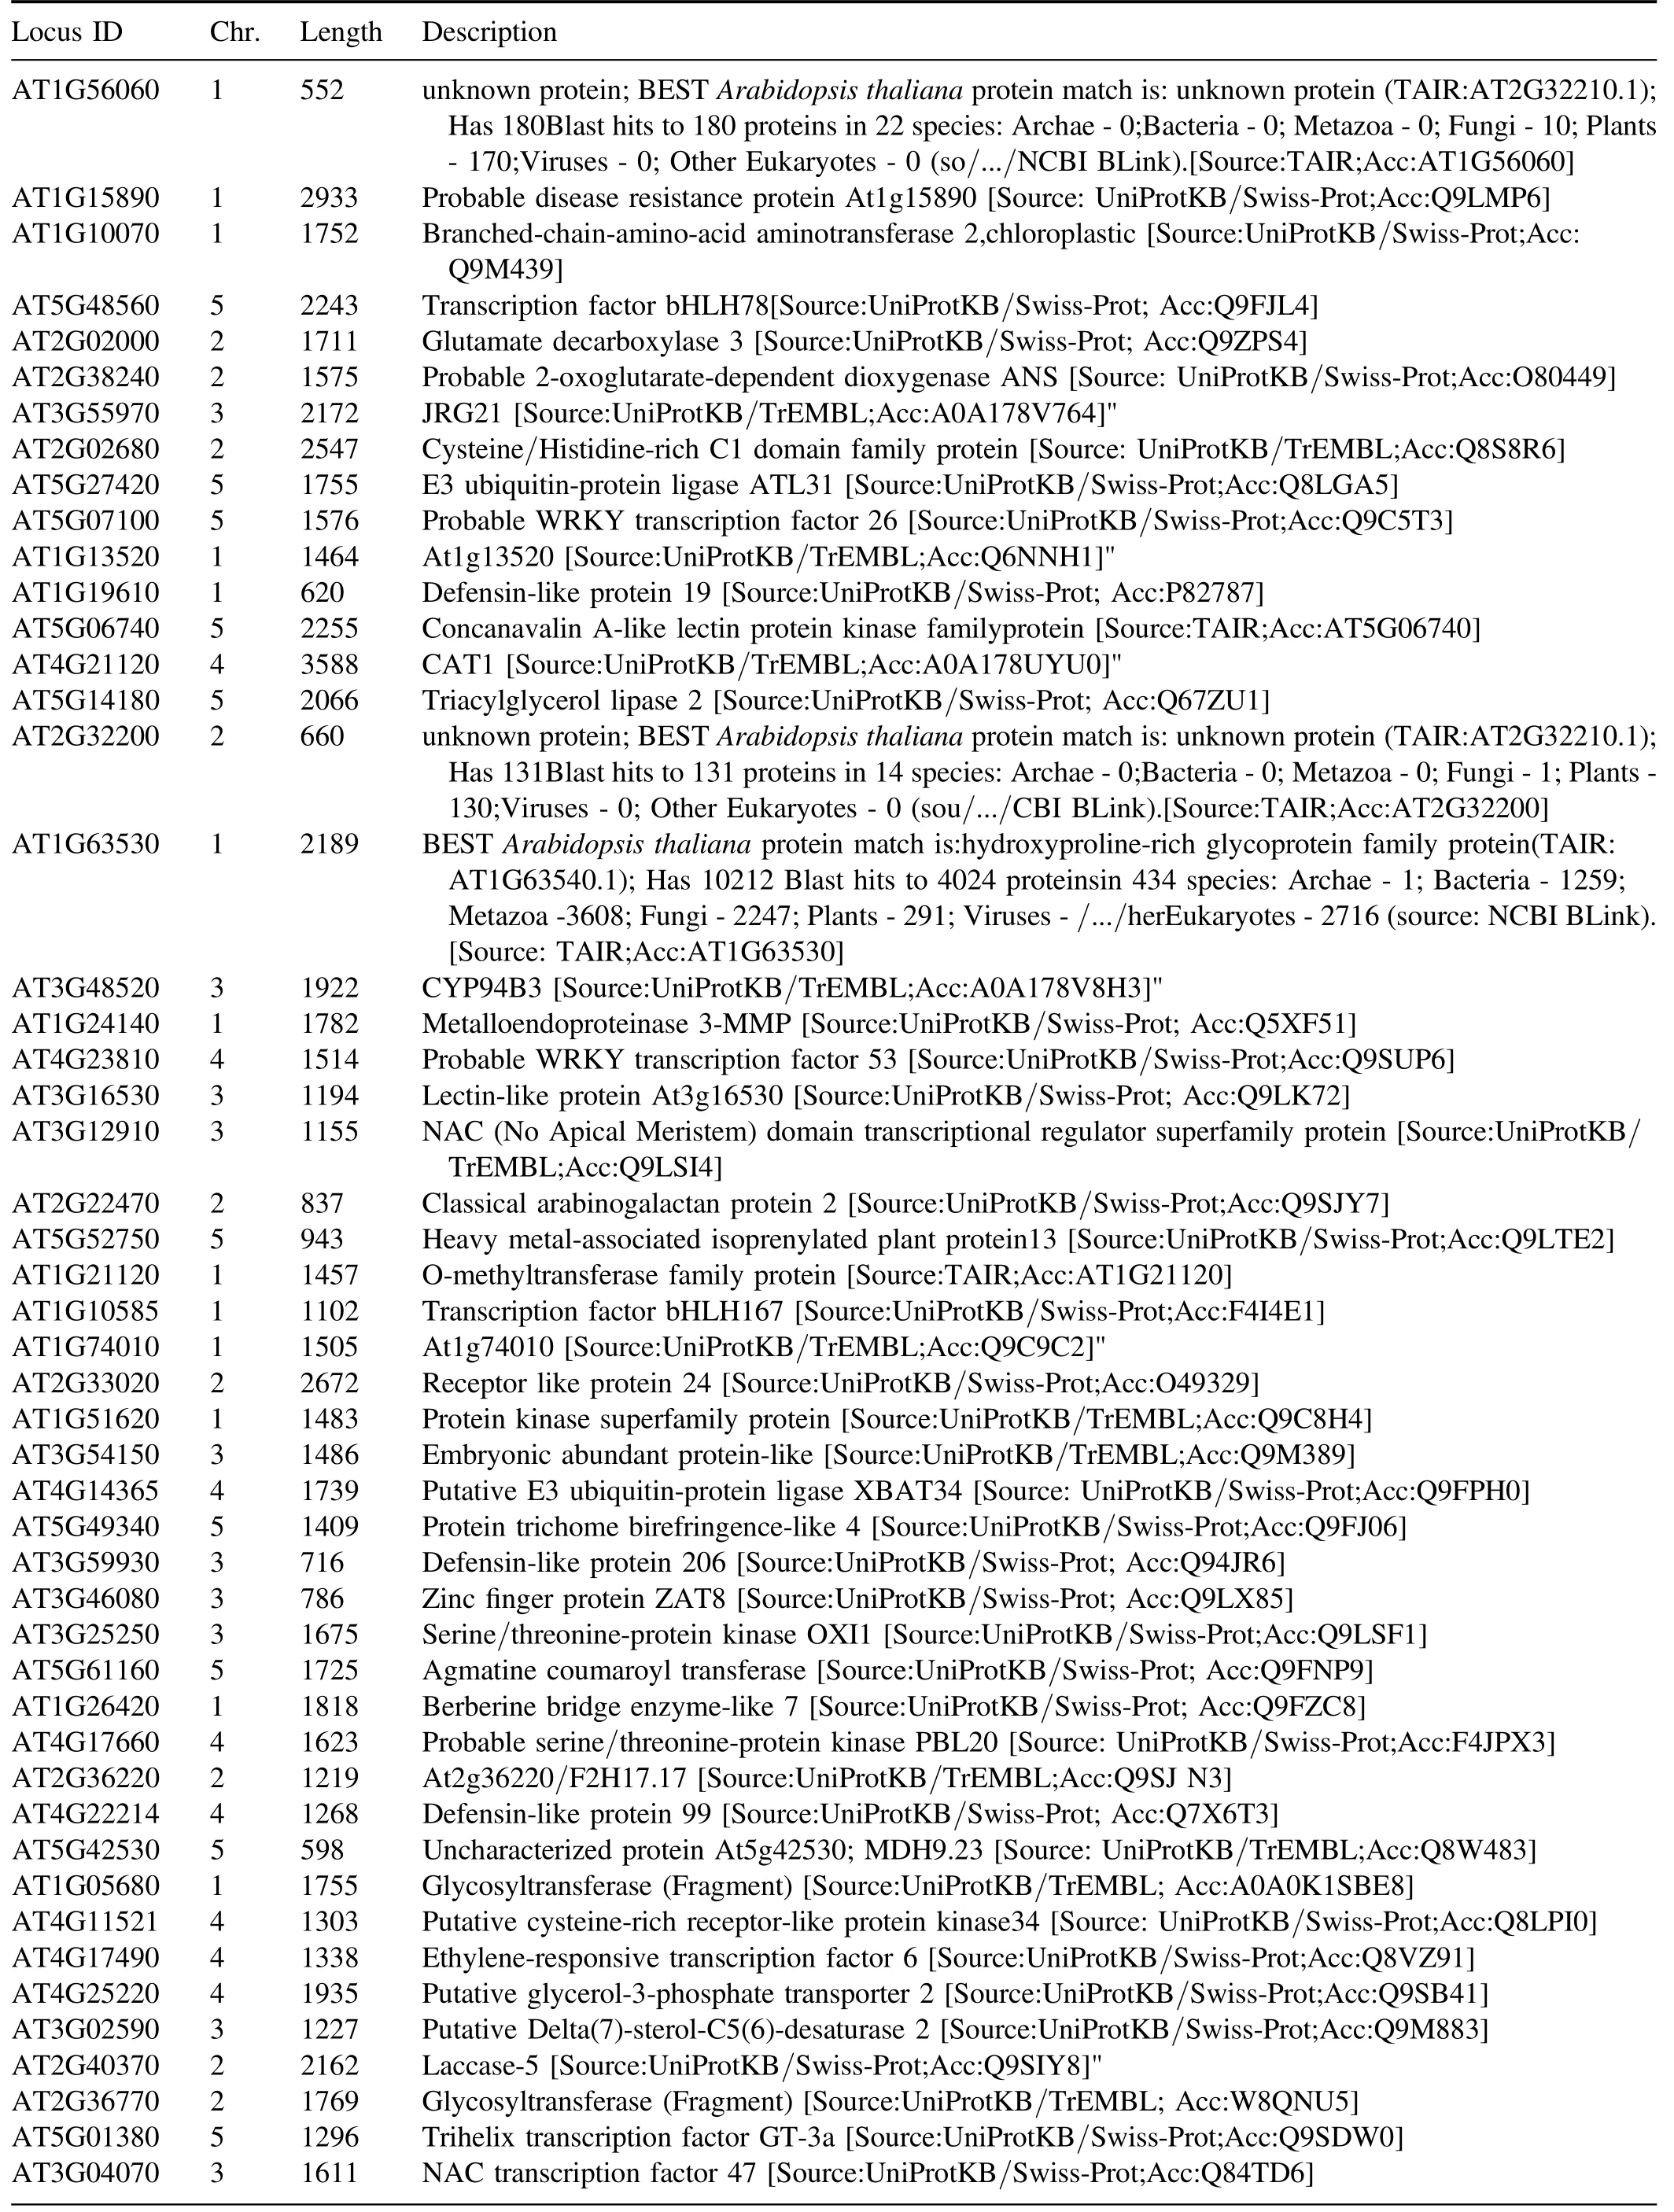
Table A6.(Continued.)
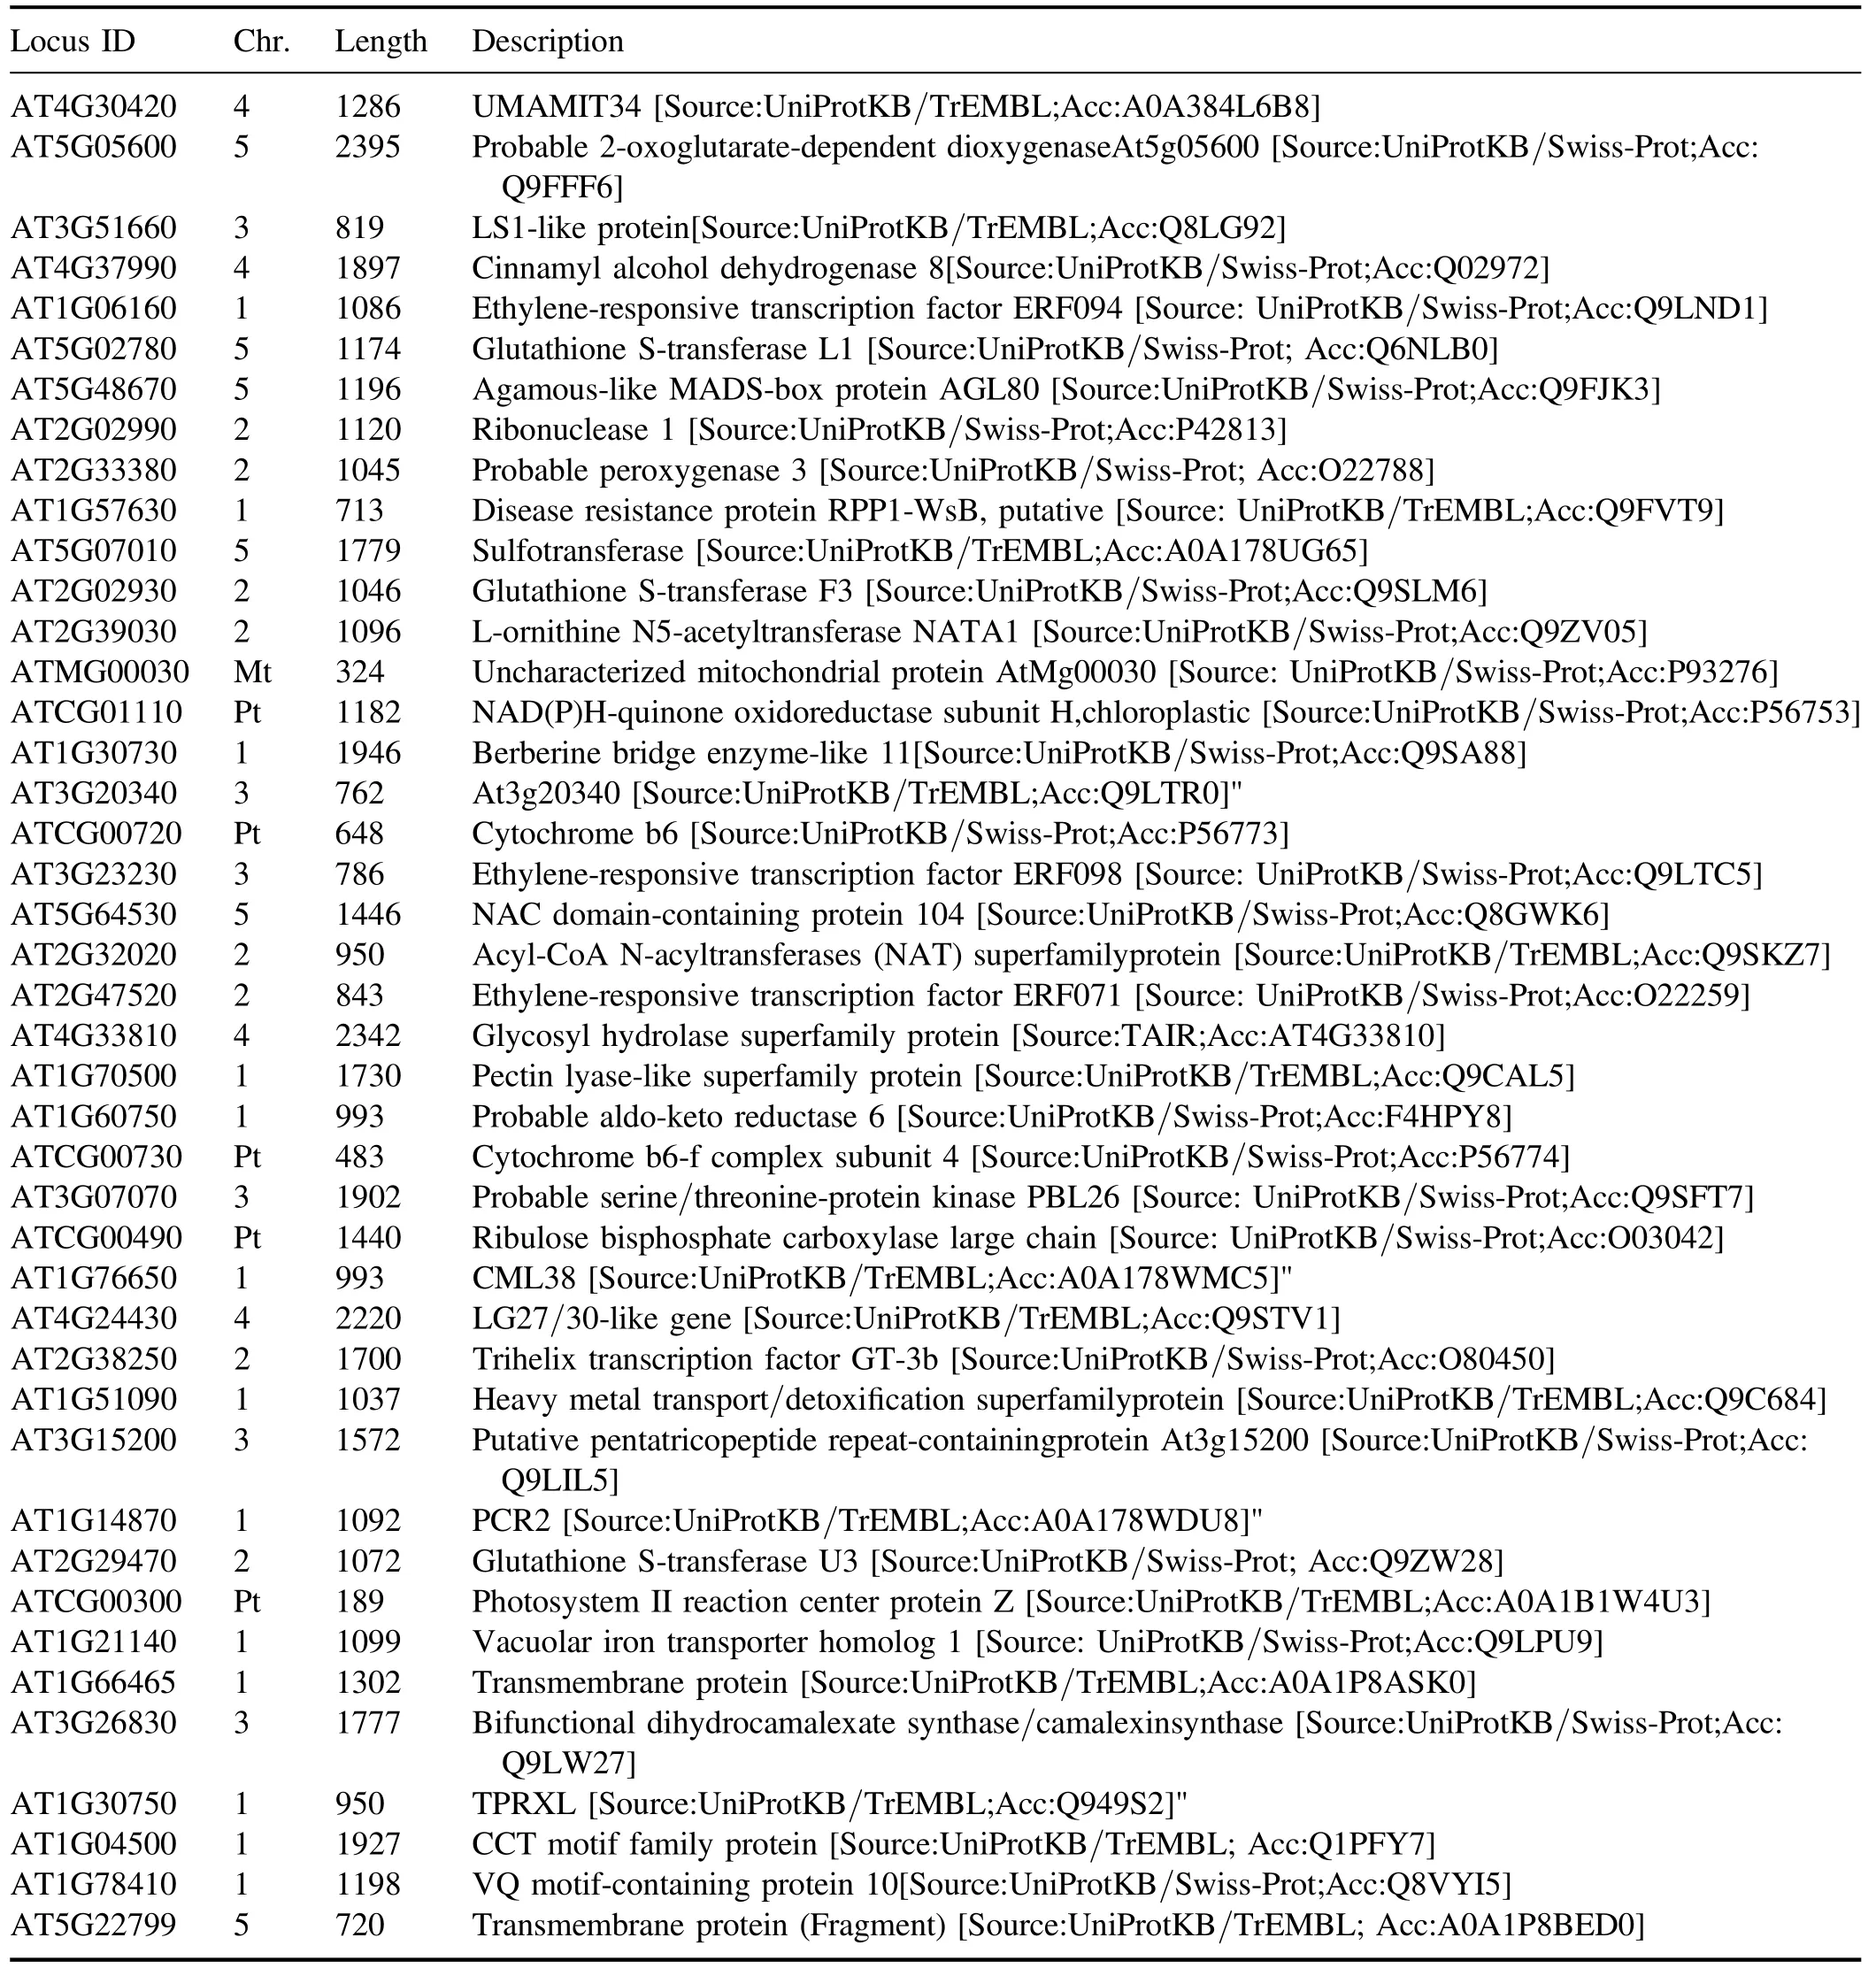
Table A6.(Continued.)
Phytohormones regulate various developmental, metabolic, and defense mechanisms of plants.Recently, several studies have identified that the RONS (especially H2O2and NO) generated by APCP could regulate phytohormone synthesis, accordingly affecting seed germination, plant growth, development and stress resistance [20, 70].We also observed that two enriched pathways were related to phytohormone synthesis,namely zeatin(cytokinin)and diterpenoid(GA) biosynthesis pathway (figure 8), which was consistent with the previous researches.CYP735A2 is one of the cytokinin trans-hydroxylase CYP735A-encoding genes responsible for the production of trans-zeatin-type (tZ-type)cytokinin,which is specifically expressed in the root[71,72].Our results demonstrated that CYP735A2 was significantly up-regulated after 1 min APCP treatment, which was consistent with the results of TZR and zeatin concentrations determination (figure 6) and qRT-PCR analysis (figure 11).Given that CYP735A holds potentials for crop improvement due to the findings that increased expression of CYP735A orthologs could enhance shoot growth without reducing root growth [73], it suggested that CYP735A may also be involved in the growth improvement ofArabidopsisseedlings considering the root phenotype.Furthermore, 1 min APCP treatment also enhanced the gene expression of GA2ox8(figure 7), which belongs to the diterpenoid biosynthesis pathway.The transcriptional results were consistent with the accumulation of GA1 and GA3 in APCP-treatedArabidopsisseedlings (figure 6).GA2ox8 encodes a protein with gibberellin 2-oxidase activity which acts specifically on C-20 GAs[74].Multiple studies have shown that GA2ox-mediated GA catabolism could be targeted to improve plant resistance to abiotic and biotic stress in a variety of crop plants, such as rice [75, 76], switchgrass (Panicum virgatum L.) [77], and breadfruit(Artocarpus altilis)[78].Additionally,there were a large number of down-regulated DEGs related to ethylene synthesis(AT5G64750,AT4G06746,AT2G47520,AT2G05520, AT3G15356, AT5G07100, AT3G04070,AT1G06160 and AT3G23230).As a negative regulator of plant growth, ethylene is known to promote leaf senescence,flower and fruit abscission in plants.Thus,the transcriptional results of ethylene synthesis were consistent with the observation of promoting seedling growth.Conversely, JA is a positive regulator of plant growth, whose degradation genes(AT2G38240,AT5G05600,AT3G48520,AT2G02990)were significantly down-regulated by APCP treatment.These findings indicate that the genes related to phytohormones metabolism may play important roles in 1 min APCP-induced stimulatory effects onArabidopsisseedling growth.
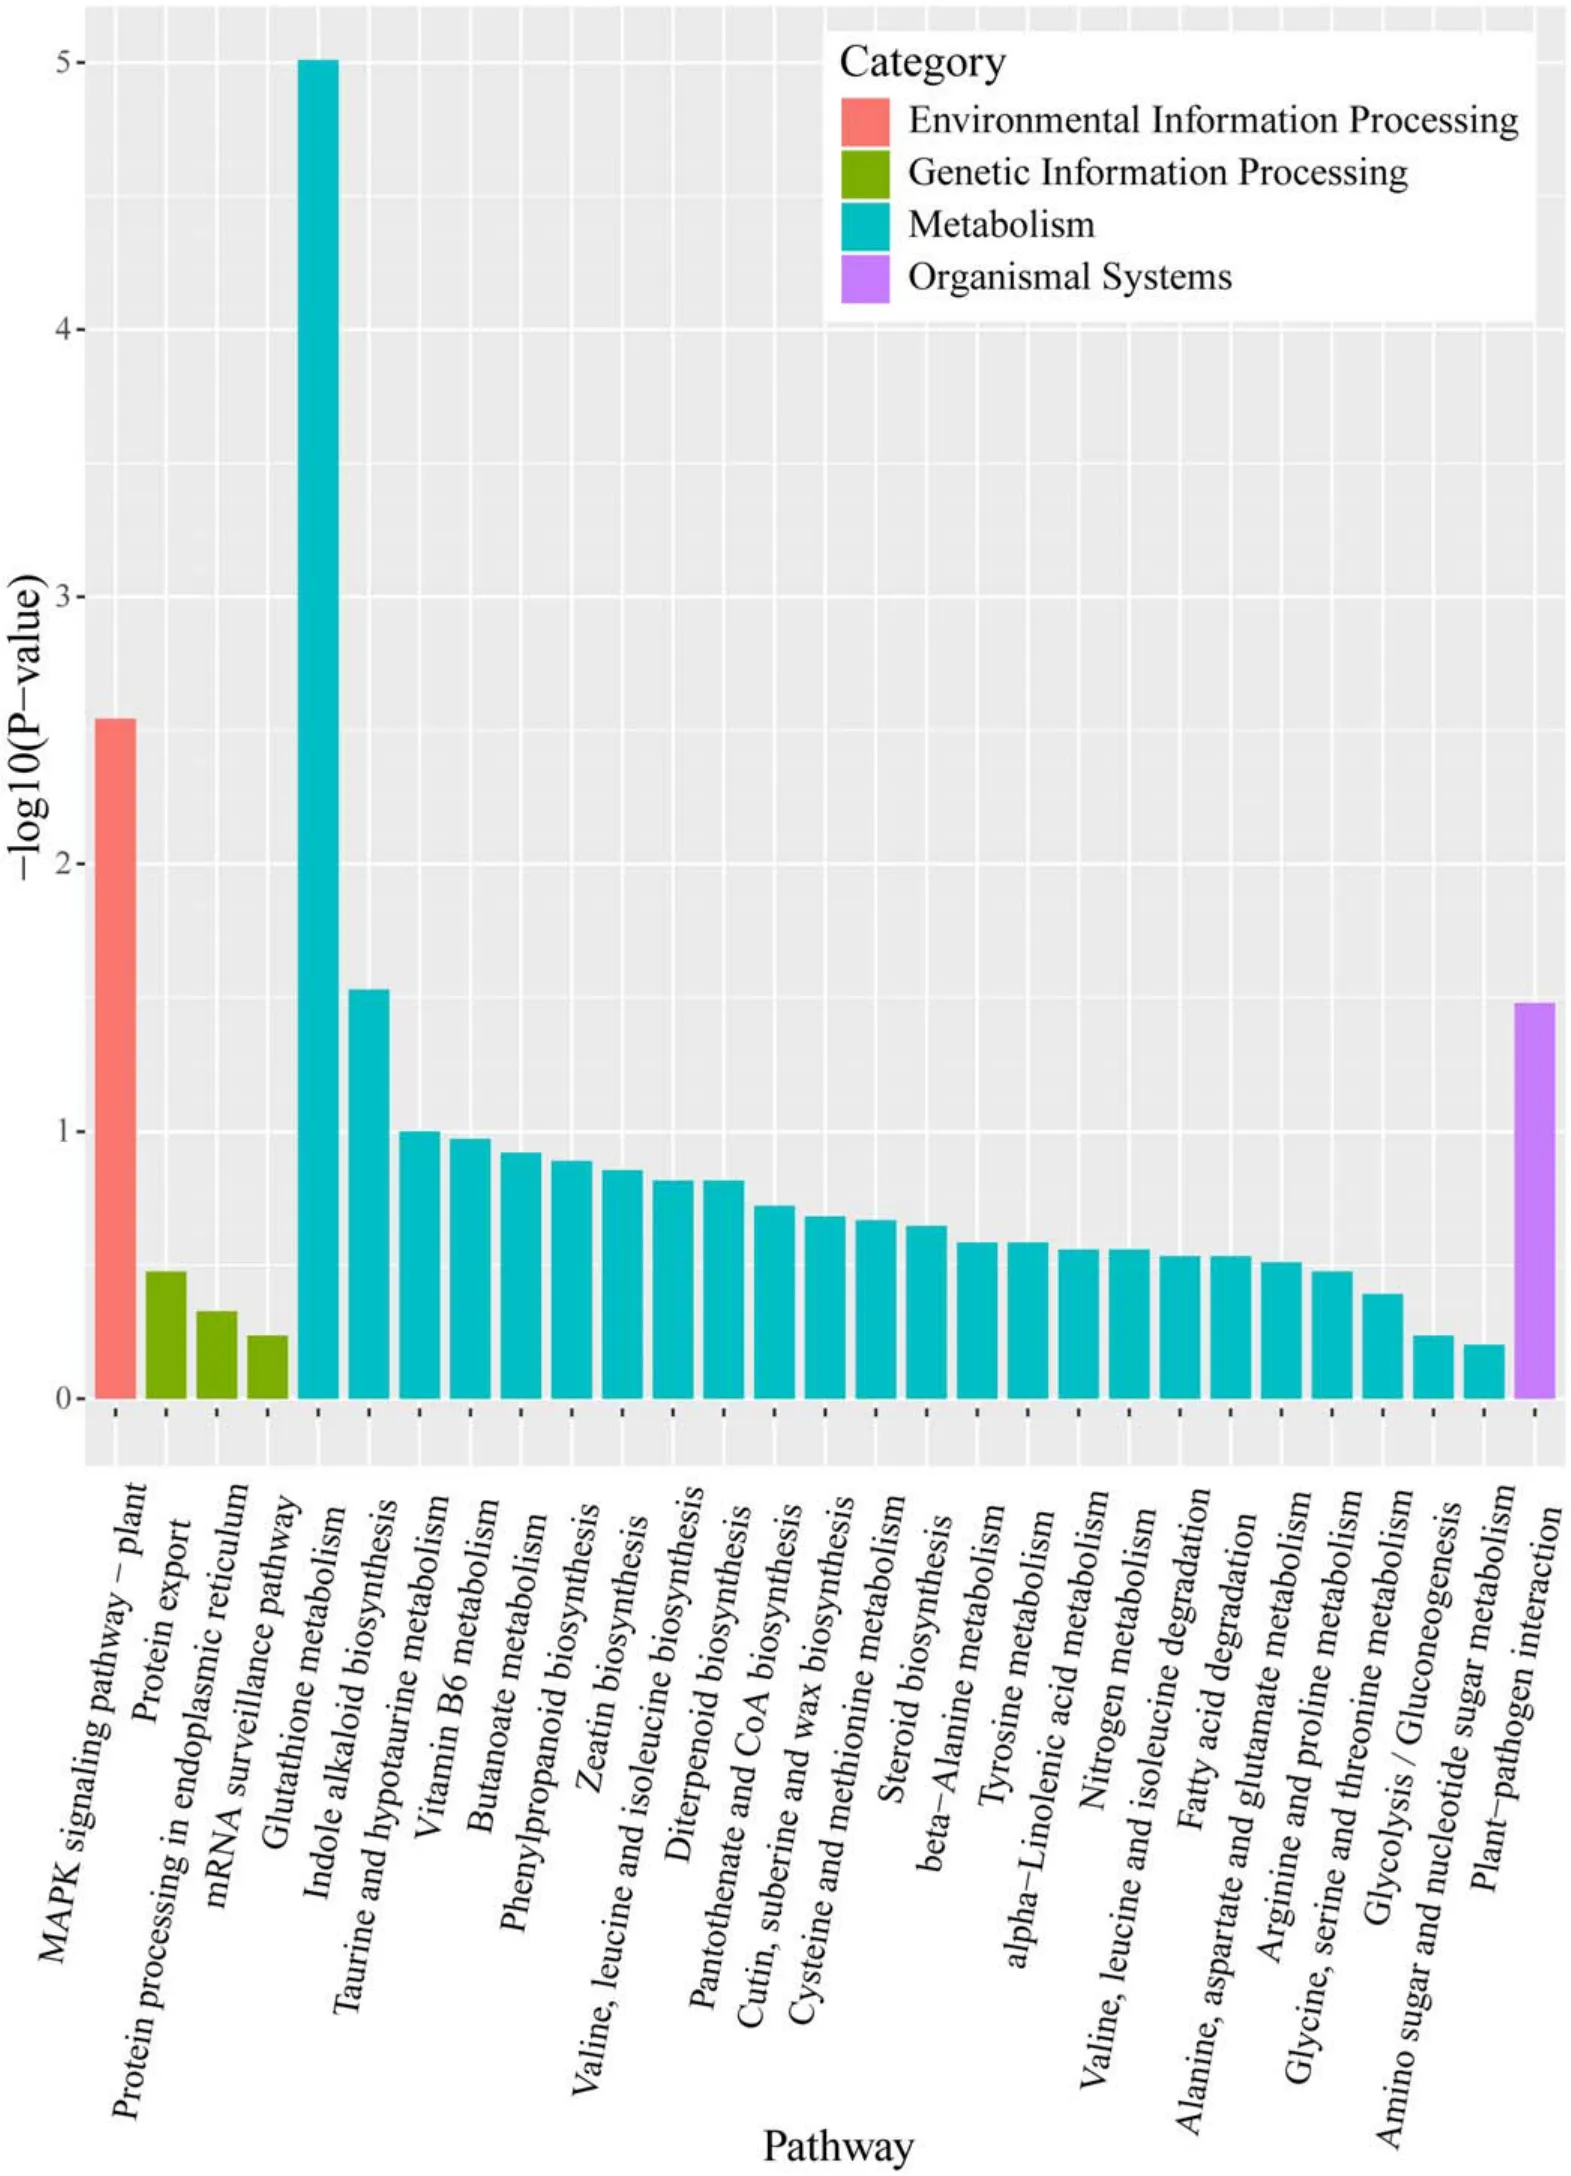
Figure 8.KEGG pathway classification.The KEGG pathways were categorized into environmental information processing, genetic information processing, metabolism and organismal systems.KEGG pathways were sorted based on −log10 (P-value).
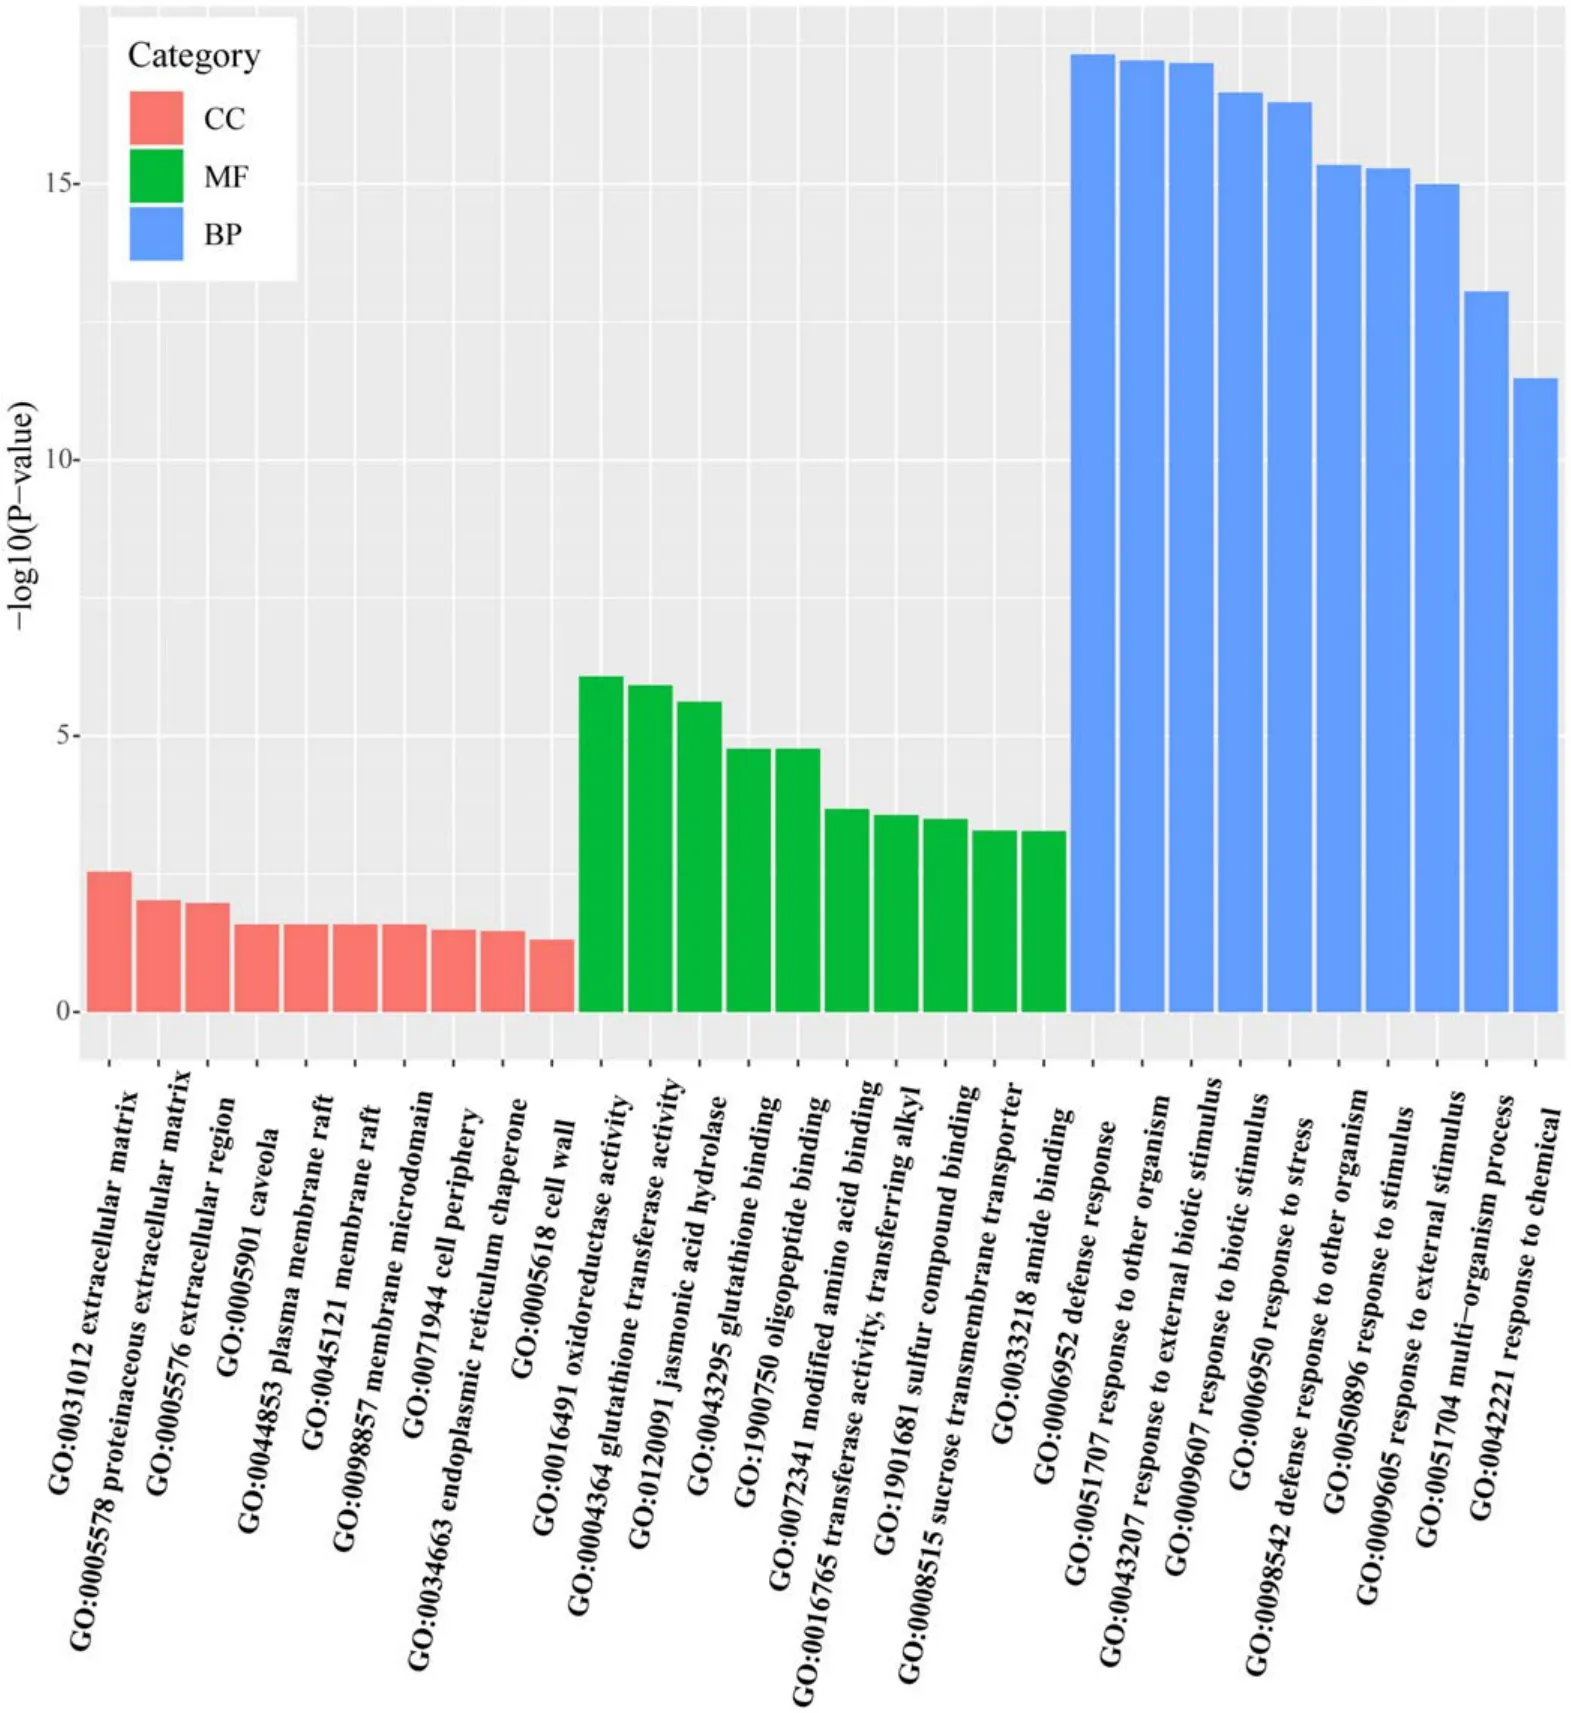
Figure 9.Gene ontology classification with unigenes.Blue, green, and red indicates GO terms for biological processes (BP), molecular function(MF),and cellular components(CC),respectively.GO terms were sorted based on −log10(P-value).For each GO category,the top 10 GO entries with the lowest P-value were selected for display.
For another significantly enriched pathway of plantpathogen interaction, there were four DEGs, namely CML37(AT5G42380), CML38 (AT1G76650), CML21 (AT4G26470)and WRKY33(AT2G38470)(figure 8).Plants have developed a multi-layer surveillance system to recognize invading pathogens, firstly triggering several early signaling events (such as the influx of calcium ions (Ca2+)), activation of MAPKs, and induction of ROS and ethylene, which can regulate the downstream defense responses, including defense gene activation,phytoalexin production, cell wall strengthening, and the hypersensitive response,to confer disease resistance.Moreover,two DEGs (AT1G13608 and AT1G13609)encoding defensinlike proteins were significantly up-regulated after 1 min APCP treatment(table A5),which belongs to the GO term of defense response to fungus and is reported to be associated withFusarium oxysporumdefense [79].It has been reported that plasma and PAW could increase the transcription of pathogenesis-related (PR) genes to enhance host resistance against pathogens in tomato seedlings[20].Taken together,our results suggested that APCP may also enhance the plant defense against pathogens via regulating gene expression in the plantpathogen interaction pathway in addition to the stimulatory effects on seedling growth.
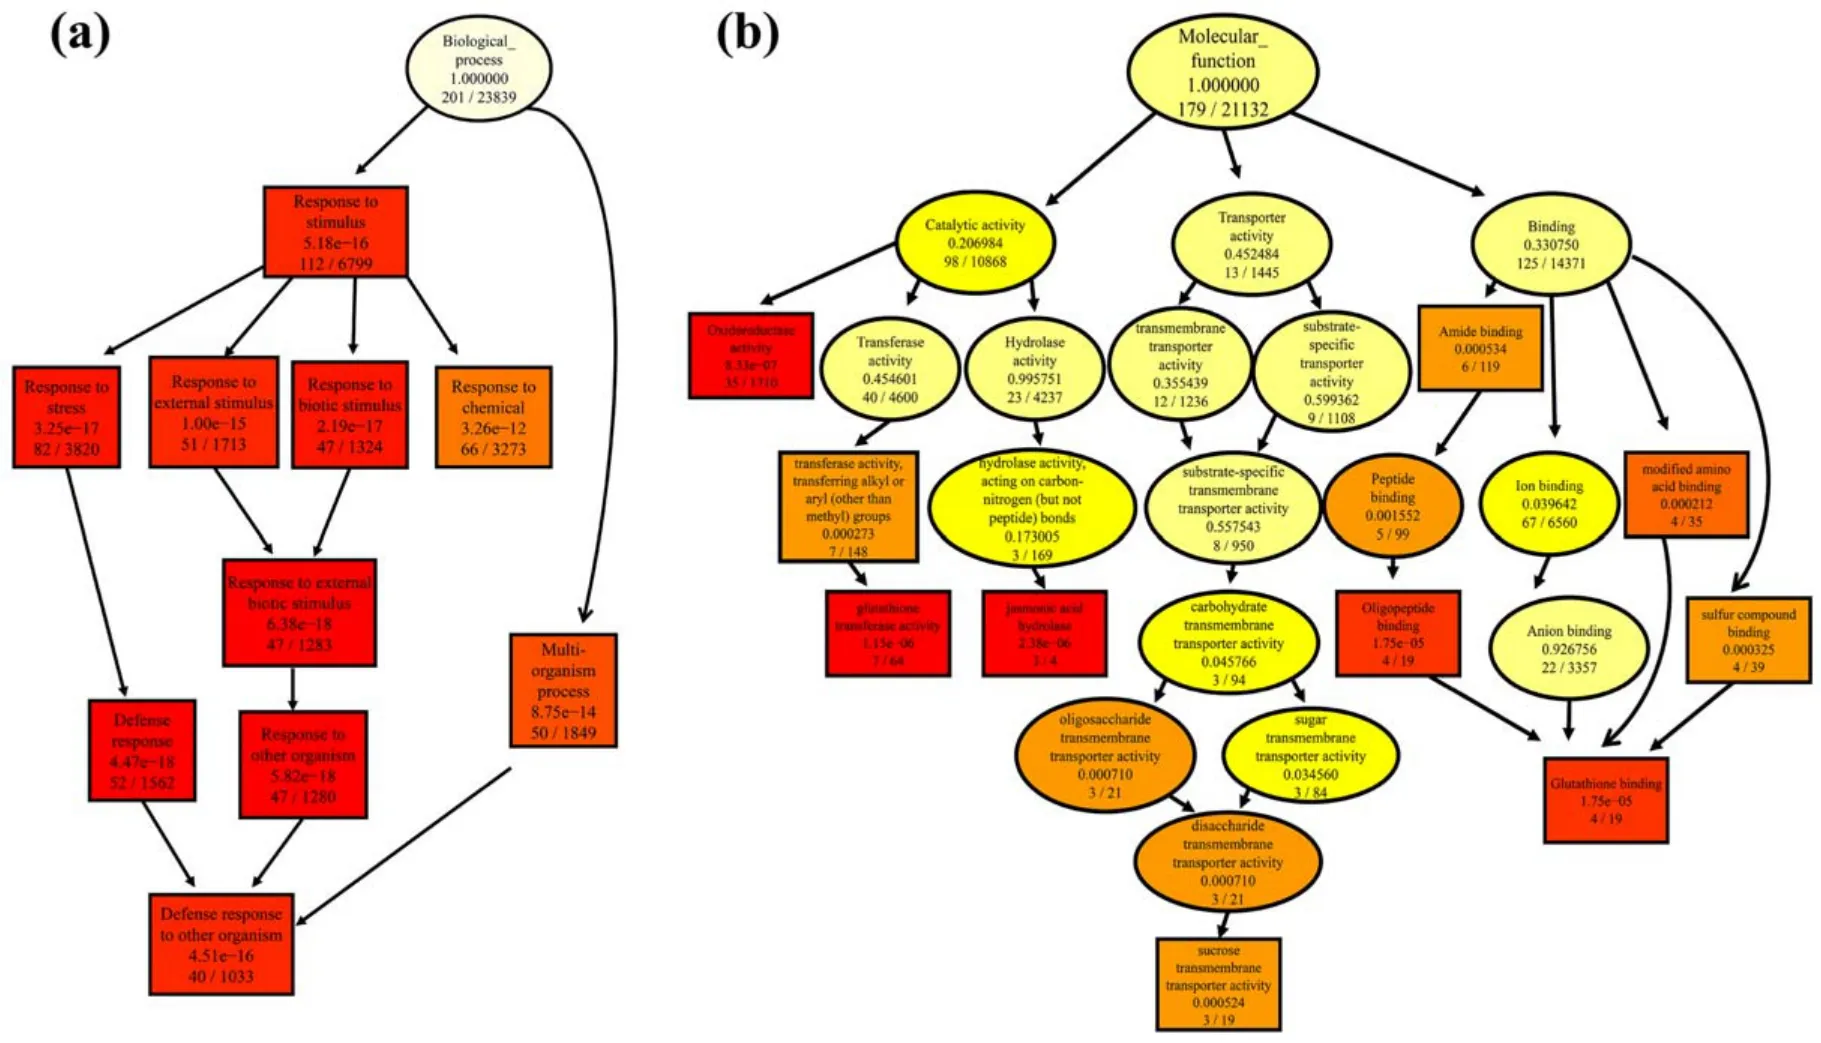
Figure 10.The analysis of GO enrichment in (a) biological process (BP) and (b) molecular function (MF) group by using directed acyclic graph.In this graph,the GO terms closer to the root node are more generalized,and the GO terms in the lower branch are the ones with a finer level of annotation results.The top-10 GO terms with the highest enrichment are set to square,and the other GO terms are round.The color represents the range of p-values, from bright to dark, as colorless—light yellow—dark yellow—red.The darker the color is, the more pronounced the richness of the Go terminology is.
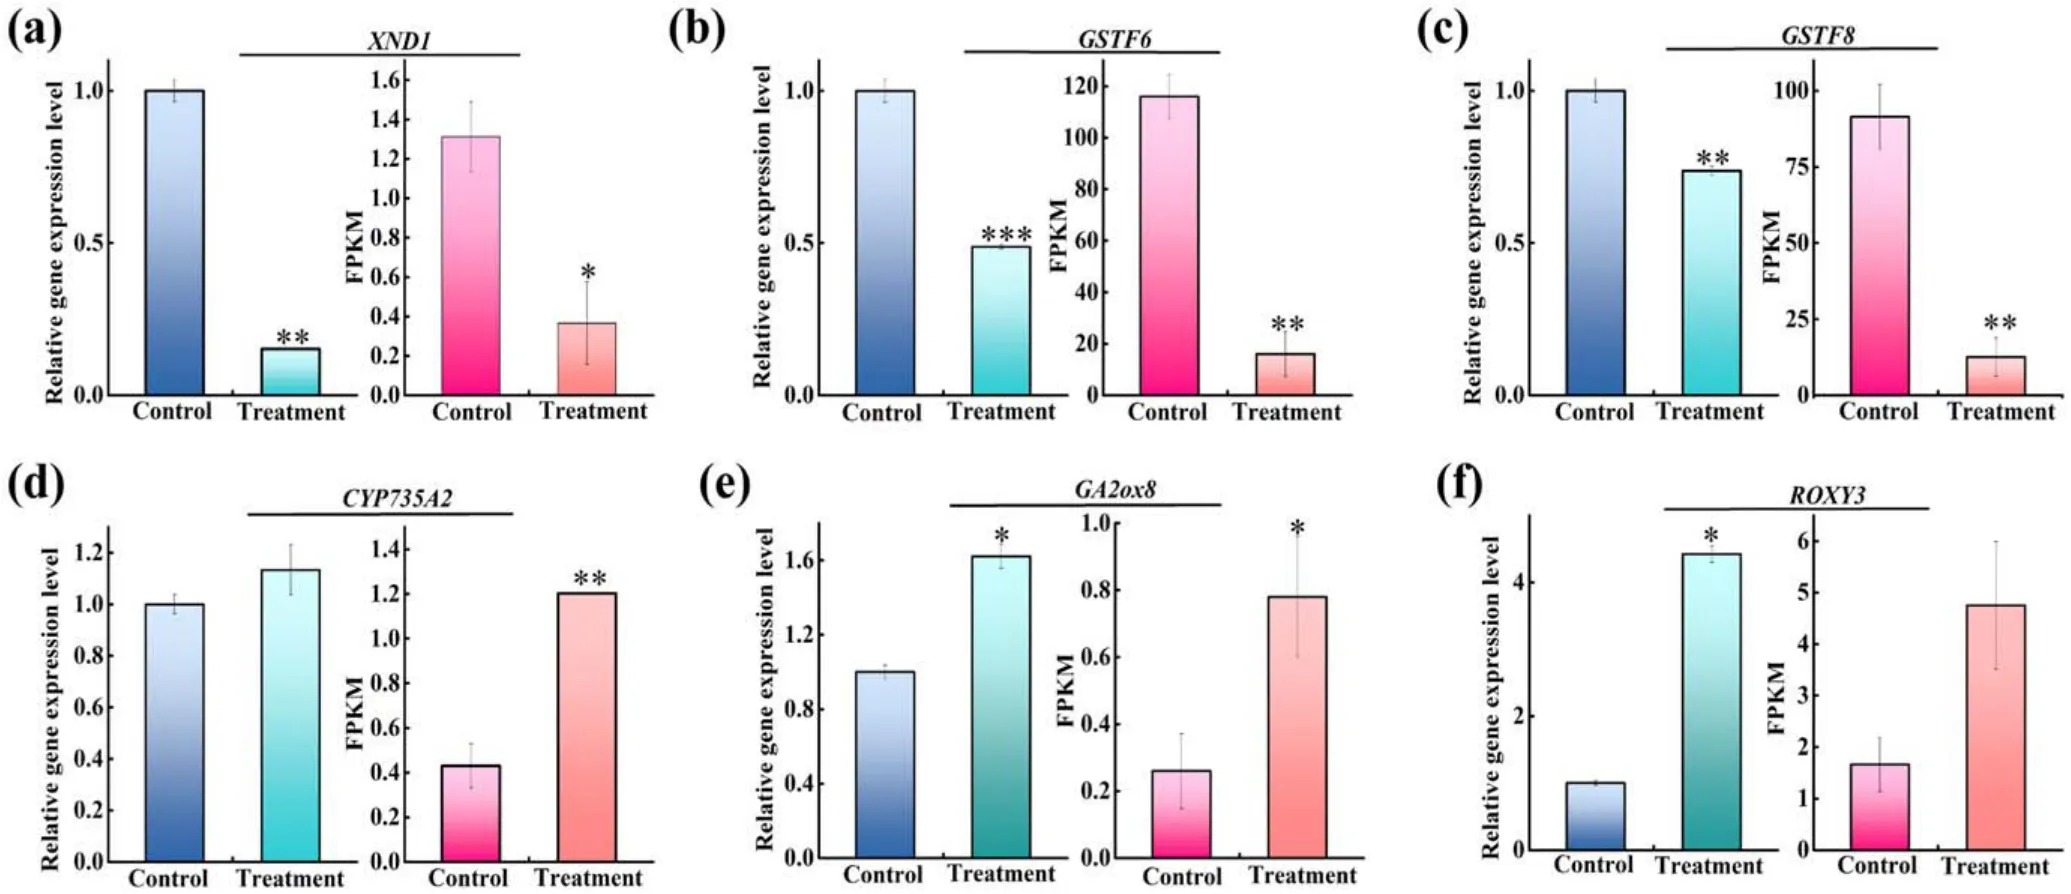
Figure 11.Comparison of gene expression patterns obtained by RNA-Seq and qRT-PCR validation.(a)XND1,(b)GSTF6,(c)GSTF8,(d)CYP735A2, (e) GA2ox8, and (f) ROXY3.Tub1 expression level was used as a reference in qRT-PCR.The significant difference between control and treatment is expressed as *P < 0.05, **P < 0.01, and ***P < 0.001.
For GO term analysis (figures 9 and 10), the top-10 GO enriched terms in the BP category with highly significantP-values mainly belong to the response process (such as response to the stimulus, stress and organism as well as defense response), indicating that these response processes were important for 1 min APCP-induced biological effects inArabidopsisseedlings.Moreover, for a more refined BP category annotation shown in figure 12 (some DEGs are involved in multiple response processes), the enriched biological processes contained the response to the hormone(SA,ABA, JA and ethylene), fungus, bacterium, nitrogen and oxygen-containing compound and involved in hormone,nitrogen compound and ROS metabolic processes,which can be explained by the following reasons.Firstly,APCP contains many components, e.g.charged particles, electromagnetic fields, oxygen/nitrogen radicals and molecules, UV photons and excited atoms [2].Moreover, when air APCP treats the samples in liquids, it can also generate various RONS in liquids,consequently endowing the liquids with low pH,high ORP and conductivity [80].Thus, we speculate that these complex constituents(especially RONS)in APCP and APCPtreated liquids may act as a stress or stimulus to trigger serials of oxygen and nitrogen-responsive gene expression inArabidopsisseedlings and affect ROS and nitrogen compound metabolism.Secondly,besides the extracellular agents directly generated by APCP, the intracellular compounds(such as hormones or other metabolites) induced by APCP can also become stress or stimulus for seedlings, consequently regulating the hormone-metabolic and responsive gene expression.Thirdly, given that plasma-mediated RONS induction in plant mimics RONS bursts through pathogen attack and triggers the plant immune response to pathogen infection [20], we deduce that APCP may also act as organisms (such as bacterial and fungal pathogens) and induce defense responses.
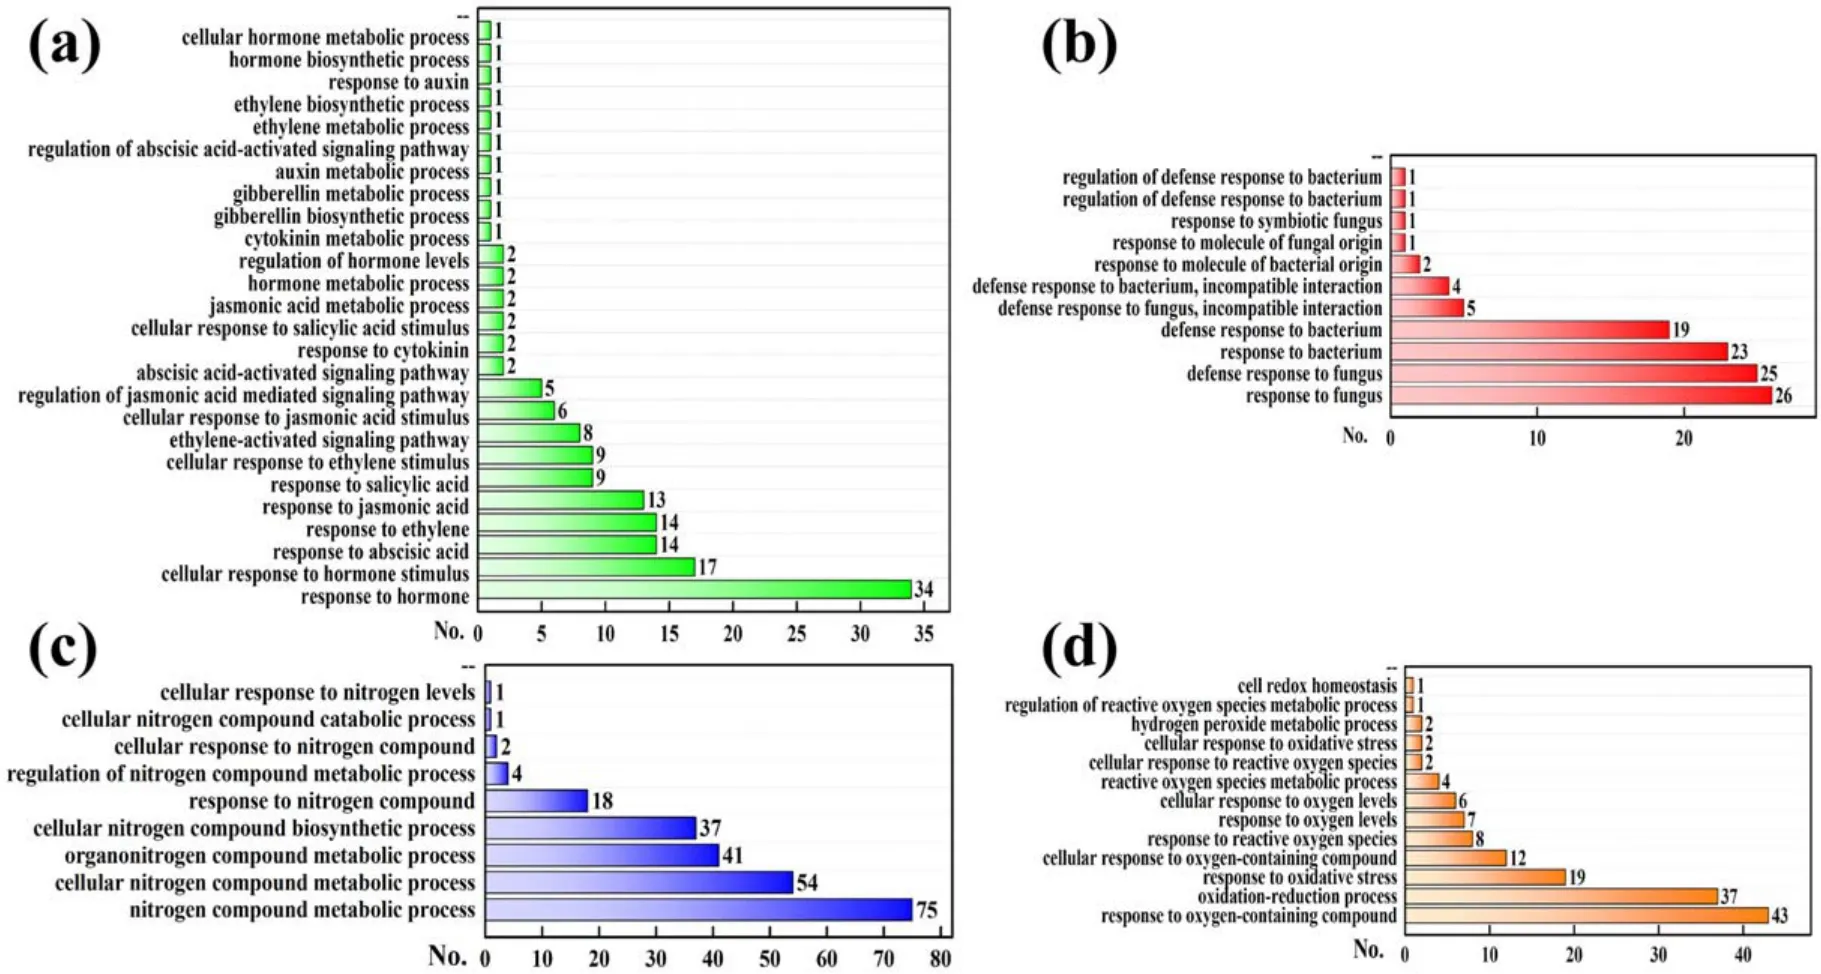
Figure 12.Numbers (No.) of (a) hormone-metabolic/responsive, (b) microbe-responsive, (c) nitrogen-metabolic/responsive and (d) ROSmetabolic/responsive DEGs in BP category of GO enrichment.
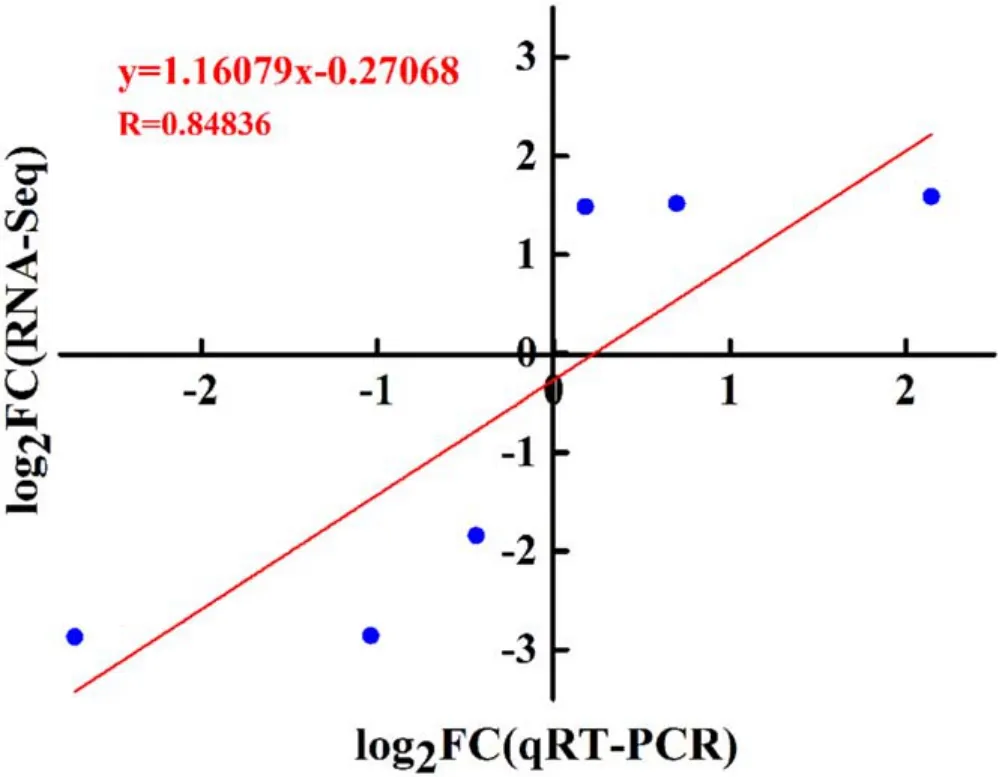
Figure A1.Correlation analysis between RNA-seq and qRT-PCR results for six DEGs.
Although transcriptome sequencing can generate large amounts of data to analyze genes associated with phenotypic information, transcriptome sequencing has some technical limitations.One of them is that researchers must choose between the number of replicas and the depth of reading[81].Increasing the number of replicas can increase the possibility of detecting altered gene expression patterns and thus improve the reliability of the data.Meanwhile, a deeper reading allows the detection of mutant RNA and splice variants [82, 83].More importantly, the transcriptome sequencing only determines the relative quantification at the transcript level[84,85].However,the process from transcript levels to phenotypic changes in plants undergoes a complex set of regulations (such as post-translational modifications),so it is not sufficient to use the transcriptome results to reflect differences in plant phenotypes.Moreover,a large number of validation experiments are still needed to further determine the specific function of DEGs.
5.Conclusion
In conclusion, the growth data show that APCP treatment could exert beneficial effects onArabidopsisseedling growth and the optimal performance was achieved under 1 min APCP treatment, which was accompanied by the decreased amino acids concentrations and increased GSH, gibberellins (GA1,GA3) and cytokinin (zeatin, TZR) accumulation inArabidopsisseedlings.The comparative transcriptome analysis between 1 min APCP-treated seedlings and the control identified 218 DEGs including 20 up-regulated and 198 downregulated genes,which were mainly localized at chromosome 1.The DEGs were enriched in pathways of GSH metabolism,MAPK signaling transduction, plant resistance against pathogens, phytohormone metabolism and acid amino metabolism.Moreover,most of the DEGs were defense,stimuli or stress-responsive genes and encoded proteins with oxidoreductase activity.Taken together, it is hypothesized that the various agents (especially RONS) in APCP may act as a potent effective elicitor to regulate the expression of stimuli/stress-responsive genes involved in GSH, phytohormone and amino metabolism and plant defense against pathogens via MAPK signal transduction pathway, thereby enhancingArabidopsisseedling growth.This study extends the available knowledge of the transcriptome changes underlying APCPenhancedArabidopsisgrowth, which would promote the application of APCP as an innovative strategy for improving agricultural productivity.
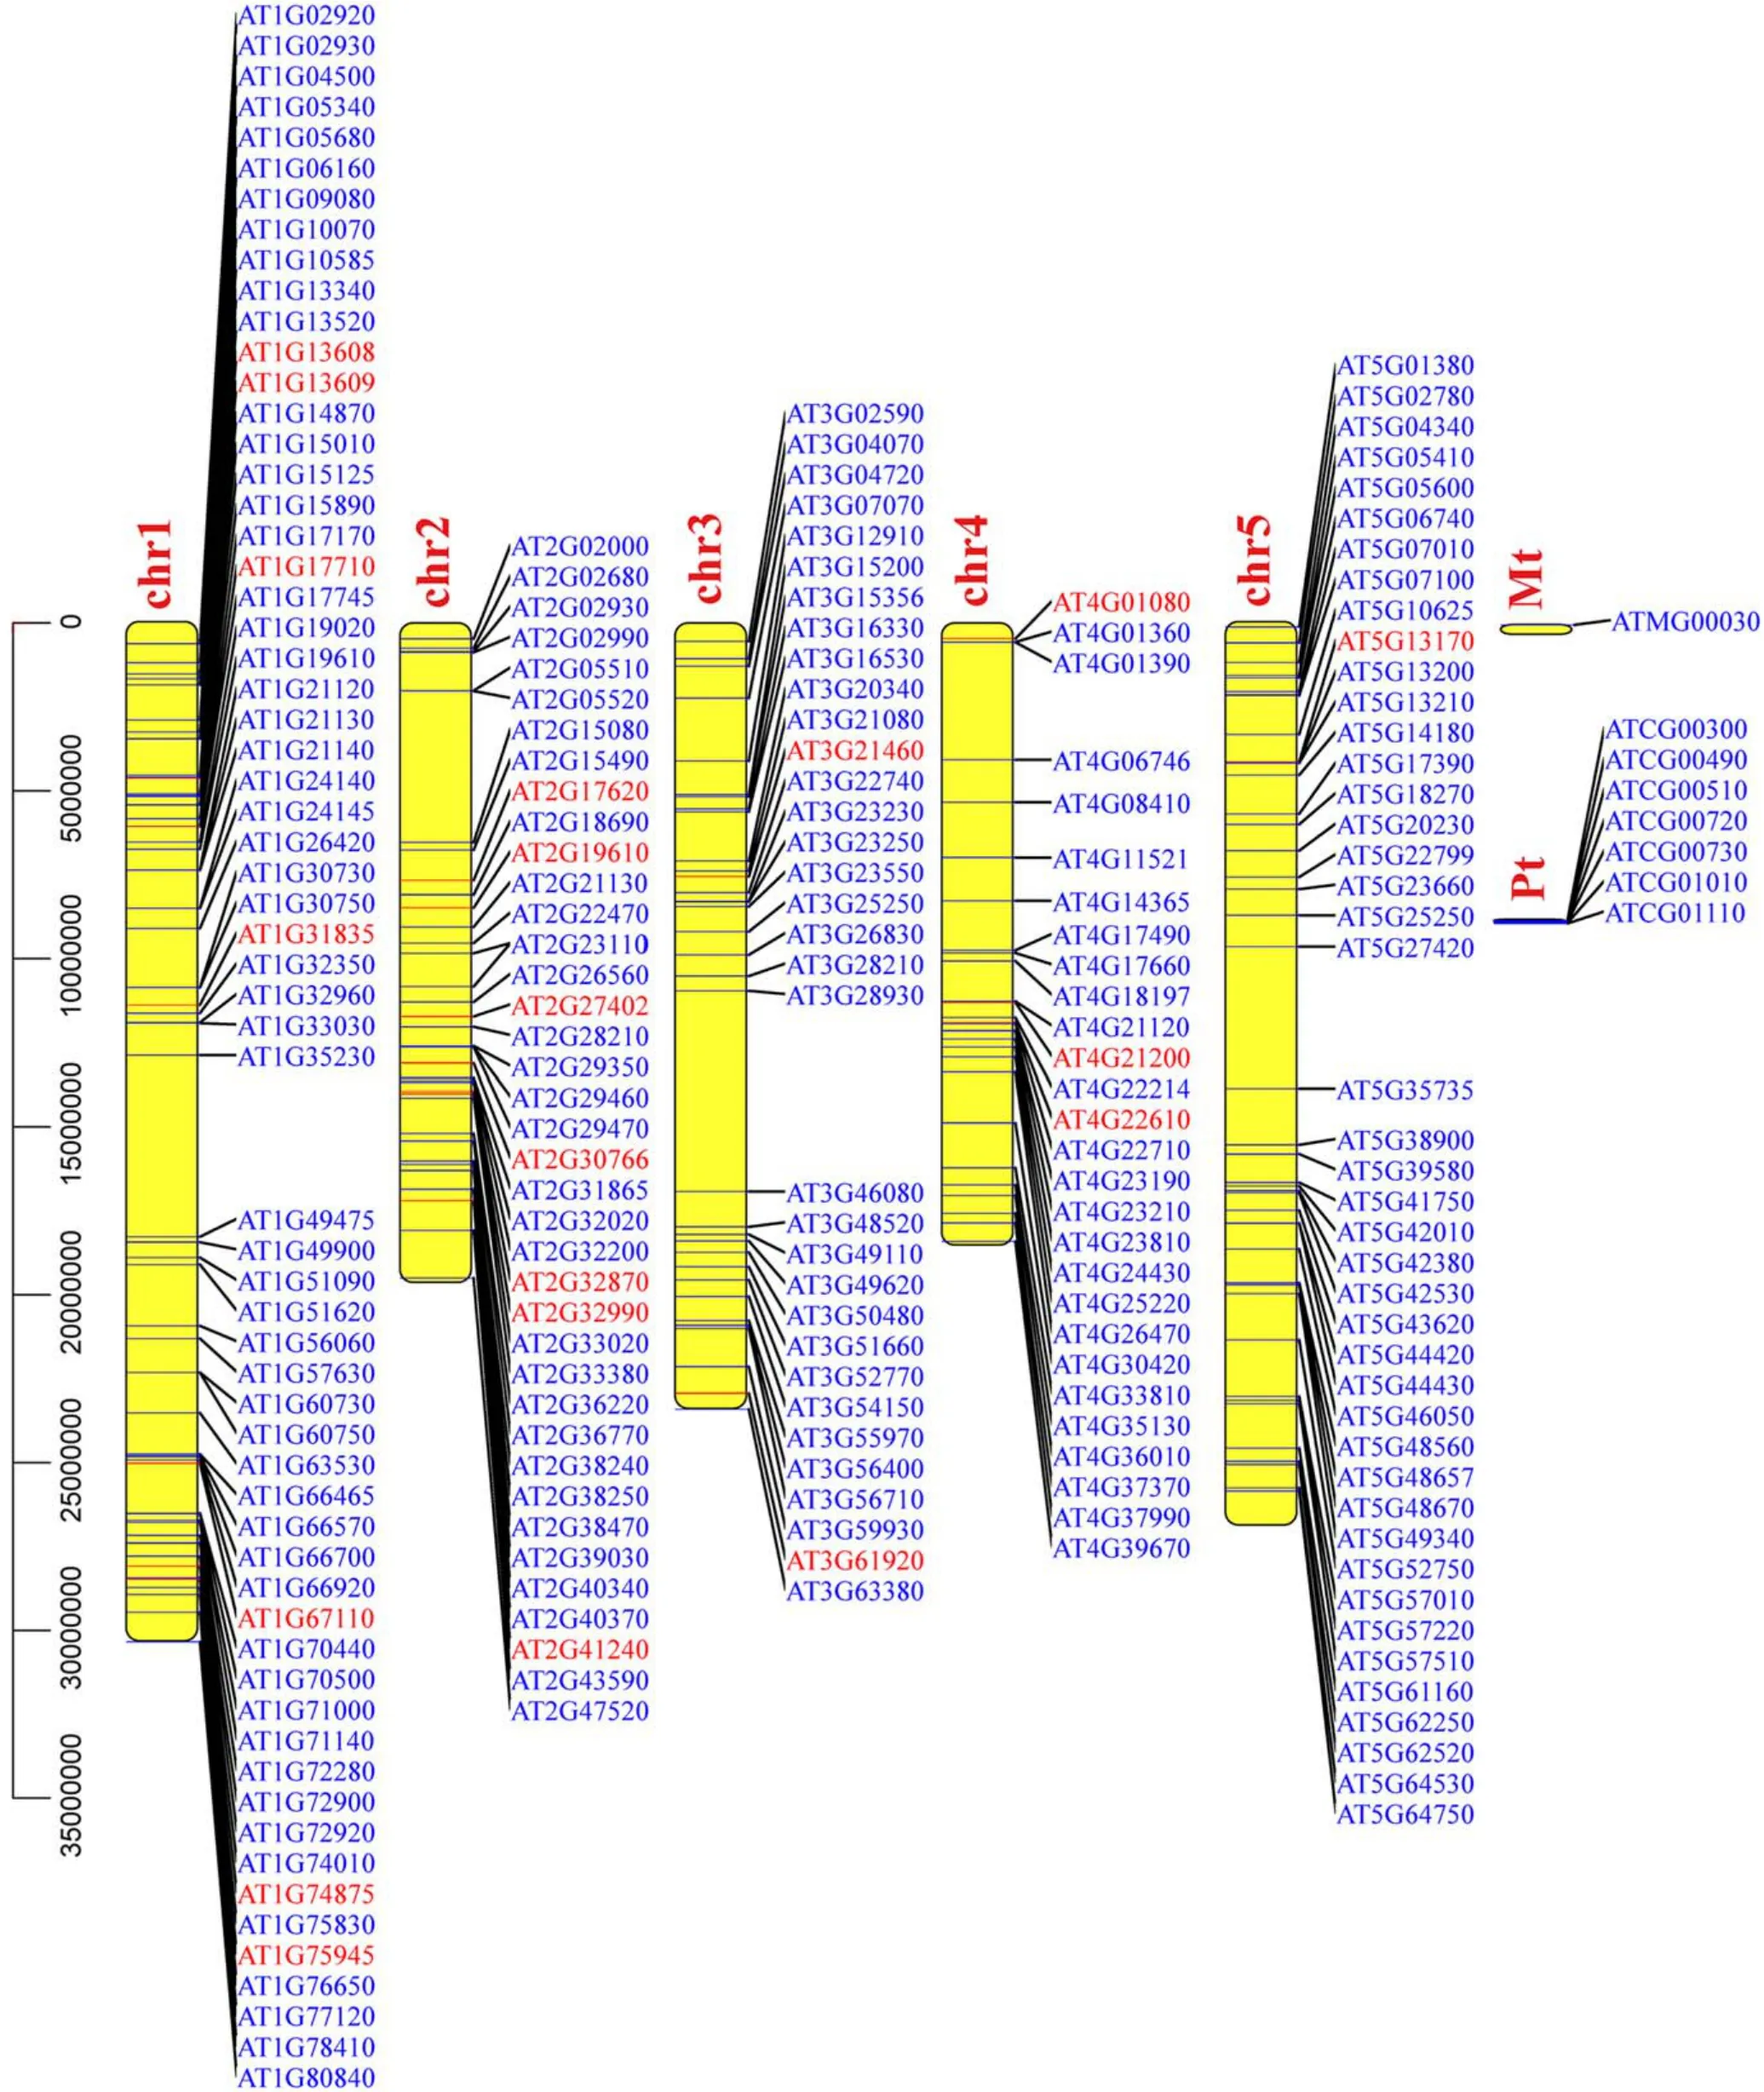
Figure A2.The arrangement of DEGs on the chromosomes of Arabidopsis.Red and blue colors indicate the up-regulated and down-regulated genes, respectively (chr: chromosomes; Pt: chloroplast; Mt: mitochondrion).
However, there were some limitations in this study.Firstly,we only conducted RNA sequencing,which can only reflect the changes at the transcript level.Given that the process from transcript levels to phenotypic changes in plants undergoes a complex set of regulations, future work will apply a multi-omics approach (such as genomics, transcriptomics, proteomics and metabolomics) to comprehensively uncover the stimulatory effects of APCP on early seedling growth inArabidopsis.Secondly,we only performed RNA sequencing for 1 min APCP-treatedArabidopsisseedling at one cultivation time, which is not sufficient to understand the whole molecular responses ofArabidopsisto APCP treatment,thus further study will do the transcriptomic analysis ofArabidopsisafter different APCP treatment time and cultivation time to construct a comprehensive diagram of the transcriptional regulatory network in response to APCP inArabidopsis.
Acknowledgments
This work was supported by National Natural Science Foundation of China (Nos.11605159 and 11405147), Chinese Postdoctoral Science Foundation (No.2017M612412),the Foundation of Key Technology Research Project of Henan Province (No.182102311115), Key Discipline Construction Project of Zhengzhou University (No.32410257)and Youth Innovation Project of Key Discipline of Zhengzhou University (No.XKZDQN202002).
杂志排行

Plasma Science and Technology的其它文章
- Energy and flux measurements of laserinduced silver plasma ions by using Faraday cup
- Experimental investigation on DBD plasma reforming hydrocarbon blends
- Research on active arc-ignition technology as a possible residual-energy-release strategy in electromagnetic rail launch
- Distinguish Fritillaria cirrhosa and non-Fritillaria cirrhosa using laser-induced breakdown spectroscopy
- On abnormal behaviors of ion beam extracted from electron cyclotron resonance ion thruster driven by rod antenna in cross magnetic field
- Research on quinoline degradation in drinking water by a large volume strong ionization dielectric barrier discharge reaction system