Application of 3D MHD equilibrium calculation to RMP experiments in the J-TEXT tokamak
2021-08-05ZhaosuWANG王昭苏YunfengLIANG梁云峰ZhongheJIANG江中和JieHUANG黄杰YasuhiroSUZUKIAlexanderKNIEPSSongZHOU周松JinyuXIONG熊金玉JiankunHUA华建坤ZhipengCHEN陈志鹏ZhongyongCHEN陈忠勇NengchaoWANG王能超ZhoujunYANG杨州军YonghuaDING丁永华YuanPAN潘垣andtheTEXT
Zhaosu WANG (王昭苏), Yunfeng LIANG (梁云峰),,3,Zhonghe JIANG (江中和), Jie HUANG (黄杰), Yasuhiro SUZUKI,Alexander KNIEPS, Song ZHOU (周松),, Jinyu XIONG (熊金玉),Jiankun HUA(华建坤),Zhipeng CHEN(陈志鹏),Zhongyong CHEN(陈忠勇),6,Nengchao WANG(王能超),Zhoujun YANG(杨州军),Yonghua DING(丁永华),Yuan PAN (潘垣) and the J-TEXT Team,7
1 International Joint Research Laboratory of Magnetic Confinement Fusion and Plasma Physics, State Key Laboratory of Advanced Electromagnetic Engineering and Technology,School of Electrical and Electronic Engineering, Huazhong University of Science and Technology, Wuhan 430074, People’s Republic of China
2 Forschungszentrum Jülich GmbH, Institute für Energie- und Klimaforschung—Plasmaphysik, 52425 Jülich, Germany
3 Institute of Plasma Physics, Chinese Academy of Sciences, Hefei 230031, People’s Republic of China
4 National Institutes of Fusion Sciences, National Institutes of Natural Sciences, Oroshi-cho, 322-6, Toki 509-5292, Japan
5 SOKENDAI, The Graduate University for Advanced Studies, Oroshi-cho, 322-6, Toki 509-5292, Japan
6 Chengdu University, Chengdu 610106, People’s Republic of China
Abstract The application of resonant magnetic perturbation (RMP) coils could break the initial axisymmetry and change the magnetic topology in tokamak systems.To understand the plasma equilibrium response to the RMP fields, three-dimensional (3D) non-linear magnetohydrodynamics equilibrium calculations have been carried out using the HINT code for an RMP field-penetration experiment on J-TEXT.The HINT code does not assume perfectly nested flux surfaces,and is able to consider directly the change of magnetic topology due to the RMP field penetrations.Correlations between 3D equilibrium calculations and experimental observations are presented.The magnetic topologies calculated by HINT were compared with the field topologies obtained from a vacuum approximation method.It turns out that the effects of redistribution of plasma pressure and current due to the formation of magnetic islands at various resonant rational surfaces should be considered self-consistently for understanding the change of magnetic structure.Such changes include changes in the shape and size of magnetic islands, and the distribution of stochastic fields around the magnetic islands and at the plasma boundary, which plays an important role for plasma-wall interactions.
Keywords: 3D equilibrium, RMP, magnetic topology
1.Introduction
Traditionally, as tokamaks are often regarded as two-dimensional (2D) systems, we approach their physics using 2D methods, e.g.the Equilibrium FITting code EFIT [1], due to their low computational costs.However, as tokamaks have discrete toroidal field coils,they are subject to toroidal field(TF)ripples.Additionally, many tokamak experiments feature resonant magnetic perturbation (RMP) coils to influence magnetohydrodynamic (MHD) instabilities [2–6], and to suppress or mitigate edge localized modes (ELMs) [7–12].In tokamak plasmas, the externally applied RMP fields can significantly affect tearing modes [13–17] (which are driven by plasma current gradient) and can generate magnetic islands at resonant rational magnetic surfaces withq=m/n[18,19](whereqis the safety factor andm,nare the poloidal and toroidal mode numbers, respectively).Magnetic islands are naturally threedimensional (3D) structures.Therefore, traditional 2D methods may not be accurate enough to describe tokamak plasmas with RMP application, and a 3D approach is advised.
After the formation of a magnetic island, once it is sufficiently large, it will usually lock to actively applied RMPs or the machine’s intrinsic error fields.If the magnetic island chains on adjacent rational surfaces overlap,the magnetic field lines become stochastic and an ergodic region will be formed in the magnetic topology [2, 3, 20].A traditional method,usually labelled as ‘vacuum approximation’, has been widely used to model the 3D magnetic topology for designing RMP systems.In this method, the RMP field is directly superimposed on the MHD equilibrium field for the unperturbed plasma.However, this approach cannot model the plasma equilibrium responses to the applied RMP field.To study the plasma response to the applied RMP fields, this ‘vacuum approximation’method is not applicable,and another model to characterize the 3D plasma MHD equilibrium is needed.
To date, two major categories of nonlinear 3D MHD equilibrium codes have been developed for magnetically confined fusion plasmas.One branch includes 3D equilibrium codes assuming perfectly nested flux surfaces.A prominent example of this code family is VMEC [21], which uses a steepest-decent method to approach a 3D equilibrium.To accelerate the convergence, magnetic flux coordinates are adopted.However, the magnetic flux coordinate cannot present the change of magnetic topology, and only the displacement of flux surfaces is considered.Therefore, this code family cannot model magnetic islands self-consistently.In another category of 3D equilibrium calculation codes,including PIES[22],SIESTA[23],and HINT[24, 25], there is no assumption of nested magnetic surfaces,which allows these codes to consider changes in the magnetic topology.Recently, RMP field penetration experiments have been performed[26–30]on the J-TEXT tokamak with the aim to develop a reliable mechanism for active control of major MHD instabilities, i.e.tearing modes, in future fusion reactors using actively applied RMP fields.In this work,the impact of the RMP field penetration on the plasma magnetic topology and equilibrium profiles have been studied using the nonlinear 3D MHD equilibrium code HINT.The numerical model of the HINT code is addressed in section 2.In section 3, numerical results from HINT and the comparisons with experimental observations and simulation results from vacuum approximation method are presented.The discussions and conclusions are given in section 4.
2.Numerical model
In this study,the 3D plasma equilibrium calculation was based on two codes: EFIT and HINT.The EFIT code is a 2D equilibrium reconstruction code,which works well in axisymmetric fields without magnetic islands.The HINT code uses righthanded cylindrical coordinates, which enables simple application to tokamaks at low numerical errors.As HINT represents the magnetic field explicitly on its grid(and does not reply on implicit surface-based representations), it can represent RMP penetration scenarios, in which magnetic islands might be formed at various rational surfaces.The initial 2D equilibrium input of the HINT code, which also captures the experiment parameters, was provided by the EFIT code.
HINT implements a two-step relaxation method to solve for a non-linear resistive single-fluid MHD equilibrium.The first step is a plasma pressure relaxation process,conducted with fixed B,to satisfy a parallel pressure balance condition B · ∇p=0(no pressure gradient along the magnetic field).An averaged plasma pressure on a flux tube is calculated, and the result of the previous iteration is used as the input for the next iteration step.
The second step is a magnetic field relaxation process,conducted with fixedp(which is obtained in the first step).Here, the magnetic field is decomposed into two terms,B=B0+ B1,where B0is the vacuum magnetic field and B1is the equilibrium response field.B0is fixed in the process of relaxation.Convective and viscous terms are omitted from the equation of motion.Based on these assumptions,we obtain a set of artificial dissipative MHD equations [25]:
The dissipative (artificially enhanced) resistivity η is fixed in the calculation.The last term in equation (2) is a divergence cleaning term and KdivBis a small constant.The net toroidal current jnet(e.g.Ohmic or bootstrap current), is defined by
Bracket〈…〉indicates a flux surface average.jnetis also fixed in the calculation.
By performing both steps iteratively until dv/dt→ 0 and dB/dt→ 0,a 3D MHD equilibrium is obtained for an ohmically steady state.
3.3D equilibrium calculation on J-TEXT
3.1.Field penetration experiment on J-TEXT
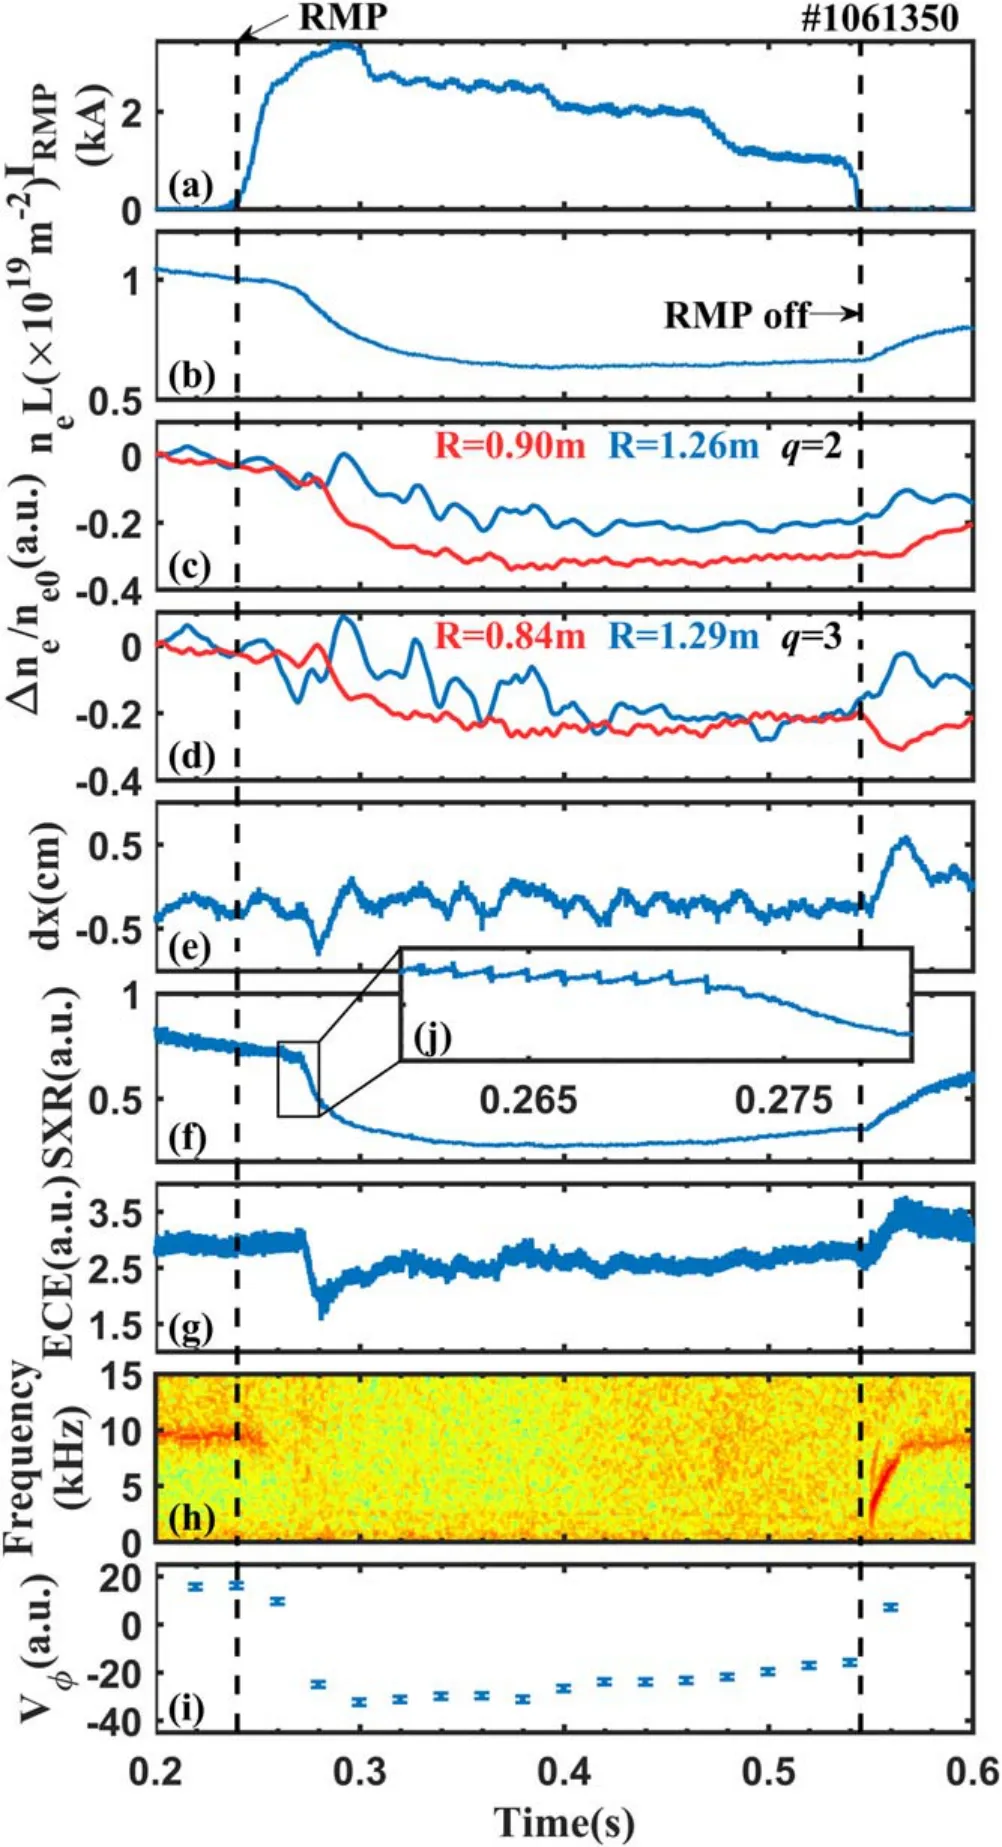
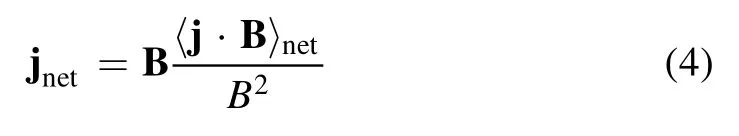
Figure 1.Time evolution of a RMP penetration discharge.(a) The RMP current, (b) the central line-integrated electron density, (c) the normalized electron density at q=2 region(Δne=ne −ne0 and ne0 is taken at t=0.2 s), (d) the normalized electron density at q=3 region, (e) the horizontal displacement, (f) the intensity of the core chord-integrated SXR emission,(g)the relative electron temperature from ECE at minor radius r=16.87 cm,(h)the power spectrum of the Mirnov signal, (i) the toroidal rotation velocity (direction of the electron diamagnetic drift is the positive direction) and (j) the detailed SXR emission corresponding to the period marked by rectangle in figure (f).
J-TEXT is a circular, medium-sized tokamak with a major radiusR0=1.05 m and a minor radiusain the range of 25 to 29 cm,depending on the relative positions of the plasma axis and three (at top, bottom and the low-field side) movable poloidal limiters.It can be operated in both limiter and highfield side divertor configurations [31].J-TEXT features an RMP coil system consisting of three sets of saddle coils(upper, lower and low-field side coils), which are toroidally distributed to generate static and dynamic RMPs [32].The RMP coils were upgraded in the spring of 2017, and can not only provide different dominant modes (m/n) of resonant magnetic perturbations, but also adjust their amplitude and phase dynamically.Recently, this upgraded RMP system has been successfully applied form/n=2/1 field penetrations experiment on J-TEXT [33].
Figure 2.Radial magnetic field Br on the last closed flux surface during the RMP penetration experiment (shot #1061350).
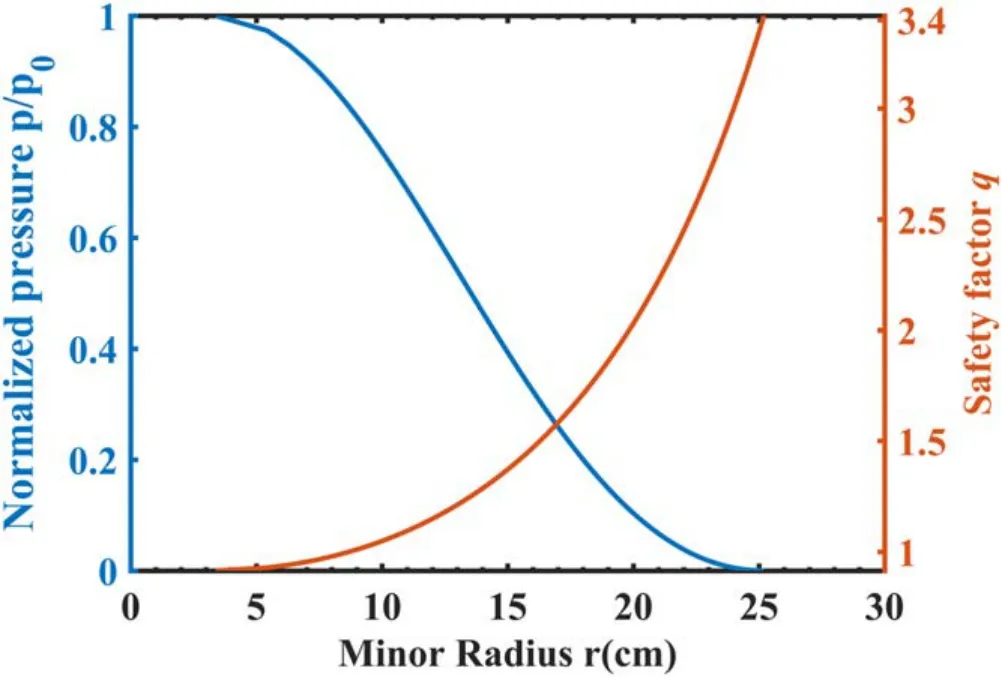
Figure 3.Pressure and safety factor profiles calculated by EFIT.
In this experiment,the target plasma witha=25.5 cm,a toroidal magnetic fieldBt=2 T at magnetic axis and a toroidal currentIp=175 kA was sustained stably for 400 ms fromt=0.2 s tot=0.6 s with Ohmic heating only.To investigate the impact of them/n=2/1 field penetration on the particle confinement, the plasma density feedback system was deactivated.On J-TEXT, the radial profiles of the lineintegrated electron density,neL, the relative electron temperature,Te,and the toroidal velocity of plasma rotation,VΦ,are measured by a multi-channel polarimeter interferometer(POLARIS)[34],a 24-channel heterodyne electron cyclotron emission (ECE) radiometer [35] and a spectrometer filtered for carbon V in the toroidal direction [36], respectively.
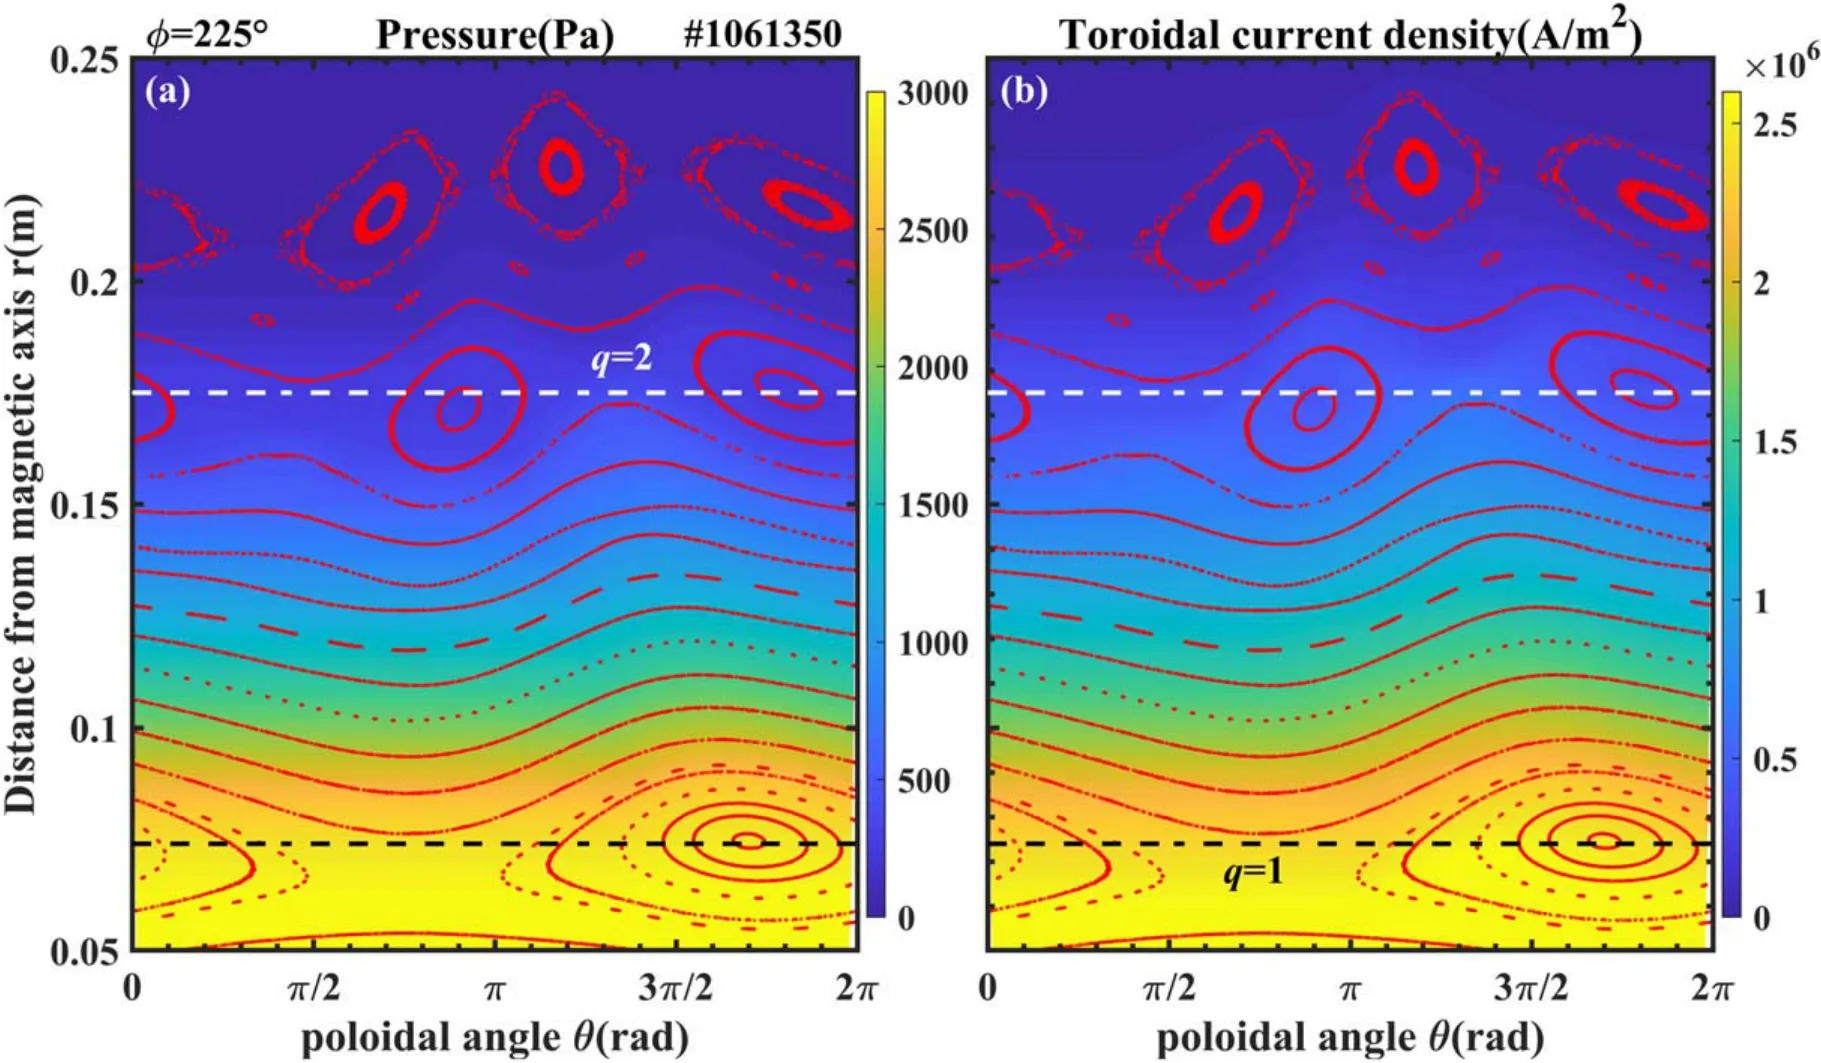
Figure 4.Pressure and toroidal current density distribution plots of the magnetic island region in the HINT 3D equilibrium calculation at Φ=225°.The red dots indicate the Poincaré plot.The poloidal angle of π indicates the high-field side,while the poloidal angle of 0 resp.2π indicates the low-field side; (a) pressure distribution plot, (b) toroidal current density distribution plot.
Figure 1 shows an overview of a typical discharge from them/n=2/1 field penetration experiment on J-TEXT.The distribution of the RMP-induced radial magnetic perturbations,Br, on the last closed flux surface of this discharge is presented in figure 2.The RMP fields were switched on att=0.24 s, and ramped up quickly to the RMP coil current,IRMP, of ~3 kA within a duration of 60 ms as shown in figure 1(a).AfterIRMPreached its peak value, it was stepped down to 2.5 kA att=0.3 s,to 2 kA att=0.4 s,and to 1 kA att=0.48 s, and finally turned off att=0.55 s.Them/n=2/1 locked mode excitation, followed with a sudden substantial degradation of plasma confinement, occurred att=0.27 s, when theIRMPreached ~2.8 kA.The time evolutions of the central line-integrated electron density and SXR emission, and the plasma core electron temperature showed a sudden significant drop during the excitation of them/n=2/1 lock mode;the toroidal rotation measured at theq=2 surface also changes rapidly towards the ion diamagnetic drift direction during the field penetration,and all profiles partially recovered after the RMP coil current was turned off.Since the density feedback system was off in this experiment, the electron density did not fully recover, and the electron temperature was slightly higher after RMP application.
The time evolution of the MHD fluctuation spectrum measured by one of the toroidal and poloidal distributed Mirnov coils is given in figure 1(e).During the RMP coil current ramp-up phase, a weak pre-existing rotatingm/n=2/1 mode,whose frequency is around 10 kHz,was stabilized withIRMPof ~1 kA, which is by a factor of 2.8 much lower than the threshold of them/n=2/1 locked mode excitation.This mode stabilization effect with a moderate RMP field amplitude has been studied before in reference[5],and it was considered to be possible for a sufficiently high ratio of plasma rotation velocity to the Alfvén speed.When the RMP current reduced to 0 att=0.55 s, the mode unlocked from the applied RMPs, and the mode frequency rose from zero up to ~9 kHz, approaching its previous value before RMP application.After them/n=2/1 locked mode was excited, the sawtooth oscillations shown by the central line-integrated SXR emission signal in figure 1(f) were significantly suppressed.
Figures 1(c)and(d)show that the line-integrated plasma density decreased on the four lines of sight tangent to the flux surfaces ofq=2 andq=3 during the 2/1 mode penetration.The reduction was more significant at the high-field side.It should be noted that the sudden changes in the edge electron density occurring after the RMP coil current turning off are related to the plasma horizontal displacement,as shown in figure 1(e).
3.2.3D MHD equilibrium calculations for the field penetration experiment on J-TEXT
The plasma equilibrium for the discharge shown in figure 1 was calculated using the 3D MHD equilibrium code HINT.The initial radial profiles for the safety factorqand pressurep,encapsulating a 2D toroidal axis-symmetry plasma equilibrium RMP application,were calculated by the EFIT code as shown in figure 3.The edge safety factorqaat a minor radiusr=a=25.5 cm is about 3.42 and theq=2 flux surface is located at a minor radiusr=20 cm.The pressure at the magnetic axis is ofp0≈ 4 kPa.In addition, the RMP coil current in the equilibrium calculation is chosen as 3 kA,which is the peak value of the RMP coil current in this discharge.The distribution of RMP induced magnetic perturbations was calculated via the Biot–Savart law over the computational domain.
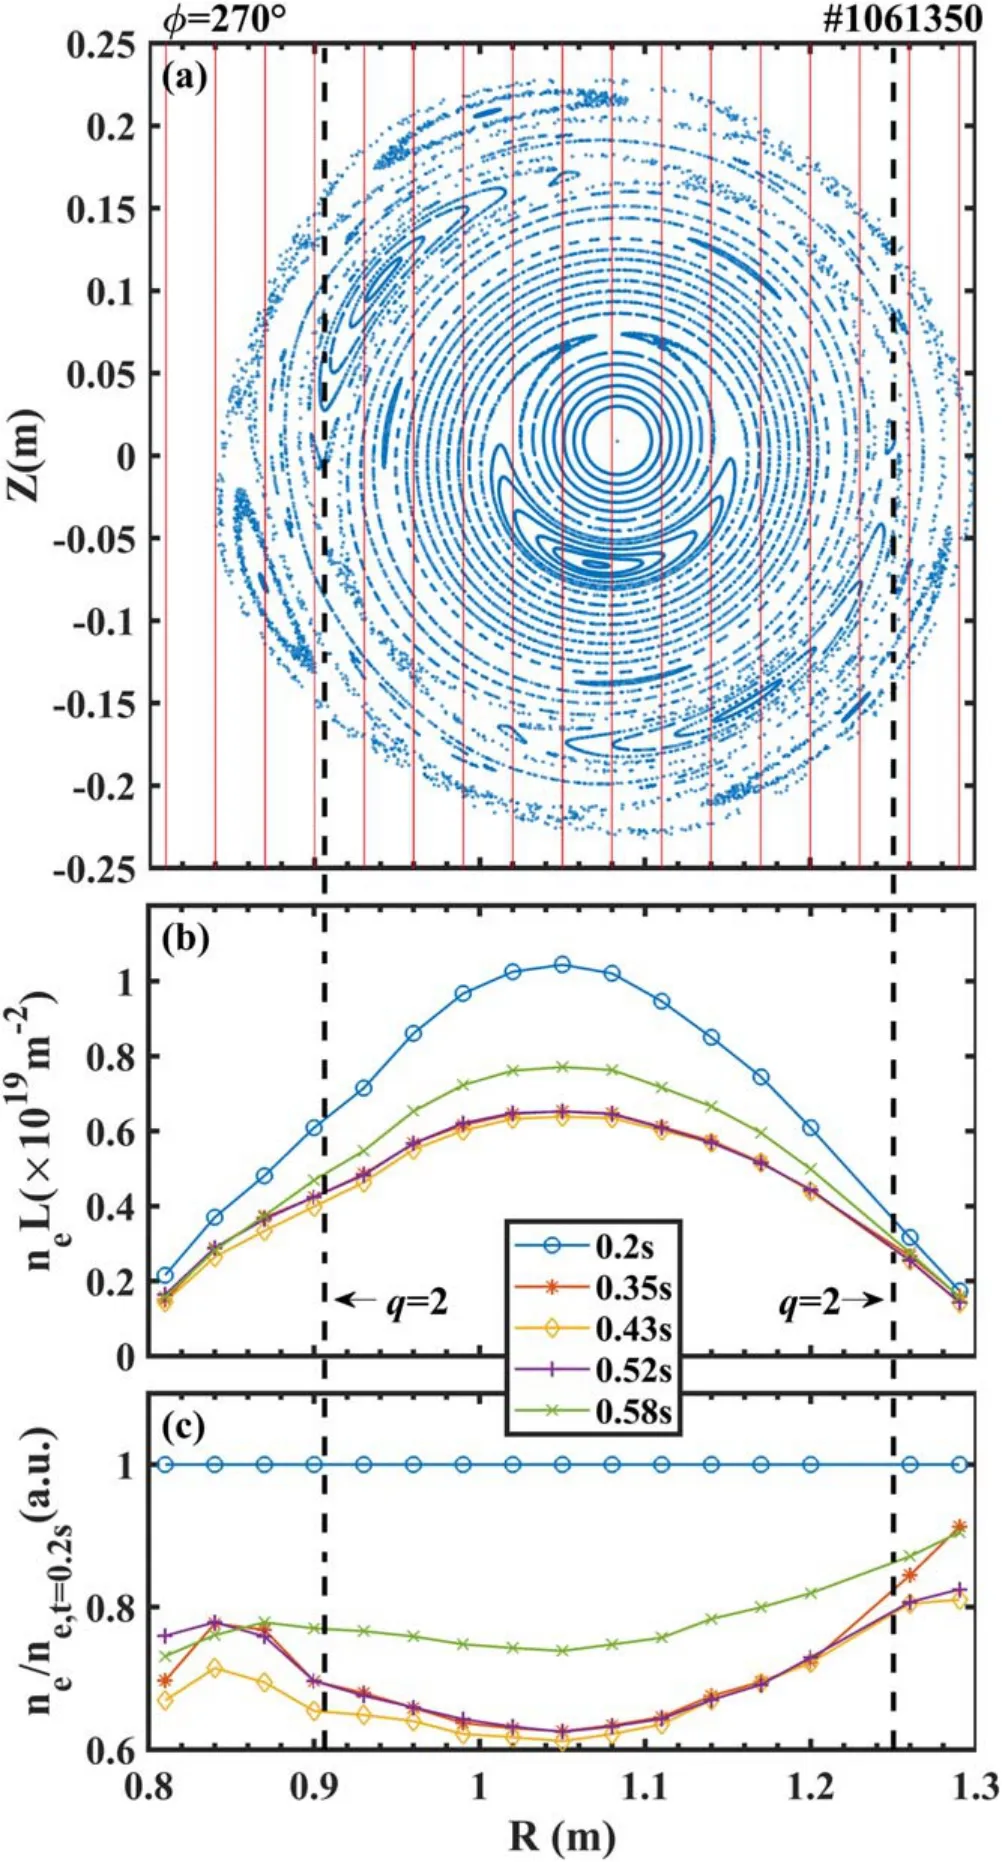
Figure 5.Magnetic topology calculated at Φ=270° and electron density profiles.(a) Poincaré plot at Φ=270°, (b) electron density profiles measured at five different times, (c) normalized electron density profiles at five different times.
Figure 4 shows the contour plots of the distribution of pressure and toroidal current density calculated using the 3D equilibrium code HINT.The domain of this figure includes the magnetic island regions.According to figure 4,the magnetic islands can influence pressure and toroidal current density distributions, as the distributions of these parameters vary with the structure of the magnetic islands.These parameters show little variation inside the magnetic islands, while there are gradual changes along the radial direction outside the magnetic islands.These discrepancies can especially be seen around the O-point and X-point of the 2/1 magnetic islands.
3.3.3D magnetic topology versus the local measurements of plasma profiles
To understand the impact of RMP on the 3D plasma equilibrium profiles, the correlation between the 3D magnetic topology and the local measurements of plasma density and temperature profiles has been investigated.
Figures 5(a) and (b) show the Poincaré plot of magnetic fields calculated by HINT at the poloidal cross-section in which the POLARIS diagnostic is located and the radial profiles of the line-integrated electron density measured at various times oft=0.2 s,t=0.35 s,t=0.43 s,t=0.52 s,andt=0.58 s.Here, the red vertical straight lines in figure 5(a) refer to the lines of sight for the electron density measurement.As mentioned before, the density feedback system was disabled in this experiment,so the line-integrated electron density over the whole radii measured att=0.58 s after RMP application is about 20% lower than that att=0.2 s.When the RMP field penetration occurs, there are sudden overall decreases in the profiles of the electron density, including the edge region.However, it is worth noting that the line-integrated density within theq=2 flux surface has decreased by at least 35%,while there it is an about 20%reduction in the outside region.The profile of the line-integrated density is flattened around theq=2 flux surface after the RMP field penetration happens as shown in figure 5(b),indicating that them/n=2/1 magnetic island was formed at theq=2 flux surface and the plasma confinement was visibly affected.
Based on the HINT calculation results as shown in figure 5(a), the lines of sight of density measurement are almost tangent to the O-points of the 2/1 magnetic islands in both the high- and low-field sides.However, due to a Shafranov shift of the plasma axis, the radial width of them/n=2/1 magnetic islands at the high-field side is much wider than that at the low-field side.This could explain the enhanced flattening near theq=2 flux surface at the highfield side (compared to the low-field side).
Figure 6 shows the correlation between the magnetic structure at the horizontal planeZ=0 calculated by the HINT code, and the time evolution of the electron temperature profile measured in the discharge shown in figure 1.Here, the relative electron temperature profiles were normalized to the profile measured att=0.2 s,which is before RMP application.In this experiment, the ECE diagnostic can measure the electron temperature distribution in a radial range fromR=0.95 m toR=1.27 m (which covers theq=1 flux surface at both high- and low-field sides), but can only observe theq=2 flux surface at the low-field side.In this experiment, the electron temperature of the entire observed plasma core was ~20%higher att=0.58 s compared to that att=0.2 s.
According to 3D equilibrium calculation results as shown in figure 6(a),the O-point of them/n=2/1 magnetic islands at the low-field side is located at Φ=180°, while the viewport of the ECE diagnostic is located at Φ=225°.Therefore,the electron temperature profile measurement is closer to the O-point rather than the X-point of them/n=2/1 magnetic islands at the low-field side.Figure 6(b) shows an obvious change in electron temperature appearing near theq=2 flux surface after the RMP field penetration occurs, and a higher amplitude of the RMP coil current apparently results in a larger temperature reduction and a wider region ofTe/Te0< 1.
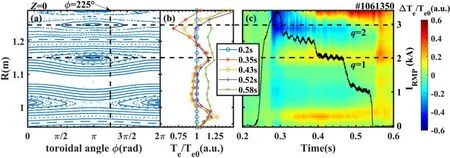
Figure 6.Magnetic topology calculated at horizontal plane Z=0 and measured electron temperature profiles (ΔTe=Te −Te0 and Te0 is taken at t=0.2 s).(a)Poincaré plot at Z=0,(b)normalized electron temperature profiles measured at five different times,(c)contour plot of normalized electron temperature.The black solid line in (c) is the RMP coil current.
In the plasma core (q≤ 1) the electron temperature profile becomes relatively flat during RMP field penetration.The opposite effect on the electron temperature changes appears near theq=1 flux surface at the high-field side and the low-field side.This may be caused by the fact that the view of the ECE measurement is closer to the O-point of them/n=1/1 magnetic island at the low-field side, while it is near the X-point at the high-field side.
In the present experiment, the spatial resolution of both the density and temperature profile measurements at the plasma edge may be insufficient to resolve the fine structure of the edge magnetic islands, which are of the order of a few centimeters in size.Nevertheless, effects of the magnetic islands on the plasma profiles, especially at the plasma core,can already be observed.
3.4.Comparison with results calculated by vacuum approximation method
In the ‘vacuum approximation’ method, the magnetic field is defined by
WhereB2D,eqis a converged 2D MHD equilibrium by solving the Grad-Shafranov equation andB3D,RMPis the vacuum RMP field (usually given by Biot–Savart law).No plasma equilibrium responses has been taken into account in this vacuum model.Therefore, no change in both the plasma pressure profile and the plasma current distribution can be considered even with RMPs applied.The plasma response appears through the 2D MHD equilibrium only and does not react to the RMP fields.To highlight the significance of the 3D equilibrium effect for self-consistent equilibrium calculation,we compare radial plasma pressure profiles and plasma current density profiles at the horizontal mid-plane calculated by the EFIT code and by the HINT code at different toroidal cross-sections.These profiles are shown in figure 7 (pressure profiles)and figure 8(current density profiles).For the HINT calculations, we scanned the RMP coil current through three different amplitudes of 1 kA,2 kA and 3 kA(which were also applied in the experiment, as shown in figure 1).
At the low-field side, the horizontal plane crosses the magnetic islands X-point at Φ=0° and their O-point at Φ=180°.Deviations in the pressure profiles and current density distributions can be especially seen in the region around the rational surfaces.A flat section appears in the calculation results of the HINT model at Φ= 180°(red lines).The flattening becomes more pronounced with increasing RMP current.For the pressure profiles through the X-point,both the plasma pressure gradient and the current density gradient around theq=2 surface become even steeper with increasing RMP current, and the differences to the profiles through the O-point also become larger.While the pressure profiles through the O-point(red lines)show a flattening near theq=2 surface, the X-point profiles (blue lines) are flattened only on the (minor radially) outward side of the island chain.This is related to enhanced stochastization on the outside of the island, which will be discussed further below.
The Poincaré plots of magnetic topology calculated by vacuum model and HINT at Φ=0° forIRMP=3 kA are given in figure 9.Compared with the HINT calculation, them/n=1/1 magnetic island is larger and the stochastic effect at the edge region is more pronounced for the vacuum model.In addition,some sideband mode structures are more obvious in the HINT model (e.g.them/n=3/2 magnetic island).The X-points of them/n=2/1 and 3/1-islands show the highest differences (marked with rectangles in figure 9).
Figure 10 shows Poincaré plots at the X-point of them/n=2/1 magnetic island for two different RMP coil currents.WithIRMP=1 kA,them/n=2/1 islands calculated by both vacuum and HINT models are narrow, but of similar width,and the stochastization effect around the X-point is weak.In the cases withIRMP=3 kA,the stochastization effect around the X-point is more pronounced in the HINT model.The stochastization is more pronounced outside of the X-point,which explains the asymmetrically flattened pressure profile shown before in figure 7.
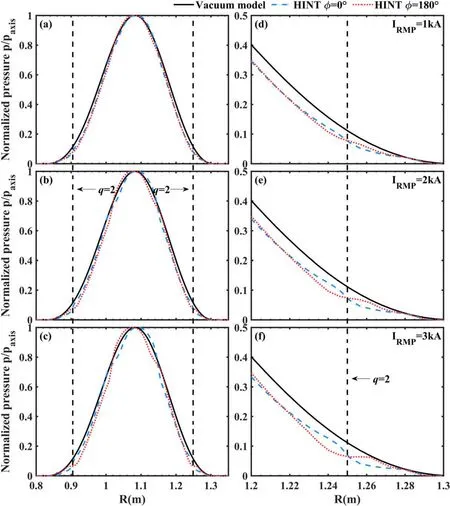
Figure 7.Pressure profiles of the vacuum model(black lines)and HINT model at two cross-sections(blue lines for Φ=0°and red lines for Φ=180°) for three different RMP currents.(a) Profiles for IRMP=1 kA, (b) profiles for IRMP=2 kA, (c) profiles for IRMP=3 kA, (d)detailed profiles at the low-field side around the q=2 surface for IRMP=1 kA,(e)detailed profiles at the low-field side around the q=2 surface for IRMP=2 kA, (f) detailed profiles at the low-field side around the q=2 surface for IRMP=3 kA.
For both models, the connection length plots forIRMP=3 kA around the X-point of the 3/1 magnetic islands(which are located at the plasma boundary) are compared in figure 11.In the vacuum model(figure 11(a)),there are more magnetic field lines with a connection length below 2000 m,indicating that the stochastization effect is more significant in the vacuum model.Even atr~ 0.22 m,there are quite a few open field lines.In the HINT calculation (figure 11(b)), the stochastization effect is reduced, and the region where the field line connection length remains at infinity becomes larger,suggesting a better edge confinement in the HINT results compared to the vacuum model.
The toroidal Poincaré plots of both models atZ=0 are given in figure 12,and enlarged plots,around them/n=1/1 island at the low-field side,are shown in figure 13.Due to an uneven Shafranov shift, depending on the toroidal crosssection, a helical core is formed (see figure 14 for the magnetic axis shape in the HINT equilibrium).The island O-point and X-point lie at differing major radii in the HINT model compared with that in the vacuum model.These discrepancies are caused by the equilibrium response effect.In the vacuum model shown in figure 13(a),the magnetic island is approximately symmetrical, and the black line across the X-point also passes slightly inside of the O-point of the magnetic island.However,in the HINT model(figure 13(b)),the magnetic island is deformed, and the red line across the island’s X-point passes outside of the O-point.In addition,the positions of the two lines (which indicate X-point locations)also differ from each other, which can also be related to the island shape change in the HINT model.
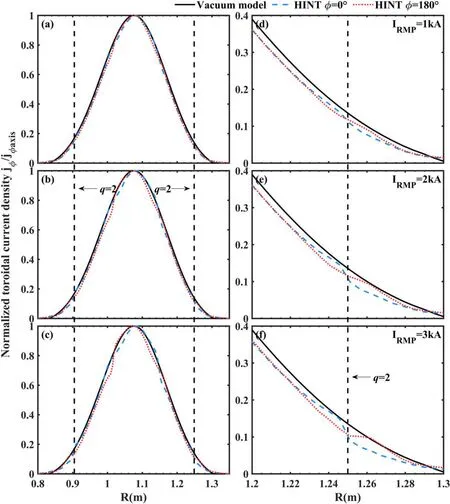
Figure 8.Toroidal current density profiles of the vacuum model(black lines)and HINT model at two cross-sections (blue lines for Φ=0°and red lines for Φ=180°) for three different RMP currents.(a) Profiles for IRMP=1 kA, (b) profiles for IRMP=2 kA, (c) profiles for IRMP=3 kA,(d)detailed profiles at the low-field side around the q=2 surface for IRMP=1 kA,(e)detailed profiles at the low-field side around the q=2 surface for IRMP=2 kA, (f) detailed profiles at the low-field side around the q=2 surface for IRMP=3 kA.
In figure 14,the position of magnetic axis in bothRandZdirections oscillates with ann=1 dominant structure fromR=1.09 m to 1.075 m andZ=−0.01 m to +0.01 m.Therefore, a helical core is formed.
In the HINT model,the modified Pfirsch-Schlüter current density distribution driven by the pressure gradient around the islands is taken into account.The Pfirsch-Schlüter current is induced by the equilibrium response to the finite plasma pressure gradient,and implicitly modeled in the HINT code’s magnetic relaxation process.The redistribution of plasma pressure due to the equilibrium response to the applied RMP field changes the distribution of current density selfconsistently, and the parallel Pfirsch-Schlüter current distribution also changes accordingly.The vacuum model,however,does not consider the feedback effect of the pressure distribution of the 3D magnetic field, resulting in differing results calculated by the two models.To understand the influence of the 2/1 magnetic island on the magnetic fieldline distribution in the plasma region more precisely, the 3D equilibrium calculation based on HINT (or similar codes) is necessary.
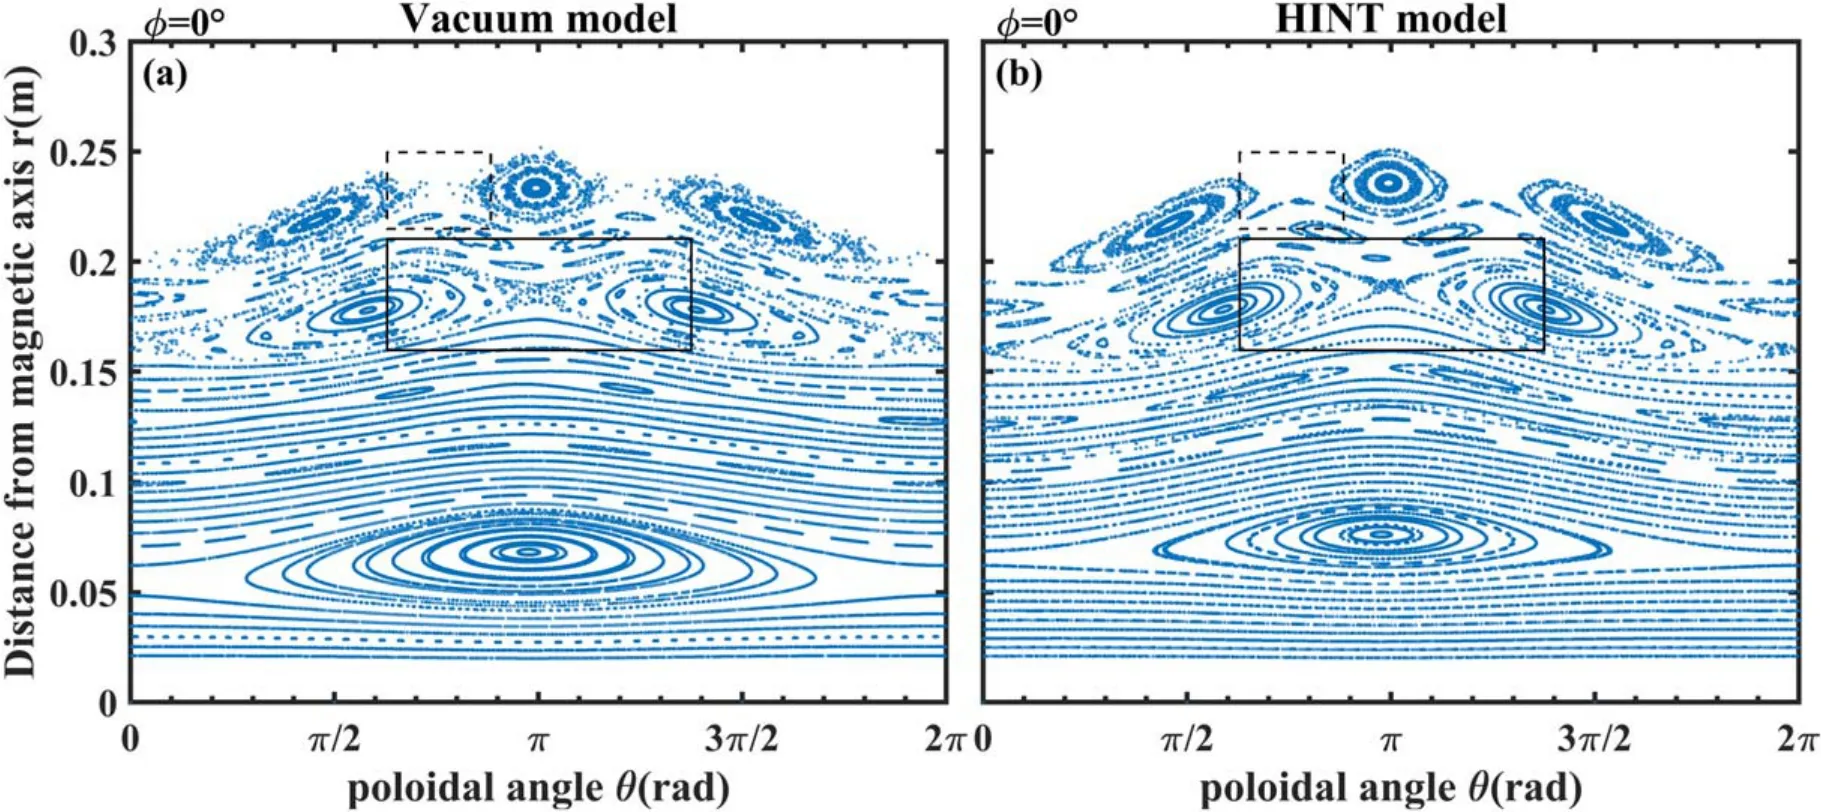
Figure 9.Poincaré plots of the vacuum approximation model and HINT model at Φ = 0° for IRMP=3 kA.(a) Vacuum model, (b) HINT model.The solid rectangle marks an X-point of the 2/1 magnetic island chain and the dashed rectangle marks an X-point of 3/1 magnetic island chain.
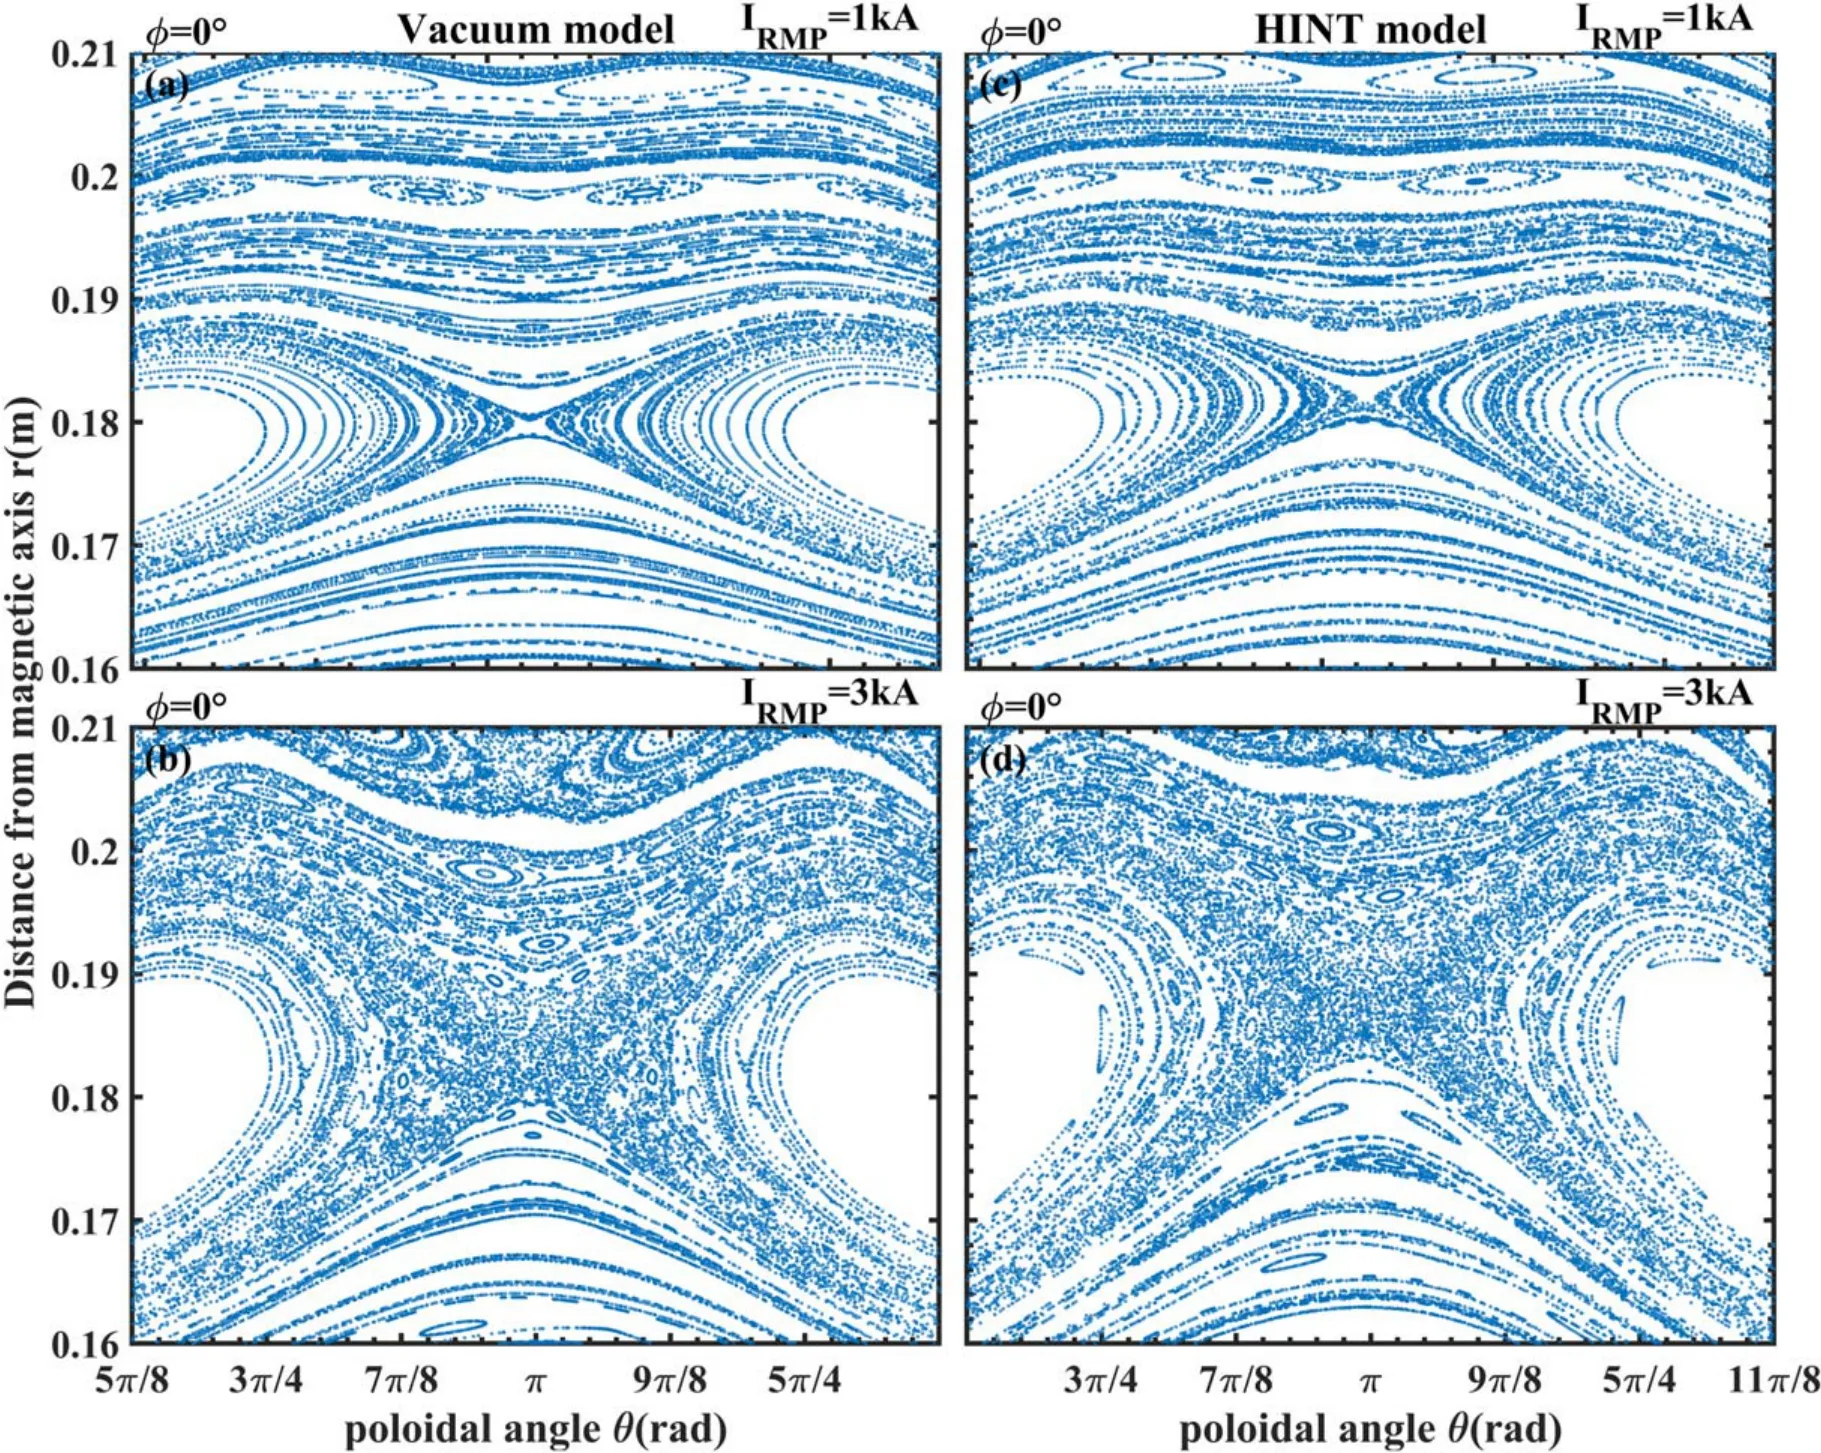
Figure 10.Detailed Poincaré plots of the vacuum model and HINT model of the solid rectangle area in figure 9.(a)IRMP=1 kA in vacuum model, (b) IRMP=3 kA in vacuum model, (c) IRMP=1 kA in HINT model, (d) IRMP=3 kA in HINT model.
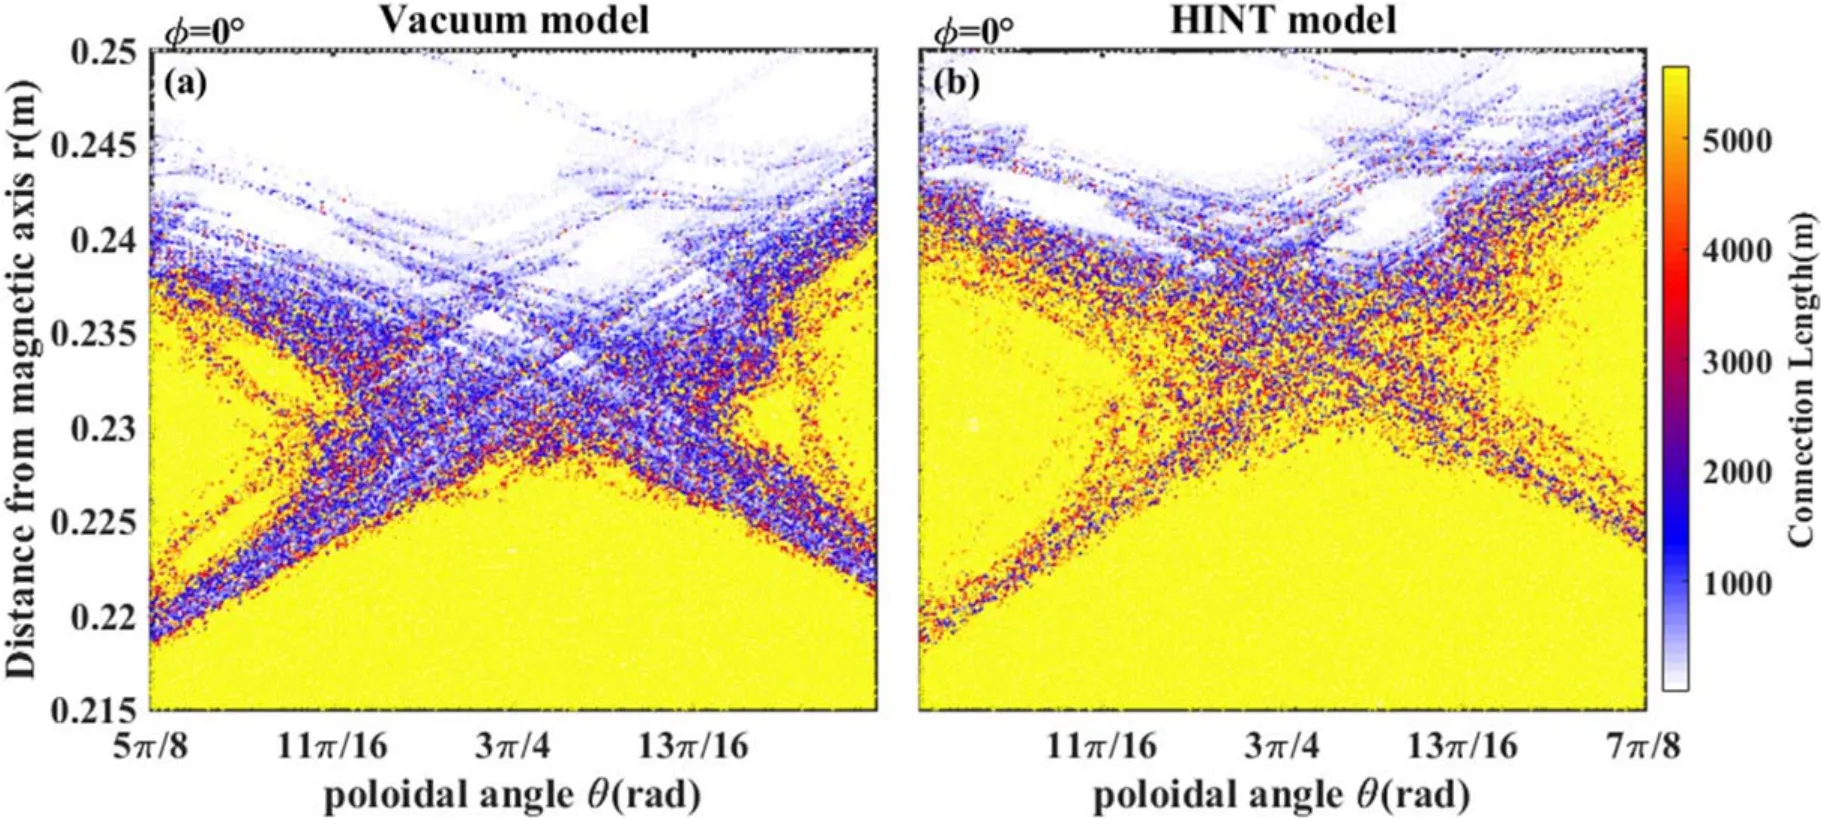
Figure 11.Connection length plots of the vacuum model and HINT model of the dashed rectangle area in figure 9.(a) Vacuum model, (b)HINT model.
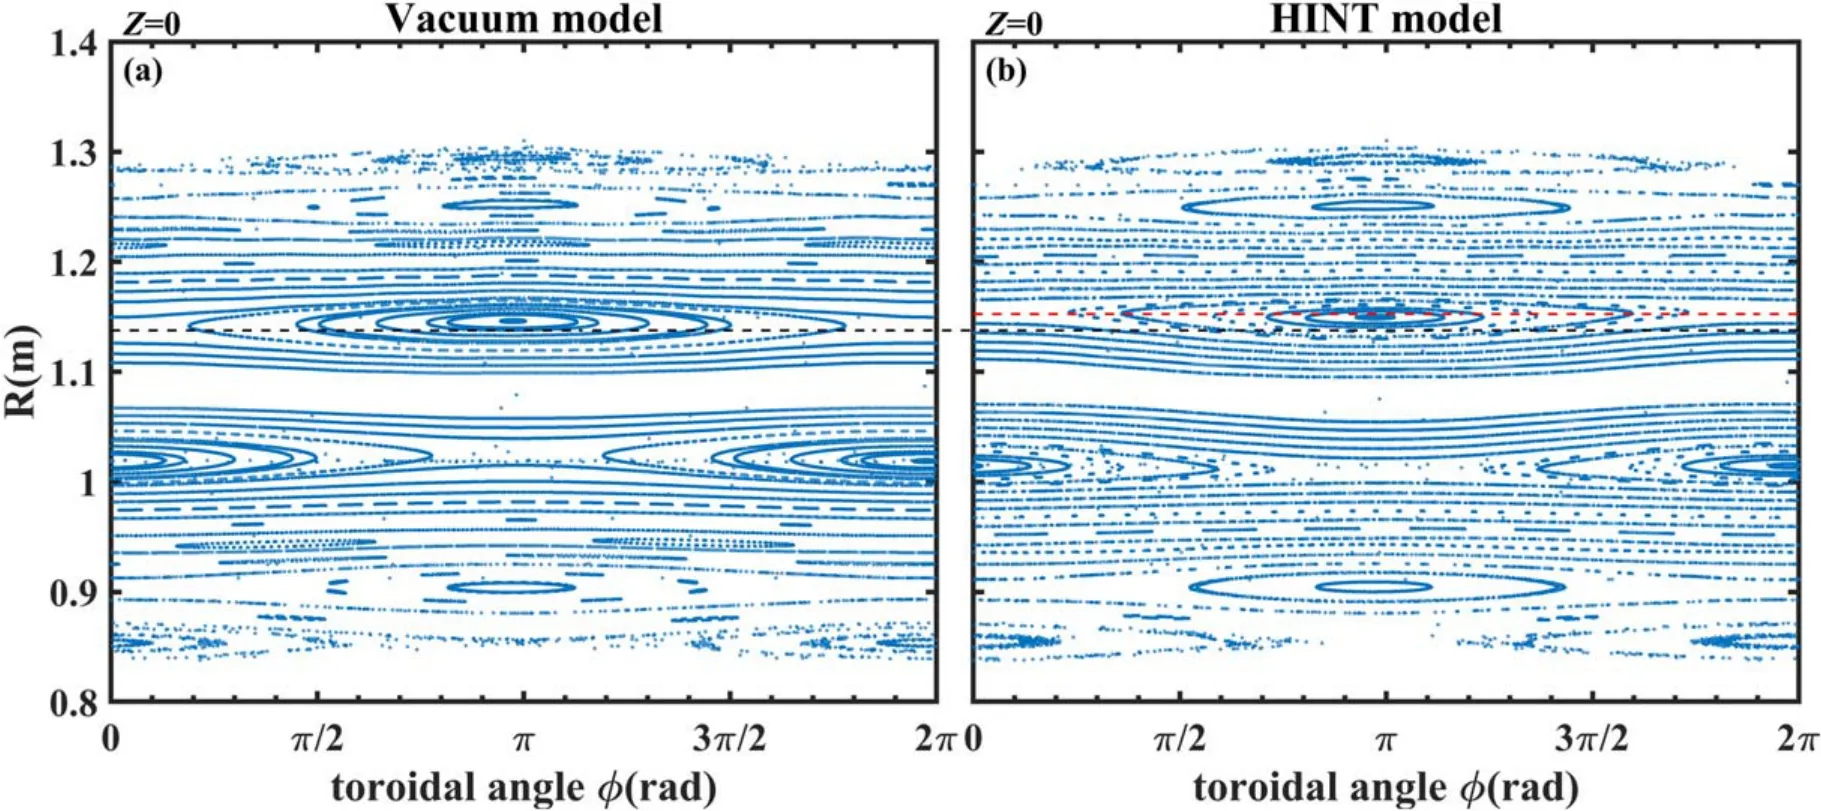
Figure 12.Poincaré plots of the vacuum model and HINT model at the horizontal plane Z=0.(a) Vacuum model, (b) HINT model.
4.Discussion and conclusions
The 3D equilibrium calculation code HINT has been applied for studying the MHD equilibrium state of a plasma with an RMP inducedm/n=2/1 magnetic island chain on the J-TEXT tokamak.The measured plasma profiles were related to the calculated magnetic topologies.
According to the 3D equilibrium calculation results,during RMP field penetration, the toroidal symmetry of the tokamak plasma was broken, and a stable helical core was formed as discussed in section 3.4.This may provide a possible explanation for the disappearance of the sawtooth oscillation.
The formation of edge magnetic islands predicted by the 3D MHD equilibrium calculation may possibly explain why,during the excitation of them/n=2/1 locked mode on J-TEXT, the sudden drop of edge density occurs not only within theq=2 flux surface, but also at the plasma boundary.Unfortunately, high-resolution plasma parameter measurements at the plasma edge were not available during the RMP penetration experiments.
In the calculation of HINT, the plasma rotation effect is not considered.Although the modeling of plasma rotation in the HINT code was discussed briefly in the previous paper[25],the screening effect of plasma rotation is still an issue in progress.As a result, in the HINT version we used in this paper,flow effects are not included.In addition,according to
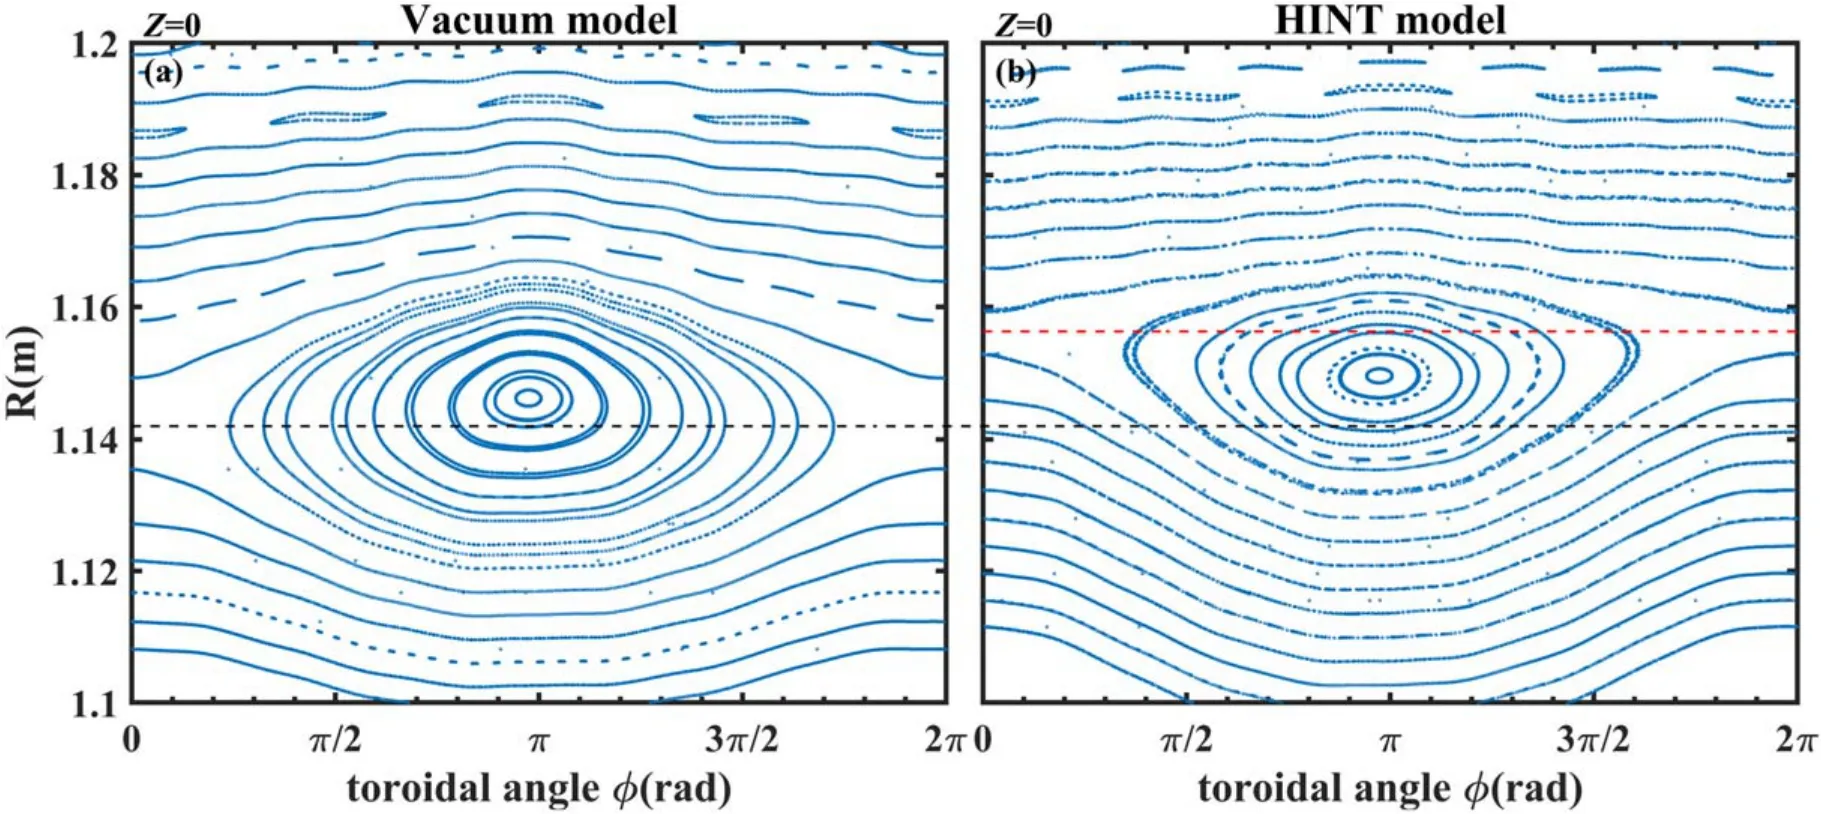
Figure 13.Enlarged area around the m/n =1/1 island at the low-field side of Poincaré plots of the vacuum model and HINT model at the horizontal plane Z=0.(a) Vacuum model, (b) HINT model.
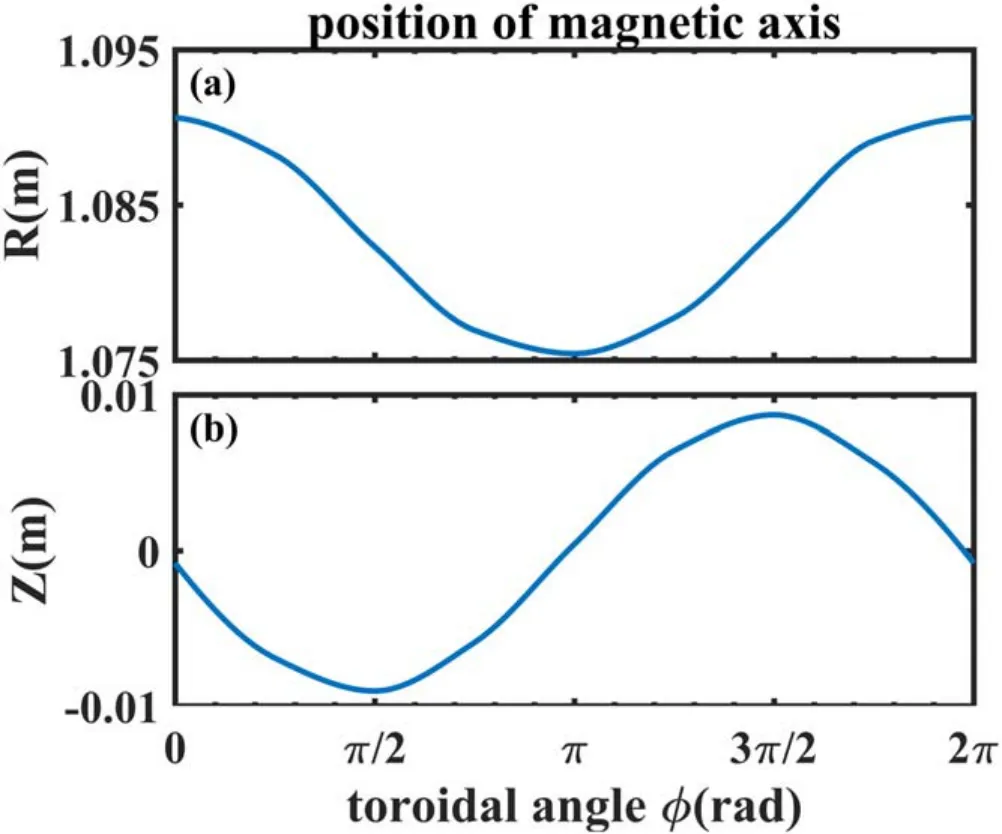
Figure 14.Position of the magnetic axis in the HINT equilibrium with RMP at different toroidal angles.
figure 1(h), the plasma MHD frequency at theq=2 surface is zero after field penetration.Besides, the change of plasma flow towards ion diamagnetic direction can be seen in figure 1(i); once the field penetration occurs, the rotation screening effects on the calculated results can be ignored.
At present, as Ohmic heating is also the main method of heating on J-TEXT, and the electron cyclotron resonance heating method is in progress, the achieved β is relatively small.As the equilibrium effect under small β has limited influence on magnetic islands,the magnetic islands calculated using two different methods are not yet experimentally distinguishable.However, it is foreseen that the two models diverge more substantially at a higher plasma beta than currently achieved in J-TEXT.
To conclude, the first 3D equilibrium calculation for the plasma with the RMP inducedm/n=2/1 locked modes on J-TEXT has been carried out and validated with experimental observations.The changes in both the measured plasma density and temperature profiles are visibly correlated to the region where the magnetic topology was modified significantly in the simulations.The stochastization effect, the shape of magnetic islands, and the distribution of plasma pressure calculated by HINT show significant difference from results obtained using a vacuum approximation method.These findings suggest that the 3D plasma equilibrium response should always be considered while studying the impact of magnetic topology on the plasma transport and stability in high beta plasmas in RMP scenarios.
Acknowledgments
The authors are very grateful for the instructive discussions with many colleagues:Y P Zhang,D L Han,Y He,Q L Yang,F Y Mao,Z K Ren,C X Zhao,J C Li,X Xu,R H Tong,C H Li and W Bai.This work was supported by the National Key R&D Program of China (No.2018YFE0309100), and by National Natural Science Foundation of China (No.51821005).
猜你喜欢
杂志排行

Plasma Science and Technology的其它文章
- Two-point model analysis of SOL plasma in EAST
- Line identification of boron and nitrogen emissions in extreme- and vacuumultraviolet wavelength ranges in the impurity powder dropping experiments of the Large Helical Device and its application to spectroscopic diagnostics
- Landau damping of twisted waves in Cairns distribution with anisotropic temperature
- Effects of magnetic field on electron power absorption in helicon fluid simulation
- Dependence of plasma structure and propagation on microwave amplitude and frequency during breakdown of atmospheric pressure air
- Machine learning application to predict the electron temperature on the J-TEXT tokamak