Line identification of boron and nitrogen emissions in extreme- and vacuumultraviolet wavelength ranges in the impurity powder dropping experiments of the Large Helical Device and its application to spectroscopic diagnostics
2021-08-05TetsutarouOISHI大石鉄太郎NaokoASHIKAWA芦川直子FedericoNESPOLISuguruMASUZAKI増崎貴MamoruSHOJI庄司主EricGILSONRobertLUNSFORDShigeruMORITA森田繁MotoshiGOTO後藤基志YasukoKAWAMOTO川本靖子ChihiroSUZUKI鈴木千尋ZhenSUN孙震AlexNAGYDavidGATESandTomohiroMORIS
Tetsutarou OISHI (大石鉄太郎), Naoko ASHIKAWA (芦川直子),Federico NESPOLI, Suguru MASUZAKI (増崎貴), Mamoru SHOJI (庄司主),Eric P GILSON, Robert LUNSFORD, Shigeru MORITA (森田繁),Motoshi GOTO (後藤基志), Yasuko KAWAMOTO (川本靖子),Chihiro SUZUKI(鈴木千尋),Zhen SUN(孙震),Alex NAGY,David A GATES and Tomohiro MORISAKI (森崎友宏)
1 National Institute for Fusion Science,National Institutes of Natural Sciences,322-6 Oroshi-cho,Toki 509-5292, Gifu, Japan
2 Department of Fusion Science, The Graduate University for Advanced Studies, SOKENDAI, 322-6 Oroshi-cho, Toki 509-5292, Gifu, Japan
3 Princeton Plasma Physics Laboratory, 100 Stellarator Road, Princeton, NJ 08540, United States of America
Abstract An impurity powder dropper was installed in the 21st campaign of the Large Helical Device experiment (Oct.2019–Feb.2020) under a collaboration between the National Institute for Fusion Science and the Princeton Plasma Physics Laboratory for the purposes of real-time wall conditioning and edge plasma control.In order to assess the effective injection of the impurity powders,spectroscopic diagnostics were applied to observe line emission from the injected impurity.Thus,extreme-ultraviolet (EUV) and vacuum-ultraviolet (VUV) emission spectra were analyzed to summarize observable impurity lines with B and BN powder injection.Emission lines released from B and N ions were identified in the EUV wavelength range of 5–300 Å measured using two grazing incidence flat-field EUV spectrometers and in the VUV wavelength range of 300–2400 Å measured using three normal incidence 20 cm VUV spectrometers.BI–BV and NIII–NVII emission lines were identified in the discharges with the B and BN powder injection, respectively.Useful B and N emission lines which have large intensities and are isolated from other lines were successfully identified as follows: BI (1825.89, 1826.40) Å (blended), BII 1362.46 Å, BIII (677.00, 677.14,677.16) Å (blended), BIV 60.31 Å, BV 48.59 Å, NIII (989.79, 991.51, 991.58) Å (blended), NIV 765.15 Å,NV(209.27,209.31)Å(blended),NVI 1896.80 Å,and NVII 24.78 Å.Applications of the line identifications to the advanced spectroscopic diagnostics were demonstrated,such as the vertical profile measurements for the BV and NVII lines using a space-resolved EUV spectrometer and the ion temperature measurement for the BII line using a normal incidence 3 m VUV spectrometer.
Keywords:plasma spectroscopy,extreme ultraviolet, vacuum ultraviolet, magnetically confined fusion, impurity seeding, wall conditioning
1.Introduction
Impurity injection experiments using submillimeter-sized powders which consist of a simple substance or chemical compound of low-Zelements,such as Li,B,or N,have been conducted in several magnetically confined torus plasma devices for the purposes of real-time wall conditioning or edge plasma control.According to the results reported in tokamak devices,recycling of neutral H particles was suppressed by B or BN powder injection, which indicated that the injected B impurities contributed a real-time boronization (B wall coating) [1–3].Stabilization of the edge localized mode through modification of edge plasma profiles by injection of Li or B powders has also been reported [4, 5].Establishment of this kind of real-time plasma control method becomes more important in plasma confinement experiments with longer discharge pulses that progress toward the realization of thermonuclear fusion reactors with steady-state operation.Thus,the stellarator devices can provide an attractive research platform of investigation on behaviors and roles of injected impurities in steady-state plasma operations.In the Large Helical Device(LHD),an impurity powder dropper(IPD)was installed in the 21st campaign of the experiment (Oct.2019–Feb.2020) under a collaboration between the National Institute for Fusion Science and the Princeton Plasma Physics Laboratory [6].In order to assess the effective injection of the impurity powders, spectroscopic diagnostics were applied to observe line emission from the injected impurity.In the present study,extreme-ultraviolet(EUV)and vacuum-ultraviolet(VUV)emission spectra are analyzed to summarize observable impurity lines with B and BN powder injection.Based on the line identification, applications of the observed line to advanced spectroscopic diagnostics are demonstrated such as the spatial profile measurement of the emission intensities or the ion temperature measurement for the injected impurity ions.
2.Spectroscopic diagnostics for the IPD experiment in the LHD
The LHD is a superconducting plasma confinement device which employs a heliotron magnetic configuration.The plasma in the standard configuration has major and averaged minor radii of 3.6 and 0.64 m,respectively[7].The coil system consists of a set of two continuous superconducting helical coils with poloidal and toroidal pitch numbers of 2 and 10, respectively, and also three pairs of superconducting poloidal coils.The observation geometry of the spectroscopic diagnostics in the LHD, which includes two flat-field grazing incidence EUV spectrometers(denoted as‘EUV Short’[8]and‘EUV Long’[9]),three 20 cm normal incidence VUV spectrometers(denoted as‘VUV 109L’,‘VUV 106R’, and ‘VUV 102R’ [10]), a space-resolved EUV spectrometer(denoted as‘EUV Short2’[11]),and a 3 m normal incidence VUV spectrometer (denoted as ‘VUV 3 m’ [12]), is illustrated in figure 1.Figure 1(a)shows a top view of the optical axes of the spectrometers and vacuum magnetic surfaces with a magnetic axis positionRaxof 3.6 m.
All of the spectroscopic diagnostics systems are located at an outer port of the LHD which is called‘10-O’.The IPD is installed at an upper port called‘2.5-U’,which is separated by 90° clockwise in the toroidal direction from the 10-O port.The detailed location of IPD installation was decided based on a simulation study on powder trajectory calculated with the coupled EMC3-EIRENE and DUSTT codes [13].The powders are dropped into the plasma by vibrating the powder reservoirs by piezo blades with an injection rate which can be scanned from a few 10 μg s−1to 900 mg s−1[14].The IPD is equipped with an accelerometer to measure the amplitude of the vibration of the powder reservoirs.A flowmeter consisting of a collimated beam of visible light crossing a guide tube through which the powders fall, and a light detector, is installed in the IPD to measure the injection rate of the powders.The injection rate is obtained by measuring the attenuation of the visible light in the flowmeter.The diameters of B and BN powder particles are roughly 150 μm and 60 μm,respectively.In the powder dropping experiments described in the next chapter, three kinds of spectroscopic measurements are conducted as follows.
(1)EUV and VUV wavelength spectral measurements with high time resolution: the spectrometers of EUV Short,EUV Long, VUV 109L, VUV106R, and VUV102 cover the wavelength ranges of 5–60 Å, 100–300 Å,300–1050 Å,970–1870 Å,and 1510–2400 Å,respectively.The vertical observation range on a plasma cross section including optical axes of these spectrometers is illustrated in figure 1(b).CCD detectors (1024×256 pixels, pixel size 26×26 μm2, Andor DO420-BN) are placed at the positions of the exit slits of the spectrometers.A CCD data acquisition operational mode applied in this experiment is called‘full-binning’mode in which all CCD pixels aligned in the vertical direction are replaced by a single channel and the vertical spatial resolution is entirely eliminated.A time resolution for the spectral measurements is 5 ms with the full-binning data acquisition mode.
(2)Emission intensity profile measurement with spaceresolved EUV spectroscopy: EUV Short2 has a spatial resolution in the vertical direction by mounting a spaceresolved slit at the position of the entrance slit.A CCD detector (1024×255 pixels, pixel size 26×26 μm2,Andor DO920P-BN) is placed at the positions of the exit slits of the spectrometer.The long axis of the detector plane is directed perpendicular to the midplane of the LHD plasma and the spatial observation range is set to project the emission profile of the upper half of the plasma at the horizontally elongated poloidal cross section on the detector.Five-pixel binning is applied to the long axis of the detector with 1024 pixels.Thus,the observation range is resolved by 204 viewing chords in the vertical direction.The observation range covers approximately 500 mm in the vertical direction with the spatial resolution of 2.6 mm around the plasma center as illustrated in figure 1(c).The short axis of the detector is directed to the wavelength dispersion direction and twopixel binning is applied.The temporal resolution is 100 ms under the operational conditions employed in this study.The wavelength range is set to cover 40–58 Å to observe vertical intensity profiles of BV 48.59 Å and NVII 24.78×2 Å simultaneously.
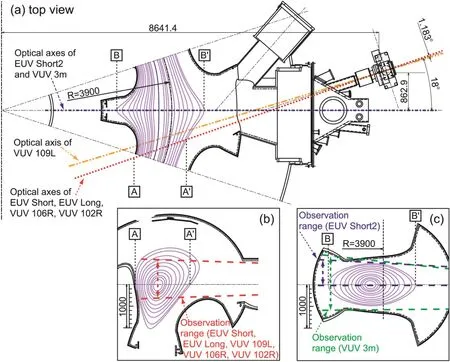
Figure 1.Observation geometry of EUV and VUV spectroscopy diagnostics in the LHD.(a) Top view of optical axes of two grazing incidence flat-field EUV spectrometers (‘EUV Short’ and ‘EUV Long’), three normal incidence 20 cm VUV spectrometers (‘VUV 109L’,‘VUV 106R’, and ‘VUV 102R’), a space-resolved EUV spectrometer (‘EUV Short2’), and a normal incidence 3 m VUV spectrometer(‘VUV 3 m’) shown together with magnetic surfaces (Rax=3.6 m).(b) Plasma cross section including the vertical observation range of(b) EUV Short, EUV Long, VUV 109L, VUV 106R, and VUV 102R, and (c) EUV Short2 and VUV 3 m.
(3)Impurity ion temperature measurement with high spectral resolution VUV spectroscopy: a 3 m normal incidence VUV spectrometer has been developed to measure the radial distribution of VUV lines in the wavelength range of 300–3200 Å in the edge plasmas of LHD.A CCD detector (1024×1024 pixels, pixel size 13×13 μm2,Andor DO934P-BN)is placed at the positions of the exit slits of the spectrometer.The high spectral resolution of the spectroscopic system with the wavelength dispersion of 0.037 Å/CCD pixel enables us to measure the Doppler profiles of impurity line spectra precisely.The vertical observation range covers the entire vertical height of the LHD plasmas at the horizontally elongated poloidal cross section as illustrated in figure 1(c).The temporal resolution is 20 ms with a full-binning CCD data acquisition mode.The line shape of the wavelength spectrum has a Gaussian profile if the ions are assumed to have a Maxwellian velocity distribution.The wavelength range is set to cover 1350–1387 Å to observe the spectral shape of BII 1362.46 Å.
3.EUV and VUV spectra of boron and nitrogen emissions
3.1.Spectra in the boron powder dropping experiments
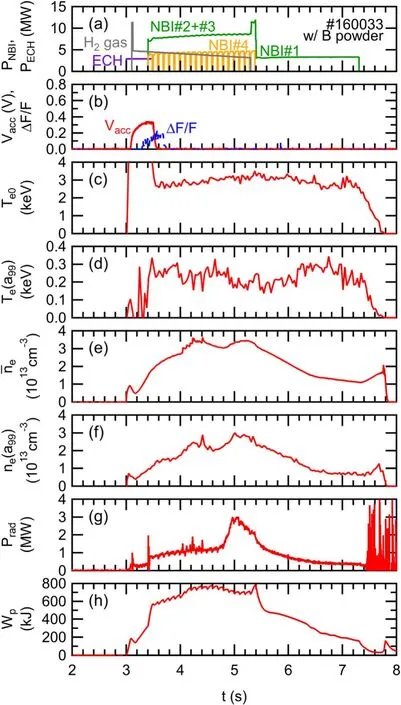
Figure 2.Typical waveform of the B powder dropping experiment in the LHD: (a) heating power of ECH and NBI, and gas-puffing duration of H2, (b) amplitude of accelerometer signal Vacc and attenuation of flowmeter signal ΔF/Fof the IPD,(c)central electron temperature Te0, (d) edge electron temperature Te(a99), (e) lineaveraged electron density ne, (f) edge electron density ne(a99),(g) total radiated power Prad, and (h) plasma stored energy Wp.
Figure 2 shows a typical waveform of a B powder dropping experiment in LHD withRaxof 3.6 m and toroidal magnetic fieldBtof 2.75 T in the counter-clockwise direction from the top view.In this figure, the temporal evolution of (a) the heating power of electron cyclotron heating (ECH) and neutral beam injection (NBI), and gas-puffing duration of H2,(b) the amplitude of the accelerometer signalVaccand attenuation of flowmeter signal ΔF/Fof the IPD, (c) the central electron temperatureTe0, (d) the edge electron temperatureTe(a99), (e) the line-averaged electron densityne,(f) the edge electron densityne(a99), (g) the total radiated powerPrad, and (h) the plasma stored energyWpare plotted together.The plasma edgea99was defined as the effective minor radius in which 99% of electron stored energy was enclosed [15].The plasma was initiated by ECH and further heated by NBI.H2gas was puffed from 3.1 to 5.3 s to control the electron density.A voltage is applied to the IPD feeder piezoelectric blades from 3.0 to 3.5 s as indicated in the signal ofVaccin figure 2(b).As shown in the figures, signals of plasma response to the powder injection are observed at 4.0 s such as an increase inne,ne(a99),andWp,a slight decrease inTe(a99), and positive spikes inPrad.It has already been confirmed that a typical time delay is about 1 s from the onset of the voltage application to the IPD feeder piezoelectric blade to the response by the plasma [6].
Figure 3 shows EUV/VUV spectra including B line emissions.The spectral data were averaged over 3.5–3.6 s(blue dashed lines, before B powders reach the plasma) and 5.0–5.1 s (red solid lines, after B powders reach the plasma).Identification of B line emissions were conducted based on the wavelength database of NIST [16] for BI–BV lines.The wavelengths of the blended lines are noted in parentheses.
As shown in figure 3, clear emission lines of BIV 60.31 Å and BV 38.87 Å, 41.00 Å, and 48.59 Å were observed in the 5–60 Å wavelength range measured by the ‘EUV Short’spectrometer.The 100–300 Å wavelength range measured by the‘EUV Long’ spectrometer included higher-order emissions of BIV and BV with relatively strong intensities.In the 300–1050 Å wavelength range measured by the ‘VUV 109L’ spectrometer,many weak lines such as BII (882.50, 882.55, 882.68) Å, BIII(465.55,465.62)Å,(510.77,510.85,510.86)Å,(677.00,677.14,677.16) Å, and (758.48, 758.67) Å, BIV (384.95, 384.98,385.03) Å and (406.78, 406.81, 406.87) Å, and BV (749.41,749.74, 749.84) Å were observed.In the 970–1870 Å wavelength range measured by the ‘VUV 106R’ spectrometer, the most remarkable lines were BII 1362.46 Å and (1623.60,1623.79, 1623.95, 1624.02, 1624.17, 1624.38) Å.In the 1510–2400 Å wavelength range measured by the ‘VUV 102R’spectrometer,BI(1825.89,1826.40)Å and BII 1842.82 Å were observed.At present, the line identifications in the wavelength range of 60–100 Å have not been conducted because this wavelength range was not measured in the discharges which were presented in this paper.We can control the observable wavelength range of the EUV Short spectrometer from 5–60 Å to the longer wavelength range, 40–130 Å at maximum, or that of the EUV Long spectrometer from 100–300 Å to the shorter wavelength range, 60–220 Å at minimum.Therefore, it is possible to measure 60–100 Å by optimizing the wavelength ranges of these two spectrometers in future experiments.

Figure 3.EUV/VUV spectra including B line emissions observed in a discharge with B powders in(a)5–60 Å measured by the‘EUV Short’spectrometer, (b) 100–300 Å measured by the ‘EUV Long’ spectrometer, (c) 300–1050 Å measured by the ‘VUV 109L’ spectrometer,(d)970–1870 Å measured by the‘VUV 106R’spectrometer,and(e)1510–2400 Å measured by the‘VUV 102R’spectrometer.The spectra were averaged over 3.5–3.6 s (blue, before B powders reach the plasma) and 5.0–5.1 s (red, after B powders reach the plasma).

Figure 4.Temporal evolutions of BI–BV intensities observed in a discharge with B powders which were integrated over wavelength ranges of (a) 1824.26–1827.82 Å for BI (1825.89, 1826.40) Å,(b) 1360.92–1364.46 Å for BII 1362.46 Å, (c) 674.96–678.34 Å for BIII (677.00, 677.14, 677.16) Å, (d) 120.31–120.94 Å for BIV 60.31×2 Å, and (e) 48.50–48.78 Å for BV 48.59 Å.
Figure 4 shows temporal evolutions of BI–BV emission intensities observed in a discharge with B powders of which the wavelength spectra were integrated over the wavelength ranges as follows:(a)1824.26–1827.82 Å for BI(1825.89,1826.40)Å,(b)1360.92–1364.46 Å for BII 1362.46 Å,(c)674.96–678.34 Å for BIII (677.00, 677.14, 677.16) Å, (d) 120.31–120.94 Å for BIV 60.31×2 Å, and (e) 48.50–48.78 Å for BV 48.59 Å.Background levels of the signals, which mainly consist of bremsstrahlung emission, were subtracted from the raw signals to obtain the intensities of the line emission.The values of ionization potentialEiof BI–BV are 8,25,38,259,and 340 eV,respectively.The electron temperature at the location from which each line is emitted has a value related toEiof each line.Therefore,the BI,BII,and BIII lines are emissions from B ions distributed in the edge plasmas outside the last closed flux surface(LCFS)or divertor plasmas with low electron temperature.On the other hand, the BIV and BV emission lines are considered to originate inside the LCFS.As shown in figure 4,the BIV and BV signals exhibited steep spikes in 4.0–4.5 s coincident with the spikes inPradfollowed by a gradual increase in the signals of all charge states from 4.7 s together with increases inPrad,ne, andne(a99), and a slight decrease inWp.Even though the reason why BIV and BV responded to the powder injection earlier than BI–BIII has not been clarified yet,one possible interpretation is that powders first penetrated into the plasmas through the LCFS and then ablated; thereafter, B ions were transported toward the edge plasmas.The detailed mechanisms of the powder ablation and ion transport processes should be investigated in future studies for a comprehensive understanding of the behaviors of the injected B ions.The deposition depth and ablation profile of the powders are very important information for the impurity powder injection experiment.For more detailed discussion, combination of the line intensity measurement together with the spatial profile measurement,which will be described in section 4.1,is required.
3.2.Spectra in the boron nitride powder dropping experiments

Figure 5.Typical waveform of a BN powder dropping experiment in LHD: (a) heating power of ECH and NBI, and gas-puffing duration of H2, (b) amplitude of accelerometer signal Vacc and attenuation of flowmeter signal ΔF/F of the IPD, (c) central electron temperature Te0,(d)edge electron temperature Te(a99),(e)line-averaged electron density ne, (f)edge electron density ne(a99),(g)total radiated power Prad, and (h) plasma stored energy Wp.
Figure 5 shows a typical waveform of a BN powder dropping experiment in the LHD.The physical quantities plotted in this figure, the magnetic configuration, the heating and fueling patterns,and the onset and the duration of the voltage applied to the IPD feeder piezoelectric blades are the same as those of the discharge in figure 2.As shown in the figures, signals of the plasma response to the powder injection are observed at 4.2 s such as the increase inne,ne(a99),Prad, andWp.
Figure 6 shows EUV/VUV spectra including B and N line emissions.The spectral data were averaged over 3.5–3.6 s(blue dashed lines,before BN powders reach the plasma)and 4.5–4.6 s (red solid lines, after BN powders reach the plasma).

Figure 6.EUV/VUV spectra including B and N line emissions observed in a discharge with BN powders in (a) 5–60 Å measured by the‘EUV Short’ spectrometer, (b) 100–300 Å measured by the ‘EUV Long’ spectrometer, (c) 300–1050 Å measured by the ‘VUV 109L’spectrometer,(d)970–1870 Å measured by the‘VUV 106R’spectrometer,and(e)1510–2400 Å measured by the‘VUV 102R’spectrometer.The spectra were averaged over 3.5–3.6 s (blue, before BN powders reach the plasma) and 4.5–4.6 s (red, after BN powders reach the plasma).
Identification of N line emissions was conducted for NIII–NVII lines.As shown in figure 6,clear emission lines of NVI 28.79 Å and 29.08 Å and NVII 20.91 Å and 24.78 Å were observed in 5–60 Å measured by the ‘EUV Short’spectrometer.The 100–300 Å wavelength range measured by the‘EUV Long’spectrometer included peaks of NV(209.27,209.31) Å and (247.56, 247.71, 247.72) Å.In the 300–1050 Å wavelength range measured by the‘VUV 109L’spectrometer, NIII (989.79, 991.51, 991.58) Å and NIV 765.15 Å were clearly observed.In order to consider whether the NIV 765.15 Å are blended with NIII 763.34 Å and 764.36 Å or not, we compared the temporal evolution of the intensity of the NIV 765.15 Å to those of NIV (921.99,922.52, 923.06, 923.22, 923.68, 924.28) Å observed in the 300–1050 Å wavelength range and NIV 1718.55 Å observed in the wavelength ranges of both 970–1870 Å measured by the‘VUV 106R’spectrometer and 1510–2400 Å measured by the‘VUV 102R’spectrometer.Since the temporal evolutions of these NIV lines were quite similar to each other,we judged that the NIV 765.15 Å has a low possibility to be blended with other lines.In the 970–1870 Å wavelength range, NV(1238.82, 1242.80) Å were also observed.In the 1510–2400 Å wavelength range, NVI 1896.80 Å and NVI(1907.30, 1907.90) Å were observed with relatively strong intensities.
Figure 7 shows temporal evolutions of BI–BV and NIII–NVII emission intensities observed in a discharge with BN powders.The wavelength range of signal integration for B lines in figures 7(a)–(e) is the same as shown in figure 4.Increases in the signals of BIV and BV from 4.2 s were faster than those of BI, BII, and BIII, which is similar to the behavior observed in the B powder dropping discharge as explained in relation to figure 4.The signals for N lines were integrated over wavelength ranges of(f)990.78–993.35 Å for NIII (989.79, 991.51, 991.58) Å, (g) 763.23–766.58 Å for NIV 765.15 Å,(h)208.80–209.59 Å for NV(209.27,209.31)Å, (i) 1894.29–1897.83 Å for NVI 1896.80 Å, and (j)24.65–24.85 Å for NVII 24.78 Å.TheEivalues of NIII–NVII are 47, 77, 98, 552, and 667 eV, respectively.Therefore, the NIII, NIV, and NV lines are emissions from N ions distributed in the edge plasmas outside LCFS while the NVI and NVII emission lines originate inside LCFS.The sharpest increases of the signals seem to be in NIV and NV compared to those in NIII, NVI, and NVII.The sharp increases in NIV and NV signals suggested that the powders might have been ablated outside LCFS followed by the transport of B and N ions to both the higher and the lower sides of the electron temperature.The spike signals in BII and NIII which appeared at 3.0 s in figure 7 are not due to the powder injection.ECH was injected to initiate the discharge at 3.0 s,and then the BII and NIII signals had onset at the same time as the plasma initiation.The emissions from impurity ions in lower charge states such as BII and NIII were observed even in the discharges without the powder injection; therefore, the emission source at this timing was considered to be the impurity ions which were deposited on the surface of the plasma-facing components.Note that the powder size in this BN powder dropping experiment was 60 μm, which was smaller than the B powder dropping experiment with the powder size of 150 μm.If the locations of the powder ablation were actually different between the B and the BN powder dropping experiments analyzed in this paper,the difference in the powder sizes could be one of the reasons for the difference in the locations of the powder ablation.

Figure 7.Temporal evolutions of BI–BV and NIII-NVII intensities observed in a discharge with BN powders.The wavelength range of signal integration for B lines in (a)–(e) are the same as shown in figure 4.The signals for N lines were integrated over wavelength ranges of (f) 990.78–993.35 Å for NIII (989.79, 991.51, 991.58) Å,(g) 763.23–766.58 Å for NIV 765.15 Å, (h) 208.80–209.59 Å for NV(209.27,209.31)Å,(i)1894.29–1897.83 Å for NVI 1896.80 Å,and (j) 24.65–24.85 Å for NVII 24.78 Å.

Table 1.Useful B and N lines for spectroscopic diagnostics observed in this study.Wavelengths of blended lines are enclosed in parentheses.
Further studies of the spatial profiles of the emission lines are necessary to explain the difference or similarity in the temporal evolution of emissions from each charge state.Therefore,it is important for the profile measurements to find and summarize lines which are isolated from other lines in the wavelength and have substantially large intensities.The B and N lines observed in this study are summarized in table 1 together withEifor each charge state as useful tools for further spectroscopic diagnostics.Some of the lines are blended with each other;thus,the wavelengths of the blended lines are enclosed in parentheses in the table.
4.Application of identified lines to advanced spectroscopy
4.1.Emission intensity profile measurement of BV and NVII lines with space-resolved EUV spectroscopy
As stated in the previous chapter,the emission lines identified in this study can be used for spatial profile measurements using space-resolved EUV and VUV spectrometers which have been developed in the LHD [11, 12, 17–19].Figure 8 shows the temporal evolution of vertical profiles of emission intensities of (a)–(c) BV 48.59 Å and (d)–(f) NVII 24.78×2 Å measured using the ‘EUV Short2’ spectrometer in a discharge with BN powders.In this profile measurement,the observation chords are aligned vertically in the observation range as illustrated in figure 1(c).The horizontal axis in figure 8 is the position of each observation chord at the major radius ofR=3600 mm.The position of the LCFS in the vacuum magnetic field is also indicated.The BV emission profile has a peak atZ=450 mm as shown in figures 8(a)–(c)while the NVII emission profile has a peak atZ=420 mm.Both of them are located inside the position of LCFS,Z=460 mm.It is also expected that the peak of NVII is located inside that of BV because theEiof NVII (667 eV) is larger than theEiof BV(340 eV).At present,these data of the spatial profiles are line-integral values along the observation chords.Some form of inversion technique such as Abel inversion will be applied in a future analysis to obtain the spatial profiles as local values.Moreover,if the spatial profile measurement can be applied to not only BV and NVII but also various charge states, it should contribute a comprehensive understanding of the spatio-temporal evolution of injected impurities including the powder ablation.
4.2.B+ ion temperature measurement with high spectral resolution VUV spectroscopy
The Doppler broadening of impurity emission lines provides information regarding the ion temperature.Figure 9 shows ion temperature measurements of B+ions from Doppler broadening of the BII 1362.46 Å line using a 3 m normal incidence VUV spectrometer.The vertical observation range of the spectrometer covers the full height of the LHD plasmas at the horizontally elongated poloidal cross section as illustrated in figure 1(c).The temporal resolution is 20 ms with a full-binning CCD data acquisition mode.A wavelength spectrum of the BII line which is averaged over a time range of 5.3–5.4 s in a B powder dropping discharge, as shown in figure 2, is plotted in figure 9(a) together with a Gaussian function as a fitting curve.The instrumental function of the spectrometer, ΔINST,was 0.154 Å for the entrance slit width of 50 μm which was employed in the diagnostics.It was determined as the full width at half maximum(FWHM)of the Gaussian-fitted HgI 2536.52 Å spectral profile from a lowpressure Hg lamp (HAMAMATSU L937-02).Since the instrumental function has a comparable value to the observed broadening of the BII spectrum in FWHM,Δobs,for example 0.210 Å as shown in figure 9(a), the signal to noise ratio should be improved as much as possible by averaging the signals over some time ranges to confirm that the observed broadening is significantly larger than the instrumental function.

Figure 8.Temporal evolution of vertical profiles of emission intensities of(a)–(c)BV 48.59 Å and(d)–(f)NVII 24.78×2 Å measured using the ‘EUV Short2’ spectrometer in a discharge with BN powders.The position of LCFS in the vacuum magnetic field is also indicated.

Figure 9.Ion temperature measurement of B+ ions using a 3 m normal incidence VUV spectrometer.(a) Wavelength spectrum of BII 1362.46 Å together with a Gaussian function as a fitting curve.Temporal evolutions of (b) edge electron temperature Te(a99) and edge electron density ne(a99), and (c) the temperature of B+ ions,TiBII, and the emission intensity of the BII line.(d) Edge electron density dependence of TiBII.
The ion temperatureTiin eV is provided byTi=1.68×10⁸M(ΔFWHM/λ0)2, whereMis the atomic mass number,ΔFWHMis the Doppler width at FWHM, and λ0is the central wavelength.As a result derived from the spectrum shown in figure 9(a) withM=10.81, ΔFWHM=(−)1/2=0.143 Å, and λ0=1362.46 Å, the ion temperature of B+ions,TiBII,of 19.9 eV was obtained.The error inTiBII,δTiBII,can be derived by considering a propagation of the fitting error in ΔFWHM, δΔFWHM, which is provided by δTiBII=2TiBIIδΔFWHM/ΔFWHM.In the case in figure 9(a), δTiBII= 5.0 eV was obtained with δΔFWHM=0.018 Å.Because of the lowEivalue,25 eV,of B+ions,theTiBIIvalue obtained here is the ion temperature of B+ions which are distributed in the edge plasmas where the electron temperature is low.Thus, comparison betweenTiBIIand edge plasma parameters contributes to the characterization of the behavior of B+ions.Temporal evolutions ofTe(a99) andne(a99) are shown in figure 9(b) as well asTiBIIand the emission intensity of the BII line in figure 9(c).In this discharge,TiBIIstarted to increase slightly from 5.15 s,whereasne(a99)decreased from 5.35 s.At present,it is not clear whether the time difference between the onset of the increase inTiBIIand the onset of the decrease inne(a99) has some physical meaning or not.The edge electron density dependence ofTiBIIis plotted in figure 9(d)for four discharges with B powder dropping,three discharges with BN powder dropping, and one discharge without powder dropping.As shown in figure 9(d),TiBIIranges around the ionization potential and has a weak negative correlation with the edge electron density.Moreover, in a previous study, a negative correlation between the edge electron density and the impurity ion temperature has been found for CII, CIII,and CIV emission lines released from intrinsic C impurity ions which originate from the sputtering of the C divertor plates in LHD [20].Further investigation of this kind of relationship among edge plasma parameters can contribute to the validation of simulations of the edge plasmas such as three-dimensional impurity transport calculations using EMC3-EIRENE code[21].In addition,the observable wavelength range of the 3 m normal incidence VUV spectrometer,300–3200 Å,covers some N lines such as NIV 765.15 Å, NV (1238.82, 1242.80) Å, and NVI 1896.80 Å which have relatively large intensities as shown in figure 6.They should be the next targets of the impurity ion temperature measurement.
5.Summary
An IPD was installed in the LHD under a collaboration between the National Institute for Fusion Science and the Princeton Plasma Physics Laboratory.In order to assess the effectiveness of the injection of B or BN impurity powders,spectroscopic diagnostics were applied to observe line emission from injected impurities.Emission lines released from B and N ions were identified in the EUV wavelength range of 5–300 Å measured using two grazing incidence flat-field EUV spectrometers and in the VUV wavelength range of 300–2400 Å measured using three normal incidence 20 cm VUV spectrometers.BI–BV and NIII–NVII emission lines were identified in discharges with B and BN powder injection,respectively.Useful B and N emission lines which have large intensities and are isolated from other lines were successfully identified as follows: BI (1825.89, 1826.40) Å(blended), BII 1362.46 Å, BIII (677.00, 677.14, 677.16) Å(blended), BIV 60.31 Å, BV 48.59 Å, NIII (989.79, 991.51,991.58) Å (blended), NIV 765.15 Å, NV (209.27, 209.31) Å(blended), NVI 1896.80 Å, and NVII 24.78 Å.Applications of the lines identified to advanced spectroscopic diagnostics were demonstrated, such as vertical profile measurements for the BV and NVII lines using a space-resolved EUV spectrometer and ion temperature measurement for the BII line using a normal incidence 3 m VUV spectrometer.
Acknowledgments
The authors thank all the members of the LHD experiment group for their cooperation with the LHD operation.This work is partially supported by the Post-CUP program, JSPSCAS Bilateral Joint Research Projects, ‘Control of wall recycling on metallic plasma facing materials in fusion reactor,’ 2019–2022, (No.GJHZ201984), US Department of Energy (No.DE-AC02-09CH11466) with Princeton University, the LHD project financial support (Nos.ULPP010,ULFF022) and JSPS KAKENHI (Nos.17K14426,20K03896).
猜你喜欢
杂志排行

Plasma Science and Technology的其它文章
- Energy and flux measurements of laserinduced silver plasma ions by using Faraday cup
- Experimental investigation on DBD plasma reforming hydrocarbon blends
- Research on active arc-ignition technology as a possible residual-energy-release strategy in electromagnetic rail launch
- Distinguish Fritillaria cirrhosa and non-Fritillaria cirrhosa using laser-induced breakdown spectroscopy
- On abnormal behaviors of ion beam extracted from electron cyclotron resonance ion thruster driven by rod antenna in cross magnetic field
- Research on quinoline degradation in drinking water by a large volume strong ionization dielectric barrier discharge reaction system