TSUNAMI:Translational Bioinformatics Tool Suite for Network Analysis and Mining
2021-08-04ZhiHuangZhiHanTongxinWangWeiShaoShunianXiangPaulSalamaMaherRizkallaKunHuangJieZhang
Zhi Huang ,Zhi Han ,Tongxin Wang ,Wei Shao ,Shunian Xiang ,Paul Salama ,Maher Rizkalla,Kun Huang,*,§,Jie Zhang,*
1School of Electrical and Computer Engineering,Purdue University,West Lafayette,IN 47907,USA
2Department of Electrical and Computer Engineering,Indiana University-Purdue University Indianapolis,Indianapolis,IN 46202,USA
3Department of Medicine,Indiana University School of Medicine,Indianapolis,IN 46202,USA
4Department of Computer Science,Indiana University,Bloomington,IN 47405,USA
5Department of Medical and Molecular Genetics,Indiana University School of Medicine,Indianapolis,IN 46202,USA
Abstract Gene co-expression network(GCN)mining identifies gene modules with highly correlated expression profiles across samples/conditions.It enables researchers to discover latent gene/molecule interactions,identify novel gene functions,and extract molecular features from certain disease/condition groups,thus helping to identify disease biomarkers.However,there lacks an easy-to-use tool package for users to mine GCN modules that are relatively small in size with tightly connected genes that can be convenient for downstream gene set enrichment analysis,as well as modules that may share common members.To address this need,we developed an online GCN mining tool package:TSUNAMI(Tools SUite for Network Analysis and MIning).TSUNAMI incorporates our state-of-the-art lmQCM algorithm to mine GCN modules for both public and user-input data(microarray,RNA-seq,or any other numerical omics data),and then performs downstream gene set enrichment analysis for the identified modules.It has several features and advantages:1) a userfriendly interface and real-time co-expression network mining through a web server;2)direct access and search of NCBI Gene Expression Omnibus (GEO) and The Cancer Genome Atlas (TCGA) databases,as well as user-input gene expression matrices for GCN module mining;3) multiple co-expression analysis tools to choose from,all of which are highly flexible in regards to parameter selection options;4)identified GCN modules are summarized to eigengenes,which are convenient for users to check their correlation with other clinical traits;5)integrated downstream Enrichr enrichment analysis and links to other gene set enrichment tools;and 6) visualization of gene loci by Circos plot in any step of the process.The web service is freely accessible through URL:https://biolearns.medicine.iu.edu/.Source code is available at https://github.com/huangzhii/TSUNAMI/.
KEYWORDS Network mining;Gene co-expression network;Transcriptomic data analysis;lmQCM;Web server;Survival analysis
Introduction
Gene co-expression network (GCN) mining is a popular bioinformatics approach to identify densely connected gene modules,which are linked by their highly correlated expression profiles.It helps biologists discover latent gene/molecule interactions and identify novel gene functions,disease pathways,biomarkers,and insights for disease mechanisms.GCN mining approaches such as WGCNA[1]and lmQCM [2] have been increasingly used [3–7].Compared to the more popularly used WGCNA package,lmQCM is capable of mining smaller densely connected GCN modules.It also allows overlapping membership in the output modules.Such features are more consistent with biological networks in which the same genes may participate in multiple pathways,where a small group of genes are more likely to be synergistically regulated in local pathway functions.In addition,gene modules with smaller size derived from lmQCM usually generate more meaningful gene set enrichment results,which have been successfully applied to many diseases and cancer types[8–17].
Currently,several online databases exist that curate transcriptomic data.For instance,PanglaoDB (https://pan glaodb.se/) collects single-cell RNA sequencing (scRNAseq) data from mice and humans;scRNASeqDB [18] provides an scRNA-seq database for gene expression profiling in humans;recount2[19] provides publicly available analysis-ready gene and exon counts datasets.However,all of these databases focus on data collection and curation.To the best of our knowledge,there is no tool offering the complete pipeline that can directly process transcriptomic data,mine GCN modules,carry out gene set enrichment analysis,and provide visualization for the results.To meet such needs,we implemented our web-based analysis tool suite Tools SUite for Network Analysis and MIning(TSUNAMI).
For users’ convenience,mRNA-seq data from The Cancer Genome Atlas (TCGA;Illumina HiSeq RSEM genes normalized from https://gdac.broadinstitute.org/)and NCBI Gene Expression Omnibus (GEO) are directly incorporated into TSUNAMI.GEO hosts a large number of transcriptomic datasets generated from multiple platforms,including microarray and RNA-seq data.Other data types,such as miRNA-seq and DNA methylation,are also compatible with TSUNAMI.In fact,TSUNAMI can handle any numerical matrix data regardless of the omics data type.TSUNAMI not only incorporates the newly released lmQCM algorithm,but also includes the WGCNA package for users to explore and compare GCN modules generated from two different algorithms.We offer highly flexible parameter choices in each step to users who want to fine tune each algorithm to suit their own data and goal.
Prior to data mining,a data pre-processing interface has been designed to address differences in the input data formats and to filter the data in order to remove noise for GCN mining.Each step of pre-processing is transparent to users and can be adjusted according to their preferences and needs.
Furthermore,our website directly incorporates enrichment analysis of the gene modules and Circos plot function for researchers to explore the enriched biological terms and gene locations in the output GCN modules.It also provides a tool for survival analysis with respect to each GCN module’s eigengene values.All the aforementioned functions only require button clicks from users.The design of such a user-friendly interface in our TSUNAMI pipeline provides a one-stop comprehensive analysis tool suite for biological researchers and clinicians to perform transcriptomic data analyses without any programming skill or data mining knowledge.
Method
A flowchart of the TSUNAMI pipeline is presented inFigure 1.The entire pipeline is implemented in R language with Shiny server pages.In the future,it will be upgraded with Python to improve computing efficiency in the module mining step.Some front-end interfaces and functions are implemented using JavaScript.With TSUNAMI,users can choose to use multiple types of data formats,including TCGA RNA-seq data,gene expression microarray data from GEO(in the format of GSE series matrix data),RNAseq data from GEO,and user-defined numerical matrix data(such as microarray,RNA-seq,scRNA-seq,and DNA methylation data).Instead of searching the GEO database manually,TSUNAMI provides a friendly interface for users to retrieve data from GEO by utilizing keywords and offers a flexible selection tool to retrieve a relevant GSE dataset to perform GCN analysis.Users can also choose a specific omics data type on the GEO database if keywords are entered in the search window to indicate the desired data type.In our testing,only a smaller portion of GSE data was not able to be processed (e.g.,12 out of first 1000 GSE data),most of which were legacy microarray data that contain too much missing data or too small of a sample size.On the website,a variety of example datasets ranging from microarray to scRNA-seq data are listed on TSUNAMI for users’reference.TSUNAMI also provides an upload bar for users to upload local files in various formats (e.g.,CSV,TSV,XLSX,and TXT).The data uploading interface is shown inFigure 2A.In this study,one microarray dataset(GSE17537 from GEO) was chosen as an example to demonstrate the features of TSUNAMI.GSE17537 contains gene expression data of 55 colorectal cancer patients from the Vanderbilt Medical Center(VMC)generated from the Affymetrix HU133 2.0 Plus Genechip with 54,675 probesets[20,21].

Figure 1 Flowchart of TSUNAMI
Results
Online data pre-processing
One issue of the microarray dataset from GEO is that different platforms adopt different rules when converting probeset IDs to gene symbols.To make this step easier for users,probeset IDs in GSE data matrix from GEO can be converted to gene symbols using R package“BiocGenerics”[22] by only one click.For instance,for the GSE17537 dataset,the annotation platform is GPL570.TSUNAMI then automatically identifies the annotation platforms of the data from GEO.During the conversion,TSUNAMI 1) removes rows with empty gene symbols and 2) selects the rows with the largest mean expression value when multiple probesets are matched to the same gene symbol.The user interface of the data pre-processing step is shown in Figure 2B.
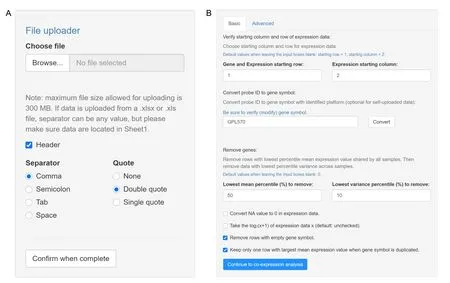
Figure 2 Dataset selection and the data pre-processing panel
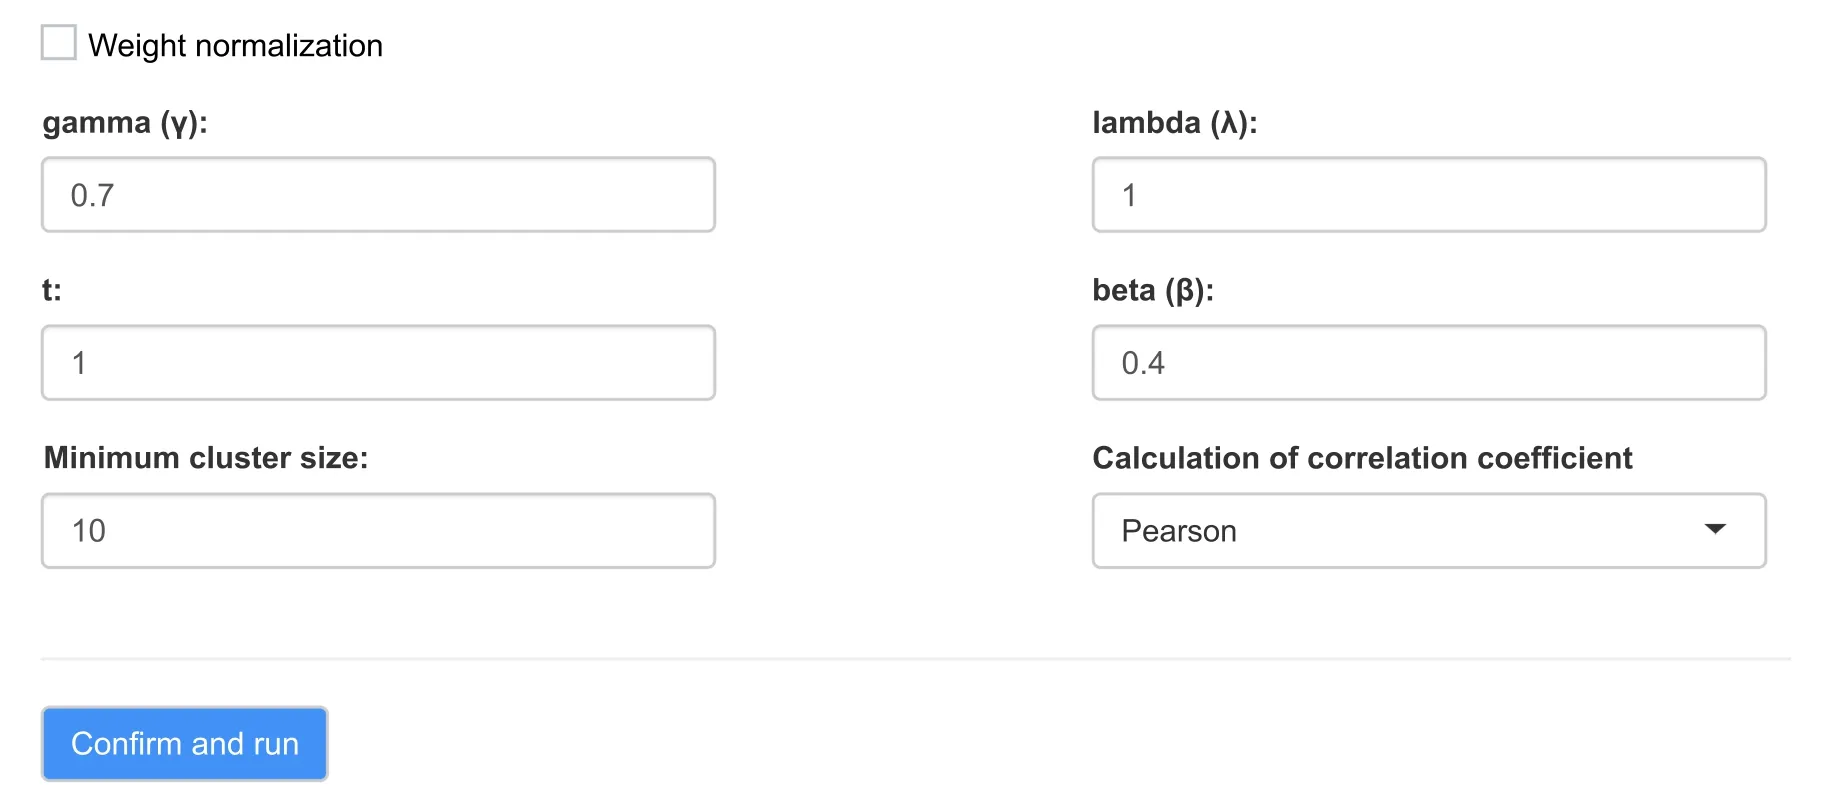
Figure 3 The lmQCM method panel
Additional data filtering steps include:1) converting“NA”value(not a number value)to 0 in expression data,to ensure all the values are numeric and can be processed by co-expression algorithms;2) performing log2(χ+1) transformation of the expression values χ if the original values have not been previously transformed;3)removing lowestJpercentile rows (genes) with respect to mean expression values;and 4) removing lowestKpercentile rows with respect to expression values’ variance.These data filtering steps are necessary to reduce noise and to ensure the robustness for the downstream correlational computation in the lmQCM algorithm.The default settings areJ=20 andK=20,by which genes with low expression and variance across samples are filtered out.In our example with GSE17537,we deselected logarithm conversion and NA value to 0 conversion and setJ=50 andK=10,as shown in Figure 2B.However,users can always adjust these parameters based on their own needs and preferences.In the data pre-processing section,we further provide an“Advanced”panel to allow users to select a subgroup of samples of their interest.After the data pre-processing finishes,a dialog box appears to indicate how many genes are preserved after the filtering process.
Weighted network co-expression analysis
After data pre-processing,users can directly download preprocessed data or further proceed to the GCN analysis.In GCN analysis,we implemented the lmQCM algorithm as well as the WGCNA pipeline.The R package“WGCNA”from Bioconductor (http://bioconductor.org/) was adopted to integrate the WGCNA pipeline.We kept the mining steps concise and simple with default parameter settings,while preserving the flexibility for users to select parameters in each step.Guidelines for parameter selection are in the Method pages of the website.In addition,we also released the lmQCM package to CRAN (https://CRAN.R-project.org/package=lmQCM/).
In the lmQCM method panel,users can adjust parameters such as initial edge weight γ,weight threshold controlling parametersλ,t,andβ,and the minimum cluster size(Figure3).Pearson correlation coefficient (PCC) and Spearman’s rank correlation coefficient (SCC) are implemented separately for users to select.SCC is recommended for analyzing RNA-seq data due to the large range of data values,and it is more robust than PCC to outliers.In our example with GSE17537,positive gene correlations were analyzed and the default settings were used (unchecked weight normalization,γ=0.7,λ=1,t=1,β=0.4,minimum cluster size=10,and PCC for correlation measure).In the newer version of the TSUNAMI tool,both positive and negative correlations are considered during network module mining.The running time of lmQCM depends on the number of genes present after the filtering process.A progress bar is provided to show the program progress.Note that lmQCM will not work if the data contain no clustering structures or the gene pair correlations are so poor that none is above the initial mining starting threshold (γ).In those cases,the program will stop running and generate a warning message.However,this should not happen if the data contain enough highly correlated gene pairs after filtering and the default program settings are used.
The WGCNA method panel is a two-step analysis.Step 1 helps users to specify the hyper-parameter“power”in step 2,i.e.,the soft thresholding in Langfelder et al.[1] by visualizing the resulting plot(Figure 4A).Step 2 allows users to select the remaining parameters.TSUNAMI allows users to customize the parameters of power,reassign threshold,merge cut height,and indicate minimum module size.After applying WGCNA,a hierarchical clustering plot for the resulting modules is also shown in this panel (Figure 4B).The resulting plot in Figure 4B is from the example data GSE17537 with powe=10,reassign threshold=0,merge cut height=0.25,and minimum module size=10.
In the last step of GCN mining,two outputs are provided by TSUNAMI:1)merged gene clusters sorted by their sizes in descending order (Figure 5A with lmQCM algorithm)and 2) an eigengene matrix,which is the summarized expression values of genes in each GCN using the first principal component from singular value decomposition(Figure 5B with the lmQCM algorithm).Eigengene values can be regarded as the weighted average expression levels of each GCN.Such values are very useful for users to correlate GCN modules’expression profiles with various clinical and phenotypic traits in the downstream analysis,such as survival analysis.All results can be downloaded as files in CSV or TXT format.
Downstream enrichment analysis
Enrichr[23,24]is used as the tool for downstream gene set enrichment analysis implementation.By default,a total of 14 types of frequently used enrichment analyses are performed:1) Biological Process;2) Molecular Function;3)Cellular Component;4) Jensen DISEASES;5) Reactome;6) KEGG;7) Transcription Factor PPIs;8) Genome Browser PWMs;9)TRANSFAC and JASPAR PWMs;10)ENCODE TF ChIP-seq;11) Chromosome Location (Cytoband);12) miRTarBase;13) TargetScan microRNA;and 14) ChEA.Users can further customize the enrichment result categories from the open source code available in Github(https://github.com/huangzhii/TSUNAMI/).
To access Enrichr results,users can simply click the blue“GO”button in each row adjacent to the GCN mining results(as shown in Figure 5A).In each enrichment analysis,its output includes multiple results,such as the enriched term (e.g.,GO term or pathway),Pvalue,Z-score,and overlapping genes.Users can download multiple analysis results that are bundled in a ZIP file.In addition,other popular gene set enrichment analysis websites are also directly linked in TSUNAMI to enhance convenience for users.In our example with GSE17537,we selected the 36th GCN module with 15 genes generated by lmQCM to be analyzed for enrichment,and each result table was sorted based on thePvalue generated by Enrichr.From the results inTable 1,we can see that the 36th GCN module is highly enriched in GO Biological Process term“type I interferon signaling pathway(GO:0060337)”(9 out of 148 genes).

Table 1 The partial results of GO enrichment analysis
Circos plot
TSUNAMI provides Circos plots[25]through intermediate results or inputs in the cases of human transcriptomic data.Circos plots are very useful graphs for visualizing the positions of genes on chromosomes and gene–gene relationships/interactions.The Circos plot function from the R package“circlize”[25]is adopted in this package for users to locate and visualize mined GCNs of human genes.
In TSUNAMI,users can visualize the Circos plot via the“Circos Plots”section,either by typing their own gene list separated by the carriage return character(“ ”)directly,or by using the calculated GCN modules(e.g.,by clicking the yellow button right next to the“GO”button in Figure 5A).TSUNAMI supports both human genomes hg38(GRCh38)and hg19(GRCh37).To match the gene symbol to starting and ending sites on a chromosome,we use therefGenedatabase downloaded from the UCSC genome browser[26].If multiple starting/ending sites are matched,we choose the longest one with length calculated by:length=|ending_site–staring_site|+1

Figure 4 Choosing the power in WGCNA and the hierarchical clustering graph of WGCNA
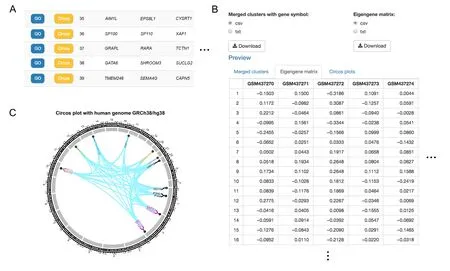
Figure 5 Merged cluster results generated by lmQCM
By updating the plots,users can also choose the size of the plots and decide whether gene symbols and pair-wise links should be shown on the graph.
An example output of the Circos plot is shown in Figure 5C.This example used the 36th GCN module with 15 genes from our previously discussed example(use a color set for texts to get a clear visual effect),annotated by gene symbols of human genome hg38(GRCh38).The link between a pair of genes indicates that they belong to the same GCN module.
Survival analysis with respect to GCN modules
An optional step of survival analysis follows the generation of the eigengene matrix.It allows users to correlate the GCN modules’ eigengenes with patient survival time (or event-free survival).This extension of the tool can be further customized to correlate module eigengenes with other clinical traits in the future version.In our current version,we only implements survival analysis as a starting point.
In the survival analysis,users can perform Overall Survival/Event-Free Survival (OS/EFS) analysis based on the GCN modules’eigengenes and look for GCN modules that are significantly associated with prognosis.Although,depending on the group of patients specified by users,such GCNs may not exist all the time.To carry out the analysis,users first select an eigengene (corresponding to a GCN module)in TSUNAMI.The program then splits the patients into two groups by the median of eigengenes.Next,it tests the two groups against OS/EFS by calculating thePvalue of the log-rank test [27,28].Before doing so,users need to input the numerical survival time of OS/EFS (either in months or in days)with categorical events on OS/EFS status(1:deceased;0:censored).The“survdiff”function from R package“survival”is adopted to calculate thePvalue and plot the Kaplan-Meier survival curves.
Taking GSE17537 with full survival information as an example,the Kaplan-Meier survival plot was generated according to the OS information by dichotomizing the 36th GCN module’s eigengenes at its median to high and low groups,as shown inFigure 6.Such a GCN module was generated from the lmQCM method with default settings,as shown in Figure 3.This survival analysis offers researchers a tool to immediately identify any GCN modules that are associated with patients’ survival time,thus allowing researchers to further study their roles as potential prognosis biomarkers,as well as the biological pathways that differentiate the patients.
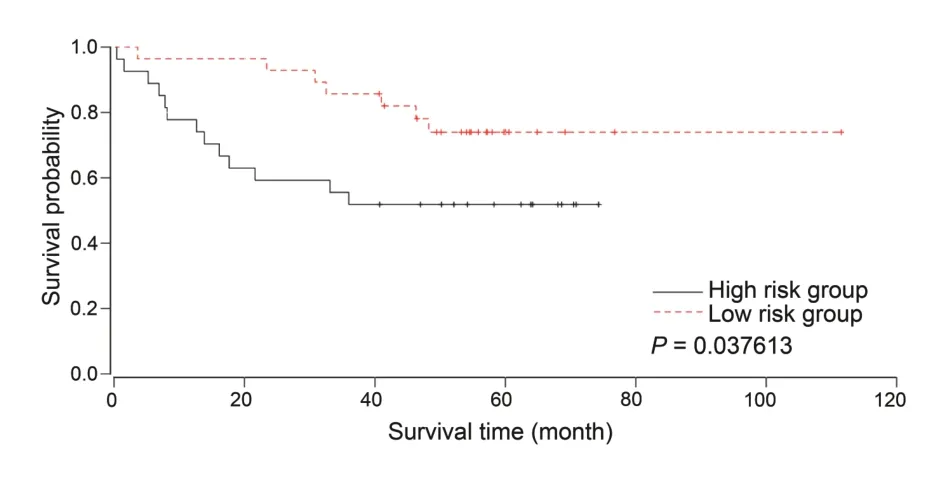
Figure 6 Survival analysis using GCN module eigengenes
Discussion
We released the online TSUNAMI tool package for gene co-expression module identification with direct link to the TCGA RNA-seq datasets and the NCBI GEO database,while also accommodating users’input data.It is a one-stop comprehensive tool package with several advantages,such as flexibility in parameter selections,comprehensive GCN mining tools,direct link to downstream gene set enrichment analysis,Circos plot visualization,and survival analysis,with downloadable results in each step.All of these features bring tremendous convenience to biological researchers.
In addition,TSUNAMI not only can process microarray,RNA-seq,and scRNA-seq transcriptomic data,but is also capable of processing any numerical valued matrix for weighted network module mining.If the users upload an adjacency matrix of any supported format with numerical values as the edge weights,TSUNAMI can be used to mine network modules.This extension will be implemented in version 2.0.
Code availability
The web service is freely accessible through URL:https://biolearns.medicine.iu.edu/.Source code is available at https://github.com/huangzhii/TSUNAMI/.
CRediT author statement
Zhi Huang:Methodology,Software,Formal analysis,Writing-original draft.Zhi Han:Methodology,Software,Formal analysis,Writing -original draft.Tongxin Wang:Resource,Data curation,Writing -review &editing.Wei Shao:Visualization,Data curation,Writing -review &editing.Shunian Xiang:Visualization,Data curation,Writing -review &editing.Paul Salama:Project administration,Supervision,Writing -review &editing.MaherRizkalla:Project administration,Supervision,Writing -review&editing.Kun Huang:Conceptualization,Project administration,Supervision,Funding acquisition,Writingreview &editing.Jie Zhang:Conceptualization,Project administration,Supervision,Methodology,Writing -original draft,Writing-review&editing.All authors have read and approved the final manuscript.
When the Princess heard this she turned quite pale, and almost fainted away with fear, for the little tailor had hit the mark, and she had firmly believed that not a soul could guess it
Competing interests
The authors have declared no competing interests.
Acknowledgments
This work is partially supported by the American Cancer Society Inernal Reseatch Grant(to JZ),the National Cancer Institure Informatics Technology for Ccance Research U01 grant(Grant No.CA188547 to JZ and KH),and the Indiana University Precision Health Initiative (to JZ and KH).We thank the support from Indiana University Information Technologies and Advanced Biomedical IT Core.The results shown here are partially based upon data generated by the TCGA Research Network:https://www.cancer.gov/tcga/.
ORCID
0000-0001-6982-8285 (Zhi Huang)
0000-0002-5603-8433 (Zhi Han)
0000-0001-5826-1842 (Tongxin Wang)
0000-0003-1476-2068 (Wei Shao)
0000-0002-1351-0363 (Shunian Xiang)
0000-0002-7643-3879 (Paul Salama)
0000-0002-3723-8405 (Maher Rizkalla)
0000-0002-8530-370X (Kun Huang)
0000-0001-6939-7905 (Jie Zhang)
杂志排行
Genomics,Proteomics & Bioinformatics的其它文章
- rePROBE:Workflow for Revised Probe Assignment and Updated Probe-set Annotation in Microarrays
- BrcaSeg:A Deep Learning Approach for Tissue Quantification and Genomic Correlations of Histopathological Images
- Computational Assessment of Protein–protein Binding Affinity by Reversely Engineering the Energetics in Protein Complexes
- QAUST:Protein Function Prediction Using Structure Similarity,Protein Interaction,and Functional Motifs
- Identifying Novel Drug Targets by iDTPnd:A Case Study of Kinase Inhibitors
- eTumorMetastasis:A Network-based Algorithm Predicts Clinical Outcomes Using Whole-exome Sequencing Data of Cancer Patients
