Carbon biomass, carbon-to-chlorophyll a ratio and the growth rate of phytoplankton in Jiaozhou Bay, China*
2021-07-29ShujinGUOZengxiaZHAOJunhuaLIANGJuanDUXiaoxiaSUN
Shujin GUO , Zengxia ZHAO, Junhua LIANG , Juan DU , Xiaoxia SUN ,4,**
1 Jiaozhou Bay National Marine Ecosystem Research Station, Chinese Academy of Sciences, Qingdao 266071, China
2 Laboratory for Marine Ecology and Environmental Science, Pilot National Laboratory for Marine Science and Technology(Qingdao), Qingdao 266237, China
3 Center for Ocean Mega-Science, Chinese Academy of Sciences, Qingdao 266071, China
4 University of Chinese Academy of Sciences, Beijing 100049, China
Abstract Carbon biomass, carbon-to-chlorophyll a ratio (C:Chl a), and the growth rate of phytoplankton cells were studied during four seasonal cruises in 2017 and 2018 in Jiaozhou Bay, China. Water samples were collected from 12 stations, and phytoplankton carbon biomass (phyto-C) was estimated from microscopemeasured cell volumes. The phyto-C ranged from 5.05 to 78.52 μg C/L in the bay, and it constituted a mean of 38.16% of the total particulate organic carbon in the bay. High phyto-C values appeared mostly in the northern or northeastern bay. Diatom carbon was predominant during all four cruises. Dinoflagellate carbon contributed much less (<30%) to the total phyto-C, and high values appeared often in the outer bay.The C:Chl a of phytoplankton cells varied from 11.50 to 61.45 (mean 31.66), and high values appeared in the outer bay during all four seasons. The phyto-C was also used to calculate the intrinsic growth rates of phytoplankton cells in the bay, and phytoplankton growth rates ranged from 0.56 to 1.96/d; the rate was highest in summer (mean 1.79/d), followed by that in fall (mean 1.24/d) and spring (mean 1.17/d), and the rate was lowest in winter (mean 0.77/d). Temperature and silicate concentration were found to be the determining factors of phytoplankton growth rates in the bay. To our knowledge, this study is the first report on phytoplankton carbon biomass and C:Chl a based on water samples in Jiaozhou Bay, and it will provide useful information for studies on carbon-based food web calculations and carbon-based ecosystem models in the bay.
Keyword: phytoplankton; carbon biomass; carbon-to-chlorophyll a (C:Chl a) ratio; growth rates; Jiaozhou Bay
1 INTRODUCTION
Phytoplankton biomass is strongly related to food web structure, which influences the energy flow and material cycling in the ocean (Friedland et al., 2012).Therefore, determining the phytoplankton biomass is important for understanding the food web structures in the oceans (Arteaga et al., 2016). Determination of cell abundance of phytoplankton by direct counting the number of cells is often used to determine the phytoplankton biomass. However, as diff erent phytoplankton species have diff erent shapes and sizes, phytoplankton biomass by the counting would underestimate the contribution oflarge species while overestimate the contribution of small species(Harrison et al., 2015). Chlorophylla(Chla) or ATP could also be used to express phytoplankton biomass,but they can only provide information on the whole phytoplankton group (Gong et al., 1996; Kruskopf and Flynn, 2006). Therefore, a standard biomass estimate is essential for estimating phytoplankton biomass with various phytoplankton species in natural samples (Arteaga et al., 2016).
In studying marine ecosystems, it is usually desirable to express phytoplankton biomass as organic carbon, which will facilitate a quantitative assessment of the relationship between diff erent marine food web levels (Graff et al., 2015). Furthermore, expressing phytoplankton biomass in carbon (phyto-C) is the only way to represent phytoplankton biomass in a biogeochemical model that includes nonliving carbon contents (Arteaga et al., 2016). Phyto-C could also be used to calculate the growth rate of the whole phytoplankton community based on primary productivity measurements (Regaudie-de-Gioux et al., 2015), which is important to understand many oceanographic processes, such as the vertical flux of organic matter, nutrient utilization patterns and yield from the food web (Smith et al., 1999). Therefore,phyto-C is a quite useful parameter to express phytoplankton biomass in the ocean. To our knowledge, no method has existed for directly measuring phyto-C in natural populations, which has mainly been due to an inability to separate phytoplankton cells from other constituents contributing to the total particulate organic carbon(POC) pool (e.g., zooplankton, heterotrophic bacteria,and detritus), and a carbon-to-chlorophyllaratio(C:Chla) is usually used to convert measured Chlato phyto-C in marine ecosystems (Arteaga et al., 2016).However, the relationship between Chlaand phyto-C is not constant, and a wide range of C:Chlavalues(from 6 to 333) have been reported across laboratory and field studies (Cloern et al., 1995; Sathyendranath et al., 2009). To date, the ‘gold standard’ of estimating phyto-C has been to measure the dimensions of phytoplankton cells, calculate their volume, and then convert that volume to carbon biomass using the volume-to-carbon conversion factor (Menden-Deuer and Lessard, 2000; Harrison et al., 2015). This approach is the only way to estimate phyto-C biomass at the species level, and it has been widely used in recent years (Jakobsen and Markager, 2016; Yang et al., 2017; Crawford et al., 2018).
Coastal seas are highly productive environments for aquatic organisms, attributable to greater phytoplankton biomass and primary production rates due to high nutrients concentrations than found in off shore oceanic areas (Chang et al., 2003b). The phytoplankton biomass and their growth rates are strongly related to food web structure, which influences energy flow and carbon cycles in marine ecosystems (Ara et al., 2019). Therefore, studying phytoplankton biomass and their growth rates is essential to understand the food web structure and biological productivity of the coastal environments,and is significant in evaluating the role of phytoplankton in carbon cycles in these areas.Seasonal variations in phytoplankton biomass have been extensively studied in temperate coastal seas in China (e.g. Fu et al., 2009; Zhou et al., 2012; Guo et al., 2014; Liu et al., 2015). However, almost all of these studies were based on the determination of phytoplankton cell abundance or Chla, with studies on phytoplankton carbon biomass being limited. Until now, only limited studies have been carried out on phytoplankton carbon biomass in temperate coastal seas in China. Sun et al. (2000) compared diff erent methods for calculating phytoplankton carbon in China Sea. Chang et al. (2003b) studied spatial variations of the C:Chlaof phytoplankton in the East China Sea during a cruise in summer, 1998. Yang et al. (2017) estimated the carbon biomass of marine net phytoplankton from abundance in the Yellow Sea and East China Sea. Most of these studies were based on field investigations conducted only once in a season,or use net samples which would lose small phytoplankton cells. To our knowledge, there has been none study on spatio-temporal variation of phytoplankton carbon biomass in coastal China Seas based on water collecting samples, which would not be beneficial for our comprehensive understanding on the marine ecosystem.
As a semi-enclosed bay, Jiaozhou Bay is located on the northeastern coast of China and is adjacent to the South Yellow Sea. It covers an area of approximately 400 km2, and the average depth is 7 m. Several small rivers with varying water loads empty into the bay(Guo et al., 2019). Due to its ecological and economic importance, Jiaozhou Bay has been chosen as a longterm ecosystem study area for temperate coastal seas in China by the Chinese Ecosystem Research Network since 1991. To date, there have been many studies on phytoplankton biomass and community structure in the bay (e.g., Sun et al., 1999, 2011a; Liu et al., 2002;Wu et al., 2005; Sun and Sun, 2012; Guo et al., 2019),which provide valuable information on phytoplankton ecology in this area. However, almost all of these studies were based on the determination of phytoplankton cell abundance or Chla, and few determined phytoplankton biomass in terms of carbon(Sun et al., 2000; Lü et al., 2009), providing little information for the biogeochemical cycle (especially carbon cycle) and ecological dynamic model in this area. In this study, we determined phyto-C using geometric models (Hillebrand et al., 1999; Sun and Liu, 2003) in Jiaozhou Bay and elucidated its spatial variations and regulators. As a conversion factor to estimate carbon biomass, the C:Chlaof phytoplankton was also analyzed to provide a reference for subsequent studies on phytoplankton biomass in the bay. Finally, as an application, phyto-C was combined with14C-measured primary productivity to calculate phytoplankton growth rates in the bay. This study should provide useful information for the phytoplankton ecology and biogeochemical cycle(carbon cycle) in Jiaozhou Bay.
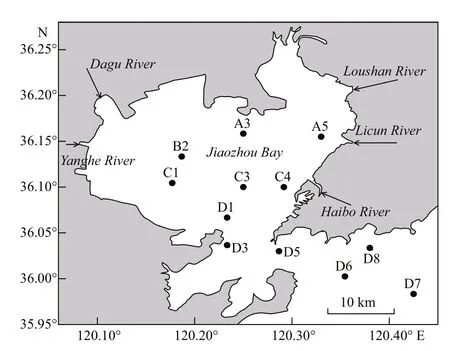
Fig.1 Study area and sampling stations in the Jiaozhou Bay
2 METHOD
2.1 Study area and sampling stations
Four seasonal cruises were carried out in Jiaozhou Bay in summer (August 17-18) and fall (November 9-10) 2017, and winter (February 1-2) and spring(May 9-10) 2018. Twelve stations were sampled during each cruise in the bay (Fig.1). Station D3, D5,D6, D8 and D7 were located in the outer bay, and other stations were in the inner bay.
2.2 Sampling and analysis
Temperature and salinity were determined with YSI 6600 Sonde (Yellow Springs, Ohio) at each station. Water transparency was measured with Secchi disk. Water samples were collected from the 0.5-m layer, and nutrients, Chla, POC, phytoplankton composition, abundance, and cell volume were determined.
Nutrients, including nitrate (NO3ˉ), nitrite (NO2ˉ),ammonium (NH4+), phosphate (PO43ˉ) and silicate(SiO32ˉ), were determined using an autoanalyzer(model, SkalarSANplus, Skalar Analysis, the Netherlands) according to the method described in Guo et al. (2019). Chlawas filtered through GF/F filters (25 mm, WhatmanTM) and stored at -20 °C in the dark. In the laboratory, Chlawas extracted with 90% acetone at -20 °C for 24 h in the dark and then measured using a Turner-Designs TrilogyTMlaboratory fluorometer. POC was measured by filtering 300-mL seawater through precombusted GF/F filters (0.7 μm pore size, 1 h, 550 °C) under low vacuum(<1.33×10⁴Pa). The filters were then frozen at -20 °C.To remove inorganic matter, the filters were exposed to the HCl-saturated atmosphere for 24 h and then dried and analyzed with a CHN autoanalyzer (Perkin-Elmer 240) (Guo et al., 2019).
Phytoplankton samples were fixed in acidic Lugols(2% final concentration). In the laboratory,phytoplankton cells were concentrated with 25-mL settlement chambers for 24-48 h, and then identified and counted with an inverted microscope (Utermöhl,1958). The cell volume of each species was calculated from measured dimensions by assigning an appropriate geometrical shape (Hillebrand et al.,1999; Sun and Liu, 2003). For the dominant phytoplankton species, at least 30 cells were measured. For the non-dominant phytoplankton species, 10-15 cells were measured. The measured dimensions were averaged and used to calculate the cell volume of phytoplankton species. The volume of the individual cells was then converted to carbon biomass with the volume-to-carbon conversion according to equation1.

whereCcis cell carbon,Vcis cell volume,aandbare 0.288 and 0.811 for diatoms, and 0.216 and 0.939 for dinoflagellates and other phytoplankton groups,respectively (Menden-Deuer and Lessard, 2000). The total phyto-C at each station was obtained by summing the carbon biomass of each species at each station.
Primary productivity was measured at 3 stations(A5, C3, and D7) by the14C assimilation method as described in Sun et al. (2011b). The phytoplankton growth rates (μ) at these stations were then estimated based on Eq.2 (Cloern et al., 1995; Chang et al.,2003b):

wherePBis the chlorophyll-specific primary productivity, andCpis the phyto-C.
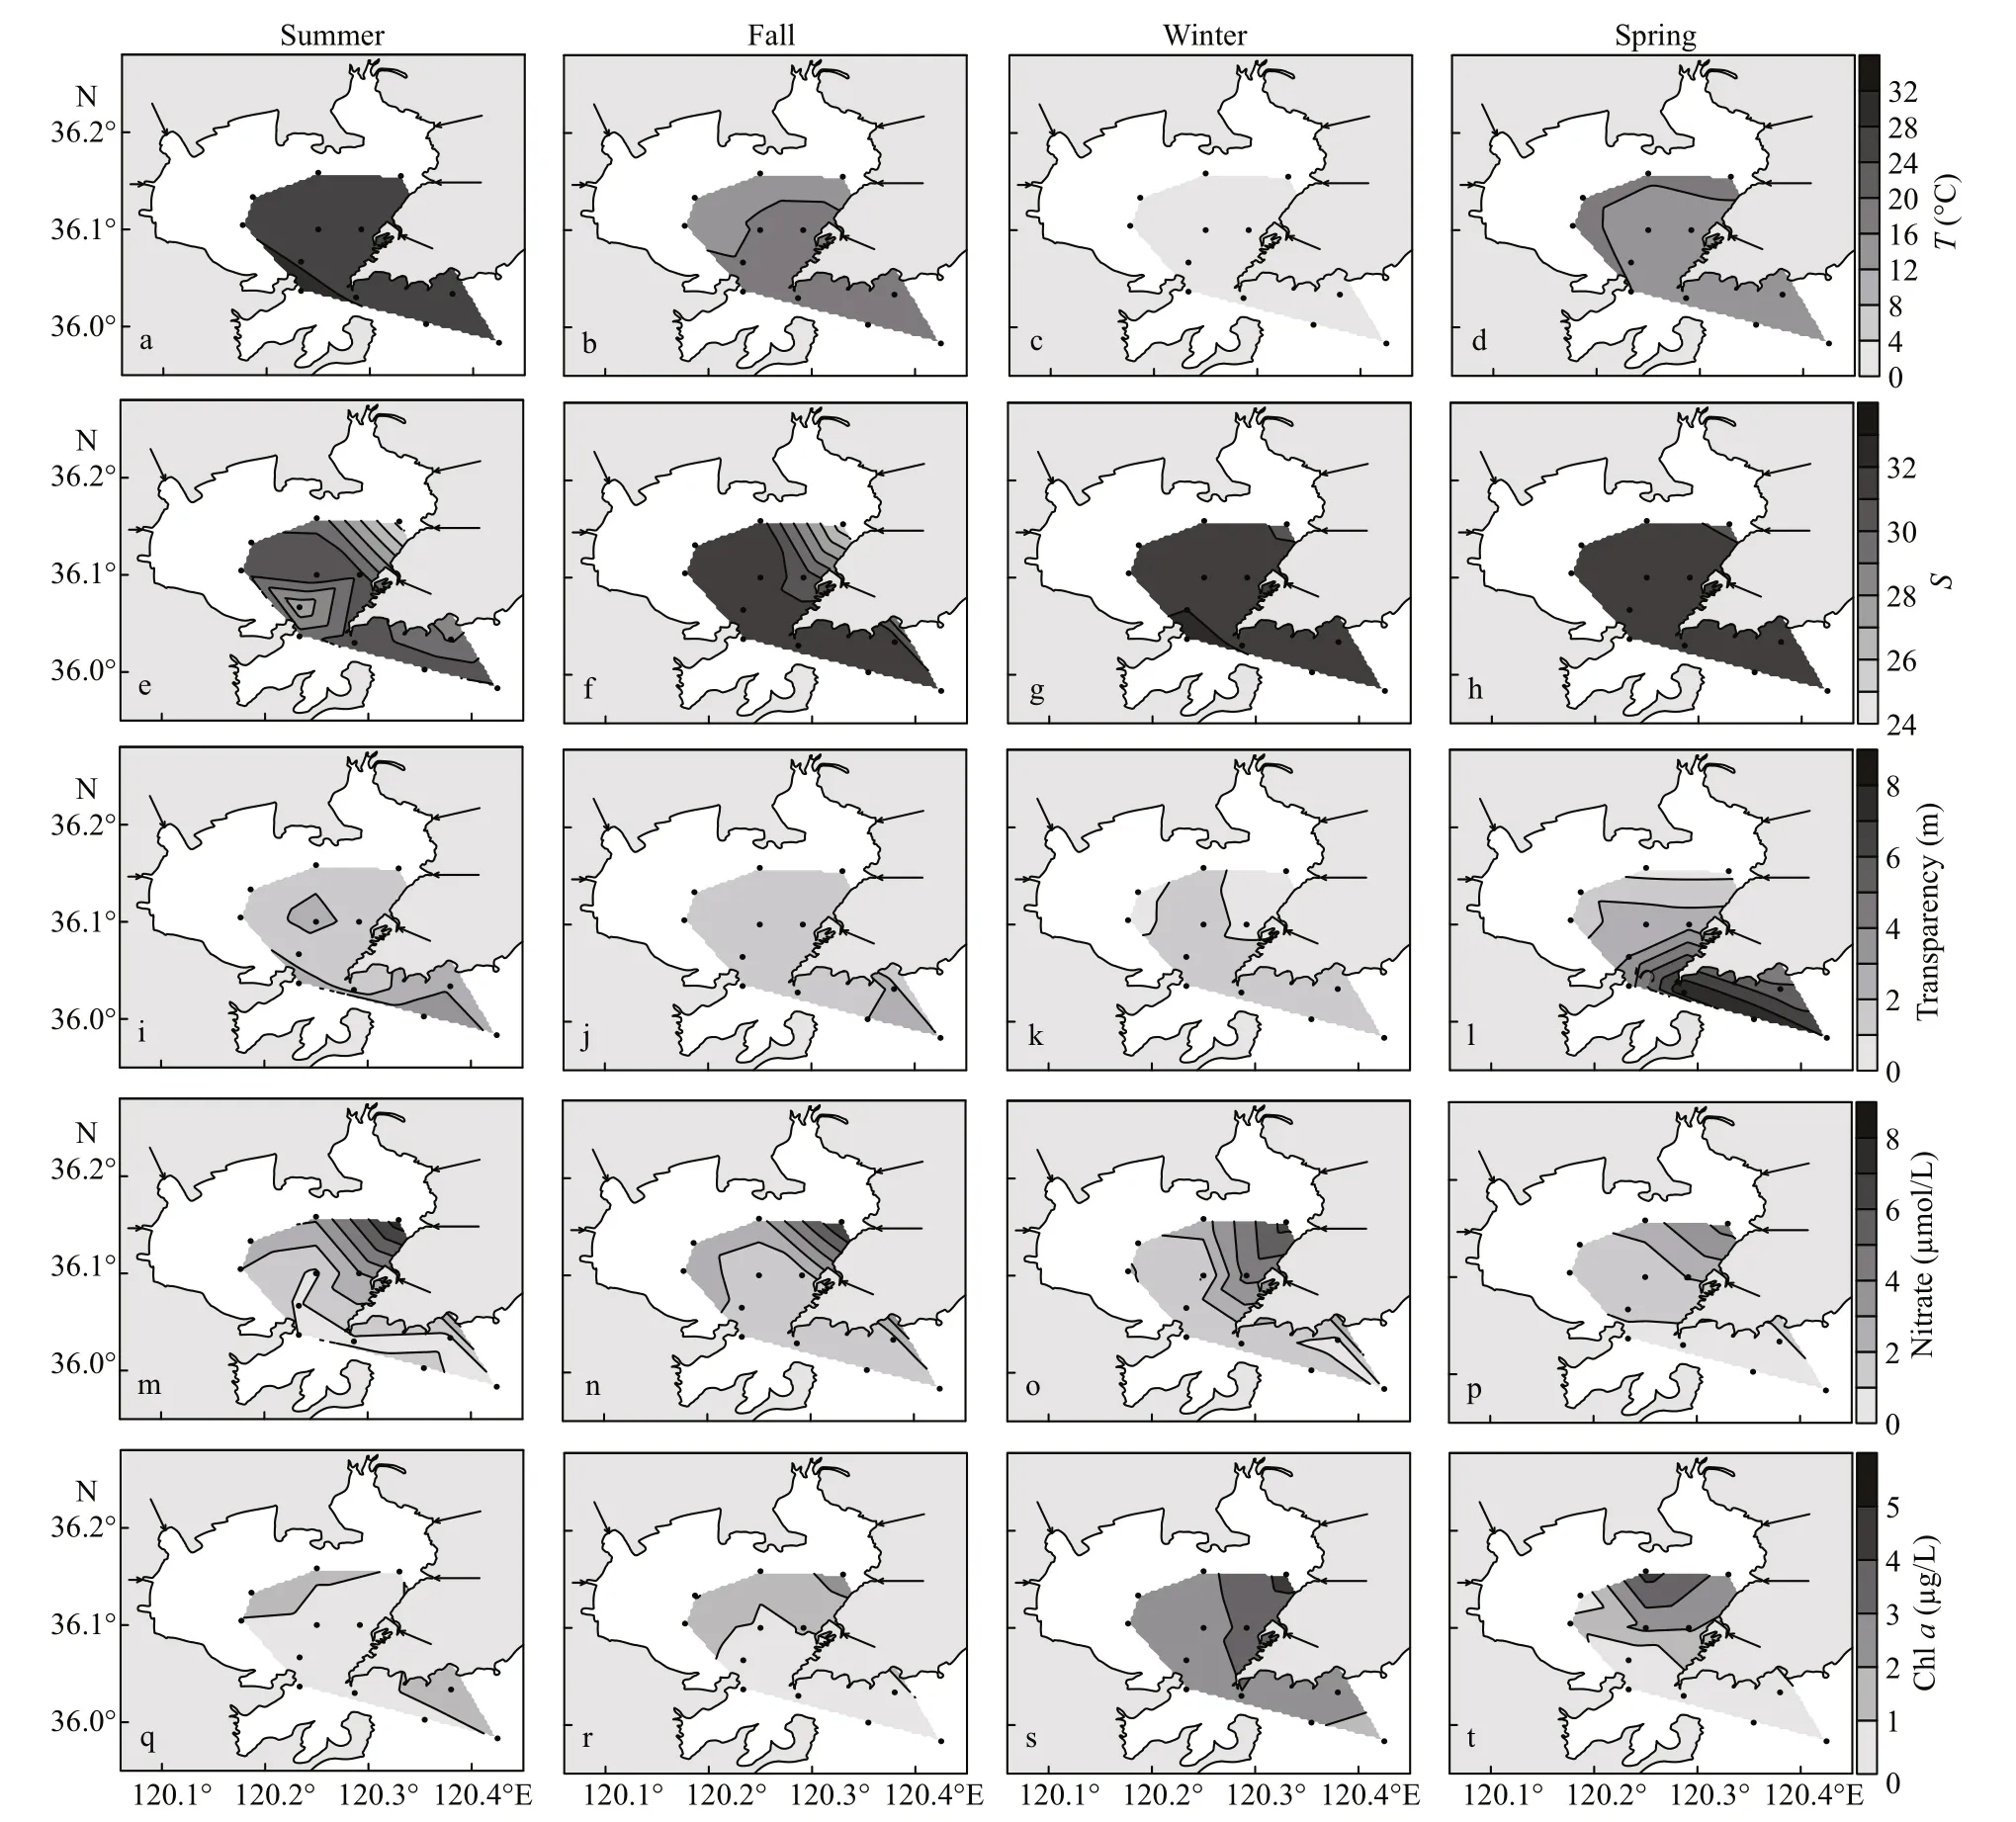
Fig.2 Distributions of surface temperature ( T, ℃) (a-d), salinity ( S) (e-h), transparency (m) (i-l), nitrate (μmol/L) (m-p),and Chl a (μg/L) (q-t) in the study area during four cruises
2.3 Data analysis
The dominance index (Y) of phytoplankton species is calculated based on Eq.3:

whereniis the sum of speciesicell abundance;Nis the sum of all species cell abundance values; andfiis the speciesioccurrence frequency in all the samples.
Pearson correlation analysis (PCA) was carried out between the phytoplankton carbon biomass and environmental parameters. Canonical correspondence analysis (CCA) was used to examine the relationships between the environmental variables and dominant species. Students’t-test was used to made statistical comparisons, andP<0.05 was considered to represent a statistically significant diff erence.
3 RESULT
3.1 Hydrographic conditions
Surface temperature, salinity, transparency, nitrate,and Chl-aconcentration in the bay during the four cruises are presented in Fig.2. High surface temperature value appeared in the outer bay during summer, fall, and winter (Fig.2a-c). In spring, high temperature value appeared in the northern part of the study area (Fig.2d). Of the stations, station A5 had the lowest surface salinity during all four cruises(Fig.2e-h). High values of transparency were alwaysobserved in the outer bay during the four cruises(Fig.2i-l). The nitrate concentration showed a similar distribution pattern with salinity, and it was higher in the inner bay than in the outer bay (t-test,P<0.05)(Fig.2m-p). The Chl-aconcentration varied from 0.05 to 4.43 μg/L in the study area, and its distribution pattern was consistent with that of nitrate, except in summer, when a high value appeared at station D7(Fig.2q-t). The means of the environmental parameters during each cruise are presented in Table 1. Temperature was highest in summer, followed by that in fall and spring, and it was lowest in winter.Salinity was lowest in summer, and the mean values were similar among the four cruises. The mean transparency was higher in summer and spring than in fall and winter. For the nutrients, the concentrations of SiO32ˉ, PO43ˉ, and NO3ˉ were highest in summer,followed by those in fall, and they were the lowest in winter and spring.
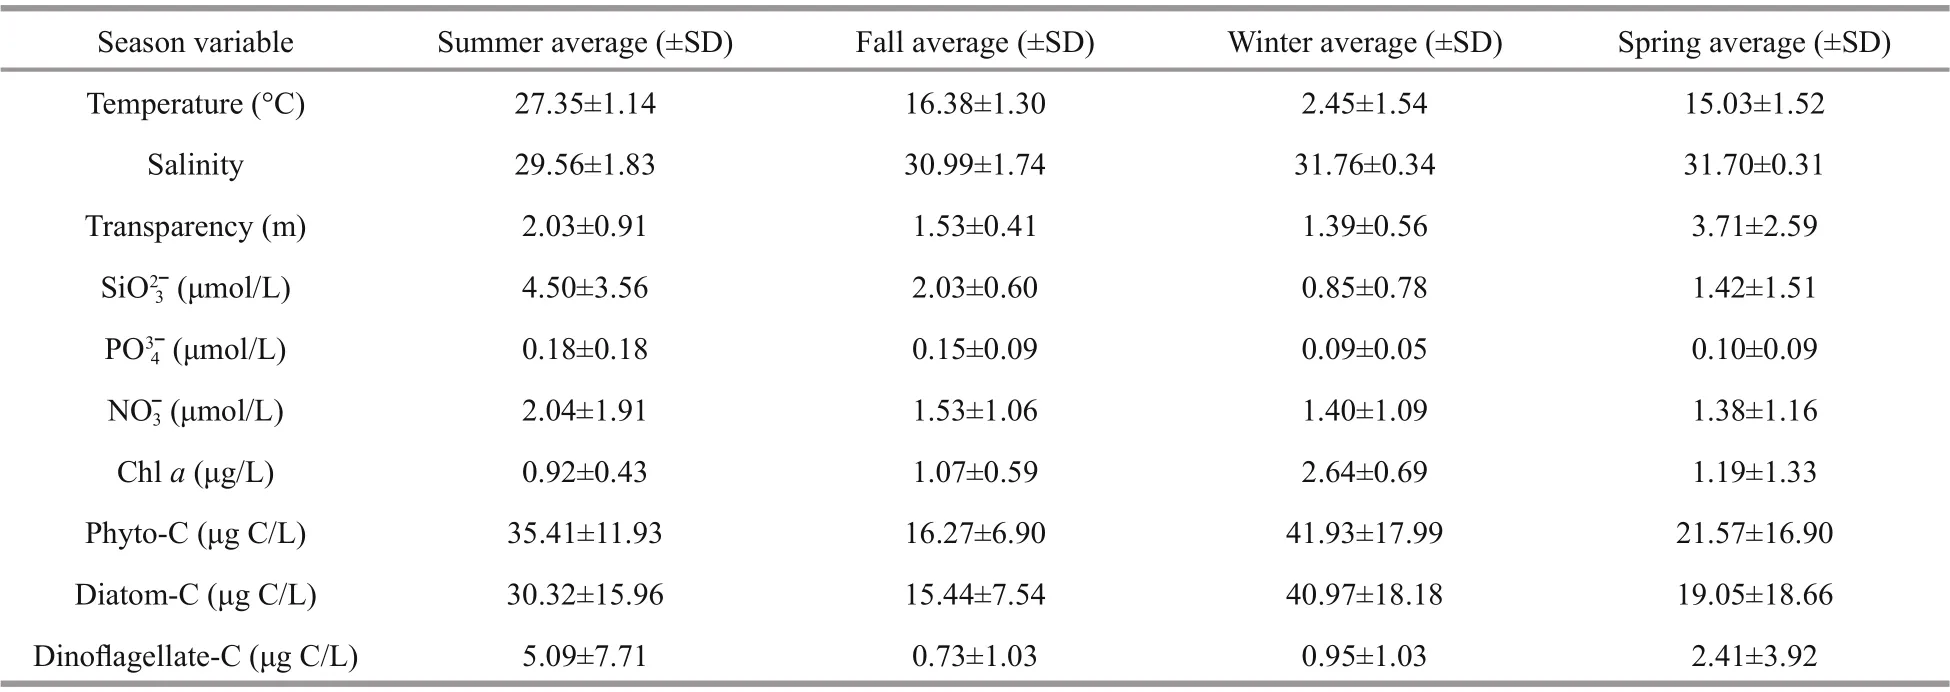
Table 1 Means of environmental parameters at each cruise in the Jiaozhou Bay
3.2 Carbon biomass of phytoplankton cells
Phyto-C in the study area ranged from 16.07 to 62.76 μg C/L (mean 35.41 μg C/L) in summer, 7.77 to 32.04 μg C/L (mean 16.27 μg C/L) in fall, 24.45 to 78.52 μg C/L (mean 41.93 μg C/L) in winter and 5.05 to 60.52 μg C/L (mean 21.57 μg C/L) in spring(Table 1). High values of phyto-C were always observed in the northern or northeastern bay(Fig.3a-d). Diatom carbon biomass (diatom-C) was predominant in the bay, at mean values of 83%, 91%,93%, and 76% of the total phyto-C during four cruises,respectively. The distribution pattern of diatom-C was similar to that of phyto-C. Dinoflagellate carbon biomass (dinoflagellate-C) was quite low, and the mean value was higher in spring (mean 19.05 μg C/L)and summer (mean 5.09 μg C/L) than in fall (mean 0.73 μg C/L) and winter (mean 0.95 μg C/L). The distribution pattern of dinoflagellate-C was diff erent from diatom-C, and high values always appeared in the southern part of the study area (Fig.3i-l).
Phyto-C/POC ranged from 22.89% to 56.65%(mean±SD=39.82%±10.34%) in summer, 21.99% to 32.19% (mean±SD=26.39%±3.23%) in fall, 25.33%to 62.89% (mean±SD=47.20%±10.68%) in winter and 17.47% to 66.36% (mean±SD=39.25%±15.42%)in spring. For the whole year, phyto-C/POC ranged from 17.47% to 66.36% (mean±SD=38.16%±13.17%)in the study area.
The relationships between phytoplankton carbon biomass and the environmental parameters in the bay are shown in Table 2. Phyto-C correlated significantly negatively with salinity during fall, winter, and spring.For the nutrients, phyto-C showed a significant positive correlation with SiO32ˉ, PO43ˉ, NO2ˉ, and NO3ˉ during fall, winter, and spring. No significant correlation was observed between phyto-C and nutrients during summer. The relationship between diatom-C and various environmental parameters was quite similar to that with phyto-C. Dinoflagellate-C correlated significantly positively with temperature in winter and significantly negatively with temperature in spring. No significant correlation was observed between dinoflagellate-C and any nutrient during all four cruises.
3.3 Dominant species and CCA analysis
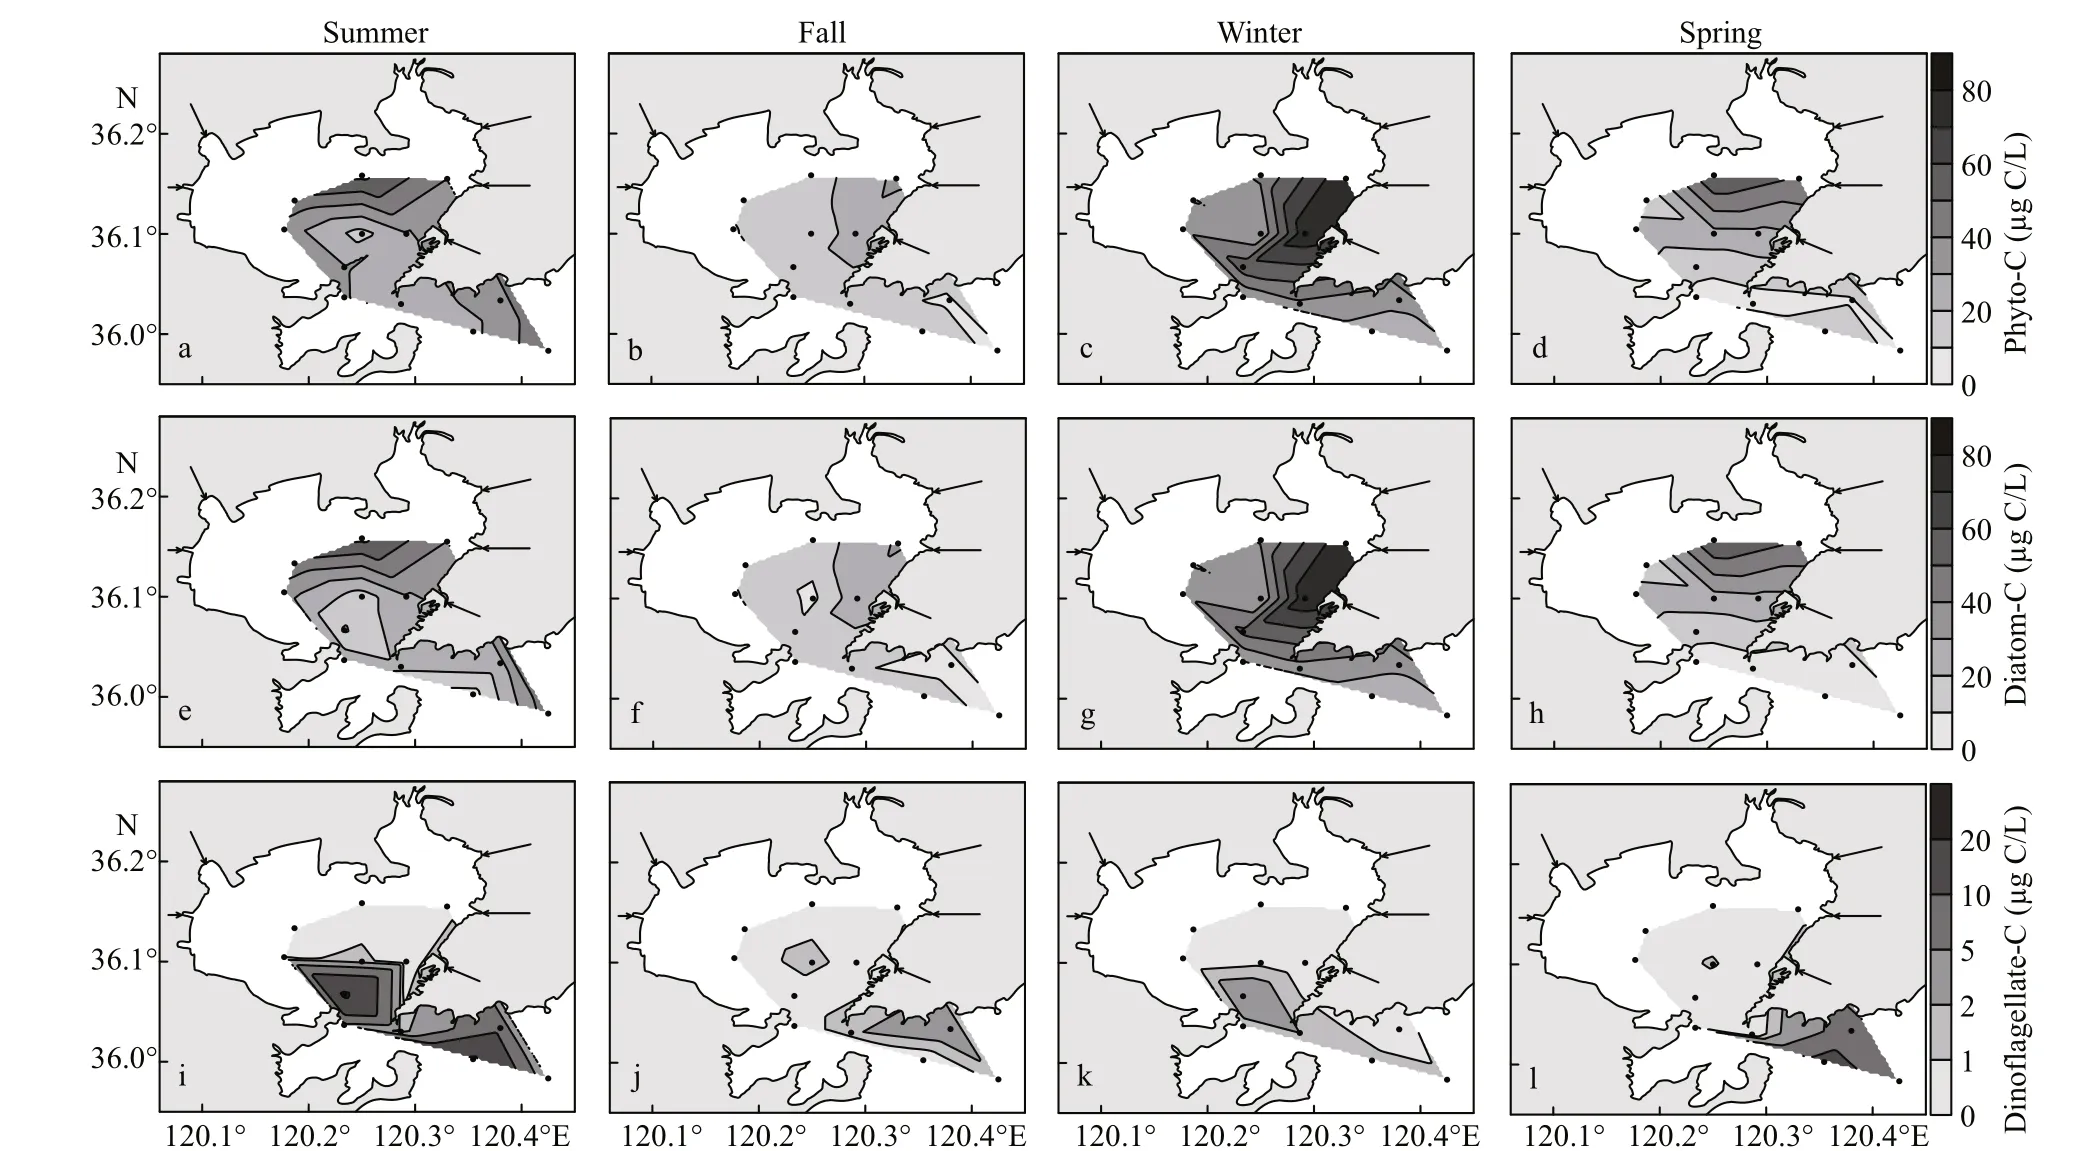
Fig.3 Distribution of phyto-C (a-d), diatom-C (e-h), and dinoflagellate-C (i-l) in the study area during four cruises
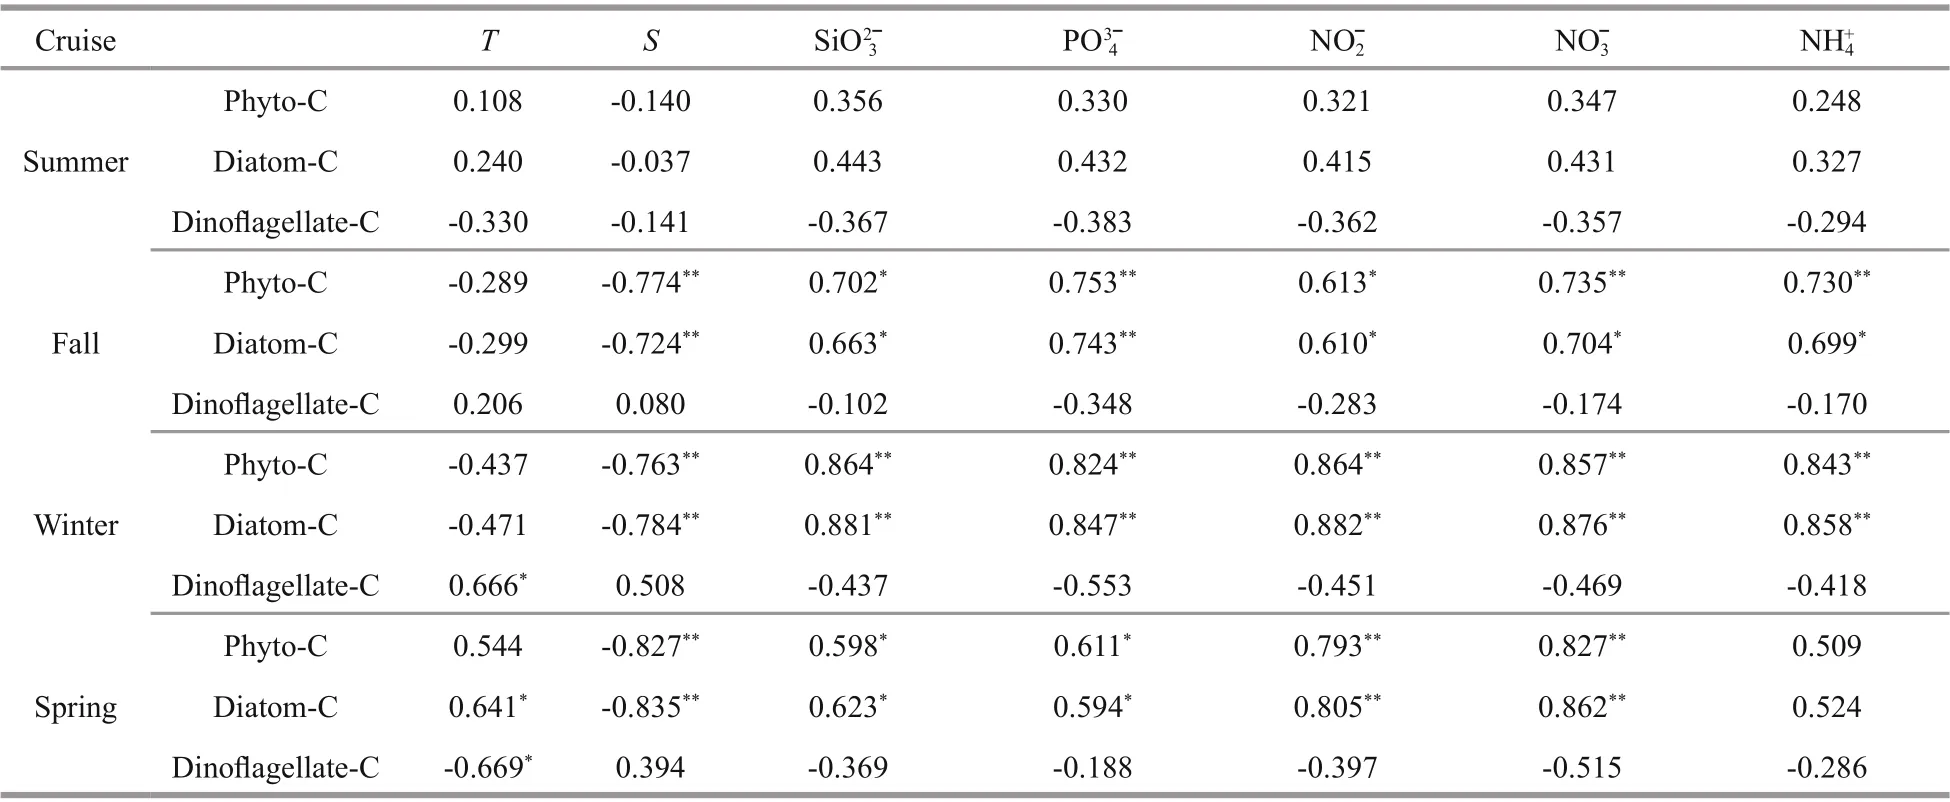
Table 2 Pearson correlation analysis ( R values) between the phyto-C (with the dominant group: diatom and dinoflagellate)(μg C/L) and environmental parameters during four cruises in Jiaozhou Bay
The dominant phytoplankton species and their cell volume and carbon are presented in Table 3. The dominant phytoplankton species in Jiaozhou Bay were mostly diatoms during the four cruises.ChaetoceroscurvisetusandSkeletonemasp. were dominant throughout the year. For dinoflagellates,onlyCeratiumfususin summer andGyrodiniumspiraleandScrippsiellatrochoideain spring were found to be dominant. The cell volume of the diff erent species varied greatly. The smallest dominant species wasSkeletonemasp., with cell volumes ranging 70-2 050 μm3(mean ~350 μm3). The largest dominant species wasRhizosoleniadelicatula, with cell volumes ranging 17 800-1 310 000 μm3(mean~164 000 μm3), which were approximately 400-500 fold that ofSkeletonemasp. For cell carbon,Rhizosoleniadelicatulacell carbon was about ~100 fold that ofSkeletonemasp. cell carbon.
The CCA biplots of the dominant species carbon biomass values and environmental parameters are presented in Fig.4. In summer,Chaetoceroscurvisetuscorrelated positively with nutrient concentrations(Fig.4a).Skeletonemasp. andChaetocerosdecipienscorrelated negatively with salinity.Ceratiumfususcorrelated positively with temperature. In fall,Skeletonemasp.,Thalassiosirapacifica, andEucampiazoodiacuscorrelated positively with nutrient concentrations, andParaliasulcatashowed no correlation with any environmental parameter(Fig.4b). In winter,Skeletonemasp. andThalassiosirapacificacorrelated positively with nutrient concentrations (Fig.4c).Ditylumsolcorrelated positively with temperature and salinity.MeunieramembranaceaandRhizosoleniadelicatulashowed no correlation with any environmental parameter. In spring,Thalassiosiraangstiicorrelated positively with nutrient concentrations, andGyrodiniumspiraleandScrippsiellatrochoideacorrelated positively with salinity (Fig.4d).ChaetoceroscurvisetusandSkeletonemasp. showed no correlation with any environmental parameter.
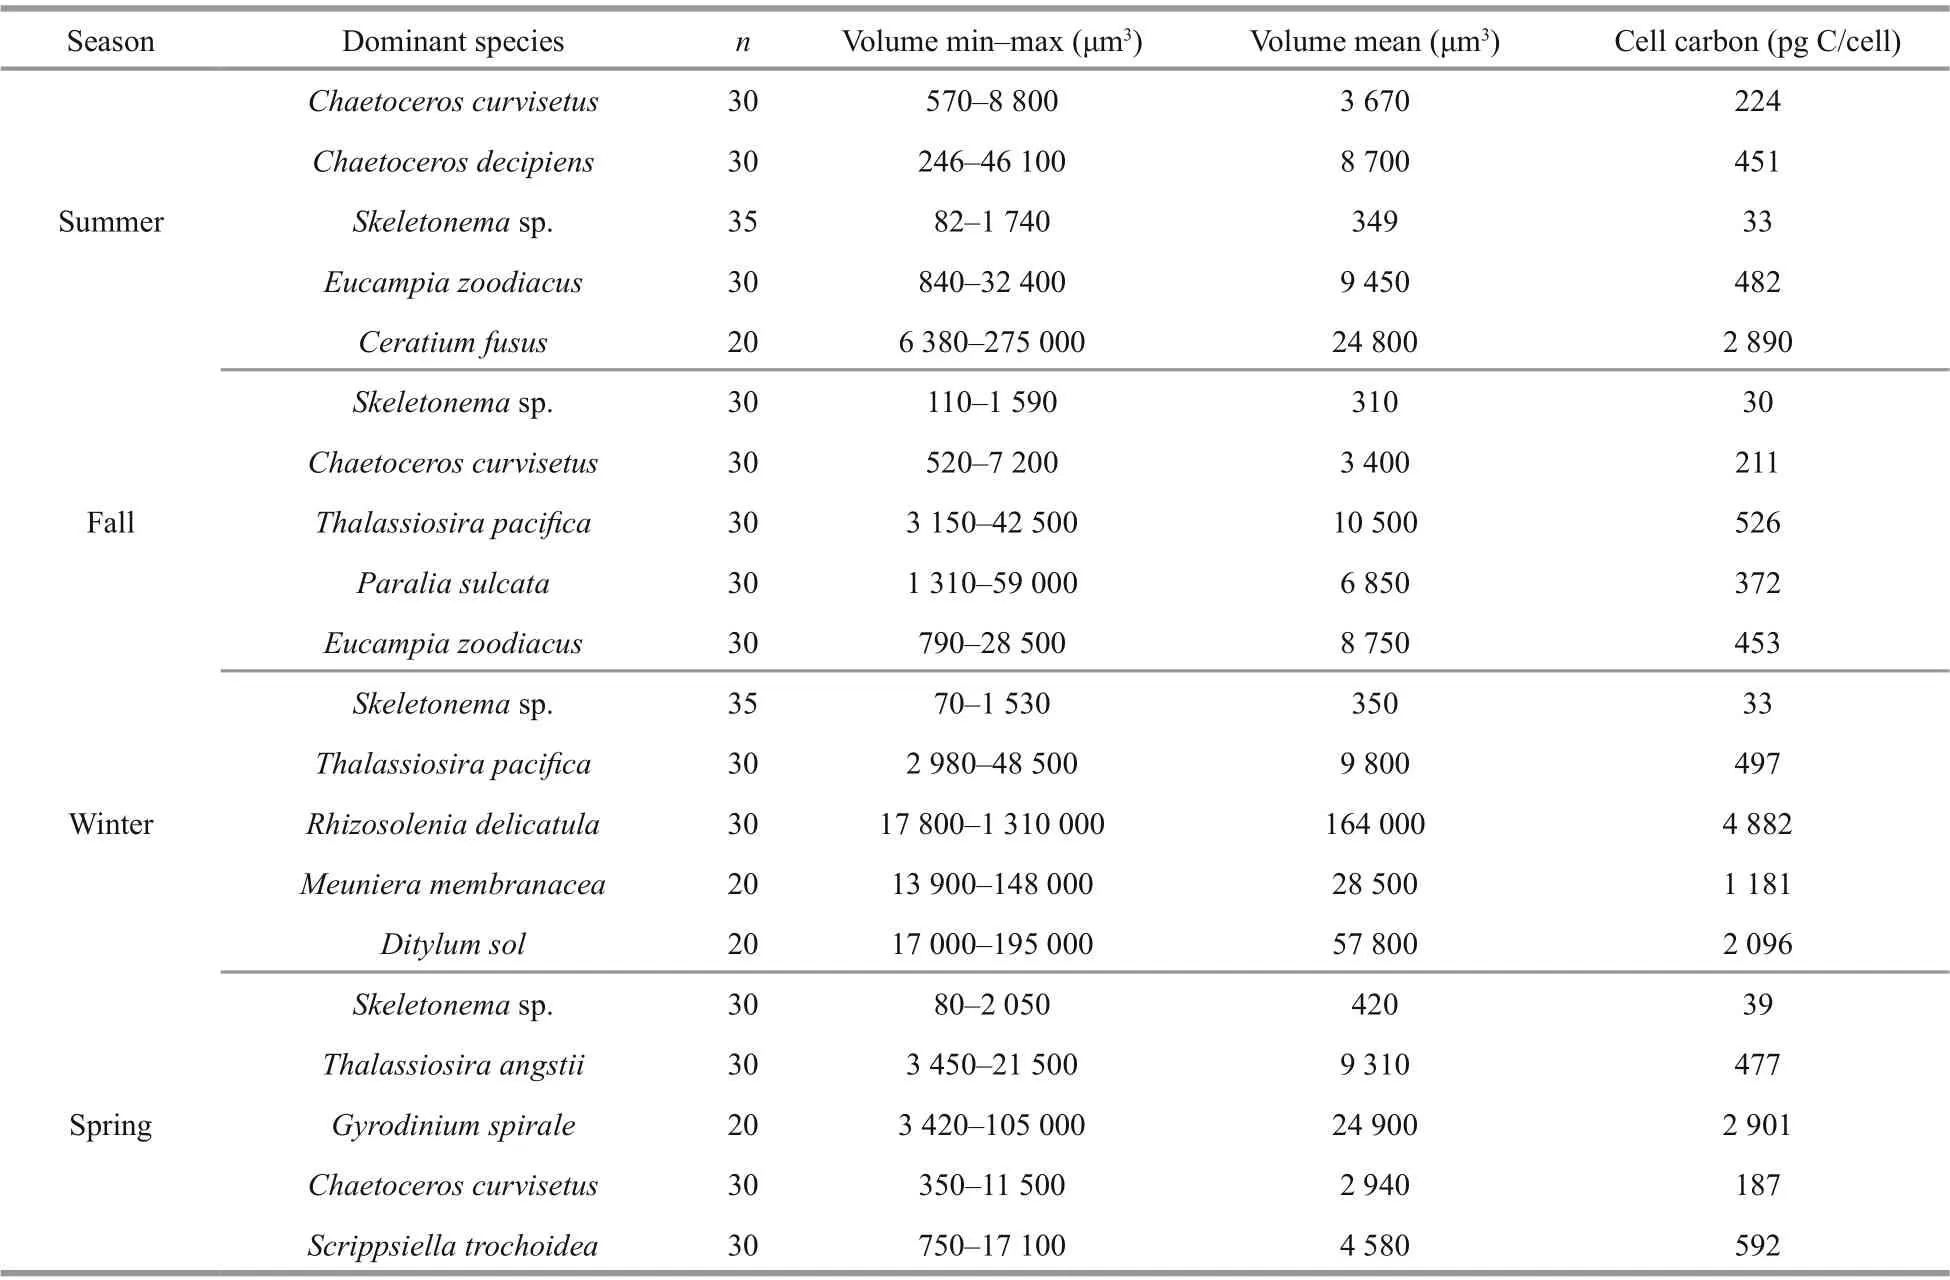
Table 3 Cell volume (min-max, and mean) and carbon per cell of top 5 dominant species during each cruise using the equations from Menden-Deuer and Lessard (2000)
3.4 C:Chl a and growth rates of the phytoplankton cells
The C:Chlaof the phytoplankton cells during the four cruises are shown in Fig.5. In summer, the C:Chlavalues varied from 22.84 to 52.90 (mean 38.87), and the highest value appeared at station D3,while the lowest value appeared at station A3. C:Chlaincreased from north to south in the study area(Fig.5a). In fall, the C:Chlavalues varied from 15.74 to 47.73 (mean 28.83), the highest value appeared at station D6, and the lowest value appeared at station C1. Generally, high C:Chlavalues appeared in the outer bay, except for station B2 (Fig.5b). In winter,the C:Chlavalues varied from 24.29 to 61.45 (mean 34.22), the highest value appeared at station D8, and the lowest value appeared at station D6 (Fig.5c). In spring, the C:Chlavalues varied from 11.50 to 43.97(mean 24.70), the highest value appeared at station D6, and the lowest value appeared at station A5. High C:Chlavalues appeared in the outer bay (Fig.5d).
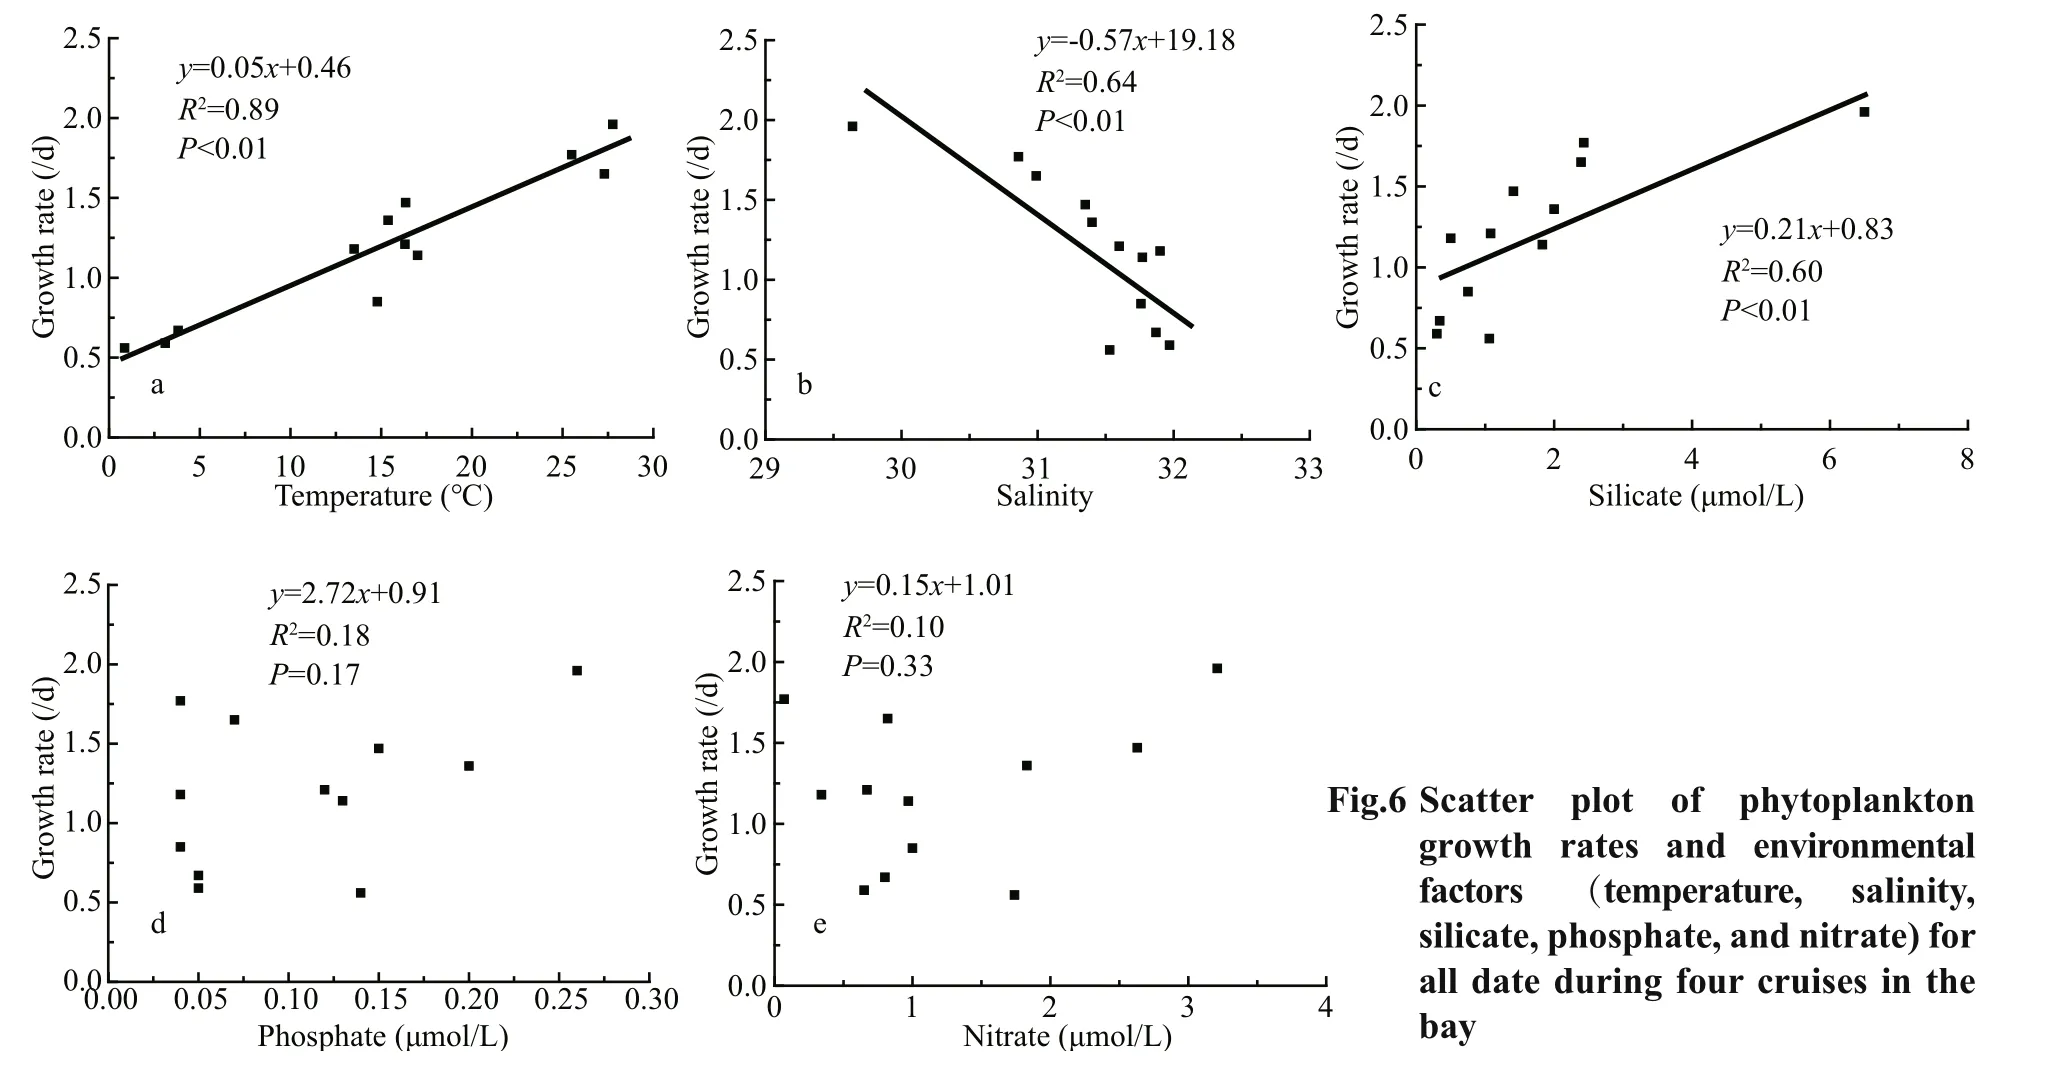
Phytoplankton growth rates in the bay ranged from 0.56 to 1.96/d; peaked in summer (mean±SD=1.79±0.13/d), and then in fall (mean±SD=1.24±0.09/d),spring (mean±SD=1.17±0.25/d), and winter (mean±SD=0.77±0.09/d) were the lowest. Phytoplankton growth rates were significantly positively correlated with temperature and negatively correlated with salinity (Fig.6a & b). Significant positive correlation was also observed between phytoplankton growth rates and silicate concentrations (Fig.6c).
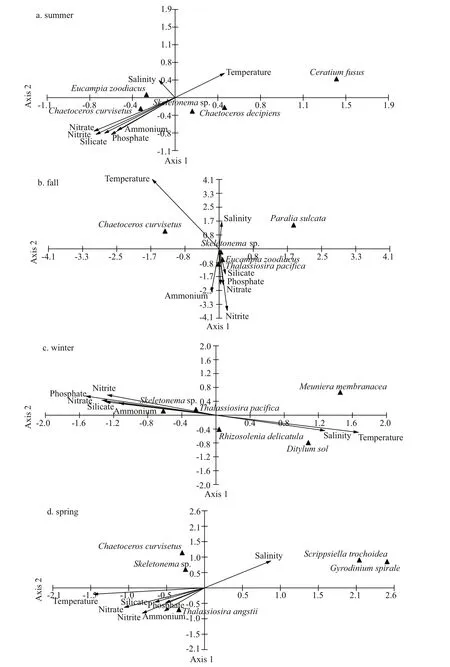
Fig.4 CCA of the dominant phytoplankton species and environmental parameters during four cruises in the bay
4 DISCUSSION
4.1 Phyto-C and its regulating factors in the Jiaozhou Bay
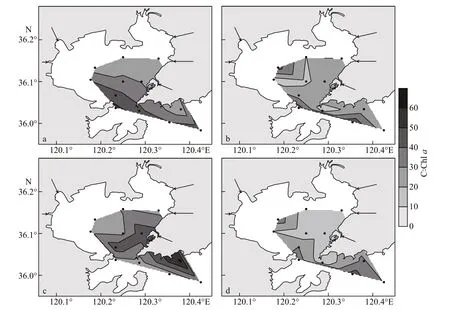
Fig.5 C:Chl a of phytoplankton cells during four cruises in the study area
Accurate determination of phyto-C in natural communities has long been recognized as essential to understanding marine ecosystems and their environmental dependencies (Graff et al., 2012).Several automated and semi-automated methods for phytoplankton cell biovolume estimation have been introduced in recent years, mainly including flow cytometry and combined systems (Jakobsen and Carstensen, 2011; Spaulding et al., 2012; Yang et al.,2017), and this might lead to their increased use in the future. Automated methods have been proved successful in experiments with unialgal cultures or with easily discernible species in the laboratory(Hillebrand et al., 1999). However, in addition to requiring expensive equipment, taxonomic resolution with flow cytometry does not allow the distinction of species that is often necessary for marine ecological studies, which would constrain their application in some situations. At present, light microscopy is still the most commonly used method for determining phytoplankton cell biovolumes with the highest degree of accuracy (taxonomically and geometrically)(Jakobsen and Markager, 2016; Crawford et al., 2018;Ara et al., 2019).

Table 4 Phyto-C in diff erent coastal seas around the world ocean
Phyto-C ranged from 5.05 to 78.52 μg C/L in Jiaozhou Bay, falling in the range reported in other coastal seas (Table 4). Comparing with other studies in coastal seas, the highest phyto-C value in this study seems somewhat low (Table 4). Chang et al. (2003b)studied phyto-C in the East China Sea, and found that phyto-C was 142.8 μg C/L in the coastal station, where a diatom bloom formed. In their study, the combined concentrations of nitrate and nitrite were >8 μmol/L at the coastal station, and Chl-aconcentration exceeded 7.9 μg/L. Shinada et al. (2008) studied phyto-C in coastal waters off Cape Esan, Japan, and found that phyto-C varied from <10 to >300 μg C/L. In their study, phyto-C was lower than 100 μg C/L during the most time of the year, and high phyto-C value (>100 μg C/L) only appeard during spring diatom blooms period.Ara et al. (2019) found that phyto-C varied from 0 to 316 μg C/L (mean=17.50 μg C/L) in the Sagami Bay,and the high phyto-C value was mainly attributed to spring phytoplankton blooms with Chlabeing as high as 14.25 μg/L. In this study, both nutrients and Chl-alevels (Table 1) indicated that none phytoplankton bloom occurred during the four cruises. If excluding the high phyto-C values during phytoplankton blooms period in studies of Chang et al. (2003b), Shinada et al.(2008) and Ara et al. (2019), the range of phyto-C in this study should be similar with those studies mentioned above.
Diatom-C was predominant during all four cruises,accounting for over 75% of the total phyto-C. This was consistent with the results of several other studies.Marañón et al. (2000) studied the distributions of phytoplankton biomass in the Atlantic Ocean, and found that diatoms were the dominant group, and dinoflagellates contributed less than 4% to total phyto-C. Chang et al. (2003b) found that in the coastal East China Sea, diatoms were the dominant group,and dinoflagellates contributed only 3.5% to total phyto-C. Chang et al. (2003a) studied the phytoplankton biomass in the Hauraki Gulf and adjacent shelf of northeastern New Zealand, and found that diatoms accounted for 70% to 95% of the total phyto-C. Previous studies on phytoplankton community structure based on cell counting in Jiaozhou Bay also revealed that diatoms dominated phytoplankton community structure throughout the year (Sun et al., 2011a; Guo et al., 2019).
As phytoplankton is an important component of biogeochemical cycling in the ocean, the contribution of phyto-C to total POC is an important input for biogeochemical models (Arteaga et al., 2016). In this study, phyto-C/POC ranged from 17.47% to 66.36%(mean±SD=38.16%±13.17%) in the bay. Arteaga et al. (2016) used models to study the contribution of phyto-C to the total POC pool in the global ocean and found that phytoplankton account for 30%-70% of the total POC in most of the low-latitude ocean(between 40°N and 40°S). Therefore, the mean phyto-C/POC in this study fell within the range of their model results. Pico-phytoplankton cells were not counted due to the diffi culty in observing them under the microscope in this study; therefore, the phyto-C/POC was likely underestimated here. Sun and Sun (2012) found that pico-phytoplankton accounted for less than 5% of the total Chlain Jiaozhou Bay, so its contribution to the POC pool should not be significant here. It should be noted that the conversion of cell volume to cell carbon also imposes a source of variation. The carbon-to-volume relationship derived by Menden-Deuer and Lessard(2000) was used to estimate phyto-C from phytoplankton cell biovolume in this study. Their analysis is based on laboratory cultures that may not naturally mirror phytoplankton assemblages.However, as we used the same conversion factor as that in Menden-Deuer and Lessard (2000) throughout the study, the spatiotemporal distribution pattern of phyto-C should not have been influenced.
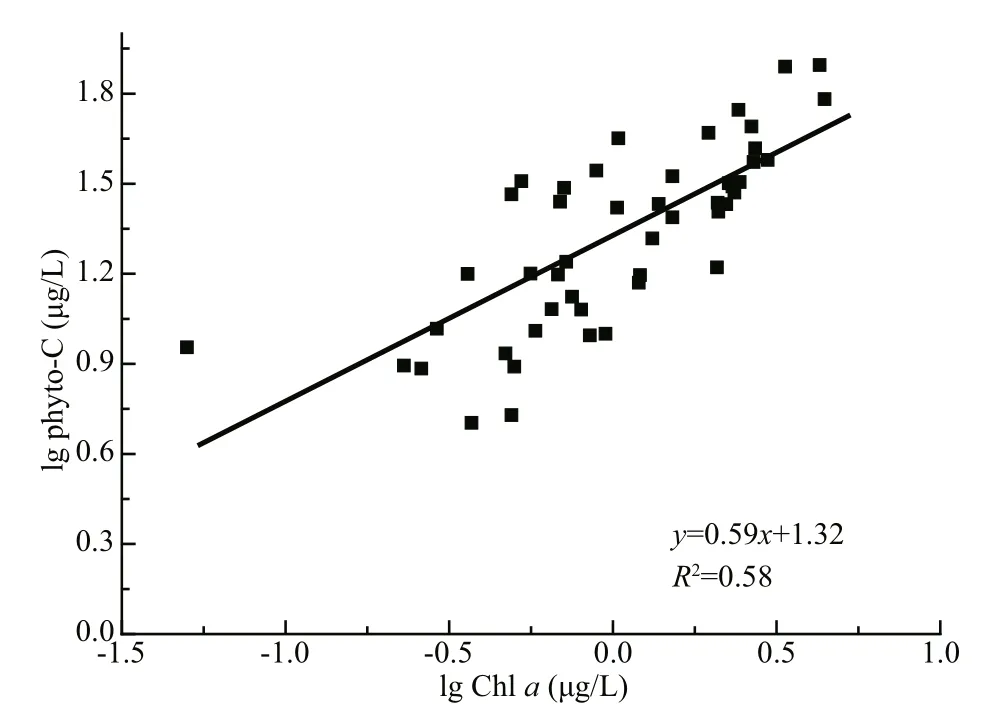
Fig.7 Lg-lg relationship between Chl a and phyto-C of all data points in the bay
In this study, phyto-C was always higher inside the bay than outside the bay (t-test,P<0.05) (Fig.3a-d)and showed a significant positive correlation with nutrients during fall, winter, and spring (Table 2).This was consistent with previous studies on the phytoplankton community in the bay (Yang et al.,2014; Shi et al., 2015; Guo et al., 2019). Diatom-C correlated significantly positively with nutrients,while no significant correlation was observed between dinoflagellate-C and any nutrient (Table 2).Dinoflagellate-C was high in the southern part of the study area, where nutrient levels were low, which was quite diff erent from diatom-C levels (Fig.3). Shi et al.(2015) studied the relationship between the phytoplankton community structure and environmental parameters in the bay and found similar results. This discrepancy was mostly due to the diff erent survival strategies of diatoms and dinoflagellates. As a totally autotrophic phytoplankton group, diatoms can easily become dominant when nutrients are suffi cient in the environment (Zhou et al., 2017). In this study, the distribution pattern of diatom-C was quite similar to that of nutrients (Figs.2& 3), and high diatom-C values always appeared in the nutrient-suffi cient areas (Fig.3e-h). CCA also revealed that diatom-dominant species tended to correlate positively with nutrients (Fig.4). However,diatoms are easily aff ected when nutrients are not suffi cient in the environment (Xiao et al., 2018). In contrast to diatoms, most dinoflagellates species are mixotrophic, which would provide them with suffi cient nutrients when nutrients concentrations were low in the environment (Jeong et al., 2010).Therefore, dinoflagellates possess a survival advantage over diatoms in low nutrient environments,and this advantage results in dinoflagellates having diff erent distribution patterns than diatoms.
4.2 C:Chl a values in Jiaozhou Bay and their regulating factors
In marine plankton ecology, Chl-aconcentration is one of the most frequently determined variables. Chlaestimates are usually determined in contexts where conversion to phytoplankton cellular carbon is desirable, e.g., for phytoplankton growth rate calculations or for food web process calculations(Arteaga et al., 2016). In these cases, a value for the ratio between phyto-C and Chlais necessary, and C:Chlais therefore a widely used conversion factor in aquatic studies (Jakobsen and Markager, 2016). As concentrations of pigments in phytoplankton are influenced by factors such as light and nutrients, a wide range of C:Chlavalues are reported in the literature across laboratory and field studies, from 6 to 333 (Geider, 1987; Cloern et al., 1995; Sathyendranath et al., 2009). C:Chlavalues of phytoplankton cells varied from 11.50 to 61.45 (mean 31.66) in this study,which was similar to those in other coastal seas(Chang et al., 2003b; Jakobsen and Markager, 2016;Ara et al., 2019), but lower than those in several oligotrophic open oceans (Wang et al., 2009; Li et al.,2010). Several studies have found a nonlinear relationship between phyto-C and Chlain the field(Legendre and Michaud, 1999; Sathyendranath et al.,2009; Jakobsen and Markager, 2016):

whereCis phyto-C, logAis the intercept andβis the slope of the regression. The phyto-C vs. Chlascatter plots of all data points in this study are shown in Fig.7. The slope (β) was 0.59, indicating that there is an overall decrease in the C:Chlavalue with increasing Chl-aconcentrations in Jiaozhou Bay.
In this study, high C:Chlavalues always appeared in the outer bay (Fig.5). This was similar to the distribution pattern of transparency (Fig.2i-l) but opposite to the distribution pattern of the nitrate concentration (Fig.2m-p). Transparency was higher in the outer bay than in the inner bay (t-test,P<0.05),while nitrate concentration was lower in the outer bay than in the inner bay (t-test,P<0.05). Therefore, the variability in C:Chlareveals that C:Chlatends to be high under high transparency and low nutrient conditions and low during low transparency and high nutrient conditions in the bay. The controlled laboratory studies found that phytoplankton cells increase their Chl-acontent under low light to maximize light absorption (Falkowski and Owens,1980), which would decrease the C:Chlavalues.Therefore, the light condition was better in the outer bay than in the inner bay due to the high transparency,leading to higher C:Chlavalues there. Nutrients can also aff ect C:Chlaof phytoplankton with increasing C:Chlavalues under nutrient limitation (Geider,1987). The process of carbon fixation in phytoplankton cells continues under a low nutrient environment,whereas the synthesis of nitrogen and cell division are restricted, causing carbon accumulation in phytoplankton cells in a low nutrient environment(Zonneveld, 1998). Furthermore, the high C:Chlavalues in the outer bay should also be related to the high dinoflagellate-C there (Fig.3i-l). It has been reported that in comparison to other phytoplankton groups, especially diatoms, dinoflagellates have higher C:Chl-avalues (Geider, 1987). Therefore,phytoplankton community structure should also have an impact on the spatial variation in C:Chlain the bay.
4.3 Phytoplankton growth rates and their regulating factors in the bay
Quantifying phytoplankton growth rates is important to understanding many marine processes in the ocean, and growth rates govern productivity,carbon transformations within the food web, nutrient utilization and export to depths (Regaudie-de-Gioux et al., 2015). Previous studies on phytoplankton growth rates in diff erent areas of oceans revealed that minimal growth rates ((0.1-0.2)/d) were found in oligotrophic seas, while maximal growth rates ((1.0-2.0)/d) were observed in coastal seas (Regaudie-de-Gioux et al., 2015). Tan (2009) estimated phytoplankton growth rates with the dilution method in Jiaozhou Bay and found that the values ranged from 0.38/d to 2.21/d. In this study, phytoplankton growth rates ranged from 0.56/d to 1.96/d, which were within the range of reported values. It should be noted that the primary productivity and Chlawere derived from total phytoplankton cells in the Eq.2,while phyto-C was derived from microscopic phytoplankton cells (not including picophytoplankton), therefore, phytoplankton growth rates in this study should be somewhat overestimated.
Phytoplankton growth rates were highest in summer (mean±SD=(1.79±0.13)/d), followed by those in fall (mean±SD=(1.24±0.09)/d) and spring(mean±SD=(1.17±0.25)/d), and the lowest occurred in winter (mean±SD=(0.77±0.09)/d) in the bay. A significant positive correlation was observed between growth rates and temperature in this study (Fig.6a).Several studies have reported the eff ect of temperature on phytoplankton growth rates in the sea (Boyd et al.,2013; Sherman et al., 2015), and the influence of temperature on growth rates exists due to the control temperature exerts on metabolic processes inside phytoplankton cells (Eppley, 1972). A commonly used function that describes the relationship between temperature and phytoplankton growth rate is theQ10model,

whereg0is a reference growth rate (/d) at the reference temperatureT0=303.15 K (30 °C) (Eppley, 1972;Sherman et al., 2015). In this study, the temperature was highest in summer and lowest in winter, and the diff erence in the mean temperature values was approximately 25 °C between these two seasons(Table 1). If assuming aQ10of 1.47 (Sherman et al.,2015), then a 25-°C temperature diff erence would lead to a 2.6-fold growth rate diff erence, which is consistent with the phytoplankton growth rates in summer (mean 1.79/d) and winter (mean 0.77/d) in this study.
In addition to temperature, phytoplankton growth rates were also found to be positively correlated with silicate concentrations (Fig.6c), which indicated that the silicate concentration in the bay should be the most important nutrient in determining phytoplankton growth. Most of the dominant phytoplankton species in the bay during the four cruises were diatoms (Table 3), and CCA revealed that diatom-dominant species tended to correlate positively with silicate concentrations (Fig.4). High silicate concentrations stimulate diatom growth, which induces high growth rates of the whole phytoplankton community. Several other studies also found a similar relationship between phytoplankton growth rates and nutrients.Örnólfsdóttir et al. (2004) found that natural phytoplankton communities showed a growth-rate increase response to enhanced nutrient concentrations in Galveston Bay. Stel’makh et al. (2009) found that phytoplankton growth rates and silicate and nitrate concentrations were correlated in the coastal waters of Bulgaria. Pinckney et al. (2001) measured the growth rates of phytoplankton in the Neuse River estuary with and without nutrient amendments and found that the growth rates were obviously higher when nutrients were added. In Jiaozhou Bay, several previous studies have also revealed that silicate concentrations could significantly aff ect phytoplankton growth (Yang et al., 2006; Yao et al.,2007). Therefore, phytoplankton growth was aff ected by silicate concentration in Jiaozhou Bay.
It should be noted that phytoplankton growth rates are dictated by the abiotic controls like temperatures,light, and nutrient concentrations (Cloern et al., 1995),and the combined eff ects of these factors determine phytoplankton growth rates ultimately. In this study,the results of Fig.6 should be considered with caution.High temperature was an important determining factor for the high phytoplankton growth rates in summer (Fig.6a). As nutrients concentrations were also highest in summer (Table 1), high nutrients levels should also be responsible for high phytoplankton growth rates in summer. A significant negative correlation was observed between phytoplankton growth rates and salinity (Fig.6b), but it did not suggest that high salinity would inhibit phytoplankton growth here. Judging from the salinity and nutrients distribution patterns in the bay (Fig.2), the negative correlation between phytoplankton growth rates and salinity was most probably an indirect outcome of the positive correlation between phytoplankton growth rates and nutrients.
5 CONCLUSION
We studied the carbon biomass and C:Chlaof phytoplankton based on water samples in Jiaozhou Bay, and phytoplankton growth rates were also estimated. Phyto-C ranged from 5.05 to 78.52 μg C/L in the bay, falling within the range reported in other coastal seas. Diatom-C was predominant, accounting for over 75% of the total phyto-C during all four cruises, and diatom-C showed a significant positive correlation with nutrients. No significant correlation was observed between dinoflagellate-C and any nutrient during the four cruises. This discrepancy is mostly due to the diff erent survival strategies of diatoms and dinoflagellates (autotrophic vs.mixotrophic). The C:Chlavalues of phytoplankton cells varied from 11.50 to 61.45 in this study, which were similar to the values in other coastal seas and lower than those in several oligotrophic open oceans.A significant log-log relationship was found between phyto-C and Chlain the bay: logC=0.59×log Chla+1.32, whereCis phyto-C, and this equation provides a reference for phytoplankton carbon calculations based on Chlain subsequent studies in the bay.Phytoplankton growth rates ranged from 0.56/d to 1.96/d, falling within the range of previously reported values in the bay. Temperature and silicate levels were found to have an impact on phytoplankton growth rates in the bay.
6 DATA AVAILABILITY STATEMENT
Data are available on request from the authors.
7 ACKNOWLEDGMENT
We thank the crew and captain of the R/VChuangxinfor the logistic support during the cruise.Temperature, salinity, and transparency data were provided by the Jiaozhou Bay Marine Ecosystem Research Station.
杂志排行
Journal of Oceanology and Limnology的其它文章
- Numerical study of the seasonal salinity budget of the upper ocean in the Bay of Bengal in 2014*
- Study on evaluation standard of uncertainty of design wave height calculation model*
- A fast, edge-preserving, distance-regularized model with bilateral filtering for oil spill segmentation of SAR images*
- A Gaussian process regression-based sea surface temperature interpolation algorithm*
- Climatology and seasonal variability of satellite-derived chlorophyll a around the Shandong Peninsula*
- Sources of sediment in tidal flats off Zhejiang coast, southeast China*
